SADC Statistical Yearbook 2015
|
|
|
- Sophia Moody
- 5 years ago
- Views:
Transcription
1

2 SADC Statistical Yearbook
3 PREFACE This is the fith edition of the annual publication of the SADC Statistical Yearbook intended to provide a selection of comparable and updated regional official statistics and indicators for SADC and its Member States. It aims to provide stakeholders with a comprehensive set of revised and updated critical statistical data and information on the socio-economic profiles and development of the region. This print version covers the period 2006 to Among other things, the SADC Statistical Yearbook is also expected to serve as a tool for the identification of major gaps in existing regional statistics and, thereby, provide input for the future Regional Statistical Development Programmes. In this regard, it will be used as a coordination framework for the harmonisation and validation of statistics in the SADC region to facilitate comparisons among the Member States. Furthermore, the SADC Statistical Yearbook will provide key stakeholders with convenient access to regular standardized and comprehensive accurate information on the socio-economic profiles of the SADC region. This should invariably contribute towards strengthening and steering informed policybased decision making, planning, monitoring and evaluation of efforts and measures geared towards the attainment of the set goals of the SADC regional economic cooperation and integration development agenda. labour market; living conditions and social protection; the economy and finance; international trade and services and industry. Others are agriculture, forestry and fisheries; transport; tourism; energy; water and information communication and technology and SADC Protocols and Declarations. Further, it also includes cross-cutting issues such as poverty; gender and environment The SADC Secretariat expects that the statistical information contained in this publication will be invaluable and useful to the various stakeholders and users including the SADC Secretariat, Member States institutions, private sector, civil society organizations, quasi-government, regional and international organisations and the public at large. Lastly, the SADC Secretariat is grateful for the continued cooperation and contribution of various key role players in the collaborative development and implementation of the SADC Statistical Yearbook by the Secretariat and National Statistical Offices and National Statistical Systems of respective Member States. In particular, the SADC Secretariat acknowledges guidance and technical oversight provided the SADC Statistics Committee for adherence to best practice, and the continued support from the European Union. The SADC Statistical Yearbook 2014 was finalised in two versions, namely; the web-based and print version providing time series and summaries of statistical data relating to SADC and its fifteen Member States on many subject matter areas including population; health; education and training; Stergomena Lawrence Tax, Dr Executive Secretary SADC Secretariat, Gaborone, Botswana December,
4 INTRODUCTION The SADC Statistical Yearbook was developed as one of the tools to improve statistical services at the Southern African Development Community (SADC) Secretariat. The general concept for the SADC Statistical Yearbook is to provide stakeholders with a comprehensive set of information on the socio-economic profiles and development of the SADC region and its Member States. Currently, SADC's fifteen Member States comprise the following: Angola, Botswana, Democratic Republic of Congo (DRC), Lesotho, Madagascar, Malawi, Mauritius, Mozambique, Namibia, Seychelles, South Africa, Swaziland, United Republic of Tanzania, Zambia, and Zimbabwe. The SADC Statistical Yearbook provides time-series and summaries of statistical information and data to stakeholders and other users pertaining to various aspects SADC and its Member States including population, society, government, economy, and cross cutting issues such as poverty, environment and gender. The socio-economic information from the SADC Statistical Yearbook can be used to discern the baseline situation and profiles of the SADC region and its Member States. To facilitate comparability of indicators across countries and the region and over time, the annual data from Member States, complemented by international data sources, were used. Given the diversity of SADC countries, the SADC Statistical Yearbook placed emphasis on indicators expressed as ratios, percentages, rates, or in per capita terms, with absolute numbers presented only to a limited extent. It is expected that the SADC Statistical Yearbook can provide stakeholders with convenient access to regular and comprehensive information on the socio-economic profiles and development of the region with the aim of enhancing understanding of the key development issues of SADC and its Member States. Moreover the SADC Statistical Yearbook can be used as tool to contribute towards steering information-based policy and decision making, planning, monitoring and evaluation for the region s economic cooperation and integration. In addition to the preface and acknowledgement sections, the SADC Statistical Yearbook comprises ten broad-based subject matter sections containing tables on various aspects of specific areas as follows: Section 1: Population and Migration Section 2: Social Services - Education, Health and Housing and Basic Services Section 3: Poverty and Income Distribution Section 4: Gender Equality Section 5: Labour and Employment Section 6: Macro-Economy - National Accounts, Balance of Payments, Merchandise Trade, Trade in Services, Financing and External Debt, Government Accounts, Money and Banking and Prices Section 7: Foreign Direct Investment Section 8: Statistics on Major Industrial Groups - Transport, Information Communication and Technology, Tourism, Agriculture, Food Security, Forestry, Mining and Quarrying, Energy and Water Section 9: Environmental and Sustainable Development Section 10: SADC Protocols and Declarations A glossary and technical notes and sources of the indicators contained in the Statistical Yearbook have been compiled and presented in a separate publication: SADC Statistical Yearbook 2015 Technical Notes and Sources and contains internationally recognised concepts and definitions together with data sources for the indicators. The production of the SADC Statistical Yearbook was undertaken with the full involvement of SADC Member States through the guidance and activities of the SADC Statistics Committee (SSC). The SSC comprises Heads of National Statistical Offices of respective Member States as bona fide members of the Committee. During its meeting held in June 2016 ingaborone, Botswana, the SSC urged Member States to ensure to nominate two representative focal persons, one with expertise in economic statistics and the other in population and social statistics, to liaise with the SADC Secretariat in the compilation of the SADC Statistical Yearbook. In addition, a workshop to validate and harmonise the data was held for Member States in Johannesburg, South Africa in October 2016 with key specific objectives which included the following:. To validate and harmonise data as compiled for zero draft of the SADC Statistical Yearbook experience. To identify data gaps and common challenges experience by Member States. To seek for common solutions and approaches for improving future editions of the Statistical Yearbook The SADC Secretariat greatly appreciates the support and cooperation received from National Statistical Offices in coordinating the collection of the required official statistics and indicators for this exercise from the institutions and agencies within the National Statistics Systems (NSSs). Comments and suggestions for improving future editions of the SADC Statistical Yearbook are most welcome and more details on the SADC Statistical Yearbook can be obtained by directing inquiries to the Statistics Unit, Directorate of Policy, Planning and Resource Mobilisation, SADC Secretariat, Plot CBD Square, P/Bag 0095 Gaborone, Botswana; Tel: ; Fax: / ; registry@sadc.int; web: Tracy Zinanga, Ms Acting Director: Policy, Planning and Resource Mobilisation (PPRM) 4
5 ACKNOWLEDGEMENT Preparation of the SADC Statistical Yearbook 2014 was undertaken by the SADC Secretariat Statistics Unit in collaboration with National Statistical Offices (NSOs) as focal points for the National Statistical Systems (NSSs) of the respective Member States. The SADC Secretariat core team responsible for compilation and editing of the SADC Statistical Yearbook was led by Ackim Jere, Senior Officer Statistics and included Cyril Parirenyatwa, Programme Officer Social Statistics and Deepchandsingh Jagai, Programme Officer Economic Statistics. The Statistical Yearbook was prepared under the general guidance of Dr Angelo Mondlane, Director for Policy Planning and Resource Mobilisation. The participation of SADC Secretariat Directorates in the needs assessment for the identification of priority statistical areas provided the basis for the design, structure, and content of the SADC Statistical Yearbook. The significant role played by the SADC Statistics Committee through overseeing and providing strategic guidance and policy direction to the process of developing the SADC Statistics Yearbook cannot be overemphasized. In line with the agreement of the SADC Statistics Committee, the primary data source for the SADC Statistical Yearbook has been the National Statistical Systems (NSSs)of respective SADC Member States and complemented by regional and international data sources. National Statistical Offices of the respective SADC Member States designated focal persons and participants to the Statistical Yearbook and Validation Workshop who were actively involved especially in the collection and submission of validated data for their respective countries to SADC Secretariat. These included the following: Angola - Dr Agostinho Sardinha and MrsTeresa Isaac Spinola Botswana - Mrs Ruth Kemmone Mothibi and Ms Grace Mphetolang Democratic Republic of Congo - Mr Cyprien Ewomo Ntotele and Mr Jupiter Kakimosiko Nasenge Matadi Lesotho - Mrs Matlhoeko Justina Matjotjela Thaisi and Ms Relebohile Bulane Madagascar - Mr. Dera Andriambololona, Mr. Niry Liva Randriamhaja, Mr Randrianjanaka Ravelomanana and Mr Eric Jean Michel Rakotomanana Malawi - Mr Blazio Mark Haleke, Mr Luther Happy Simbowe and Mrs. Tereza Lipinga Mtuwa Mauritius - Mrs. Dhanwantee Ramphul, Mr Chettun Kumar Arianaick and Mr. Anand Ramasamy Mozambique - Ms Felicidade António Pires and Ms Dionisia Godiva Jonia Khossa Namibia - Mr Joseph Minnaar, Mr Sapalov T. Quita and Mr. Aloysius Tsheehama Seychelles - Mr. Aubrey Fock-Tave and Mr. Burny Payet South Africa -Dr Arulsivanathan Naidoo, Ms Phakedi Gaongalelwe Seo and Ms. Ngwakana Norah Maake Swaziland - Mr Hanson Siboniso Dlamini, Mr Lukhele Gcina Makhosonkhe and Ms. Tsembayena Phakathi United Republic of Tanzania - Mr Seif Ahmad Kuchengo and Mr Daniel William Masolwa Zambia - Mr Alick Gelson Banda and Mr. Anthony SILUNGWE Zimbabwe - Mr Clever Chingwara and Mr Handrick Chigiji The SADC Secretariat is also grateful to the other (sub-) regional and international organisations that compile and produce statistics in their own spheres of work which have been used as data sources in cases where data were not available from NSSs. Notable among these organisations include the United Nations Statistics Division (UNSD), United Nations Economic Commission for Africa (UNECA), African Development Bank (AfDB), World Bank, International Monetary Fund (IMF), Food and Agriculture Organization (FAO); International Labour Organization (ILO); International Energy Agency (IEA); International Telecommunication Union (ITU); United Nations Children Fund (UNICEF); United Nations Educational, Scientific and Cultural Organization (UNESCO); World Health Organization (WHO). Finally, special thanks go to the European Union for providing the bulk of the necessary resources, both technical and financial, that enabled the compilation of the SADC Statistics Yearbook, conduct of Validation Workshop and printing of the publication 5
6 Symbols, Abbreviations and Acronyms Symbols and Abbreviations The following symbols and abbreviations are used in the Yearbook tables: Symbols Description Symbols Description 0 Magnitude zero or the figure is not large enough to be g gramme measured with the smallest unit in the table. # Major break in the series. Ha Hectare % Percent kcal kilocalorie * Value is provisional or an estimate and is therefore likely to mio million change.. A point (.) is used to indicate decimals. n.a. Not available... Not applicable n.e.s. The abbreviation n.e.s. indicates that the item in question is not elsewhere specified or included. 000 Thousand Space A space separates thousands 1 cubic kilometer 1e+9 cubic meter = cubic meter Total The totals given in the tables correspond to the sum of the individual 1 sq. km 100 Ha values shown in each table, unless otherwise stated. Individual figures and percentages in tables may not add up to the corresponding total, because of rounding. Blank No response from Member State Yrs. Years Cont d Continued Abbreviations and Acronyms AfDB African Development Bank NSO National Statistical Office AIDS Acquired Immunodeficiency Syndrome NSS National Statistical System AUC African Union Commission OECD Organization for Economic Co-operation and Development CCBG SADC Committee of Central Bank Governors PPP Purchasing Power Parity CIF Cost, Insurance, and Freight PPRM SADC Directorate of Policy, Planning and Resource Mobilization COMTRADE United Nations Commodity Trade Statistics Database PRSP Poverty Reduction Strategy Paper CPI Consumer Price Index REC Regional Economic Community ECA United Nations Economic Commission for Africa RETOSA Regional Tourism Organization of Southern Africa EDGAR United Nations Environment Programme, Emission Database RISDP Regional Indicative Strategic Development Plan for Global Atmospheric Research RSDS Regional Strategy for Development of Statistics EMIS Education Management Information System SADC Southern Africa Development Community EAC East African Community SDR Special Drawing Rights EU European Union SHaSA Strategy for the Harmonization of Statistics in Africa FAO United Nations Food and Agriculture Organization SIPO Strategic Indicative Plan for the Organ FANR SADC Directorate of Food Agriculture and Natural Resources SNA System of National Accounts FDI Foreign Direct Investment SHD&SP SADC Directorate of Social and Human Development and Special FTA Free Trade Agreement Programmes GDDS General Data Dissemination System SSC SADC Statistics Committee GDP Gross Domestic Product SRSS SADC Regional Statistical System HCPI Harmonized Consumer Price Indices TIFI SADC Directorate of Trade, Industry, Finance and Investment ICT Information and Communication Technology UNAIDS Joint United Nations Programme on HIV/AIDS IEA International Energy Agency UNSD United Nations Statistics Division ILO International Labour Organization UNESCO United Nations Educational, Scientific and Cultural Organization IMF International Monetary Fund UNCTAD United Nations Conference on Trade and Development I&S SADC Directorate of Infrastructure and Services UNWTO World Tourism Organization ITU International Telecommunication Union WHO World Health Orgnisation IUCN International Union for Conservation of Nature WB World Bank MDGs Millennium Development Goals WTO World Trade Organization NSDS National Strategy for the Development of Statistics 6
7 TABLE OF CONTENTS Page PREFACE 3 INTRODUCTION 4 ACKNOWLEDGEMENT 5 SYMBOLS, ABBREVIATIONS AND ACRONYMS 6 1. POPULATION AND MIGRATION POPULATION Total Mid Year Population in SADC, Thousand Person, Population Growth Rate in SADC, (%), Total Area (Sq. Km) and Population Density (Person Per Sq. Km) in SADC, Population in SADC by Sex and Age Group, (%), Dependency Ratio in SADC, (%), Population in Private Households in SADC By Size of Household, Person Per Household, Latest Year Population in Urban and Rural Areas of SADC, (%), Birth Rate in SADC By Year, Per Thousand Inhabitants, Death Rate in SADC By Year, Per Thousand Inhabitants, Total Fertility Rate in SADC By Year, Number of Children Per Woman, Life Expectancy at Birth in SADC By Year and Sex, , Selected Years Projected Total Mid-Year Population in SADC By Five-Year Period, Thousand Persons, MIGRANT REMITTANCES Migrant Remittances Inflows in SADC, Million US $, Migrant Remittances Outflows in SADC, Million US $, SOCIAL SERVICES EDUCATION Adult Literacy Rate in SADC By Sex, (%), Net Enrolment Ratio in Primary School in SADC By Sex, (%), Net Enrolment Ratio in Secondary School in SADC By Sex, (%), Ratio of Girls/Females to Boys/Males in Primary, Secondary and Tertiary School in SADC, Pupil-Teacher Ratio in Primary and Secondary School in SADC, Number of Pupils Per Teacher, , Selected Years Higher Education Enrolment in SADC by Key Fields of Study and By Sex (Full-time equivalents), Number, Graduates in Tertiary Education in SADC by Broad Field of Education and By Sex, Number,
8 TABLE OF CONTENTS (CONTD.) Page 2.2 HEALTH Infant Mortality Rate in SADC By Year and Sex, Per Thousand Live Births, Under-Five Mortality Rate in SADC By Year and Sex, Per Thousand Live Births, Maternal Mortality Ratio in SADC, Per Hundred Thousand Live Births, Percentage of Children in SADC Immunized for BCG, (% of One-Year-Old Children), Percentage of Children in SADC Immunized for DPT, (% of Children Ages Months), Percentage of Children in SADC Immunized for HepB3, (% of One-Year-Old Children), Percentage of Children in SADC Immunized for Measles, (% of Children Ages Months), Percentage of Children in SADC Immunized for Pol3, (% of One-Year-Old Children), Prevalence of Tuberculosis in SADC, Per Hundred Thousand Persons, Incidence of Tuberculosis in SADC, (Per Hundred Thousand Persons), AIDS Deaths in SADC, Number, Prevalence Rate of HIV in SADC by Sex, (% of Population Age Years), Prevalence Rate of HIV in SADC By Sex, (% of Population Age Years), HOUSING AND BASIC SERVICES Population in SADC With Access to Safe Drinking Water By Urban and Rural Areas, (%), Population in SADC With Access to Improved Sanitation By Urban and Rural Areas, (%), POVERTY AND INCOME DISTRIBUTION Human Development Index and Its Components in SADC, Human Development Index (HDI) Trends in SADC, Value, Inequality-Adjusted Human Development Index in SADC, Multidimensional Poverty Index in SADC and Changes Over Time, Population in SADC Below National Poverty Line By Urban and Rural Areas, (%), Population in SADC Below $1.00, $1.25 or $2.00 (PPP) Per Day (Poverty Gap), (%), Inequality (Gini Coefficient) in SADC, (%), Population in SADC by Income Share, (%), GENDER EQUALITY Ratio of Girls/Females to Boys/Males in Primary, Secondary and Tertiary School in SADC, Employment in SADC by Sector and Sex, (%), , Selected Years Women in National Parliament in SADC, Number, Latest Year Number of Seats in National Parliament in SADC by Sex, Proportion of Women in SADC in Ministerial Level Positions, (%), Gender Inequality Index in SADC, , Selected Years Gender-Related Development Index (GDI),
9 TABLE OF CONTENTS (CONTD.) Page 5. LABOUR AND EMPLOYMENT Number of Persons in Labour Force and Unemployed in SADC, Thousand, Labour Force Participation Rate in SADC By Sex, % of Female or Male Population of Age Years, Unemployment Rate in SADC for Persons of Age 15 Years And Above By Sex, (%), Unemployment Rate in SADC for Persons of Age Years Old By Sex, (%), MACROECONOMY NATIONAL ACCOUNTS GDP BY ECONOMIC ACTIVITY IN US$, BY SADC MEMBER STATE GDP by kind of economic activity at current prices, Angola, Million US $, GDP by kind of economic activity at current prices, Botswana, Million US $, GDP by kind of economic activity at current prices, Democratic Republic of Congo, Million US $, GDP by kind of economic activity at current prices, Lesotho, Million US $, GDP by kind of economic activity at current prices, Madagascar, Million US $, GDP by kind of economic activity at current prices, Malawi, Million US $, GDP by kind of economic activity at current prices, Mauritius, Million US $, GDP by kind of economic activity at current prices, Mozambique, Million US $, GDP by kind of economic activity at current prices, Namibia, Million US $, GDP by kind of economic activity at current prices, Seychelles, Million US $, GDP by kind of economic activity at current prices, South Africa, Million US $, GDP by kind of economic activity at current prices, Swaziland, Million US $, GDP by kind of economic activity at current prices, United Republic of Tanzania, Million US $, GDP by kind of economic activity at current prices, Zambia, Million US $, GDP by kind of economic activity at current prices, Zimbabwe, Million US $, GDP BY EXPENDITURE IN US$ BY SADC MEMBER STATE GDP by Expenditure at current prices, Angola, Million US $, GDP by Expenditure at current prices, Botswana, Million US $, GDP by Expenditure at current prices, Democratic Republic of Congo, Million US $, GDP by Expenditure at current prices, Lesotho, Million US $, GDP by Expenditure at current prices, Madagascar, Million US $, GDP by Expenditure at current prices, Malawi, Million US $, GDP by Expenditure at current prices, Mauritius, Million US $, GDP by Expenditure at current prices, Mozambique, Million US $, GDP by Expenditure at current prices, Namibia, Million US $, GDP by Expenditure at current prices, Seychelles, Million US $,
10 TABLE OF CONTENTS (CONTD.) Page (contd.) GDP BY EXPENDITURE IN US$ BY SADC MEMBER STATE GDP by Expenditure at current prices, South Africa, Million US $, GDP by Expenditure at current prices, Swaziland, Million US $, GDP by Expenditure at current prices, United Republic of Tanzania, Million US $, GDP by Expenditure at current prices, Zambia, Million US $, GDP by Expenditure at current prices, Zimbabwe, Million US 4, TOTAL GDP FOR SADC GDP at Market Prices, Total SADC, Million US $, Share of GDP at Market Prices by Member States, (%), GDP at Market Prices, Annual Real Growth Rates in SADC, (%), Per Capita GDP at Current Market Prices, (US $ per head), GDP by kind of economic activity at current prices, Total SADC, Million US $, Share of GDP by kind of economic activity at current prices, Total SADC, (%), GDP - Agriculture, Annual Real Growth Rates in SADC, (%), GDP - Mining, Annual Real Growth Rates in SADC, (%), GDP - Manufacturing, Annual Real Growth Rates in SADC, (%), GDP - Energy, Annual Real Growth Rates in SADC, (%), NATIONAL ACCOUNTS OF SADC BY COUNTRY IN NATIONAL CURRENCY ANGOLA NATIONAL ACCOUNTS GDP by kind of economic activity at current prices, Angola, Million Kwanza, Share of GDP by kind of economic activity at current prices, Angola, (%), GDP by Expenditure at current prices, Angola, Million Kwanza, Share of GDP by Expenditure at current prices, Angola, (%), GDP by kind of economic activity, Annual Real Growth Rates, Angola, (%), BOTSWANA NATIONAL ACCOUNTS GDP by kind of economic activity at current prices, Botswana, Million Pula, Share of GDP by kind of economic activity at current prices, Botswana, (%), GDP by Expenditure at current prices, Botswana, Million Pula, Share of GDP by Expenditure at current prices, Botswana, (%), GDP by kind of economic activity, Annual Real Growth rates, Botswana, (%),
11 TABLE OF CONTENTS (CONTD.) Page (contd.) NATIONAL ACCOUNTS OF SADC BY COUNTRY IN NATIONAL CURRENCY DEMOCRATIC REPUBLIC OF CONGO NATIONAL ACCOUNTS GDP by kind of economic activity at current prices, Democratic Republic of Congo, Million Franc Congolais, Share of GDP by kind of economic activity at current prices, Democratic Republic of Congo, (%), GDP by Expenditure at current prices, Democratic Republic of Congo, Million Franc Congolais, Share of GDP by Expenditure at current prices, Democratic Republic of Congo, (%), GDP by kind of economic activity, Annual Real Growth Rates, Democratic Republic of Congo, (%), LESOTHO NATIONAL ACCOUNTS GDP by kind of economic activity at current prices, Lesotho, Million Loti, Share of GDP by kind of economic activity at current prices, Lesotho, (%), GDP by Expenditure at current prices, Lesotho, Million Loti, Share of GDP by Expenditure at current prices, Lesotho, (%), GDP by kind of economic activity, Annual Real Growth Rates, Lesotho, (%), MADAGASCAR NATIONAL ACCOUNTS GDP by kind of economic activity at current prices, Madagascar, Million Ariary, Share of GDP by kind of economic activity at current prices, Madagascar, (%), GDP by Expenditure at current prices, Madagascar, Million Ariary, Share of GDP by Expenditure at current prices, Madagascar, (%), GDP by kind of economic activity, Annual Real Growth Rates, Madagascar,(%), MALAWI NATIONAL ACCOUNTS GDP by kind of economic activity at current prices, Malawi, Million Malawian Kwacha, Share of GDP by kind of economic activity at current prices, Malawi, (%), GDP by Expenditure at current prices, Malawi, Million, Malawian Kwacha, Share of GDP by Expenditure at current prices, Malawi, (%), GDP by kind of economic activity, Annual Real Growth Rates, Malawi, (%), MAURITIUS NATIONAL ACCOUNTS GDP by kind of economic activity at current prices, Mauritius, Million Mauritian Rupee, Share of GDP by kind of economic activity at current prices, Mauritius, (%), GDP by Expenditure at current prices, Mauritius, Million Mauritian Rupee, Share of GDP by Expenditure at current prices, Mauritius, (%), GDP by kind of economic activity, Annual Real Growth Rates, Mauritius, (%),
12 TABLE OF CONTENTS (CONTD.) Page (contd.) NATIONAL ACCOUNTS OF SADC BY COUNTRY IN NATIONAL CURRENCY MOZAMBIQUE. NATIONAL ACCOUNTS GDP by kind of economic activity at current prices, Mozambique, Million Metical, Share of GDP by kind of economic activity at current prices, Mozambique, (%), GDP by Expenditure at current prices, Mozambique, Million Metical, Share of GDP by Expenditure at current prices, Mozambique, (%), GDP by kind of economic activity, Annual Real Growth rates, Mozambique, (%), NAMIBIA NATIONAL ACCOUNTS GDP by kind of economic activity at current prices, Namibia, Million Namibian dollar, Share of GDP by kind of economic activity at current prices, Namibia, (%), GDP by Expenditure at current prices, Namibia, Million Namibian dollar, Share of GDP by Expenditure at current prices, Namibia, (%), GDP by kind of economic activity, Annual Real Growth Rates, Namibia, (%), SEYCHELLES NATIONAL ACC GDP by kind of economic activity at current prices, Seychelles, Million Seychelles Rupee, Share of GDP by kind of economic activity at current prices, Seychelles, (%), GDP by kind of economic activity, Annual Real Growth Rates, Seychelles, (%), SOUTH AFRICA NATIONAL ACCOUNTS GDP by kind of economic activity at current prices, South Africa, Million Rand, Share of GDP by kind of economic activity at current prices, South Africa, (%), GDP by Expenditure at current prices, South Africa, Million Rand, Share of GDP by Expenditure at current prices, South Africa, (%), GDP by kind of economic activity, Annual Real Growth Rates, South Africa, (%), SWAZILAND NATIONAL ACCOUNTS GDP by kind of economic activity at current prices, Swaziland, Million Lilangeni, Share of GDP by kind of economic activity at current prices, Swaziland, (%), GDP by Expenditure at current prices, Swaziland, Million Lilangeni, Share of GDP by Expenditure at current prices, Swaziland, (%), GDP by kind of economic activity, Annual Real Growth Rates, Swaziland, (%),
13 TABLE OF CONTENTS (CONTD.) Page (contd.) NATIONAL ACCOUNTS OF SADC BY COUNTRY IN NATIONAL CURRENCY UNITED REPUBLIC of TANZANIA NATIONAL ACCOUNTS GDP by kind of economic activity at current prices, United Republic of Tanzania, Million Tanzanian Shilling, Share of GDP by kind of economic activity at current prices, United Republic of Tanzania, (%), GDP by Expenditure at current prices, United Republic of Tanzania, Million Tanzanian Shilling, Share of GDP by Expenditure at current prices, United Republic of Tanzania, (%), GDP by kind of economic activity, Annual Real Growth Rates, United Republic of Tanzania, (%), ZAMBIA NATIONAL ACCOUNTS GDP by kind of economic activity at current prices, Zambia, Million Zambian Kwacha, Share of GDP by kind of economic activity at current prices, Zambia, (%), GDP by Expenditure at current prices, Zambia, Million Zambian Kwacha, Share of GDP by Expenditure at current prices, Zambia, (%), GDP by kind of economic activity, Annual Real Growth Rates, Zambia, (%), ZIMBABWE NATIONAL ACCOUNTS GDP by kind of economic activity at current prices, Zimbabwe, Million US $, Share of GDP by kind of economic activity at current prices, Zimbabwe, (%), GDP by Expenditure at current prices, Zimbabwe, Million US $, Share of GDP by Expenditure at current prices, Zimbabwe, (%), GDP by kind of economic activity, Annual Real Growth Rates, Zimbabwe, (%), EXTERNAL SECTOR BALANCE OF PAYMENTS OF SADC MEMBER STATES IN MILLIONS OF USD Balance of Payments, Angola, Million US $, Balance of Payments, Botswana, Million US $, Balance of Payments, Democratic Republic of Congo, Million US $, Balance of Payments, Lesotho, Million US $, Balance of Payments, Madagascar, Million US $, Balance of Payments, Malawi, Million US $, Balance of Payments, Mauritius, Million US $, Balance of Payments, Mozambique, Million US $, Balance of Payments, Namibia, Million US $, Balance of Payments, Seychelles, Million US $,
14 TABLE OF CONTENTS (CONTD.) Page (contd.) BALANCE OF PAYMENTS OF SADC MEMBER STATES IN MILLIONS OF USD Balance of Payments, South Africa, Million US $, Balance of Payments, Swaziland, Million US $, Balance of Payments, United Republic of Tanzania, Million US $, Balance of Payments, Zambia, Million US $, Balance of Payments, Zimbabwe, Million US $, MERCHANDISE TRADE Merchandise Trade, Angola, Million US $, Merchandise Trade, Botswana, Million US $, Merchandise Trade, Democratic Republic of Congo, Million US $, Merchandise Trade, Lesotho, Million US $, Merchandise Trade, Madagascar, Million US $, Merchandise Trade, Malawi, Million US $, Merchandise Trade, Mauritius, Million US $, Merchandise Trade, Mozambique, Million US $, Merchandise Trade, Namibia, Million US $, Merchandise Trade, Seychelles, Million US $, Merchandise Trade, South Africa, Million US $, Merchandise Trade, Swaziland, Million US $, Merchandise Trade, United Republic of Tanzania, Million US $, Merchandise Trade, Zambia, Million US $, Merchandise Trade, Zimbabwe, Million US $, EXTERNAL TRADE IN SERVICES Exports of Services in SADC, Million US $, Imports of Services in SADC, Million US $, Exports of Transportation Services in SADC, Million US $, Imports of Transportation Services in SADC, Million US $, Exports of Travel Services in SADC, Million US $, Imports of Travel Services in SADC, Million US $, Exports of Other Services in SADC, Million US $, Imports of Other Services in SADC, Million US $,
15 TABLE OF CONTENTS (CONTD.) Page FINANCING AND EXTERNAL DEBT Current Account Balance in SADC, Million US $, Current Account Balance as a % of GDP in SADC, (%), Total External Debt in SADC, Million US $, Total External Debt as Percentage of GDP in SADC, (%), Debt Servicing Flows in SADC, Million US $, Debt Service Ratio in SADC, (%), International Reserves Position at end of the Year in SADC, Million US $, Imports Cover in SADC, Number of Weeks, GOVERNMENT ACCOUNTS Total Revenue and Grants in SADC, Million National Currency, Total Expenditures and Net Lending in SADC, Million National Currency, Current Expenditure in SADC, Million National Currency, Capital Expenditure in SADC, Million National Currency, Fiscal Balance in SADC, Million National Currency, Fiscal balance as a Percentage of GDP, SADC, (%), Stock of Government Debt at end of year, Million National Currency, Stock of Government Debt as a Percentage of GDP, SADC, (%), MONEY AND BANKING Broad Money Supply (M2) in SADC, Million National Currency, Broad Money Supply (M2) Nominal Growth, SADC, (%), Broad Money Supply (M2) as a Percentage of GDP, SADC, (%), Monetary Base in SADC, Million National Currency, Domestic Credit: Net Claims on Central Government Sector in SADC, Million National Currency, Domestic Credit: Claims on Other Sectors in SADC, Million National Currency, Interest Rates : 3-Month Deposits in SADC, (%), Interest Rates : Minimum Lending Rate in SADC, (%), Exchange Rates, National Currency Per 1 US $ in SADC, Exchange Rates, National Currency Per 1 EURO in SADC, Exchange Rates, National Currency Per 1 RAND in SADC, Exchange Rates, National Currency Per 1 POUND STERLING in SADC,
16 TABLE OF CONTENTS (CONTD.) Page 6.5 PRICES Annual Headline Inflation rate - Period Average, as measured by National Consumer Price Index in SADC, (%), Year on Year Inflation rate - as at December, as measured by National Consumer Price Index in SADC, (%), Annual Inflation rate (DIV 01:Food and Non-Alcoholic Beverages) - Period Average, as measured by National Consumer Price Index in SADC, (%), Annual Inflation rate (DIV 04:Housing, water, electricity, gas & other fuels) - Period Average, as measured by National Consumer Price Index in SADC, (%), Annual Inflation rate (DIV 07:Transport) - Period Average, as measured by National Consumer Price Index in SADC, (%), Annual Headline Inflation rate, as measured by Harmonized Consumer Price Index (HCPI) in SADC, (%), International Comparisons Programme ((ICP-Africa ), Selected Indicators for SADC, 2005 and 2009 Rounds International Comparisons Programme (Global ICP), Selected Indicators for SADC, 2005 Round FOREIGN DIRECT INVESTMENT Foreign Direct Investment Inflows in SADC, Million US $, Foreign Direct Investment Outflows of SADC, Million US $, Net Foreign Direct Investment in SADC, Million US $, STATISTICS ON MAJOR INDUSTRIAL GROUPS TRANSPORT AND COMMUNICATIONS TRANSPORT Total Road Network in SADC, Km, , Selected Years Motor Vehicle Fleet in SADC, Per Thousand People, Passenger Car Fleet in SADC, Per Thousand People, Railway Line Route Length in SADC, Total Route-Km, Passengers Carried through SADC Railways, Million Passenger-Km, Goods Transported through SADC Railways, Million Ton-Km, Air Transport - Freight in SADC, Million Ton-Km, Air Transport - Passengers Carried in SADC, Number, Air Tansport - Registered Carrier Departures Worldwide of SADC, Number, INFORMATION AND COMMUNICATIONS TECHNOLOGY Telecommunication Services - Fixed Telephone Lines in SADC, Number, Telecommunication Services - Fixed Telephone Lines, Per 100 Inhabitants in SADC, Internet Services - Fixed broadband, Number of Subscriptions in SADC,
17 TABLE OF CONTENTS (CONTD.) Page (contd.) INFORMATION AND COMMUNICATIONS TECHNOLOGY Internet Services - Fixed broadband, Density Per 100 Inhabitants in SADC, Internet Services - Fixed Internet Subscriptions, Number of Subscriptions in SADC, Internet Services - Fixed Internet Subscriptions, Density Per 100 Inhabitants in SADC, Internet Users Per 100 Inhabitants in SADC, Mobile Celluar Subscribers, Number of Subscriptions in SADC, Mobile Celluar Subscribers, Density Per 100 Inhabitants in SADC, TOURISM Arrivals of Non Resident Tourists/Visitors in SADC, Thousand, Annual growth in Arrivals of Non Resident Tourists/Visitors in SADC, (%), Tourism Receipts in SADC, Million US $, Non Resident Tourists/Visitors Average Length of Stay in SADC, Days, Tourism Bed Capacity in SADC, Thousand, Tourism Bed Occupancy Rate in SADC, %, Tourism Room Capacity in SADC, Number, AGRICULTURE, FOOD SECURITY, AND FORESTRY AGRICULTURE Share of Agriculture in Gross Domestic Product (GDP), Employment, Exports and Imports in SADC, (%), Gross Capital Stock in SADC at Constant 2005 Prices, Million US $, Total Land Area, Agricultural Land, Land Use and Agricultural Population in SADC, Thousand, Irrigated Land in SADC and Its Share in Arable Land and Permanent Crops, Thousand Hectares, Insecticides Consumption in SADC, Tonne, Herbicides Consumption in SADC, Tonne, Fungicides and Bactericides Consumption in SADC, Tonne, Fertilizer Consumption in Nutrients in SADC by Type of Fertilizer, Thousand Tonne of Nutrients, Agriculture Gross Production Index Number in SADC, (Base year: =100), Agricultural Producer Price for Maize in SADC, US $ Per Tonne, Agricultural Producer Price for Sorghum in SADC, US $ Per Tonne, Agricultural Producer Price for Paddy Rice in SADC, US $ Per Tonne, Agricultural Producer Price for Cassava in SADC, US $ Per Tonne, Agricultural Producer Price for Wheat in SADC, US $ Per Tonne, Agricultural Producer Price for Groundnuts With Shell in SADC, US $ Per Tonne, Agricultural Producer Price for Soya beans in SADC, US $ Per Tonne, Agricultural Producer Price for Green Coffee in SADC, US $ Per Tonne,
18 TABLE OF CONTENTS (CONTD.) Page AGRICULTURE (contd.) Agricultural Producer Price for Tea in SADC, US $ Per Tonne, Agricultural Producer Price for Seed Cotton in SADC, US $ Per Tonne, Agricultural Producer Price for Unmanufactured Tobacco in SADC, US $ Per Tonne, Agricultural Producer Price for Sugar Cane in SADC, US $ Per Tonne, Agricultural Producer Price for Cattle Live Weight in SADC, US $ Per Tonne, Agricultural Producer Price for Cattle Meat in SADC, US $ Per Tonne, Agricultural Producer Price for Fresh Whole Cow Milk in SADC, US $ Per Tonne, Agricultural Producer Price for Chicken Live Weight in SADC, US $ Per Tonne, Agricultural Producer Price for Chicken Meat in SADC, US $ Per Tonne, Agricultural Producer Price for Goat Live Weight in SADC, US $ Per Tonne, Agricultural Producer Price for Goat Meat in SADC, US $ Per Tonne, Agricultural Producer Price for Pig Live weight in SADC, US $ Per Tonne, Agricultural Producer Price for Pig Meat in SADC, US $ Per Tonne, Agricultural Producer Price for Sheep Live weight in SADC, US $ Per Tonne, Agricultural Producer Price for Sheep Meat in SADC, US $ Per Tonne, Maize Production in SADC (Production, Area, and Yield), Sorghum Production in SADC (Production, Area, and Yield), Rice Production in SADC (Production, Area, and Yield), Cassava Production in SADC (Production, Area, and Yield), Wheat Production in SADC (Production, Area, and Yield), Groundnut Production in SADC (Production, Area, and Yield), Soya bean Production in SADC (Production, Area, and Yield), Coffee Production in SADC (Production, Area, and Yield), Tea Production in SADC (Production, Area, and Yield), Seed Cotton Production in SADC (Production, Area, and Yield), Tobacco Production in SADC (Production, Area, and Yield), Sugarcane Production in SADC (Production, Area, and Yield), Exports of Selected Agricultural Products and Inputs in SADC, Million US $, Imports of Selected Agricultural Products and Inputs in SADC, Million US $, Livestock Population in SADC, Number, Livestock and Poultry Meat Production in SADC, Thousand Tonne, Fish Production in SADC, Freshwater and Marine Catch, Tonne, FOOD SECURITY Consumer Price Index (CPI) for Food in SADC, (Base Year 2006 = 100),
19 TABLE OF CONTENTS (CONTD.) Page FORESTRY Land Area in SADC Covered By Forest by Five Year Period, Annual Change Rate in Total Forestry Area in SADC, '000 Ha Per Year, Total Land Area in SADC, '000 Ha, Forest Area as a Percentage of Land Area in SADC, '000 Ha, Exports and Imports of Wood Related Forestry Products in SADC, Million US $, Exports and Imports of Non-Wood Forestry Products in SADC, Million US $, Exports and Imports of Wood and Non-Wood Forestry Products in SADC, Million US $, MINING AND QUARRYING Mining Production in SADC, ENERGY AND WATER ENERGY Energy production in SADC, kt of oil equivalent, Total Electricity Production in SADC, Million Kilowatt-Hour, Total Net Installed Capacity of Electricity Power Plants in SADC, Thousand Kilowatt, Energy Consumption in SADC per $ of GDP at Constant 2006 Prices, Energy Consumption per $ of GDP at Constant 2000 Prices Energy Consumption in SADC, Total and Per Capita, by Source of Commercial Energy, Total Energy Use in SADC, Kt of Oil Equivalent, Total Energy Use Per Capita in SADC, Kt of Oil Equivalent, Percentage of Population in SADC With Access to Electricity, , Selected years Fuels Used in SADC for Cooking and Access to Modern Fuels in SADC, Percent Total Population, Latest Year Consumer Price Indices in SADC for Energy, Electricity Tariffs in SADC by Type of Customer, US $, Pump prices for gasoline in SADC in US cents per litre, , Selected Years Pump prices for diesel in SADC in US cents per litre, , Selected Years Price for Kerosene in SADC, US $ per litre,
20 TABLE OF CONTENTS (CONTD.) Page WATER Total Annual Renewable Water Resources Available in SADC, Total annual renewable internal water resources per capita in SADC, , Selected years Total Annual Freshwater Withdrawals in SADC, Billion Cubic Meter, , Selected Years Percentage of Total Annual Freshwater Withdrawals Used for Domestic Use in SADC, , Selected Years Percentage of Total Annual Freshwater Withdrawals Used for Agriculture (Irrigation) in SADC, , Selected Years Percentage of Total Annual Freshwater Withdrawals Used for Industry in SADC, , Selected Years Percentage Population Connected to Public Water Supply in SADC, (%), Water Tariffs in SADC, US $, Consumer Price Indices for Water in SADC, Total Emissions of Organic Water Pollutants(BOD) in SADC Per Day, Unit, ENVIRONMENTAL AND SUSTAINABLE DEVELOPMENT Carbon Dioxide Emissions in SADC, Total and Per Capita, Mean Annual Rainfall in SADC, mm, Mean Annual Temperature in SADC, 0 C, Consumption of Ozone-Depleting Chlorofluorocarbons (CFCs) in SADC, Tons of Ozone-Depleting Potential, , Selected Years Total Land Area in SADC, Km2, Number of Threatened Plant Species in SADC, , Selected Years Number of Threatned Animal Species in SADC, , Selected Years SADC PROTOCLS Status on Protocols and Declarations in SADC as of July
21 1 POPULATION AND MIGRATION 21
22 1.1 POPULATION 22
23 Table Total Mid Year Population in SADC by Sex, Thousand Person, Country Sex Female Angola Male Both Sexes Female Botswana Male Both Sexes Female Democratic Republic of Congo Male Both Sexes Female Lesotho Male Both Sexes Female Madagascar Male Both Sexes Female Malawi Male Both Sexes Female Mauritius Male Both Sexes Female Mozambique Male Both Sexes Female Namibia Male Both Sexes Female Seychelles Male Both Sexes Female South Africa Male Both Sexes Female Swaziland Male Both Sexes Female United Republic of Tanzania Male Both Sexes Female Zambia Male Both Sexes Female Zimbabwe Male Both Sexes Female SADC-Total Male Both Sexes Source: World DataBank - Health Nutrition and Population Statistics; downloaded 16 October 2013: Madagascar; Malawi, Namibia, Zambia & Zimbabwe; Democratic Republic of Congo ( ); Male & Female for & 2011 for Zimbabwe National Statistics Offices of Member States 23
24 Table Population Growth Rate in SADC, (%), Country Angola Botswana Democratic Republic of Congo Lesotho Madagascar Malawi Mauritius Mozambique Namibia Seychelles South Africa Swaziland United Republic of Tanzania Zambia Zimbabwe SADC-Total Source: Derived from Table using formula : Population growth = (year2 - year1) x 100 / year1: Democratic Republic of Congo ( ); Madagascar ( ); Zimbabwe (2015), SADC Total National Statistics Offices of Member States 24
25 Table Total Land Area, (Sq. Km) and Population Density, (Person Per Sq. Km) in SADC, Country Total Land Area, Sq. Km Angola Botswana Democratic Republic of Congo Lesotho Madagascar Malawi Mauritius Mozambique Namibia Seychelles South Africa Swaziland United Republic of Tanzania Zambia Zimbabwe SADC - Total Notes: Total land area excludes area covered by water 1 sq. km = 100 ha Source: Derived using Population totals from Table 1.1.1: Population density = population / area (sq. km): DRC ( ), Lesotho( , ), Madagascar ( ); SADC Total National Statistics Offices of Member States 25
26 Table Population in SADC by Sex and Age Group, (%), Country Angola Botswana Democratic Republic of Congo Lesotho Madagascar Malawi Mauritius Mozambique Namibia Seychelles South Africa Swaziland United Republic of Tanzania Zambia Zimbabwe SADC Total Sex Female Male Total Female Male Total Female Male Total Female Male Total Female Male Total Female Male Total Female Male Total Female Male Total Female Male Total Female Male Total Female Male Total Female Male Total Female Male Total Female Male Total Female Male Total Female Male Total Source: World DataBank, Health Nutrition and Population Statistics: downloaded 15 October 2013: Age groups 5-9 to 25-54: Angola, Botswana, Democratic Republic of Congo, Lesotho, Madagascar, Malawi, Mauritius, Mozambique, Namibia, Seychelles, South Africa, Swaziland, United Republic of Tanzania, Zambia, Zimbabwe World DataBank, Health Nutrition and Population Statistics, database: Education Statistics - All Indicators: downloaded: 9 October 2014: Namibia World DataBank, Health Nutrition and Population Statistics, database: Education Statistics - All Indicators: downloaded: 23 September 2016: National Statistics Offices of Member States Data for 2013 for: Democratic Republic of Congo, Madagascar, Data for 2015 for Democratic Republic of Congo 26
27 Table (contd.) Population in SADC by Sex and Age Group, (%), Angola Zambia Country Botswana Democratic Republic of Congo Lesotho Madagascar Malawi Mauritius Mozambique Namibia Seychelles South Africa Swaziland United Republic of Tanzania Zimbabwe SADC Total Sex Female Male Total Female Male Total Female Male Total Female Male Total Female Male Total Female Male Total Female Male Total Female Male Total Female Male Total Female Male Total Female Male Total Female Male Total Female Male Total Female Male Total Female Male Total Female Male Total Source: 27
28 Table Dependency Ratio in SADC, (%), Country Total Child Elderly Total Child Elderly Total Child Elderly Total Child Elderly Total Child Elderly Total Child Elderly Angola Botswana Democratic Republic of Congo Lesotho Madagascar Malawi Mauritius Mozambique Namibia n.a. n.a. n.a. Seychelles South Africa Swaziland United Republic of Tanzania Zambia Zimbabwe Source: World DataBank - Health Nutrition and Population Statistics; downloaded 16 October 2013 : Botswana (2012), Democratic Republic of Congo ( ), Lesotho (2012), Madagascar ( ), Namibia (2011), Swaziland (2012), Zambia (2012), Zimbabwe (2011) World DataBank, Health Nutrition and Population Statistics, database: Education Statistics - All Indicators: downloaded: 9 October 2014: Madagascar, Namibia World DataBank, Health Nutrition and Population Statistics, database: Education Statistics - All Indicators: downloaded: 22 September 2016: Seychelles National Statistics Offices of Member States Data for 2013 for: Democratic Republic of Congo, Data for 2015 for: Democratic Republic of Congo, 28
29 Table Population in Private Households in SADC By Size of Household, Person Per Household, Latest Year Country Latest Year Person Per Household All Households Angola Botswana Democratic Republic of Congo n.a. n.a. n.a. n.a Lesotho Madagascar Malawi n.a. n.a. n.a. n.a. n.a. n.a. n.a. n.a. Mauritius Mozambique Namibia Seychelles South Africa Swaziland United Republic of Tanzania Zambia Zimbabwe SADC - Total Source: National Statistics Offices of Member States 29
30 Table Population in Urban and Rural Areas of SADC, (%), Country Urban Rural Urban Rural Urban Rural Urban Rural Urban Rural Urban Rural Urban Rural Urban Rural Urban Rural Urban Rural Angola Botswana Democratic Republic of Congo Lesotho Madagascar Malawi Mauritius Mozambique Namibia n.a. n.a. Seychelles South Africa n.a. n.a. n.a. n.a. n.a. n.a. n.a. n.a. n.a. n.a n.a. n.a. n.a. n.a. n.a. n.a. n.a. n.a. Swaziland United Republic of Tanzania n.a n.a Zambia Zimbabwe Source: World DataBank, Health Nutrition and Population Statistics: downloaded 16 October 2013: Angola ( ), Botswana ( ), Democratic Republic of Congo ( ), Namibia (2010 & 2012), South Africa ( ), Zimbabwe ( ) World DataBank, Health Nutrition and Population Statistics, database: Education Statistics - All Indicators: downloaded: 9 October 2014: Republic of Congo, Namibia, South Africa World DataBank, Health Nutrition and Population Statistics, database: Education Statistics - All Indicators: downloaded:22 September 2016: United Republic of Tanzania (2015) National Statistics Offices of Member States Data for for: Angola, Botswana, Democratic Data for for Democratic Republic of Congo, 30
31 Table Birth Rate in SADC By Year, Per Thousand Inhabitants, Country Per Thousand Inhabitants Angola Botswana Democratic Republic of Congo n.a. Lesotho Madagascar n.a. Malawi Mauritius Mozambique Namibia n.a. Seychelles South Africa Swaziland United Republic of Tanzania Zambia Zimbabwe Source: World DataBank, Health Nutrition and Population Statistics: downloaded 16 October 2013: Angola ( ), Botswana (1980, , , ), Democratic Republic of Congo ( ), Lesotho ( ), Madagascar ( ), Malawi ( ), Mauritius (1981, 1991), Namibia ( ), Seychelles (1981, 1991), Swaziland ( ), United Republic of Tanzania ( ), Zambia ( ), Zimbabwe ( ) World DataBank, Health Nutrition and Population Statistics, database: Education Statistics - All Indicators: downloaded: 9 October 2014: Data for for: Angola, Democratic Republic of Congo, Madagascar, Namibia, Zimbabwe World DataBank, Health Nutrition and Population Statistics, database: Education Statistics - All Indicators: downloaded: 22 September 2016: Data for : Angola (2013), Democratic Republic of Congo ( ), Madagascar ( ), Zimbabwe (2013) National Statistics Offices of Member States 31
32 Table Death Rate in SADC By Year, Per Thousand Inhabitants, Country Per Thousand Inhabitants Angola Botswana Democratic Republic of Congo n.a. Lesotho Madagascar n.a. Malawi Mauritius Mozambique Namibia n.a. Seychelles South Africa Swaziland United Republic of Tanzania Zambia Zimbabwe n.a. Source: World DataBank, Health Nutrition and Population Statistics: downloaded 16 October 2013: Angola ( ), Botswana (1980, , , ), Democratic Republic of Congo( ), Lesotho( , ), Madagascar ( ), Malawi ( , ), Mauritius (1981), Namibia ( ), Seychelles (1981, South Africa ( , Swaziland ( ), United Republic of Tanzania ( ), Zambia( ), Zimbabwe ( ) World DataBank, Health Nutrition and Population Statistics, database: Education Statistics - All Indicators: downloaded: 9 October 2014: Data for for: Angola, Democratic Republic of Congo, Madagascar, Namibia; Zimbabwe (2013) World DataBank, Health Nutrition and Population Statistics, database: Education Statistics - All Indicators: downloaded: 22 September 2016: Data for : Angola (2013), Democratic Republic of Congo ( ), Madagascar ( ), Zimbabwe ( ) National Statistics Offices of Member States 32
33 Table Total Fertility Rate in SADC By Year, Number of Children Per Woman, Country Number of Children Per Woman Angola Botswana Democratic Republic of Congo Lesotho Madagascar Malawi Mauritius Mozambique Namibia Seychelles South Africa Swaziland United Republic of Tanzania Zambia Zimbabwe Source: World DataBank, Health Nutrition and Population Statistics: downloaded 16 October 2013: Angola ( ), Botswana(1980, , 1995), Democratic Republic of Congo ( ), Lesotho ( ), Madagascar ( ), Malawi ( ), Mauritius ( ), Namibia ( , 1995, 2002), South Africa ( ), Swaziland ( ), United Republic of Tanzania ( ), Zambia ( ), Zimbabwe ( ) World DataBank, Health Nutrition and Population Statistics, database: Education Statistics - All Indicators: downloaded: 9 October 2014: Democratic Republic of Congo (2012), Namibia (2012) National Statistics Offices of Member States 33
34 Table Life Expectancy at Birth in SADC By Year and Sex, Country Total Male Female Total Male Female Total Male Female Total Male Female Total Male Female Angola Botswana 51.4 n.a. n.a n.a. n.a n.a. n.a n.a. n.a n.a. n.a. Democratic Republic of Congo Lesotho 44.8 n.a. n.a n.a. n.a n.a. n.a n.a. n.a Madagascar 64.8 n.a. n.a n.a. n.a n.a. n.a n.a. n.a. n.a. n.a. n.a. Malawi 46.4 n.a. n.a n.a. n.a Mauritius Mozambique Namibia Seychelles South Africa Swaziland United Republic of Tanzania Zambia 51.9 n.a. n.a n.a. n.a n.a. n.a n.a. n.a. Zimbabwe n.a. n.a n.a. n.a n.a. n.a n.a. n.a. Table (contd.) Life Expectancy at Birth in SADC By Year and Sex, Country Total Male Female Total Male Female Total Male Female Total Male Female Total Male Female Angola Botswana Democratic Republic of Congo n.a. n.a n.a. n.a n.a. n.a. Lesotho n.a. n.a. Madagascar 66.7 n.a. n.a n.a. n.a n.a. n.a n.a. n.a n.a. n.a. Malawi Mauritius n.a. n.a. Mozambique Namibia n.a. n.a. n.a. Seychelles South Africa Swaziland United Republic of Tanzania Zambia 52.7 n.a. n.a Zimbabwe 51.4 n.a. n.a n.a. n.a. n.a. n.a n.a. n.a. n.a. n.a. n.a. Source: World DataBank, Health Nutrition and Population Statistics: downloaded 16 October 2013: Angola ( , Male & Female: ), Botswana (1980, , 1995, Male & Female: 2000, 2002), Democratic Republic of Congo ( , Male & Female: ), Lesotho ( , Male & Female: ), Madagascar ( ), Malawi ( ), Mauritius ( , Male & Female: ), Mozambique ( , Male & Female: ), Namibia ( , Male & Female: ), Seychelles (Male & Female: ), South Africa ( ), Swaziland ( , Male & Female: ), United Republic of Tanzania ( , Male & Female: ), Zambia ( , Male & Female: 2008), Zimbabwe ( , Male & Female: ) World DataBank, Health Nutrition and Population Statistics, database: Education Statistics - All Indicators: downloaded: 9 October 2014: Republic of Congo (2012), Madagascar ( ), Namibia (2012), Zimbabwe (2012) National Statistics Offices of Member States Democratic 34
35 Table Projected Total Mid-Year Population in SADC, Thousand Persons, , Selected Years Country Angola n.a. n.a. Botswana Democratic Republic of Congo Lesotho n.a. n.a. n.a. n.a. n.a. n.a. n.a. Madagascar n.a. n.a. n.a. n.a. n.a. n.a. Malawi n.a. n.a. Mauritius n.a. Mozambique n.a. n.a. n.a. n.a. Namibia Seychelles South Africa Swaziland n.a. n.a. n.a. n.a. n.a. n.a. United Republic of Tanzania Zambia n.a. n.a. n.a. n.a. n.a. Zimbabwe SADC - total n.a. n.a. n.a. n.a. n.a. n.a. n.a. Source: Medium variant, United Nations, Department of Economic and Social Affairs, Population Division, World Population Prospects: The 2012 Revision, New York, 2013: downloaded 16 October 2013: Angola ( ), Botswana ( ), Democratic Republic of Congo ( ), Mauritius ( ), Namibia ( ), Zimbabwe ( ) National Statistics Offices of Member States 35
36 1.2 MIGRANT REMITTANCES 36
37 Table Migrant Remittances Inflows in SADC, Million US $, Country Remittances Inflows, Million US $ Remittances Share of GDP, (%) Angola n.a. n.a n.a n.a. n.a n.a. Botswana n.a. n.a Democratic Republic of Congo n.a. n.a. n.a. n.a. n.a n.a. Lesotho n.a. n.a n.a. Madagascar n.a. n.a. n.a. n.a. n.a n.a. Malawi n.a n.a. n.a n.a. Mauritius Mozambique Namibia n.a. n.a n.a. n.a. Seychelles n.a. South Africa n.a. n.a n.a. Swaziland n.a. United Republic of Tanzania Zambia n.a. n.a Zimbabwe SADC - Total n.a. n.a. n.a. n.a. n.a. n.a. n.a. n.a. Source: World Bank, downloaded: 9 August 2016: Angola, Democratic Republic of Congo, Lesotho, Madagascar, Namibia, South Africa and Zambia National Statistics Offices of Member States 37
38 Table Migrant Remittances Outflows in SADC, Million US $, Country Migrant Remittance Outflows, Million US $ Remittances Share of GDP, (%) Angola n.a. n.a n.a. n.a. n.a. n.a. n.a. Botswana n.a. n.a n.a. n.a. n.a. n.a. n.a. Democratic Republic of Congo n.a. n.a. n.a. n.a. n.a. n.a. n.a. n.a. n.a. Lesotho n.a. n.a. n.a. n.a. n.a. n.a n.a. n.a. n.a. n.a. n.a. Madagascar n.a. n.a. n.a. n.a. n.a. n.a. n.a. n.a. n.a. n.a. Malawi n.a. n.a. n.a n.a. n.a. n.a. n.a. n.a. Mauritius Mozambique Namibia n.a. n.a n.a. n.a. n.a. n.a n.a Seychelles n.a. n.a. n.a. n.a. n.a. n.a. n.a. n.a. South Africa n.a n.a. n.a. n.a. n.a. n.a. Swaziland n.a n.a. n.a n.a. n.a. United Republic of Tanzania Zambia n.a. n.a n.a. n.a. n.a. n.a. n.a. Zimbabwe n.a. n.a. n.a. n.a. n.a. n.a. n.a. n.a. n.a. n.a. n.a. n.a. n.a. n.a. n.a. n.a. n.a. n.a. SADC - Total n.a. n.a. n.a. n.a. n.a. n.a. n.a. n.a. n.a. n.a. Source: World Bank, downloaded: 9 August 2016: Angola, Botswana, Democratic Republic of Congo, Malawi, Namibia, South Africa, Swaziland, United Republic of Tanzania, Zambia National Statistics Offices of Member States 38
39 2 SOCIAL SERVICES 39
40 2.1 EDUCATION 40
41 Table Adult Literacy Rate in SADC By Sex, (%), Angola Botswana Mauritius Mozambique Swaziland Country Sex Female 46.3 n.a Male 76.3 n.a Total 60.4 n.a Source: Democratic Republic of Congo Lesotho Madagascar Malawi Namibia Seychelles South Africa United Republic of Tanzania Zambia Zimbabwe Female n.a. n.a. n.a Male n.a. n.a. n.a Total 82.9 n.a. n.a. n.a Female n.a n.a n.a n.a Male n.a n.a n.a n.a Total n.a n.a. n.a n.a n.a Female 80.0 n.a. n.a n.a. n.a. n.a. n.a Male 93.0 n.a. n.a n.a. n.a. n.a. n.a Total n.a. n.a n.a. n.a. n.a Female n.a. n.a. n.a n.a. n.a n.a. n.a Male n.a. n.a. n.a n.a. n.a n.a. n.a Total n.a. n.a. n.a n.a. n.a n.a. n.a Female n.a Male n.a Total n.a Female n.a. n.a. n.a. n.a National Statistics Offices of Member States Male n.a. n.a. n.a. n.a Total n.a. n.a Definition: Female n.a n.a Male n.a n.a Total n.a Female n.a. n.a. n.a n.a n.a. n.a. n.a. Male n.a. n.a. n.a n.a n.a. n.a. n.a. Total n.a. n.a n.a n.a. n.a. n.a. Female n.a. n.a n.a n.a. n.a. n.a. n.a. n.a. Male n.a. n.a n.a n.a. n.a. n.a. n.a. n.a. Total n.a n.a. n.a. n.a. n.a. n.a. Female n.a. n.a. n.a Male n.a. n.a. n.a Total n.a. n.a. n.a Female n.a n.a n.a. n.a. n.a Male n.a n.a n.a. n.a. n.a Total n.a n.a n.a n.a Female n.a. n.a. n.a n.a. n.a Male n.a. n.a. n.a n.a. n.a Total n.a. n.a n.a. n.a Female n.a n.a. n.a n.a. n.a. n.a Male n.a n.a. n.a n.a. n.a. n.a Total n.a n.a. n.a n.a. n.a. n.a Female n.a. n.a. n.a n.a n.a n.a Male n.a. n.a. n.a n.a n.a n.a Total n.a. n.a n.a n.a n.a Gender Statistics Database, The World Bank: px?source=gender%20statistics, Downloaded, 14 April 2011 World DataBank, Health Nutrition and Population Statistics: downloaded 17 October 2013: Angola (2001, 2010), Democratic Republic of Congo (2001, 2010), Lesotho (2010), Madagascar (2000, 2009), Mauritius (2010), Namibia (2010), Seychelles (2002, 2010), Zambia (2002, 2010), Zimbabwe (2010) World DataBank, database: Education Statistics - All Indicators: downloaded: 12 October 2014: Democratic Republic of Congo (2007, 2011), Madagascar ( , ), Namibia ( ) World DataBank, downloaded: 9 August 2016: Data for 2015 for Democratic Republic of Congo, Lesotho, Madagascar, Mauritius, Swaziland, Zambia Adult literacy rate is the percentage of people ages 15 and above who can, with understanding, read and write a short, simple statement on their everyday life. 41
42 Table Net Enrolment Ratio in Primary School in SADC By Sex, (%), Country Sex Female n.a. n.a Angola Male n.a. n.a Total n.a. n.a Source: Female Botswana Male Total Female n.a. n.a. n.a. n.a. n.a. n.a. n.a. n.a. n.a. n.a. Democratic Republic of Congo Male n.a. n.a. n.a. n.a. n.a. n.a. n.a. n.a. n.a. n.a. Total n.a. n.a. n.a. n.a. n.a. n.a. n.a. n.a. n.a. n.a. Female Lesotho Male Total Female n.a. n.a n.a n.a. Madagascar Male n.a. n.a n.a n.a. Total n.a. n.a n.a n.a. Female Malawi Mauritius Mozambique Namibia Seychelles South Africa Swaziland United Republic of Tanzania Zambia Zimbabwe World DataBank, Health Nutrition and Population Statistics: view.aspx; downloaded 17 October 2013: Angola ( ), Namibia, Seychelles (2005), Zambia ( ), Zimbabwe World DataBank, database: Education Statistics - All Indicators: downloaded: 12 October 2014: Democratic Republic of Congo, Namibia ( ), Zambia (2012) World DataBank, database: Education Statistics - All Indicators: downloaded: 27 September 2016: Namibia (2013) Male National Statistics Offices of Member States Total Female Male Total Female Male Total Female n.a. n.a. Male n.a. n.a. Total n.a. n.a. Female n.a. n.a Male n.a. n.a Total n.a. n.a Female Male Total Female n.a n.a. Male n.a n.a. Total n.a n.a. Female 95.6 n.a n.a n.a Male 96.7 n.a n.a n.a Total n.a Female Male Total Female 91.3 n.a. n.a n.a. n.a n.a. Male 89.8 n.a. n.a n.a. n.a n.a. Total 90.5 n.a. n.a n.a. n.a n.a. 42
43 Table Net Enrolment Ratio in Secondary School in SADC By Sex, (%), Country Sex Female n.a. n.a Angola Male n.a. n.a Total n.a. n.a Female n.a. Source: Botswana Male n.a. Total n.a. n.a n.a. n.a. Female n.a. n.a. n.a. n.a. n.a. n.a. n.a. n.a. n.a. n.a. Democratic Republic of Congo Male n.a. n.a. n.a. n.a. n.a. n.a. n.a. n.a. n.a. n.a. Total n.a. n.a. n.a. n.a. n.a. n.a. n.a. n.a. n.a. n.a. Female Lesotho Male Total Female n.a. n.a n.a. Madagascar Male n.a. n.a n.a. Total n.a. n.a. n.a n.a n.a. Female Malawi Male Mauritius Mozambique Namibia Seychelles South Africa Swaziland United Republic of Tanzania Zambia Zimbabwe World DataBank, Health Nutrition and Population Statistics: view.aspx; downloaded 17 October 2013: Angola ( ), Madagascar, Malawi ( ), Mozambique ( ), Namibia ( ) World DataBank, database: Education Statistics - All Indicators: downloaded: 12 October 2014: Malawi 2012 World DataBank, database: Education Statistics - All Indicators: downloaded: 27 September 2016: Botswana (2013 total), Madagascar ( , 2014), Namibia (2013), Total National Statistics Offices of Member States Female Male Total Female Male Total Female n.a. n.a. n.a. n.a. n.a n.a. n.a. Male n.a. n.a. n.a. n.a. n.a n.a. n.a. Total n.a n.a. n.a. Female n.a. n.a. n.a. n.a. n.a. n.a. n.a. n.a Male n.a. n.a. n.a. n.a. n.a. n.a. n.a. n.a Total Female Male Total Female n.a n.a. n.a. n.a. Male n.a n.a. n.a. n.a. Total n.a Female n.a Male n.a Total Female n.a. n.a. n.a. n.a. n.a. n.a Male n.a. n.a. n.a. n.a. n.a. n.a Total Female 36.3 n.a. n.a n.a. n.a n.a. Male 37.9 n.a. n.a n.a. n.a n.a. Total 37.1 n.a. n.a n.a. n.a n.a. 43
44 Table Ratio of Girls/Females to Boys/Males in Primary, Secondary and Tertiary School in SADC, Country Level Primary n.a. n.a Angola Secondary n.a. n.a Tertiary n.a. n.a. n.a. n.a. n.a. n.a. n.a n.a. Primary Source: Botswana Secondary n.a. n.a Tertiary Primary n.a n.a. Democratic Republic of Congo Secondary n.a n.a. Tertiary n.a n.a n.a. Primary Lesotho Secondary Tertiary 1.19 n.a. n.a. n.a. n.a. n.a Primary n.a. Madagascar Secondary n.a. n.a n.a n.a. Tertiary n.a. Primary Malawi Secondary Tertiary n.a. n.a n.a. n.a. n.a. n.a. Primary Mauritius Secondary Tertiary Primary Mozambique Secondary Tertiary Primary n.a n.a. n.a. Namibia Seychelles South Africa Swaziland United Republic of Tanzania Zambia Zimbabwe Gender Parity Index in Primary, Secondary and Tertiary School, Millennium Development Goals Database United Nations Statistics Division: UNData - downloaded October 2013: Democratic Republic of Congo ( ), Madagascar Millenium Development Goals Database: downloaded: 10 October 2014: Democratic Republic of Congo (2012), Madagascar (2012) World DataBank, database: Education Statistics - All Indicators: downloaded: 12 October 2014: Namibia (Secondary: , 2012); Zimbabwe ( ) World DataBank, database: Education Statistics - All Indicators: downloaded: 27 September 2016: Angoal (2013 Tertiary), Democratic Republic of Congo (2013), Lesotho ( tertiary), Madagascar ( 2013 Primary & Tertiary), Namibia (2013 Primary), Seychelles ( Tertiary), Zimbabwe (2013 Tertiary) Secondary n.a n.a. n.a. n.a. National Statistics Offices of Member States Tertiary 0.88 n.a n.a. n.a. n.a. n.a n.a. Primary Secondary Tertiary 0.88 n.a n.a. n.a Primary Secondary Tertiary Primary n.a n.a Secondary n.a n.a Tertiary 0.98 n.a. n.a. n.a. n.a n.a Primary Secondary n.a. n.a. n.a. n.a. n.a Tertiary n.a. n.a. n.a. n.a Primary n.a. n.a n.a. Secondary n.a n.a. n.a. n.a. n.a n.a. Tertiary n.a. n.a. n.a. n.a. n.a. n.a. n.a. n.a. n.a. n.a. Primary 0.98 n.a. n.a n.a. n.a n.a. Secondary 0.91 n.a. n.a n.a. n.a n.a. Tertiary n.a. n.a. n.a. n.a n.a. n.a. 44
45 Table Pupil-Teacher Ratio in Primary and Secondary School in SADC, Number of Pupils Per Teacher, , Selected Years Country Pri Sec Pri Sec Pri Sec Pri Sec Pri Sec Pri Sec Pri Sec Pri Sec Pri Sec Pri Sec Angola n.a. n.a. 41 n.a. n.a. n.a. n.a. n.a n.a. n.a. Botswana Democratic Republic of Congo n.a. n.a n.a. n.a. Lesotho Madagascar n.a n.a n.a. n.a. Malawi Mauritius Mozambique 69 n.a. 66 n.a. 65 n.a. 62 n.a. 59 n.a. 56 n.a n.a Namibia n.a n.a. n.a. n.a. n.a. n.a. n.a. Seychelles South Africa n.a. n.a. n.a. n.a. 30 n.a. 32 n.a. n.a. n.a. n.a. n.a. Swaziland n.a. n.a n.a. n.a. United Republic of Tanzania Zambia n.a. 63 n.a. 49 n.a Zimbabwe n.a. n.a. n.a. n.a n.a. n.a. n.a. n.a n.a. n.a. Source: UNESCO Institute for Statistics (UIS) Data Centre, UNData: downloaded 18 October 2013: Angola ( , 2010), Botswana (2000, ), Democratic Republic of Congo (2002, ), Lesotho (2000, , 2011), Madagascar, Malawi (2000, ), Mauritius (2000, ), Mozambique (2000, ), Namibia (2000, , 2010), Seychelles (2000, ), South Africa (2000, , 2006, ), Swaziland (2000, ), United Republic of Tanzania (2000, ), Zambia (2000, , 2010), Zimbabwe (2000, ) World DataBank, database: Education Statistics - All Indicators: downloaded: 12 October 2014: Democratic Republic of Congo (2012), South Africa (Primary, 2012) World DataBank, database: Education Statistics - All Indicators: downloaded: 9 August 2016: Democratic Republic of Congo ( ), Madagascar (2013 Primary), Mozambique ( Secondary), South Africa (Primary, 2013 Primary), Zambia (2012 Primary) National Statistics Offices of Member States Notes: Pri = Primary; Sec = Secondary 45
46 Table Higher Education Enrolment in SADC by Key Fields of Study and By Sex (Full-time equivalents), Number, Country Angola Botswana Key Field of Study Agriculture Education Science Engineering Humanities and arts Sex Country Key Field of Study Sex Female n.a. n.a. n.a. n.a. n.a. n.a. n.a. n.a. 437 n.a. Female n.a. n.a. n.a. n.a. n.a n.a. n.a. n.a. Male n.a. n.a. n.a. n.a. n.a. n.a. n.a. n.a n.a. Agriculture Male n.a. n.a. n.a. n.a. n.a n.a. n.a. n.a. Total n.a. n.a. n.a. n.a. n.a. n.a. n.a. n.a n.a. Total n.a. n.a. n.a. n.a. n.a n.a. n.a. n.a. Female n.a. n.a. n.a. n.a. n.a. n.a. n.a. n.a n.a. Female n.a. n.a. n.a. n.a. n.a n.a. n.a. n.a. Male n.a. n.a. n.a. n.a. n.a. n.a. n.a. n.a n.a. Education Male n.a. n.a. n.a. n.a. n.a n.a. n.a. n.a. Total n.a. n.a. n.a. n.a. n.a. n.a. n.a. n.a n.a. Total n.a. n.a. n.a. n.a. n.a n.a. n.a. n.a. Female n.a. n.a. n.a. n.a. n.a. n.a. n.a. n.a. 393 n.a. Female n.a. n.a. n.a. n.a. n.a n.a. n.a. n.a. Male n.a. n.a. n.a. n.a. n.a. n.a. n.a. n.a n.a. Science Male n.a. n.a. n.a. n.a. n.a n.a. n.a. n.a. Total n.a. n.a. n.a. n.a. n.a. n.a. n.a. n.a n.a. Total n.a. n.a. n.a. n.a. n.a n.a. n.a. n.a. Female n.a. n.a. n.a. n.a. n.a. n.a. n.a. n.a n.a. Female n.a. n.a. n.a. n.a. n.a n.a. n.a. n.a. Male n.a. n.a. n.a. n.a. n.a. n.a. n.a. n.a n.a. Engineering Male n.a. n.a. n.a. n.a. n.a n.a. n.a. n.a. Total n.a. n.a. n.a. n.a. n.a. n.a. n.a. n.a n.a. Total n.a. n.a. n.a. n.a. n.a n.a. n.a. n.a. Female n.a. n.a. n.a. n.a. n.a. n.a. n.a. n.a n.a. Humanities Female n.a. n.a. n.a. n.a. n.a n.a. n.a. n.a. Male n.a. n.a. n.a. n.a. n.a. n.a. n.a. n.a n.a. and arts Male n.a. n.a. n.a. n.a. n.a n.a. n.a. n.a. Total n.a. n.a. n.a. n.a. n.a. n.a. n.a. n.a n.a. Total n.a. n.a. n.a. n.a. n.a n.a. n.a. n.a. Female n.a. n.a. n.a. n.a. n.a. n.a. n.a. n.a n.a. Democratic Female n.a. n.a. n.a. n.a. n.a n.a. n.a. n.a. Social Science Republic of Social Science Male n.a. n.a. n.a. n.a. n.a. n.a. n.a. n.a n.a. Male n.a. n.a. n.a. n.a. n.a n.a. n.a. n.a. Congo Total n.a. n.a. n.a. n.a. n.a. n.a. n.a. n.a n.a. Total n.a. n.a. n.a. n.a. n.a n.a. n.a. n.a. Business and Law Health and Welfare Female n.a. n.a. n.a. n.a. n.a. n.a. n.a. n.a n.a. Business and Female n.a. n.a. n.a. n.a. n.a. n.a. n.a. n.a. n.a. n.a. Male n.a. n.a. n.a. n.a. n.a. n.a. n.a. n.a n.a. Law Male n.a. n.a. n.a. n.a. n.a. n.a. n.a. n.a. n.a. n.a. Total n.a. n.a. n.a. n.a. n.a. n.a. n.a. n.a n.a. Total n.a. n.a. n.a. n.a. n.a. n.a. n.a. n.a. n.a. n.a. Female n.a. n.a. n.a. n.a. n.a. n.a. n.a. n.a n.a. Health and Female n.a. n.a. n.a. n.a. n.a n.a. n.a. n.a. Male n.a. n.a. n.a. n.a. n.a. n.a. n.a. n.a n.a. Welfare Male n.a. n.a. n.a. n.a. n.a n.a. n.a. n.a. Total n.a. n.a. n.a. n.a. n.a. n.a. n.a. n.a n.a. Total n.a. n.a. n.a. n.a. n.a n.a. n.a. n.a. Unspecified Female n.a. n.a. n.a. n.a. n.a. n.a. n.a. n.a n.a. Unspecified Female n.a. n.a. n.a. n.a. n.a n.a. n.a. n.a. Programmes Male n.a. n.a. n.a. n.a. n.a. n.a. n.a. n.a n.a. Programmes Male n.a. n.a. n.a. n.a. n.a n.a. n.a. n.a. Total n.a. n.a. n.a. n.a. n.a. n.a. n.a. n.a n.a. Total n.a. n.a. n.a. n.a. n.a n.a. n.a. n.a. Female n.a. n.a. n.a. n.a. n.a. n.a. n.a. n.a n.a. Female n.a. n.a. n.a. n.a. n.a n.a. n.a. n.a. Total Male n.a. n.a. n.a. n.a. n.a. n.a. n.a. n.a n.a. Total Male n.a. n.a. n.a. n.a. n.a n.a. n.a. n.a. Total n.a. n.a. n.a. n.a. n.a. n.a. n.a. n.a n.a. Total n.a. n.a. n.a. n.a. n.a n.a. n.a. n.a. Female 272 n.a. n.a. n.a. n.a. n.a Agriculture Male 688 n.a. n.a. n.a. n.a. n.a Total 960 n.a. n.a. n.a. n.a. n.a Female Education Male Total Source: Female SADC Secretariat, Education and Skills Section, Directorate of Social and Human Development and Special Programmes (SHD & SP), Science Male Table D9. Distribution of Higher Education Enrolment by Key Fields of Study; Enrolment in universities by Key Fields of Study (Fulltime equivalents): Botswana, Malawi (2008), Namibia, Swaziland Total Female Engineering Male Total World DataBank, database: Education Statistics - All Indicators: downloaded: 12 October Female : Angola (2002), Democratic Republic of Congo ( ), Madagascar ( ), Zimbabwe ( ) Humanities Male National Statistics Offices of Member States and arts Total Female Social Science Male Total Female n.a. n.a. n.a. n.a. Business and Male n.a. n.a. n.a. n.a. Law Total n.a. n.a. n.a. n.a. Female Health and Male Welfare Total Female Total Male Total
47 Table (contd.) Higher Education Enrolment in SADC by Key Fields of Study and By Sex (Full-time equivalents), Number, Country Lesotho Madagascar Key Field of Key Field of Country Study Study Female n.a. n.a. n.a. Female n.a. n.a. 133 n.a. n.a. n.a. n.a. n.a. n.a. n.a. Agriculture Male n.a. n.a. n.a. Agriculture Male n.a. n.a. - 2 n.a. n.a. n.a. n.a. n.a. n.a. n.a. Total n.a. n.a. n.a. Total n.a. n.a. 131 n.a. n.a. n.a. n.a. n.a. n.a. n.a. Female n.a. n.a. n.a. Female n.a. n.a. 750 n.a. n.a. n.a. n.a. n.a. n.a. n.a. Education Male n.a. n.a. n.a. Education Male n.a. n.a n.a. n.a. n.a. n.a. n.a. n.a. n.a. Total n.a. n.a. n.a. Total n.a. n.a. 681 n.a. 697 n.a. n.a. n.a. n.a. n.a. Female n.a. n.a. n.a. Female n.a. n.a. 329 n.a. n.a. n.a. n.a. n.a. n.a. n.a. Science Male n.a. n.a. n.a. Science Male n.a. n.a. 52 n.a. n.a. n.a. n.a. n.a. n.a. n.a. Total n.a. n.a. n.a. Total n.a. n.a. 381 n.a n.a. n.a. n.a. n.a. n.a. Female n.a. n.a. n.a. Female n.a. n.a. 58 n.a. n.a. n.a. n.a. n.a. n.a. n.a. Engineering Male n.a. n.a. n.a. Engineering Male n.a. n.a. 1 n.a. n.a. n.a. n.a. n.a. n.a. n.a. Total n.a. n.a. n.a. Total n.a. n.a. 59 n.a. 416 n.a. n.a. n.a. n.a. n.a. Female n.a. n.a. n.a. Female n.a. n.a. 296 n.a. n.a. n.a. n.a. n.a. n.a. n.a. Humanities Humanities Male n.a. n.a. n.a. Malawi Male n.a. n.a. 32 n.a. n.a. n.a. n.a. n.a. n.a. n.a. and arts and arts Total n.a. n.a. n.a. Total n.a. n.a. 328 n.a. 201 n.a. n.a. n.a. n.a. n.a. Social Science Female n.a. n.a. n.a. Female n.a. n.a. 215 n.a. n.a. n.a. n.a. n.a. n.a. n.a. Social Male n.a. n.a. n.a. Male n.a. n.a. 46 n.a. n.a. n.a. n.a. n.a. n.a. n.a. Science Total n.a. n.a. n.a. Total n.a. n.a. 261 n.a. 863 n.a. n.a. n.a. n.a. n.a. Female n.a. n.a. n.a. n.a. n.a. n.a. n.a. n.a. n.a. n.a. Female n.a. n.a. 54 n.a. n.a. n.a. n.a. n.a. n.a. n.a. Business and Business and Male n.a. n.a. n.a. n.a. n.a. n.a. n.a. n.a. n.a. n.a. Male n.a. n.a. 21 n.a. n.a. n.a. n.a. n.a. n.a. n.a. Law Law Total n.a. n.a. n.a. n.a. n.a. n.a. n.a. n.a. n.a. n.a. Total n.a. n.a. 75 n.a. 58 n.a. n.a. n.a. n.a. n.a. Female n.a. n.a. n.a. Female n.a. n.a. 201 n.a. n.a. n.a. n.a. n.a. n.a. n.a. Health and Health and Male n.a. n.a. n.a. Male n.a. n.a n.a. n.a. n.a. n.a. n.a. n.a. n.a. Welfare Welfare Total n.a. n.a. n.a. Total n.a. n.a. 188 n.a. 437 n.a. n.a. n.a. n.a. n.a. Female n.a. n.a. n.a. Female n.a. n.a n.a. n.a. n.a. n.a. n.a. n.a. n.a. Total Male n.a. n.a. n.a. Total Male n.a. n.a. 81 n.a. n.a. n.a. n.a. n.a. n.a. n.a. Total n.a. n.a. n.a. Total n.a. n.a n.a n.a. n.a. n.a. n.a. n.a. Female n.a. n.a. n.a. Agriculture Male n.a. n.a. n.a. Total n.a. n.a. n.a. Female n.a. n.a. n.a. Education Male n.a. n.a. n.a. Total n.a. n.a. n.a. Female n.a. n.a. n.a. Source: Science Male n.a. n.a. n.a. Total n.a. n.a. n.a. SADC Secretariat, Education and Skills Section, Directorate of Social and Human Development and Special Programmes Female n.a. n.a. n.a. (SHD & SP), Table D9. Distribution of Higher Education Enrolment by Key Fields of Study; Enrolment in universities by Engineering Male n.a. n.a. n.a. Key Fields of Study (Full-time equivalents): Botswana, Malawi (2008), Namibia, Swaziland Total n.a. n.a. n.a. Female n.a. n.a. n.a. World DataBank, database: Education Statistics - All Indicators: downloaded: 12 Humanities Male n.a. n.a. n.a. October 2014: Angola (2002), Democratic Republic of Congo ( ), Madagascar ( ), Zimbabwe (2010- and arts Total n.a. n.a. n.a. 2012) Social Science Business and Law Health and Welfare Unspecified Programmes Total Female n.a. n.a. n.a. National Statistics Offices of Member States Male n.a. n.a. n.a. Total n.a. n.a. n.a. Female n.a. n.a. n.a. n.a. n.a. n.a. n.a. n.a. n.a. n.a. Male n.a. n.a. n.a. n.a. n.a. n.a. n.a. n.a. n.a. n.a. Total n.a. n.a. n.a. n.a. n.a. n.a. n.a. n.a. n.a. n.a. Female n.a. n.a. n.a. Male n.a. n.a. n.a. Total n.a. n.a. n.a. Female n.a. n.a. n.a. n.a. Male n.a. n.a. n.a. n.a. Total n.a. n.a. n.a. n.a. Female n.a. n.a. n.a. Male n.a. n.a. n.a. Total n.a. n.a. n.a. 47
48 Table (contd.) Higher Education Enrolment in SADC by Key Fields of Study and By Sex (Full-time equivalents), Number, Country Mauritius Mozambique Key Field of Key Field of Sex Country Study Study Sex Female n.a. n.a. n.a. n.a. n.a Female n.a. n.a. n.a Agriculture Male n.a. n.a. n.a. n.a. n.a Agriculture Male n.a. n.a. n.a Total n.a. n.a. n.a. n.a Total n.a. n.a. n.a Female n.a. n.a. n.a. n.a. n.a Female n.a. n.a. n.a Education Male n.a. n.a. n.a. n.a. n.a Education Male n.a. n.a. n.a Total n.a. n.a. n.a. n.a Total n.a. n.a. n.a Female n.a. n.a. n.a. n.a. n.a Female n.a. n.a. n.a Science Male n.a. n.a. n.a. n.a. n.a Science Male n.a. n.a. n.a Total n.a. n.a. n.a. n.a Total n.a. n.a. n.a Female n.a. n.a. n.a. n.a. n.a Female n.a. n.a. n.a Engineering Male n.a. n.a. n.a. n.a. n.a Engineering Male n.a. n.a. n.a Total n.a. n.a. n.a. n.a Total n.a. n.a. n.a Female n.a. n.a. n.a. n.a. n.a Female n.a. n.a. n.a Humanities Humanities Male n.a. n.a. n.a. n.a. n.a Namibia Male n.a. n.a. n.a and arts and arts Total n.a. n.a. n.a. n.a Total n.a. n.a. n.a Social Science Female n.a. n.a. n.a. n.a. n.a Female n.a. n.a. n.a Social Male n.a. n.a. n.a. n.a. n.a Male n.a. n.a. n.a Science Total n.a. n.a. n.a. n.a Total n.a. n.a. n.a Female n.a. n.a. n.a. n.a. n.a Female n.a. n.a. n.a Business and Business and Male n.a. n.a. n.a. n.a. n.a Male n.a. n.a. n.a Law Law Total n.a. n.a. n.a. n.a Total n.a. n.a. n.a Female n.a. n.a. n.a. n.a. n.a Female n.a. n.a. n.a Health and Health and Male n.a. n.a. n.a. n.a. n.a Male n.a. n.a. n.a Welfare Welfare Total n.a. n.a. n.a. n.a Total n.a. n.a. n.a Female n.a. n.a. n.a. n.a. n.a Female n.a. n.a. n.a Services Male n.a. n.a. n.a. n.a. n.a Total Male n.a. n.a. n.a Total n.a. n.a. n.a. n.a. n.a Total n.a. n.a. n.a General & Female n.a. n.a. n.a. n.a. n.a Other Male n.a. n.a. n.a. n.a. n.a Programmes Total n.a. n.a. n.a. n.a. n.a Female n.a. n.a. n.a. n.a. n.a Total Male n.a. n.a. n.a. n.a. n.a Total n.a. n.a. n.a. n.a Female Source: Agriculture Male Total SADC Secretariat, Education and Skills Section, Directorate of Social and Human Development and Special Programmes (SHD & SP), Table Female D9. Distribution of Higher Education Enrolment by Key Fields of Study; Enrolment in universities by Key Fields of Study (Full-time Education Male equivalents): Botswana, Malawi (2008), Namibia, Swaziland Total Female Science Male World DataBank, database: Education Statistics - All Indicators: downloaded: 12 October 2014: Total Angola (2002), Democratic Republic of Congo ( ), Madagascar ( ), Zimbabwe ( ) Engineering Humanities and arts Social Science Business and Law Health and Welfare Total Female National Statistics Offices of Member States Male Total Female Male Total Female * Male Total Female n.a. n.a Male n.a. n.a Total n.a. n.a Female Male Total Female Male Total
49 Table (contd.) Higher Education Enrolment in SADC by Key Fields of Study and By Sex (Full-time equivalents), Number, Country Seychelles South Africa Key Field of Study Agriculture Education Science Engineering Humanities and arts Social Science Business and Law Health and Welfare Total Agriculture Education Science Engineering Humanities and arts Social Science Business and Law Health and Welfare Services Unknown / Unspecified Total Country Key Field of Study Female n.a. n.a. n.a. n.a. n.a. n.a. n.a. n.a. n.a. n.a. Female n.a. n.a n.a. n.a. 439 n.a. n.a. n.a. Male n.a. n.a. n.a. n.a. n.a. n.a. n.a. n.a. n.a. n.a. Agriculture Male n.a. n.a n.a. n.a. 454 n.a. n.a. n.a. Total n.a. n.a. n.a. n.a. n.a. n.a. n.a. n.a. n.a. n.a. Total n.a. n.a n.a. n.a. 893 n.a. n.a. n.a. Female n.a. n.a. n.a. n.a. n.a. n.a. n.a. n.a. n.a. n.a. Female n.a. n.a n.a. n.a n.a. n.a. Male n.a. n.a. n.a. n.a. n.a. n.a. n.a. n.a. n.a. n.a. Education Male n.a. n.a n.a. n.a n.a. n.a. Total n.a. n.a. n.a. n.a. n.a. n.a. n.a. n.a. n.a. n.a. Total n.a. n.a n.a. n.a n.a. n.a. Female n.a. n.a. n.a. n.a. n.a. n.a. n.a. n.a. n.a. n.a. Female n.a. n.a n.a. n.a n.a. n.a. Male n.a. n.a. n.a. n.a. n.a. n.a. n.a. n.a. n.a. n.a. Science Male n.a. n.a n.a. n.a n.a. n.a. Total n.a. n.a. n.a. n.a. n.a. n.a. n.a. n.a. n.a. n.a. Total n.a. n.a n.a. n.a n.a. n.a. Female n.a. n.a. n.a. n.a. n.a. n.a. n.a. n.a. n.a. n.a. Female n.a. n.a. 7 4 n.a. n.a. 327 n.a. n.a. n.a. Male n.a. n.a. n.a. n.a. n.a. n.a. n.a. n.a. n.a. n.a. Engineering Male n.a. n.a n.a. n.a. 898 n.a. n.a. n.a. Total n.a. n.a. n.a. n.a. n.a. n.a. n.a. n.a. n.a. n.a. Total n.a. n.a n.a. n.a n.a. n.a. n.a. Female n.a. n.a. n.a. n.a. n.a. n.a. n.a. n.a. n.a. n.a. Female n.a. n.a n.a. n.a. 175 n.a. n.a. n.a. Humanities Male n.a. n.a. n.a. n.a. n.a. n.a. n.a. n.a. n.a. n.a. Swaziland Male n.a. n.a n.a. n.a. 122 n.a. n.a. n.a. and arts Total n.a. n.a. n.a. n.a. n.a. n.a. n.a. n.a. n.a. n.a. Total n.a. n.a n.a. n.a. 297 n.a. n.a. n.a. Female n.a. n.a. n.a. n.a. n.a. n.a. n.a. n.a. n.a. n.a. Female n.a. n.a n.a. n.a. 255 n.a. n.a. n.a. Social Male n.a. n.a. n.a. n.a. n.a. n.a. n.a. n.a. n.a. n.a. Male n.a. n.a n.a. n.a. 289 n.a. n.a. n.a. Science Total n.a. n.a. n.a. n.a. n.a. n.a. n.a. n.a. n.a. n.a. Total n.a. n.a n.a. n.a. 544 n.a. n.a. n.a. Female n.a. n.a. n.a. n.a. n.a. n.a. n.a. n.a. n.a. n.a. Female n.a. n.a n.a. n.a n.a. n.a. Business and Male n.a. n.a. n.a. n.a. n.a. n.a. n.a. n.a. n.a. n.a. Male n.a. n.a n.a. n.a n.a. n.a. Law Total n.a. n.a. n.a. n.a. n.a. n.a. n.a. n.a. n.a. n.a. Total n.a. n.a n.a. n.a n.a. n.a. Female n.a. n.a. n.a. n.a. n.a. n.a. n.a. n.a. n.a. n.a. Female n.a. n.a n.a. n.a n.a. n.a. Health and Male n.a. n.a. n.a. n.a. n.a. n.a. n.a. n.a. n.a. n.a. Male n.a. n.a n.a. n.a n.a. n.a. Welfare Total n.a. n.a. n.a. n.a. n.a. n.a. n.a. n.a. n.a. n.a. Total n.a. n.a n.a. n.a n.a. n.a. Female n.a. n.a. n.a. n.a. n.a. n.a. n.a. n.a. n.a. n.a. Female n.a. n.a n.a. n.a n.a. Male n.a. n.a. n.a. n.a. n.a. n.a. n.a. n.a. n.a. n.a. Total Male n.a. n.a n.a. n.a n.a. Total n.a. n.a. n.a. n.a. n.a. n.a. n.a. n.a. n.a. n.a. Total n.a. n.a n.a. n.a n.a. Female n.a. n.a n.a. Male n.a. n.a n.a. Total n.a. n.a n.a. Female n.a. n.a n.a. Male n.a. n.a n.a. Total n.a. n.a n.a. Female n.a. n.a n.a. Source: Male n.a. n.a n.a. Total n.a. n.a n.a. Female n.a. n.a n.a. Male n.a. n.a n.a. Total n.a. n.a n.a. Female n.a. n.a n.a. Male n.a. n.a n.a. Total n.a. n.a n.a. Female n.a. n.a n.a. National Statistics Offices of Member States Male n.a. n.a n.a. Total n.a. n.a n.a. Female n.a. n.a n.a. Male n.a. n.a n.a. Total n.a. n.a n.a. Female n.a. n.a n.a. Male n.a. n.a n.a. Total n.a. n.a n.a. Female n.a. n.a n.a. Male n.a. n.a n.a. Total n.a. n.a n.a. Female n.a. n.a n.a. Male n.a. n.a n.a. Total n.a. n.a n.a. Female n.a. n.a n.a. Male n.a. n.a n.a. Total n.a. n.a n.a. SADC Secretariat, Education and Skills Section, Directorate of Social and Human Development and Special Programmes (SHD & SP), Table D9. Distribution of Higher Education Enrolment by Key Fields of Study; Enrolment in universities by Key Fields of Study (Full-time equivalents): Botswana, Malawi (2008), Namibia, Swaziland World DataBank, database: Education Statistics - All Indicators: downloaded: 12 October 2014: Angola (2002), Democratic Republic of Congo ( ), Madagascar ( ), Zimbabwe ( ) 49
50 Table (contd.) Higher Education Enrolment in SADC by Key Fields of Study and By Sex (Full-time equivalents), Number, Country United Republic of Tanzania Zambia Key Field of Study Agriculture Education Science Engineering Humanities and arts Social Science Business and Law Health and Welfare Total Agriculture Education Science Engineering Humanities and arts Social Science Business and Law Health and Welfare Total Country Key Field of Study Female n.a. n.a. n.a. n.a. n.a. n.a..... n.a. n.a. Female n.a. n.a. n.a. n.a n.a. n.a. n.a. Male n.a. n.a. n.a. n.a. n.a. n.a. n.a. n.a. n.a. n.a. Agriculture Male n.a. n.a. n.a. n.a n.a. n.a. n.a. Total n.a. n.a. n.a. n.a. n.a. n.a. n.a. n.a. n.a. n.a. Total n.a. n.a. n.a. n.a n.a. n.a. n.a. Female n.a. n.a. n.a. n.a. n.a. n.a. n.a. n.a. n.a. n.a. Female n.a. n.a. n.a. n.a n.a. n.a. n.a. Male n.a. n.a. n.a. n.a. n.a. n.a. n.a. n.a. n.a. n.a. Education Male n.a. n.a. n.a. n.a n.a. n.a. n.a. Total n.a. n.a. n.a. n.a. n.a. n.a. n.a. n.a. n.a. n.a. Total n.a. n.a. n.a. n.a n.a. n.a. n.a. Female n.a. n.a. n.a. n.a. n.a. n.a. n.a. n.a. n.a. n.a. Female n.a. n.a. n.a. n.a n.a. n.a. n.a. Male n.a. n.a. n.a. n.a. n.a. n.a. n.a. n.a. n.a. n.a. Science Male n.a. n.a. n.a. n.a n.a. n.a. n.a. Total n.a. n.a. n.a. n.a. n.a. n.a. n.a. n.a. n.a. n.a. Total n.a. n.a. n.a. n.a n.a. n.a. n.a. Female n.a. n.a. n.a. n.a. n.a. n.a. n.a. n.a. n.a. n.a. Female n.a. n.a. n.a. n.a n.a. n.a. n.a. Male n.a. n.a. n.a. n.a. n.a. n.a. n.a. n.a. n.a. n.a. Engineering Male n.a. n.a. n.a. n.a n.a. n.a. n.a. Total n.a. n.a. n.a. n.a. n.a. n.a. n.a. n.a. n.a. n.a. Total n.a. n.a. n.a. n.a n.a. n.a. n.a. Female n.a. n.a. n.a. n.a. n.a. n.a. n.a. n.a. n.a. n.a. Female n.a. n.a. n.a. n.a n.a. n.a. n.a. Humanities Male n.a. n.a. n.a. n.a. n.a. n.a. n.a. n.a. n.a. n.a. Male n.a. n.a. n.a. n.a n.a. n.a. n.a. and arts Total n.a. n.a. n.a. n.a. n.a. n.a. n.a. n.a. n.a. n.a. Total n.a. n.a. n.a. n.a n.a. n.a. n.a. Zimbabwe Female n.a. n.a. n.a. n.a. n.a. n.a. n.a. n.a. n.a. n.a. Female n.a. n.a. n.a. n.a n.a. n.a. n.a. Male n.a. n.a. n.a. n.a. n.a. n.a. n.a. n.a. n.a. n.a. Social Science Male n.a. n.a. n.a. n.a n.a. n.a. n.a. Total n.a. n.a. n.a. n.a. n.a. n.a. n.a. n.a. n.a. n.a. Total n.a. n.a. n.a. n.a n.a. n.a. n.a. Female n.a. n.a. n.a. n.a. n.a. n.a. n.a. n.a. n.a. n.a. Female n.a. n.a. n.a. n.a. n.a. n.a. n.a. n.a. n.a. n.a. Business and Male n.a. n.a. n.a. n.a. n.a. n.a. n.a. n.a. n.a. n.a. Male n.a. n.a. n.a. n.a. n.a. n.a. n.a. n.a. n.a. n.a. Law Total n.a. n.a. n.a. n.a. n.a. n.a. n.a. n.a. n.a. n.a. Total n.a. n.a. n.a. n.a. n.a. n.a. n.a. n.a. n.a. n.a. Female n.a. n.a. n.a. n.a. n.a. n.a. n.a. n.a. n.a. n.a. Female n.a. n.a. n.a. n.a n.a. n.a. n.a. Health and Male n.a. n.a. n.a. n.a. n.a. n.a. n.a. n.a. n.a. n.a. Male n.a. n.a. n.a. n.a n.a. n.a. n.a. Welfare Total n.a. n.a. n.a. n.a. n.a. n.a. n.a. n.a. n.a. n.a. Total n.a. n.a. n.a. n.a n.a. n.a. n.a. Female n.a. n.a. n.a. n.a. n.a. n.a. n.a. n.a. n.a. n.a. Female n.a. n.a. n.a. n.a n.a. n.a. n.a. n.a. n.a. Unspecified Male n.a. n.a. n.a. n.a. n.a. n.a. n.a. n.a. n.a. n.a. Male n.a. n.a. n.a. n.a n.a. n.a. n.a. n.a. n.a. Programmes Total n.a. n.a. n.a. n.a. n.a. n.a. n.a. n.a. n.a. n.a. Total n.a. n.a. n.a. n.a n.a. n.a. n.a. n.a. n.a. Female n.a. n.a. n.a. n.a. n.a. n.a. n.a. 137 n.a. 203 Female n.a. n.a. n.a. n.a n.a. n.a. n.a. Male n.a. n.a. n.a. n.a. n.a. n.a. n.a. 220 n.a. 383 Total Male n.a. n.a. n.a. n.a n.a. n.a. n.a. Total n.a. n.a. n.a. n.a. n.a. n.a. n.a. 357 n.a. 586 Total n.a. n.a. n.a. n.a n.a. n.a. n.a. Female n.a. n.a. n.a. n.a. n.a. n.a. n.a n.a Male n.a. n.a. n.a. n.a. n.a. n.a. n.a n.a Total n.a. n.a. n.a. n.a. n.a. n.a. n.a n.a Female n.a. n.a. n.a. n.a. n.a. n.a. n.a. 610 n.a. 554 Source: Male n.a. n.a. n.a. n.a. n.a. n.a. n.a n.a Total n.a. n.a. n.a. n.a. n.a. n.a. n.a n.a Female n.a. n.a. n.a. n.a. n.a. n.a. n.a. 27 n.a. 151 Male n.a. n.a. n.a. n.a. n.a. n.a. n.a. 388 n.a Total n.a. n.a. n.a. n.a. n.a. n.a. n.a. 415 n.a Female n.a. n.a. n.a. n.a. n.a. n.a. n.a n.a Male n.a. n.a. n.a. n.a. n.a. n.a. n.a n.a Total n.a. n.a. n.a. n.a. n.a. n.a. n.a n.a Female n.a. n.a. n.a. n.a. n.a. n.a. n.a. n.a. n.a. 128 National Statistics Offices of Member States Male n.a. n.a. n.a. n.a. n.a. n.a. n.a. n.a. n.a. 129 Total n.a. n.a. n.a. n.a. n.a. n.a. n.a. n.a. n.a. 257 Female n.a. n.a. n.a. n.a. n.a. n.a. n.a. 128 n.a. 709 Male n.a. n.a. n.a. n.a. n.a. n.a. n.a. 129 n.a. 478 Total n.a. n.a. n.a. n.a. n.a. n.a. n.a. 257 n.a Female n.a. n.a. n.a. n.a. n.a. n.a. n.a. n.a. n.a. 97 Male n.a. n.a. n.a. n.a. n.a. n.a. n.a. n.a. n.a. 345 Total n.a. n.a. n.a. n.a. n.a. n.a. n.a. n.a. n.a. 436 Female n.a. n.a. n.a. n.a. n.a. n.a. n.a n.a Male n.a. n.a. n.a. n.a. n.a. n.a. n.a n.a Total n.a. n.a. n.a. n.a. n.a. n.a. n.a n.a SADC Secretariat, Education and Skills Section, Directorate of Social and Human Development and Special Programmes (SHD & SP), Table D9. Distribution of Higher Education Enrolment by Key Fields of Study; Enrolment in universities by Key Fields of Study (Fulltime equivalents): Botswana, Malawi (2008), Namibia, Swaziland World DataBank, database: Education Statistics - All Indicators: downloaded: 12 October 2014: Angola (2002), Democratic Republic of Congo ( ), Madagascar ( ), Zimbabwe ( ) 50
51 Table Graduates in Tertiary Education in SADC by Broad Field of Education and By Sex, Number, Country Angola Botswana Broad Field of Education Education Humanities and arts Social sciences, business and law Science Engineering, manufacturing and construction Agriculture Health and welfare Services General programmes Total Education Humanities and arts Social sciences, business and Sex Country Broad Field of Education Sex Male n.a. n.a. n.a. n.a. n.a. n.a. n.a n.a. Male n.a. n.a. n.a. n.a. n.a. n.a. n.a. n.a. n.a. n.a. Female n.a. n.a. n.a. n.a. n.a. n.a. n.a n.a. Education Female n.a. n.a. n.a. n.a. n.a. n.a. n.a. n.a. n.a. n.a. Total n.a. n.a. n.a. n.a. n.a. n.a. n.a n.a. Total n.a. n.a. n.a. n.a. n.a. n.a. n.a. n.a. n.a. n.a. Male n.a. n.a. n.a. n.a. n.a. n.a. n.a n.a. Male n.a. n.a. n.a. n.a. n.a. n.a. n.a. n.a. n.a. n.a. Humanities and Female n.a. n.a. n.a. n.a. n.a. n.a. n.a n.a. Female n.a. n.a. n.a. n.a. n.a. n.a. n.a. n.a. n.a. n.a. arts Total n.a. n.a. n.a. n.a. n.a. n.a. n.a n.a. Total n.a. n.a. n.a. n.a. n.a. n.a. n.a. n.a. n.a. n.a. Male n.a. n.a. n.a. n.a. n.a. n.a. n.a n.a. Male n.a. n.a. n.a. n.a. n.a. n.a. n.a. n.a. n.a. n.a. Social sciences, Female n.a. n.a. n.a. n.a. n.a. n.a. n.a n.a. Female n.a. n.a. n.a. n.a. n.a. n.a. n.a. n.a. n.a. n.a. business and Total n.a. n.a. n.a. n.a. n.a. n.a. n.a n.a. law Total n.a. n.a. n.a. n.a. n.a. n.a. n.a. n.a. n.a. n.a. Male n.a. n.a. n.a. n.a. n.a. n.a. n.a n.a. Male n.a. n.a. n.a. n.a. n.a. n.a. n.a. n.a. n.a. n.a. Female n.a. n.a. n.a. n.a. n.a. n.a. n.a n.a. Science Female n.a. n.a. n.a. n.a. n.a. n.a. n.a. n.a. n.a. n.a. Total n.a. n.a. n.a. n.a. n.a. n.a. n.a n.a. Total n.a. n.a. n.a. n.a. n.a. n.a. n.a. n.a. n.a. n.a. Male n.a. n.a. n.a. n.a. n.a. n.a. n.a n.a. Engineering, Male n.a. n.a. n.a. n.a. n.a. n.a. n.a. n.a. n.a. n.a. Female n.a. n.a. n.a. n.a. n.a. n.a. n.a n.a. manufacturing Female n.a. n.a. n.a. n.a. n.a. n.a. n.a. n.a. n.a. n.a. Democratic and Total n.a. n.a. n.a. n.a. n.a. n.a. n.a n.a. Republic of Total n.a. n.a. n.a. n.a. n.a. n.a. n.a. n.a. n.a. n.a. construction Male n.a. n.a. n.a. n.a. n.a. n.a. n.a n.a. Congo Male n.a. n.a. n.a. n.a. n.a. n.a. n.a. n.a. n.a. n.a. Female n.a. n.a. n.a. n.a. n.a. n.a. n.a n.a. Agriculture Female n.a. n.a. n.a. n.a. n.a. n.a. n.a. n.a. n.a. n.a. Total n.a. n.a. n.a. n.a. n.a. n.a. n.a n.a. Total n.a. n.a. n.a. n.a. n.a. n.a. n.a. n.a. n.a. n.a. Male n.a. n.a. n.a. n.a. n.a. n.a. n.a n.a. Male n.a. n.a. n.a. n.a. n.a. n.a. n.a. n.a. n.a. n.a. Health and Female n.a. n.a. n.a. n.a. n.a. n.a. n.a n.a. Female n.a. n.a. n.a. n.a. n.a. n.a. n.a. n.a. n.a. n.a. welfare Total n.a. n.a. n.a. n.a. n.a. n.a. n.a n.a. Total n.a. n.a. n.a. n.a. n.a. n.a. n.a. n.a. n.a. n.a. Male n.a. n.a. n.a. n.a. n.a. n.a. n.a n.a. Male n.a. n.a. n.a. n.a. n.a. n.a. n.a. n.a. n.a. n.a. Female n.a. n.a. n.a. n.a. n.a. n.a. n.a n.a. Services Female n.a. n.a. n.a. n.a. n.a. n.a. n.a. n.a. n.a. n.a. Total n.a. n.a. n.a. n.a. n.a. n.a. n.a n.a. Total n.a. n.a. n.a. n.a. n.a. n.a. n.a. n.a. n.a. n.a. Male n.a. n.a. n.a. n.a. n.a. n.a. n.a n.a. Male n.a. n.a. n.a. n.a. n.a. n.a. n.a. n.a. n.a. n.a. General Female n.a. n.a. n.a. n.a. n.a. n.a. n.a n.a. Female n.a. n.a. n.a. n.a. n.a. n.a. n.a. n.a. n.a. n.a. programmes Total n.a. n.a. n.a. n.a. n.a. n.a. n.a n.a. Total n.a. n.a. n.a. n.a. n.a. n.a. n.a. n.a. n.a. n.a. Male n.a. n.a. n.a. n.a. n.a. n.a. n.a n.a. Male n.a. n.a. n.a. n.a. n.a. n.a. n.a. n.a. n.a. n.a. Female n.a. n.a. n.a. n.a. n.a. n.a. n.a n.a. Total Female n.a. n.a. n.a. n.a. n.a. n.a. n.a. n.a. n.a. n.a. Total n.a. n.a. n.a. n.a. n.a. n.a. n.a n.a. Total n.a. n.a. n.a. n.a. n.a. n.a. n.a. n.a. n.a. n.a. Male n.a. n.a. n.a. n.a. n.a. 241 n.a. n.a. n.a. n.a. Female n.a. n.a. n.a. n.a. n.a. 530 n.a. n.a. n.a. n.a. Total n.a. n.a. n.a. n.a. n.a n.a. n.a. n.a. Male n.a. n.a. n.a. n.a. n.a. n.a. n.a. n.a. n.a. n.a. Source: Female n.a. n.a. n.a. n.a. n.a. n.a. n.a. n.a. n.a. n.a. Total n.a. n.a. n.a. n.a. n.a. n.a. 465 n.a. n.a. n.a. United Nations Educational, Scientific, and Cultural Organization (UNESCO): Table 16, Male n.a. n.a. n.a. n.a. n.a. 131 n.a. n.a. n.a. n.a. downloaded: 26/08/2011: Angola, Botswana, Lesotho, Female n.a. n.a. n.a. n.a. n.a. 437 n.a. n.a. n.a. n.a. Madagascar, Malawi, Namibia, Swaziland, United Republic of Tanzania law Total n.a. n.a. n.a. n.a. n.a n.a. n.a. n.a. World DataBank, database: Education Statistics - All Indicators: downloaded: 12 October 2014: Male Botswana (2011), Democratic Republic of Congo, Madagascar ( ), Mauritus (2010), Mozambique ( )Namibia, n.a. n.a. n.a. n.a. n.a. n.a. n.a. n.a. n.a. n.a. Zimbabwe ( ) Science Female n.a. n.a. n.a. n.a. n.a. n.a. n.a. n.a. n.a. n.a. Engineering, manufacturing and construction Agriculture Health and welfare Services General programmes Total Total n.a. n.a. n.a. n.a. n.a. n.a. 778 n.a. n.a. n.a. National Statistics Offices of Member States Male n.a. n.a. n.a. n.a. n.a. n.a. n.a. n.a. n.a. n.a. Female n.a. n.a. n.a. n.a. n.a. n.a. n.a. n.a. n.a. n.a. Total n.a. n.a. n.a. n.a. n.a. n.a. 463 n.a. n.a. n.a. Male n.a. n.a. n.a. n.a. n.a. 143 n.a. n.a. n.a. n.a. Female n.a. n.a. n.a. n.a. n.a. 98 n.a. n.a. n.a. n.a. Total n.a. n.a. n.a. n.a. n.a n.a. n.a. n.a. Male n.a. n.a. n.a. n.a. n.a. 202 n.a. n.a. n.a. n.a. Female n.a. n.a. n.a. n.a. n.a. 347 n.a. n.a. n.a. n.a. Total n.a. n.a. n.a. n.a. n.a n.a. n.a. n.a. Male n.a. n.a. n.a. n.a. n.a. n.a. n.a. n.a. n.a. n.a. Female n.a. n.a. n.a. n.a. n.a. n.a. n.a. n.a. n.a. n.a. Total n.a. n.a. n.a. n.a. n.a. n.a. 183 n.a. n.a. n.a. Male n.a. n.a. n.a. n.a. n.a. n.a. n.a. n.a. n.a. n.a. Female n.a. n.a. n.a. n.a. n.a. n.a. n.a. n.a. n.a. n.a. Total n.a. n.a. n.a. n.a. n.a. n.a. n.a. n.a. n.a. n.a. Male n.a. n.a. n.a. n.a. n.a. 717 n.a. n.a. n.a. n.a. Female n.a. n.a. n.a. n.a. n.a n.a. n.a. n.a. n.a. Total n.a. n.a. n.a. n.a. n.a n.a. n.a
52 Table (contd.) Graduates in Tertiary Education in SADC by Broad Field of Education and By Sex, Number, Country Lesotho Madagascar Broad Field of Education Education Humanities and arts Social sciences, business and law Science Engineering, manufacturing and construction Agriculture Health and welfare Services General / Unspecified programmes Total Education Humanities and arts Social sciences, business and law Science Engineering, manufacturing and construction Agriculture Health and welfare Services General programmes Unspecified programmes Total Broad Field of Sex Country Education Sex Male n.a. n.a. n.a. Male n.a. 145 n.a. n.a. n.a. n.a. n.a. n.a. n.a. n.a. Female n.a. n.a. n.a. Education Female n.a. 52 n.a. n.a. n.a. n.a. n.a. n.a. n.a. n.a. Total n.a. n.a. n.a. Total n.a. 197 n.a. n.a. n.a. n.a. n.a. n.a. n.a. n.a. Male n.a. n.a. n.a. Male n.a. n.a. n.a. n.a. n.a. n.a. n.a. n.a. n.a. n.a. Humanities Female n.a. n.a. n.a. Female n.a. n.a. n.a. n.a. n.a. n.a. n.a. n.a. n.a. n.a. and arts Total n.a. n.a. n.a. Total n.a. 231 n.a. n.a. n.a. n.a. n.a. n.a. n.a. n.a. Male n.a. n.a. n.a. Social Male n.a. 123 n.a. n.a. n.a. n.a. n.a. n.a. n.a. n.a. Female n.a. n.a. n.a. sciences, business and Female n.a. 65 n.a. n.a. n.a. n.a. n.a. n.a. n.a. n.a. Total n.a. n.a. n.a. law Total n.a. 188 n.a. n.a. n.a. n.a. n.a. n.a. n.a. n.a. Male n.a. n.a. n.a. Male n.a. 68 n.a. n.a. n.a. n.a. n.a. n.a. n.a. n.a. Female n.a. n.a. n.a. Science Female n.a. 23 n.a. n.a. n.a. n.a. n.a. n.a. n.a. n.a. Total n.a. n.a. n.a. Total n.a. 91 n.a. n.a. n.a. n.a. n.a. n.a. n.a. n.a. Male n.a. n.a. n.a. Engineering, Male n.a. 66 n.a. n.a. n.a. n.a. n.a. n.a. n.a. n.a. manufacturin Female n.a. n.a. n.a. Female n.a. 8 n.a. n.a. n.a. n.a. n.a. n.a. n.a. n.a. g and Malawi Total n.a. n.a. n.a. construction Total n.a. 74 n.a. n.a. n.a. n.a. n.a. n.a. n.a. n.a. Male n.a. n.a. n.a. Male n.a. 90 n.a. n.a. n.a. n.a. n.a. n.a. n.a. n.a. Female n.a. n.a. n.a. Agriculture Female n.a. 49 n.a. n.a. n.a. n.a. n.a. n.a. n.a. n.a. Total n.a. n.a. n.a. Total n.a. 139 n.a. n.a. n.a. n.a. n.a. n.a. n.a. n.a. Male n.a. n.a. n.a. Male n.a. 21 n.a. n.a. n.a. n.a. n.a. n.a. n.a. n.a. Health and Female n.a. n.a. n.a. Female n.a. 81 n.a. n.a. n.a. n.a. n.a. n.a. n.a. n.a. welfare Total n.a. n.a. n.a. Total n.a. 102 n.a. n.a. n.a. n.a. n.a. n.a. n.a. n.a. Male n.a. n.a. n.a. Male n.a. 20 n.a. n.a. n.a. n.a. n.a. n.a. n.a. n.a. Female n.a. n.a. n.a. Services Female n.a. 10 n.a. n.a. n.a. n.a. n.a. n.a. n.a. n.a. Total n.a. n.a. n.a. Total n.a. 30 n.a. n.a. n.a. n.a. n.a. n.a. n.a. n.a. Male n.a. n.a. n.a. n.a n.a. n.a. n.a. n.a. Male n.a. n.a. n.a. n.a. n.a. n.a. n.a. n.a. n.a. n.a. General Female n.a. n.a. n.a. n.a n.a. n.a. n.a. n.a. Female n.a. n.a. n.a. n.a. n.a. n.a. n.a. n.a. n.a. n.a. programmes Total n.a. n.a. n.a. n.a n.a. n.a. n.a. n.a. Total n.a. n.a. n.a. n.a. n.a. n.a. n.a. n.a. n.a. n.a. Male n.a. n.a. n.a. Male n.a. 533 n.a. n.a. n.a. n.a. n.a. n.a. n.a. n.a. Female n.a. n.a. n.a. Total Female n.a. 288 n.a. n.a. n.a. n.a. n.a. n.a. n.a. n.a. Total n.a. n.a. n.a. Total n.a. 821 n.a. n.a. n.a. n.a. n.a. n.a. n.a. n.a. Male n.a. n.a. n.a. Female n.a. n.a. n.a. Total n.a. n.a. n.a. Male n.a. n.a. n.a. Source: Female n.a. n.a. n.a. Total n.a. n.a. n.a. Male n.a. n.a. n.a. Female n.a. n.a. n.a. Total n.a. n.a. n.a. World DataBank, database: Education Statistics - All Indicators: downloaded: 12 October Male n.a. n.a. n.a. 2014: Botswana (2011), Democratic Republic of Congo, Madagascar ( ), Mauritus (2010), Mozambique (2004- Female n.a. n.a. n.a. 2005)Namibia, Zimbabwe ( ) Total n.a. n.a. n.a. National Statistics Offices of Member States Male n.a. n.a. n.a. Female n.a. n.a. n.a. Total n.a. n.a. n.a. Male n.a. n.a. n.a. Female n.a. n.a. n.a. Total n.a. n.a. n.a. Male n.a. n.a. n.a. Female n.a. n.a. n.a. Total n.a. n.a. n.a. Male n.a. n.a. n.a. Female n.a. n.a. n.a. Total n.a. n.a. n.a. Male n.a. n.a. n.a. n.a. n.a. n.a. n.a. n.a. n.a. n.a. Female n.a. n.a. n.a. n.a. n.a. n.a. n.a. n.a. n.a. n.a. Total n.a. n.a. n.a. n.a. n.a. n.a. n.a. n.a. n.a. n.a. Male n.a. n.a. n.a. n.a n.a. n.a. n.a. n.a. Female n.a. n.a. n.a. n.a n.a. n.a. n.a. n.a. Total n.a. n.a. n.a. n.a n.a. n.a. n.a. n.a. Male n.a. n.a. n.a. Female n.a. n.a. n.a. Total n.a. n.a. n.a. United Nations Educational, Scientific, and Cultural Organization (UNESCO): Table 16, downloaded: 26/08/2011: Angola, Botswana, Lesotho, Madagascar, Malawi, Namibia, Swaziland, United Republic of Tanzania 52
53 Table (contd.) Graduates in Tertiary Education in SADC by Broad Field of Education and By Sex, Number, Country Mauritius Mozambique Broad Field of Education Education Humanities and arts Social sciences, business and law Science Engineering, manufacturing and construction Agriculture Health and welfare Services General programmes Total Education Humanities and arts Social sciences, business and law Science Engineering, manufacturing and construction Agriculture Health and welfare Services General programmes Unspecified programmes Total Sex Country Broad Field of Education Sex Male n.a. n.a n.a n.a. Male 407 n.a n.a. n.a. n.a. n.a n.a. Female n.a. n.a n.a n.a. Education Female 710 n.a n.a. n.a. n.a. n.a n.a. Total n.a. n.a n.a n.a. Total n.a n.a. n.a. n.a. n.a n.a. Male n.a. n.a. 130 n.a n.a. Male 42 n.a. 144 n.a. n.a. n.a. n.a n.a. Humanities Female n.a. n.a. 444 n.a n.a. Female 87 n.a. 264 n.a. n.a. n.a. n.a n.a. and arts Total n.a. n.a. 574 n.a n.a. Total 129 n.a. 408 n.a. n.a. n.a. n.a n.a. Male n.a. n.a. 812 n.a n.a. Social Male 246 n.a. 782 n.a. n.a. n.a. n.a n.a. sciences, Female n.a. n.a n.a n.a. business and Female 562 n.a n.a. n.a. n.a. n.a n.a. Total n.a. n.a n.a n.a. law Total 808 n.a n.a. n.a. n.a. n.a n.a. Male n.a. n.a. 279 n.a n.a. Male 60 n.a. 28 n.a. n.a. n.a. n.a n.a. Female n.a. n.a. 210 n.a n.a. Science Female 43 n.a. 42 n.a. n.a. n.a. n.a n.a. Total n.a. n.a. 489 n.a n.a. Total 103 n.a. 70 n.a. n.a. n.a. n.a n.a. Male n.a. n.a. 252 n.a n.a. Engineering, Male 73 n.a. 62 n.a. n.a. n.a. n.a n.a. manufacturin Female n.a. n.a. 59 n.a n.a. g and Female 23 n.a. 14 n.a. n.a. n.a. n.a n.a. Namibia Total n.a. n.a. 311 n.a n.a. construction Total 96 n.a. 76 n.a. n.a. n.a. n.a n.a. Male n.a. n.a. 24 n.a n.a. Male 87 n.a. 79 n.a. n.a. n.a. n.a n.a. Female n.a. n.a. 71 n.a n.a. Agriculture Female 62 n.a. 77 n.a. n.a. n.a. n.a n.a. Total n.a. n.a. 95 n.a n.a. Total 149 n.a. 156 n.a. n.a. n.a. n.a n.a. Male n.a. n.a. 83 n.a n.a. Male 28 n.a. 24 n.a. n.a. n.a. n.a n.a. Health and Female n.a. n.a. 91 n.a n.a. Female 129 n.a. 125 n.a. n.a. n.a. n.a n.a. welfare Total n.a. n.a. 174 n.a n.a. Total 157 n.a. 149 n.a. n.a. n.a. n.a n.a. Male n.a. n.a. n.a. n.a n.a. Male 22 n.a. 12 n.a. n.a. n.a. n.a n.a. Female n.a. n.a. n.a. n.a n.a. Services Female 9 n.a. 9 n.a. n.a. n.a. n.a n.a. Total n.a. n.a. 0 n.a n.a. Total 31 n.a. 21 n.a. n.a. n.a. n.a n.a. Male n.a. n.a. n.a. n.a. 17 n.a. n.a. n.a. n.a. n.a. Male n.a. n.a. n.a. n.a. n.a. n.a. n.a. n.a. n.a. n.a. General Female n.a. n.a. n.a. n.a. 78 n.a. n.a. n.a. n.a. n.a. Female n.a. n.a. n.a. n.a. n.a. n.a. n.a. n.a. n.a. n.a. programmes Total n.a. n.a. 0 n.a. 95 n.a. n.a. n.a. n.a. n.a. Total n.a. n.a. 51 n.a. n.a. n.a. n.a. n.a. n.a. n.a. Male n.a. n.a n.a n.a. Male 965 n.a. ### n.a. n.a. n.a. n.a n.a. Female n.a. n.a n.a n.a. Total Female n.a. ### n.a. n.a. n.a. n.a n.a. Total n.a. n.a n.a n.a. Total n.a. ### n.a. n.a. n.a. n.a n.a. Male Female Total Male N/d Source: Female Total Male Female Total Male Female Total National Statistics Offices of Member States Male Female Total Male Female Total Male Female Total Male Female Total Male 209 n.a. n.a. n.a. 60 n.a. n.a. n.a. n.a. n.a. Female 40 n.a. n.a. n.a. 46 n.a. n.a. n.a. n.a. n.a. Total n.a. n.a. 106 n.a. n.a. n.a. n.a. n.a. Male n.a. n.a. n.a. n.a. n.a. n.a. n.a. n.a. 0 n.a. Female n.a. n.a. n.a. n.a. n.a. n.a. n.a. n.a. 2 n.a. Total n.a. n.a. n.a. n.a. n.a. n.a. n.a. n.a. 2 n.a. Male Female Total United Nations Educational, Scientific, and Cultural Organization (UNESCO): Table 16, downloaded: 26/08/2011: Angola, Botswana, Lesotho, Madagascar, Malawi, Namibia, Swaziland, United Republic of Tanzania World DataBank, database: Education Statistics - All Indicators: downloaded: 12 October 2014: Botswana (2011), Democratic Republic of Congo, Madagascar ( ), Mauritus (2010), Mozambique ( )Namibia, Zimbabwe ( ) 53
54 Table (contd.) Graduates in Tertiary Education in SADC by Broad Field of Education and By Sex, Number, Country Seychelles South Africa Broad Field of Education Education Humanities and arts Social sciences, business and law Science Engineering, manufacturing and construction Agriculture Health and welfare Services General programmes Total Education Humanities and arts Social sciences, business and law Science Engineering, manufacturing and construction Agriculture Health and welfare Services Unspecified / unknown Total Sex Country Broad Field of Education Sex Male n.a. n.a. n.a. n.a. n.a. n.a. n.a. n.a. n.a. 7 Male 336 n.a. n.a. n.a. n.a. n.a n.a. n.a. Female n.a. n.a. n.a. n.a. n.a. n.a. n.a. n.a. n.a. 40 Education Female 432 n.a. n.a. n.a. n.a. n.a n.a. n.a. Total n.a. n.a. n.a. n.a. 47 Total 768 n.a. n.a. n.a. n.a. n.a n.a. n.a. Male n.a. n.a. n.a. n.a. n.a. n.a. n.a. n.a. n.a. 31 Male 39 n.a. n.a. n.a. n.a. n.a. 31 n.a. n.a. n.a. Humanities and Female n.a. n.a. n.a. n.a. n.a. n.a. n.a. n.a. n.a. 51 Female 73 n.a. n.a. n.a. n.a. n.a. 36 n.a. n.a. n.a. arts Total n.a. n.a. 82 Total 112 n.a. n.a. n.a. n.a. n.a. 67 n.a. n.a. n.a. Male n.a. n.a. n.a. n.a. n.a. n.a. n.a. n.a. n.a. 66 Social sciences, Male 321 n.a. n.a. n.a. n.a. n.a. 57 n.a. n.a. n.a. Female n.a. n.a. n.a. n.a. n.a. n.a. n.a. n.a. n.a. 293 business and Female 346 n.a. n.a. n.a. n.a. n.a. 59 n.a. n.a. n.a. Total n.a. n.a. 359 law Total 667 n.a. n.a. n.a. n.a. n.a. 116 n.a. n.a. n.a. Male n.a. n.a. n.a. n.a. n.a. n.a. n.a. n.a. n.a. 34 Male 31 n.a. n.a. n.a. n.a. n.a. 32 n.a. n.a. n.a. Female n.a. n.a. n.a. n.a. n.a. n.a. n.a. n.a. n.a. 15 Science Female 13 n.a. n.a. n.a. n.a. n.a. 16 n.a. n.a. n.a. Total n.a. n.a. 49 Total 44 n.a. n.a. n.a. n.a. n.a. 48 n.a. n.a. n.a. Male n.a. n.a. n.a. n.a. n.a. n.a. n.a. n.a. n.a. 175 Engineering, Male 4 n.a. n.a. n.a. n.a. n.a. 478 n.a. n.a. n.a. manufacturing Female n.a. n.a. n.a. n.a. n.a. n.a. n.a. n.a. n.a. 35 and Female 2 n.a. n.a. n.a. n.a. n.a. 381 n.a. n.a. n.a. Swaziland Total n.a. n.a. 210 construction Total 6 n.a. n.a. n.a. n.a. n.a. 832 n.a. n.a. n.a. Male n.a. n.a. n.a. n.a. n.a. n.a. n.a. n.a. n.a. 74 Male 77 n.a. n.a. n.a. n.a. n.a. 99 n.a. n.a. n.a. Female n.a. n.a. n.a. n.a. n.a. n.a. n.a. n.a. n.a. 29 Agriculture Female 41 n.a. n.a. n.a. n.a. n.a. 92 n.a. n.a. n.a. Total n.a. n.a. 103 Total 118 n.a. n.a. n.a. n.a. n.a. 191 n.a. n.a. n.a. Male n.a. n.a. n.a. n.a. n.a. n.a. n.a. n.a. n.a. 14 Male 23 n.a. n.a. n.a. n.a. n.a. 130 n.a. n.a. n.a. Health and Female n.a. n.a. n.a. n.a. n.a. n.a. n.a. n.a. n.a. 73 Female 80 n.a. n.a. n.a. n.a. n.a. 197 n.a. n.a. n.a. welfare Total n.a. n.a. 87 Total 103 n.a. n.a. n.a. n.a. n.a. 327 n.a. n.a. n.a. Male n.a. n.a. n.a. n.a. n.a. n.a. n.a. n.a. n.a. 34 Male 16 n.a. n.a. n.a. n.a. n.a. n.a. n.a. n.a. n.a. Female n.a. n.a. n.a. n.a. n.a. n.a. n.a. n.a. n.a. 153 Services Female 9 n.a. n.a. n.a. n.a. n.a. n.a. n.a. n.a. n.a. Total n.a. n.a. 187 Total 25 n.a. n.a. n.a. n.a. n.a. n.a. n.a. n.a. n.a. Male n.a. n.a. n.a. n.a. n.a. n.a. n.a. n.a. n.a. 0 Male n.a. n.a. n.a. n.a. n.a. n.a. n.a. n.a. n.a. n.a. General Female n.a. n.a. n.a. n.a. n.a. n.a. n.a. n.a. n.a. 0 Female n.a. n.a. n.a. n.a. n.a. n.a. n.a. n.a. n.a. n.a. programmes Total n.a. 0 Total n.a. n.a. n.a. n.a. n.a. n.a. n.a. n.a. n.a. n.a. Male n.a. n.a. n.a. n.a. n.a. n.a. n.a. n.a. n.a. 435 Male 831 n.a. n.a. n.a. n.a. n.a n.a. n.a. Female n.a. n.a. n.a. n.a. n.a. n.a. n.a. n.a. n.a. 689 Total Female 987 n.a. n.a. n.a. n.a. n.a n.a. n.a. Total n.a. n.a. n.a. n.a Total n.a. n.a. n.a. n.a. n.a n.a. Male n.a. n.a. n.a. Female n.a. n.a. n.a. Total n.a. n.a. n.a. Male n.a. n.a. n.a. Source: Female n.a. n.a. n.a. Total n.a. n.a. n.a. Male n.a. n.a. n.a. Female n.a. n.a. n.a. Total n.a. n.a. n.a. Male n.a. n.a. n.a. Female n.a. n.a. n.a. Total n.a. n.a. n.a. National Statistics Offices of Member States Male n.a. n.a. n.a. Female n.a. n.a. n.a. Total n.a. n.a. n.a. Male n.a. n.a. n.a. Female n.a. n.a. n.a. Total n.a. n.a. n.a. Male n.a. n.a. n.a. Female n.a. n.a. n.a. Total n.a. n.a. n.a. Male n.a. n.a. n.a. Female n.a. n.a. n.a. Total n.a. n.a. n.a. Male n.a. n.a. n.a. Female n.a. n.a. n.a. Total n.a. n.a. n.a. Male n.a. n.a. n.a. Female n.a. n.a. n.a. Total n.a. n.a. n.a. United Nations Educational, Scientific, and Cultural Organization (UNESCO): Table 16, downloaded: 26/08/2011: Angola, Botswana, Lesotho, Madagascar, Malawi, Namibia, Swaziland, United Republic of Tanzania World DataBank, database: Education Statistics - All Indicators: downloaded: 12 October 2014: Botswana (2011), Democratic Republic of Congo, Madagascar ( ), Mauritus (2010), Mozambique ( )Namibia, Zimbabwe ( ) 54
55 Table (contd.)graduates in Tertiary Education in SADC by Broad Field of Education and By Sex, Number, Country United Republic of Tanzania Zambia Broad Field of Education Education Humanities and arts Social sciences, business and law Science Engineering, manufacturing and construction Agriculture Health and welfare Services General programmes Total Education Humanities and arts Social sciences, business and law Science Engineering, manufacturing and construction Agriculture Health and welfare Services General programmes Total Sex Country Broad Field of Education Sex Male n.a. n.a. n.a. n.a. n.a. n.a. n.a. n.a. n.a. n.a. Male n.a. n.a. n.a. n.a n.a. n.a. n.a. Female n.a. n.a. n.a. n.a. n.a. n.a. n.a. n.a. n.a. n.a. Education Female n.a. n.a. n.a. n.a n.a. n.a. n.a. Total n.a. n.a. n.a. n.a. n.a. n.a. n.a. n.a. n.a. n.a. Total n.a. n.a. n.a. n.a n.a. n.a. n.a. Male n.a. n.a. n.a. n.a. n.a. n.a. n.a. n.a. n.a. n.a. Male n.a. n.a. n.a. n.a n.a. n.a. n.a. Humanities and Female n.a. n.a. n.a. n.a. n.a. n.a. n.a. n.a. n.a. n.a. Female n.a. n.a. n.a. n.a n.a. n.a. n.a. arts Total n.a. n.a. n.a. n.a. n.a. n.a. n.a. n.a. n.a. n.a. Total n.a. n.a. n.a. n.a n.a. n.a. n.a. Male n.a. n.a. n.a. n.a. n.a. n.a. n.a. n.a. n.a. n.a. Male n.a. n.a. n.a. n.a n.a. n.a. n.a. Female n.a. n.a. n.a. n.a. n.a. n.a. n.a. n.a. n.a. n.a. Social sciences, business and law Female n.a. n.a. n.a. n.a n.a. n.a. n.a. Total n.a. n.a. n.a. n.a. n.a. n.a. n.a. n.a. n.a. n.a. Total n.a. n.a. n.a. n.a n.a. n.a. n.a. Male n.a. n.a. n.a. n.a. n.a. n.a. n.a. n.a. n.a. n.a. Male n.a. n.a. n.a. n.a n.a. n.a. n.a. Female n.a. n.a. n.a. n.a. n.a. n.a. n.a. n.a. n.a. n.a. Science Female n.a. n.a. n.a. n.a n.a. n.a. n.a. Total n.a. n.a. n.a. n.a. n.a. n.a. n.a. n.a. n.a. n.a. Total n.a. n.a. n.a. n.a n.a. n.a. n.a. Male n.a. n.a. n.a. n.a. n.a. n.a. n.a. n.a. n.a. n.a. Engineering, Male n.a. n.a. n.a. n.a n.a. n.a. n.a. Female n.a. n.a. n.a. n.a. n.a. n.a. n.a. n.a. n.a. n.a. manufacturing Female n.a. n.a. n.a. n.a n.a. n.a. n.a. Total n.a. n.a. n.a. n.a. n.a. n.a. n.a. n.a. n.a. n.a. Zimbabwe and construction Total n.a. n.a. n.a. n.a n.a. n.a. n.a. Male n.a. n.a. n.a. n.a. n.a. n.a. n.a. n.a. n.a. n.a. Male n.a. n.a. n.a. n.a n.a. n.a. n.a. Female n.a. n.a. n.a. n.a. n.a. n.a. n.a. n.a. n.a. n.a. Agriculture Female n.a. n.a. n.a. n.a n.a. n.a. n.a. Total n.a. n.a. n.a. n.a. n.a. n.a. n.a. n.a. n.a. n.a. Total n.a. n.a. n.a. n.a n.a. n.a. n.a. Male n.a. n.a. n.a. n.a. n.a. n.a. n.a. n.a. n.a. n.a. Male n.a. n.a. n.a. n.a n.a. n.a. n.a. Health and Female n.a. n.a. n.a. n.a. n.a. n.a. n.a. n.a. n.a. n.a. Female n.a. n.a. n.a. n.a n.a. n.a. n.a. welfare Total n.a. n.a. n.a. n.a. n.a. n.a. n.a. n.a. n.a. n.a. Total n.a. n.a. n.a. n.a n.a. n.a. n.a. Male n.a. n.a. n.a. n.a. n.a. n.a. n.a. n.a. n.a. n.a. Male n.a. n.a. n.a. n.a n.a. n.a. n.a. Female n.a. n.a. n.a. n.a. n.a. n.a. n.a. n.a. n.a. n.a. Services Female n.a. n.a. n.a. n.a n.a. n.a. n.a. Total n.a. n.a. n.a. n.a. n.a. n.a. n.a. n.a. n.a. n.a. Total n.a. n.a. n.a. n.a n.a. n.a. n.a. Male n.a. n.a. n.a. n.a. n.a. n.a. n.a. n.a. n.a. n.a. Male n.a. n.a. n.a. n.a. n.a. n.a. n.a. n.a. n.a. n.a. General Female n.a. n.a. n.a. n.a. n.a. n.a. n.a. n.a. n.a. n.a. Female n.a. n.a. n.a. n.a. n.a. n.a. n.a. n.a. n.a. n.a. programmes Total n.a. n.a. n.a. n.a. n.a. n.a. n.a. n.a. n.a. n.a. Total n.a. n.a. n.a. n.a. n.a. n.a. n.a. n.a. n.a. n.a. Male n.a. n.a. n.a. n.a. n.a. n.a. n.a. n.a. n.a. n.a. Male n.a. n.a. n.a. n.a n.a. n.a. n.a. Female n.a. n.a. n.a. n.a. n.a. n.a. n.a. n.a. n.a. n.a. Total Female n.a. n.a. n.a. n.a n.a. n.a. n.a. Total n.a. n.a. n.a. n.a. n.a. n.a. n.a. n.a. n.a. n.a. Total n.a. n.a. n.a. n.a n.a. n.a. n.a. Male n.a. n.a. n.a. n.a. n.a. n.a. n.a. n.a. n.a. n.a. Female n.a. n.a. n.a. n.a. n.a. n.a. n.a. n.a. n.a. n.a. Total n.a. n.a. n.a. n.a. n.a. n.a. n.a. n.a. n.a. n.a. Male n.a. n.a. n.a. n.a. n.a. n.a. n.a. n.a. n.a. n.a. Source: Female n.a. n.a. n.a. n.a. n.a. n.a. n.a. n.a. n.a. n.a. Total n.a. n.a. n.a. n.a. n.a. n.a. n.a. n.a. n.a. n.a. Male n.a. n.a. n.a. n.a. n.a. n.a. n.a. n.a. n.a. n.a. Female n.a. n.a. n.a. n.a. n.a. n.a. n.a. n.a. n.a. n.a. Total n.a. n.a. n.a. n.a. n.a. n.a. n.a. n.a. n.a. n.a. Male n.a. n.a. n.a. n.a. n.a. n.a. n.a. n.a. n.a. n.a. Female n.a. n.a. n.a. n.a. n.a. n.a. n.a. n.a. n.a. n.a. Total n.a. n.a. n.a. n.a. n.a. n.a. n.a. n.a. n.a. n.a. National Statistics Offices of Member States Male n.a. n.a. n.a. n.a. n.a. n.a. n.a. n.a. n.a. n.a. Female n.a. n.a. n.a. n.a. n.a. n.a. n.a. n.a. n.a. n.a. Total n.a. n.a. n.a. n.a. n.a. n.a. n.a. n.a. n.a. n.a. Male n.a. n.a. n.a. n.a. n.a. n.a. n.a. n.a. n.a. n.a. Female n.a. n.a. n.a. n.a. n.a. n.a. n.a. n.a. n.a. n.a. Total n.a. n.a. n.a. n.a. n.a. n.a. n.a. n.a. n.a. n.a. Male n.a. n.a. n.a. n.a. n.a. n.a. n.a. n.a. n.a. n.a. Female n.a. n.a. n.a. n.a. n.a. n.a. n.a. n.a. n.a. n.a. Total n.a. n.a. n.a. n.a. n.a. n.a. n.a. n.a. n.a. n.a. Male n.a. n.a. n.a. n.a. n.a. n.a. n.a. n.a. n.a. n.a. Female n.a. n.a. n.a. n.a. n.a. n.a. n.a. n.a. n.a. n.a. Total n.a. n.a. n.a. n.a. n.a. n.a. n.a. n.a. n.a. n.a. Male n.a. n.a. n.a. n.a. n.a. n.a. n.a. n.a. n.a. n.a. Female n.a. n.a. n.a. n.a. n.a. n.a. n.a. n.a. n.a. n.a. Total n.a. n.a. n.a. n.a. n.a. n.a. n.a. n.a. n.a. n.a. Male n.a. n.a. n.a. n.a. n.a. n.a. n.a. n.a. n.a. n.a. Female n.a. n.a. n.a. n.a. n.a. n.a. n.a. n.a. n.a. n.a. Total n.a. n.a. n.a. n.a. n.a. n.a. n.a. n.a. n.a. n.a. United Nations Educational, Scientific, and Cultural Organization (UNESCO): Table 16, downloaded: 26/08/2011: Angola, Botswana, Lesotho, Madagascar, Malawi, Namibia, Swaziland, United Republic of Tanzania World DataBank, database: Education Statistics - All Indicators: downloaded: 12 October 2014: Botswana (2011), Democratic Republic of Congo, Madagascar ( ), Mauritus (2010), Mozambique ( )Namibia, Zimbabwe ( ) 55
56 2.2 HEALTH 56
57 Table Infant Mortality Rate in SADC By Year and Sex, Per Thousand Live Births, Country Total Male Female Total Male Female Total Male Female Total Male Female Total Male Female Angola n.a. n.a n.a. n.a n.a. n.a. Botswana 45.5 n.a. n.a n.a. n.a n.a. n.a n.a. n.a Democratic Republic of Congo n.a. n.a n.a. n.a n.a. n.a n.a. n.a Lesotho Madagascar 51.3 n.a. n.a n.a. n.a n.a. n.a n.a. n.a Malawi 67.8 n.a. n.a n.a. n.a n.a. n.a n.a. n.a Mauritius Mozambique 85.5 n.a. n.a Namibia 39.8 n.a. n.a n.a. n.a n.a. n.a n.a. n.a Seychelles South Africa 48.6 n.a. n.a n.a. n.a n.a. n.a n.a. n.a n.a. n.a. Swaziland 75.6 n.a. n.a United Republic of Tanzania 51.0 n.a. n.a n.a. n.a n.a. n.a n.a. n.a n.a. n.a. Zambia 73.0 n.a. n.a n.a. n.a n.a. n.a n.a. n.a Zimbabwe 57.2 n.a. n.a n.a. n.a n.a. n.a n.a. n.a n.a. n.a. Table (contd.) Infant Mortality Rate in SADC By Year and Sex, Per Thousand Live Births, Country Total Male Female Total Male Female Total Male Female Total Male Female Total Male Female Angola n.a. n.a n.a. n.a n.a. n.a Botswana Democratic Republic of Congo n.a. n.a Lesotho Madagascar 42.2 n.a. n.a n.a. n.a Malawi 49.2 n.a. n.a n.a. n.a n.a. n.a. Mauritius Mozambique Namibia 29.2 n.a. n.a n.a. n.a Seychelles South Africa 39.7 n.a. n.a n.a. n.a n.a. n.a n.a n.a 34.4 n.a n.a Swaziland United Republic of Tanzania 51.0 n.a. n.a Zambia 58.7 n.a. n.a Zimbabwe 58.6 n.a. n.a n.a n.a Source: World DataBank, Health Nutrition and Population Statistics: downloaded 17 October 2013: Data for (Angola, Botswana, Democratic Republic of Congo, Lesotho, Madagascar, Malawi, Namibia, Zambia), Data for (Mozambique, Swazailand), Data for (Seychelles, South Africa), Swaziland, Data for (United Republic of Tanzania), Data for 1980, , , 2011 (Zimbabwe) World DataBank, Health Nutrition and Population Statistics, database: Education Statistics - All Indicators: downloaded: 12 October 2014: Data for 2013 for: Botswana, Democratic Republic of Congo, Namibia, South Africa World DataBank, Health Nutrition and Population Statistics, database: Education Statistics - All Indicators: downloaded: 6 July 2016: Democratic Republic of Congo (2015), Madagascar (2014 Total), Namibia (2014 Total) National Statistics Offices of Member States 57
58 Table Under-Five Mortality Rate in SADC By Year and Sex, Per Thousand Live Births, Country Total Male Female Total Male Female Total Male Female Total Male Female Total Male Female Angola n.a. n.a n.a. n.a n.a. n.a n.a. n.a. Botswana 63.1 n.a. n.a n.a. n.a n.a. n.a n.a. n.a Democratic Republic of Congo n.a. n.a n.a. n.a n.a. n.a n.a. n.a Lesotho Madagascar 76.7 n.a. n.a n.a. n.a n.a. n.a n.a. n.a Malawi n.a. n.a n.a. n.a n.a. n.a n.a. n.a Mauritius Mozambique n.a. n.a n.a. n.a n.a. n.a n.a. n.a Namibia 61.5 n.a. n.a n.a. n.a n.a. n.a n.a. n.a Seychelles South Africa 71.3 n.a. n.a n.a. n.a n.a. n.a n.a. n.a n.a. n.a. Swaziland n.a. n.a United Republic of Tanzania 81.0 n.a. n.a n.a. n.a n.a. n.a n.a. n.a n.a. n.a. Zambia n.a. n.a n.a. n.a n.a. n.a n.a. n.a Zimbabwe 95.8 n.a. n.a n.a. n.a n.a. n.a n.a. n.a Table (contd.) Under-Five Mortality Rate in SADC By Year and Sex, Per Thousand Live Births, Country Total Male Female Total Male Female Total Male Female Total Male Female Total Male Female Angola n.a. n.a n.a. n.a n.a. n.a n.a. n.a n.a. n.a. Botswana Democratic Republic of Congo n.a. n.a Lesotho n.a. n.a Madagascar 60.6 n.a. n.a n.a. n.a. n.a Malawi 77.1 n.a. n.a n.a. n.a n.a. n.a. Mauritius Mozambique n.a n.a n.a n.a n.a Namibia 41.3 n.a. n.a n.a. n.a Seychelles South Africa 55.6 n.a. n.a n.a. n.a n.a n.a 46.6 n.a n.a Swaziland United Republic of Tanzania 81.0 n.a. n.a Zambia 95.0 n.a. n.a n.a. n.a n.a. n.a Zimbabwe 95.2 n.a. n.a n.a n.a Source: World DataBank, Health Nutrition and Population Statistics: downloaded 17 October 2013: Angola, Botswana, Democratic Republic of Congo, Lesotho, Madagascar, Malawi, Mozambique, Namibia, South Africa ( ), Swaziland ( ), United Republic of Tanzania ( ), Zambia, Zimbabwe World DataBank, Health Nutrition and Population Statistics: downloaded 6 July 2016: Democratic Republic of Congo (2015), Lesotho ( Total), Mozambique (2014 Total), Namibia (2014 Total), Zambia (2015) National Statistics Offices of Member States 58
59 Table Maternal Mortality Ratio in SADC By Year, Per Hundred Thousand Live Births, Country Angola Botswana Democratic Republic of Congo Lesotho Madagascar Malawi n.a. Mauritius Mozambique n.a. Namibia Seychelles South Africa n.a. n.a. 410 n.a Swaziland United Republic of Tanzania Zambia n.a n.a. 483 n.a. n.a Zimbabwe n.a. n.a. 790 n.a Source: World DataBank, Health Nutrition and Population Statistics: downloaded 18 October 2013: Angola ( , 2010), Democratic Republic of Congo ( ), Madagascar ( ), Mozambique (2010), Namibia (2010), South Africa (2010), Swaziland (2010), Zambia (2010) World DataBank, Health Nutrition and Population Statistics: downloaded 6 July 2016: Angola ( , , 2015), Democratic Republic of Congo ( ), Madagascar ( ), Malawi (2007, 2009, ), Mozambique (2006, 2009, 2012, 2014), Namibia ( , 2009, , 2014), South Africa ( , ), Swaziland (2006, 2009, , ), Zambia (2015), Zimbabwe (2011) Trends in Maternal Mortality: Estimates Developed by WHO, UNICEF, UNFPA and the World Bank.Gender Statistics Database, The World Bank: Downloaded: 14 April 2011: Angola (2008), Malawi, Namibia ( ), Zambia ( ) Millennium Development Goals: downloaded 11 October 2014: Datta for 2013 for: Angola, Democratic Republic of Congo, Mozambique, Namibia, South Africa, Zimbawe National Statistics Offices of Member States 59
60 Table Percentage of Children in SADC Immunized for BCG, (% of One-Year-Old Children), Country Angola n.a Botswana Democratic Republic of Congo n.a. Lesotho Madagascar n.a. n.a. Malawi n.a. Mauritius Mozambique Namibia n.a. n.a. Seychelles South Africa n.a. n.a. Swaziland United Republic of Tanzania Zambia n.a. Zimbabwe Source: World DataBank, Health Nutrition and Population Statistics, database: Education Statistics - All Indicators: downloaded: 12 October 2014: Angola (2013), Data for for: Democratic Republic of Congo, Lesotho, Madagascar, Namibia, South Africa, Zimbabwe National Statistics Offices of Member States 60
61 Table Percentage of Children in SADC Immunized for DPT, (% of Children Ages Months), Country Angola Botswana Democratic Republic of Congo n.a. n.a. Lesotho Madagascar n.a. n.a. Malawi n.a. Mauritius Mozambique Namibia n.a. n.a. Seychelles South Africa n.a. n.a. Swaziland United Republic of Tanzania Zambia n.a. Zimbabwe Source: World DataBank, Health Nutrition and Population Statistics, database: Education Statistics - All Indicators: downloaded: 12 October 2014: Angola (2013), Data for for: Democratic Republic of Congo, Lesotho, Madagascar, Namibia, South Africa, Zimbabwe National Statistics Offices of Member States 61
62 Table Percentage of Children in SADC Immunized for HepB3, (% of One-Year-Old Children), Country Angola n.a Botswana Democratic Republic of Congo n.a n.a. Lesotho n.a n.a. Madagascar n.a. n.a. Malawi n.a. Mauritius Mozambique n.a. n.a n.a Namibia n.a. n.a. n.a. n.a n.a. n.a. Seychelles South Africa n.a. n.a. Swaziland United Republic of Tanzania Zambia n.a. Zimbabwe Source: World DataBank, Health Nutrition and Population Statistics, database: Education Statistics - All Indicators: downloaded: 12 October 2014: Data for for: Angola ( ), Democratic Republic of Congo, Lesotho, Madagascar, Namibia, South Africa, Zimbabwe ( ); Malawi (2012) National Statistics Offices of Member States 62
63 Table Percentage of Children in SADC Immunized for Measles, (% of Children Ages Months), Country Angola Botswana Democratic Republic of Congo n.a. Lesotho Madagascar n.a. n.a. Malawi n.a. Mauritius Mozambique Namibia n.a. n.a. Seychelles South Africa n.a. n.a. Swaziland United Republic of Tanzania Zambia n.a. Zimbabwe Source: World DataBank, Health Nutrition and Population Statistics, database: Education Statistics - All Indicators: downloaded: 12 October 2014: Data for for: Democratic Republic of Congo ( ), Lesotho, Madagascar, Namibia, South Africa, Zimbabwe National Statistics Offices of Member States 63
64 Table Percentage of Children in SADC Immunized for Pol3, (% of One-Year-Old Children), Country Angola Botswana n.a. Democratic Republic of Congo n.a. Lesotho Madagascar n.a. n.a. Malawi n.a. Mauritius Mozambique Namibia n.a. n.a. Seychelles South Africa n.a. n.a. Swaziland United Republic of Tanzania Zambia n.a. Zimbabwe Source: World DataBank, Health Nutrition and Population Statistics, database: Education Statistics - All Indicators: downloaded: 12 October 2014: Angola (2013), Democratic Republic of Congo ( ), Lesotho ( ); Data for for: Madagascar, Namibia, South Africa, Zimbabwe National Statistics Offices of Member States 64
65 Table Prevalence of Tuberculosis in SADC, Per Hundred Thousand Persons, Country Angola n.a. Botswana Democratic Republic of Congo n.a. n.a. n.a. n.a. Lesotho n.a. n.a. n.a. Madagascar n.a. n.a. n.a. Malawi n.a. n.a. n.a. Mauritius n.a. n.a. Mozambique n.a. n.a. n.a. Namibia n.a. n.a. n.a. Seychelles South Africa n.a. n.a. n.a. Swaziland n.a. n.a. 605 United Republic of Tanzania n.a Zambia n.a. n.a. n.a. Zimbabwe n.a. n.a. n.a. Notes: Indicator: Tuberculosis prevalence rate (per 100,000 population, WHO) Row: Country Column: Year; midpoint Source: Millennium Development Goals Database United Nations Statistics Division, downloaded 21 October 2013: Angola, Botswana (2011), Democratic Republic of Congo, Lesotho (2011), Madagascar, Mauritius ( ), Namibia, South Africa, Swaziland (2011), United Republic of Tanzania (2011), Zambia, Zimbabwe Millennium Development Goals: downloaded 11 October 2014: Democratic Republic of Congo,Madagascar and Datta for 2012 for: Lesotho, Malawi, Mauritius, Mozambique, Namibia, South Africa, United Republic of Tanzania, Zambia, Zimbabwe National Statistics Offices of Member States 65
66 Table Incidence of Tuberculosis in SADC, (Per Hundred Thousand Persons), Country Angola n.a. n.a. n.a. Botswana Democratic Republic of Congo n.a. n.a. n.a. Lesotho n.a. n.a. Madagascar n.a. n.a. n.a. Malawi n.a n.a n.a. Mauritius Mozambique n.a. n.a n.a. Namibia n.a. n.a. n.a. Seychelles South Africa n.a. n.a. n.a. Swaziland n.a 733 United Republic of Tanzania Zambia n.a. n.a. Zimbabwe n.a. n.a. n.a. Source: Midpoint estimates, Millennium Development Goals Database United Nations Statistics Division, downloaded 21 October 2013: Angola, Botswana (2011), Democratic Republic of Congo, Lesotho (2011), Madagascar, Malawi ( ), Namibia, South Africa, Swaziland (2011), United Republic of Tanzania (2011), Zambia, Zimbabwe World databank - Health Nutrition and Population Statistics (HNP), database: Education Statistics - All Indicators: downloaded: 12 October 2014: Data for 2012 or: Angola, Democratic Republic of Congo, Lesotho, Madagascar, Malawi, Namibia, South Africa, Zimbabwe National Statistics Offices of Member States 66
67 Table AIDS Deaths in SADC, Number, Country Angola Botswana Democratic Republic of Congo n.a. n.a. Lesotho Madagascar n.a. n.a. Malawi n.a n.a Mauritius Mozambique Namibia n.a. n.a. Seychelles South Africa Swaziland n.a n.a. United Republic of Tanzania Zambia n.a. n.a. Zimbabwe n.a. SADC - Total n.a. n.a. Source: World databank - Health Nutrition and Population Statistics (HNP), database: Education Statistics - All Indicators: downloaded: 12 October 2014: Angola ( ), Botswana ( ), Democratic Republic of Congo ( ), Lesotho ( ), Madagascar ( ), Malawi ( ), Namibia ( ), South Africa ( ), Zimbabwe ( ) National Statistics Offices of Member States 67
68 Table Prevalence Rate of HIV in SADC by Sex, (% of Population Age Years), Country Sex Country Sex Female n.a. n.a. n.a. n.a. n.a. n.a. 2.1 n.a. n.a. n.a. Female n.a. n.a. n.a. n.a. n.a. n.a. n.a. n.a. n.a. n.a. Angola Male n.a. n.a. n.a. n.a. n.a. n.a. n.a. n.a. n.a. n.a. Namibia Male n.a. n.a. n.a. n.a. n.a. n.a. n.a. n.a. n.a. n.a. Total n.a. Total n.a. n.a. Female n.a. n.a n.a. n.a. n.a Female n.a. n.a. n.a. n.a. n.a. n.a. n.a. n.a. n.a. n.a. Botswana Male n.a. n.a n.a. n.a. n.a Seychelles Male n.a. n.a. n.a. n.a. n.a. n.a. n.a. n.a. n.a. n.a. Total Total n.a. n.a. n.a. n.a. n.a. n.a. n.a. n.a. n.a. n.a. Democratic Female n.a. 1.6 n.a. n.a. n.a. n.a. n.a. n.a. 1.6 n.a. Female n.a. n.a. n.a. n.a. n.a. n.a. n.a. n.a. n.a. n.a. Republic of Male n.a. 0.9 n.a. n.a. n.a. n.a. n.a. n.a. 0.6 n.a. South Africa Male n.a. n.a. n.a. n.a. n.a. n.a. n.a. n.a. n.a. n.a. Congo Total n.a. Total Female n.a. n.a. n.a n.a. n.a. n.a. n.a Female n.a. n.a. n.a. n.a. n.a n.a. Lesotho Male n.a. n.a. n.a n.a. n.a. n.a. n.a Swaziland Male n.a. n.a. n.a. n.a. n.a n.a. Total Total n.a n.a. Female n.a. n.a. n.a. n.a. n.a. n.a. n.a. n.a. n.a. n.a. United Female Madagascar Male n.a. n.a. n.a. n.a. n.a. n.a. n.a. n.a. n.a. n.a. Republic of Male Total n.a. n.a. Tanzania Total Female n.a. n.a. n.a. n.a. n.a. n.a. n.a. n.a. n.a. n.a. Female n.a. n.a. n.a. n.a. n.a. n.a n.a. Malawi Male n.a. n.a. n.a. n.a. n.a. n.a. n.a. n.a. n.a. n.a. Zambia Male n.a. n.a. n.a. n.a. n.a. n.a n.a. Total n.a. Total n.a. Female n.a. n.a. n.a. n.a. n.a. n.a. n.a Female 21.1 n.a. n.a. n.a n.a. n.a. n.a. n.a. n.a. Mauritius Male n.a. n.a. n.a. n.a. n.a. n.a. n.a Zimbabwe Male 14.5 n.a. n.a. n.a n.a. n.a. n.a. n.a. n.a. Total Total n.a. Female Mozambique Male Total Source: World databank - Health Nutrition and Population Statistics (HNP), database: Education Statistics - All Indicators: downloaded: 12 October 2014: Angola (Total: ), Democratic Republic of Congo (Total: ), Lesotho ( ), Madagascar (Total: ), Malawi (Total: ), Namibia (Total: ), South Africa (Total: ), United Republic of Tanzania (Total: 2013), Zimbabwe (Total: ) UNAIDS and the WHO's Report on the Global AIDS Epidemic; Downloaded from the World databank - Health Nutrition and Population Statistics (HNP): 17 January 2012: Democratic Republic of Congo, Lesotho, Madagascar, Malawi ( Male & Female), South Africa (2005-Male & Female), Zambia (2002-Male & Female) National Statistics Offices of Member States 68
69 Table Prevalence Rate of HIV in SADC By Sex, (% of Population Age Years), Country Sex Angola Botswana Democratic Republic of Congo Lesotho Madagascar Malawi Mauritius Mozambique Namibia Seychelles South Africa Swaziland United Republic of Tanzania Zambia Zimbabwe Female Female Female Female Female Female Female Female Female Female Female Female Female Female Female n.a n.a n.a n.a n.a n.a n.a. 0.5 n.a n.a n.a n.a n.a n.a. n.a. n.a n.a. n.a 7.1 n.a 2.7 n.a. 7.0 n.a. 4.0 n.a. n.a. n.a. n.a n.a. n.a. n.a. n.a. 2.7 n.a. n.a. Male Male Male Male Male Male Male Male Male Male Male Male Male Male Male n.a n.a n.a n.a n.a n.a n.a. 0.3 n.a n.a n.a n.a n.a n.a. n.a. n.a n.a. n.a 4.1 n.a 1.2 n.a. 4.8 n.a n.a. n.a. n.a. n.a n.a. n.a. n.a. n.a. 1.2 n.a. n.a. Source: World databank - Health Nutrition and Population Statistics (HNP), database: Education Statistics - All Indicators: downloaded: 12 October 2014: Angola, Botswana ( ), Democratic Republic of Congo, Lesotho ( ), Madagascar, Malawi, Namibia, South Africa, United Republic of Tanzania, Zambia ( , ), Zimbabwe National Statistics Offices of Member States Definition: Prevalence of HIV is the percentage of people who are infected with HIV. Youth rates are as a percentage of the relevant age group. 69
70 2.3 HOUSING AND BASIC SERVICES 70
71 Table Population in SADC With Access to Safe Drinking Water By Urban and Rural Areas, (%), Country Area Urban Angola Rural Total Urban Botswana Rural Total Urban n.a. n.a. n.a. Democratic Republic of Congo Rural n.a. n.a. n.a. Total n.a. n.a. n.a. Urban n.a. Lesotho Rural n.a. Total n.a. Urban n.a. n.a. 82 Madagascar Rural n.a. n.a. 35 Total n.a. n.a. 52 Urban n.a Malawi Rural n.a Total n.a Urban n.a. n.a. n.a. n.a. n.a. 100 n.a. n.a. n.a. n.a. Mauritius Rural n.a. n.a. n.a. n.a. n.a. 99 n.a. n.a. n.a. n.a. Total n.a. n.a. n.a. n.a. n.a. 100 n.a. n.a. n.a. n.a. Urban n.a. n.a. 83 Mozambique Rural n.a. n.a. 37 Total n.a. n.a. 51 Urban n.a. n.a. n.a. Namibia Rural n.a. n.a. n.a. Total n.a. n.a. n.a. Urban Seychelles Rural Total n.a. n.a n.a. Urban South Africa Rural Total Urban Swaziland Rural Total Urban United Republic of Tanzania Rural Total Urban Zambia Rural Total Urban n.a. n.a. 98 n.a. Zimbabwe Rural n.a. n.a. 67 n.a. Total n.a. 76 n.a. Source: Millennium Development Goals Database, United Nations Statistics Division, downloaded 21 October 2013: Angola ( ), Democratic Republic of Congo ( ), Lesotho ( ), Madagascar ( ), Malawi ( ), Mauritius ( ), Namibia ( ), Seychelles ( , 2011), Swaziland (2011), Zambia ( ) Millennium Development Goals: downloaded 11 October 2014: Datta for 2012 for: Angola, Democratic Republic of Congo, Madagascar, Malawi, Mozambique, Namibia, Seychelles (Total) National Statistics Offices of Member States 71
72 Table Population in SADC With Access to Improved Sanitation By Urban and Rural Areas, (%), Country Area Urban Angola Rural Total Urban Botswana Rural Total Urban n.a. n.a. n.a. Democratic Republic of Congo Rural n.a. n.a. n.a. Total n.a. n.a. n.a. Urban n.a. Lesotho Rural n.a. Total n.a. Urban n.a. n.a. 18 Madagascar Rural n.a. n.a. 9 Total n.a. n.a. 12 Urban Malawi Rural Total Urban n.a. n.a. n.a. n.a. n.a. 100 n.a. n.a. n.a. n.a. Mauritius Rural n.a. n.a. n.a. n.a. n.a. 100 n.a. n.a. n.a. n.a. Total n.a. n.a. n.a. n.a. n.a. 100 n.a. n.a. n.a. n.a. Urban n.a. n.a. 58 Mozambique Rural n.a. n.a. 13 Total n.a. n.a. 27 Urban n.a. n.a. n.a. Namibia Rural n.a. n.a. n.a. Total n.a. n.a. n.a. Urban Seychelles Rural Total n.a. n.a. n.a. n.a. 82 n.a. n.a. n.a. n.a n.a. Urban South Africa Rural Total Urban Swaziland Rural Total Urban United Republic of Tanzania Rural Total Urban n.a. Zambia Rural n.a. Total n.a. Urban n.a. n.a. 98 n.a. Zimbabwe Rural n.a. n.a. 48 n.a. Total n.a. 62 n.a. Source: Millennium Development Goals Database, United Nations Statistics Division, downloaded 21 October 2013:downloaded 21 October 2013: Angola ( ), Democratic Republic of Congo ( ), Lesotho ( ), Madagascar ( ), Malawi ( ), Mauritius (1995, 2005, ), Mozambique (2011), Namibia ( ), Seychelles ( , 1995, 2011), South Africa ( ), Swaziland (2011), Zambia ( ) Millennium Development Goals: downloaded 11 October 2014: Datta for 2012 for: Angola, Democratic Republic of Congo, Madagascar, Malawi, Mozambique, Namibia National Statistics Offices of Member States 72
73 3 POVERTY AND INCOME DISTRIBUTION 73
74 Table 3.1 Human Development Index and Its Components in SADC, Country Angola n.a. 4.7 Botswana n.a. 8.9 Democratic Republic of Congo n.a. 6.0 Lesotho n.a. 5.9 Madagascar n.a. 6.0 Malawi n.a. 4.3 Mauritius n.a. 8.5 Mozambique n.a. 3.2 Namibia n.a. 6.2 Seychelles n.a n.a n.a n.a. 9.4 South Africa n.a. 9.9 Swaziland n.a. 7.1 United Republic of Tanzania n.a. 5.1 Zambia n.a. 6.6 Zimbabwe n.a. 7.3 Table 3.1 (contd.) Human Develop Country HDI Rank Expected Years of Schooling (Years) Gross National Income (GNI) Per Capita (PPP (Constant (2011 (2011 US$ 2005 PPP$) PPP $) PPP $) 2008) Angola n.a n.a n.a. n.a. Botswana n.a n.a n.a. n.a. Democratic Republic of Congo n.a n.a n.a. n.a. Lesotho n.a n.a n.a. n.a. Madagascar n.a n.a n.a. n.a. Malawi n.a n.a n.a. n.a. Mauritius n.a n.a n.a. n.a. Mozambique n.a n.a n.a. n.a. Namibia n.a n.a n.a. n.a. Seychelles n.a n.a -4-9 n.a. -19 n.a n.a. n.a. South Africa n.a n.a n.a. n.a. Swaziland n.a n.a n.a n.a. United Republic of Tanzania n.a n.a n.a. n.a. Zambia n.a n.a n.a. n.a. Zimbabwe n.a n.a n.a. n.a. Source: Human Development Reports : National Statistics Offices of Member States: Botswana, Mauritius, Mozambique, Seychelles, Swaziland, United Republic of Tanzania Human Development Index (HDI) Life Expectancy at Birth Mean Years of Schooling Value (Years) (Years) GNI Per Capita Rank Minus HDI Rank Non-Income HDI Value 74
75 Table 3.2 Human Development Index (HDI) Trends in SADC, Value, Country HDI Rank Angola n.a Botswana Democratic Republic of Congo n.a Lesotho n.a Madagascar n.a Malawi n.a Mauritius Mozambique n.a Namibia n.a Seychelles n.a South Africa n.a Swaziland n.a United Republic of Tanzania n.a Zambia n.a Zimbabwe n.a Table 3.2(contd.) Human Development Index (HDI) Trends in SADC, Value, HDI Rank Change Country Angola n.a. Botswana Democratic Republic of Congo Lesotho Madagascar n.a. Malawi Mauritius Mozambique Namibia Seychelles n.a. -3 n.a n.a. South Africa Swaziland United Republic of Tanzania Zambia Zimbabwe Source: Human Development Reports : National Statistics Offices of Member States: Botswana, Mauritius, Mozambique, Seychelles, Swaziland, United Republic of Tanzania Human Development Index (HDI) Value Average Annual 75
76 Table 3.3 Inequality-Adjusted Human Development Index in SADC, Country Angola n.a n.a n.a Botswana n.a. n.a. n.a n.a. n.a. n.a n.a. n.a. n.a Democratic Republic of Congo Lesotho Madagascar Malawi Mauritius n.a n.a n.a Mozambique Namibia Seychelles n.a n.a. n.a. n.a. n.a. n.a. n.a. n.a. n.a. n.a. n.a. n.a. n.a. n.a. n.a. n.a. n.a. n.a n.a. n.a. n.a South Africa n.a. n.a. n.a n.a. n.a. n.a n.a. n.a. n.a. -15 n.a Swaziland United Republic of Tanzania Zambia Zimbabwe Table 3.3(contd.) Inequality-Adjusted Human Development Index in SADC, Country HDI Rank Human Development Index (HDI) Inequality-Adjusted Life Inequality in Inequality-Adjusted Education Index Inequality in Loss (%) % Value Loss (%) % Value Loss (%) Quintile Income Ratio Palma ratio Income Gini Coefficient Angola n.a. n.a n.a n.a n.a. n.a n.a. n.a Botswana n.a. n.a n.a. n.a. n.a n.a. n.a. n.a. n.a. n.a n.a. n.a. n.a n.a. n.a. n.a. n.a. n.a Democratic Republic of n.a. n.a n.a. n.a n.a. n.a Congo Lesotho n.a. n.a n.a. n.a n.a. n.a Madagascar n.a. n.a n.a. n.a n.a. n.a Malawi n.a. n.a n.a. n.a n.a. n.a Mauritius n.a. n.a n.a n.a n.a. n.a n.a n.a n.a. n.a Mozambique n.a. n.a n.a. n.a n.a. n.a Namibia n.a. n.a n.a. n.a n.a. n.a Seychelles n.a. n.a. n.a. n.a. n.a. n.a. n.a. n.a. n.a. n.a. n.a. n.a. n.a. n.a. n.a. n.a. n.a. n.a. n.a. n.a. n.a. n.a. n.a. n.a. n.a. n.a. n.a. n.a. n.a South Africa n.a. n.a n.a. n.a. n.a n.a. n.a. n.a n.a. n.a. n.a. n.a Swaziland n.a. n.a n.a. n.a n.a. n.a United Republic of n.a. n.a n.a. n.a n.a. n.a Tanzania Zambia n.a. n.a n.a. n.a n.a. n.a Zimbabwe n.a. n.a n.a. n.a n.a. n.a. n.a. n.a. n.a. Source: Human Development Reports : National Statistics Offices of Member States: Botswana, Mauritius, Mozambique, Seychelles, Swaziland, United Republic of Tanzania Inequality-Adjusted HDI (IHDI) Coefficient of human inequality Inequality-Adjusted Income Index Inequality in life expectancy Inequality-Adjusted Life Expectancy Index Value Value Overall loss (%) Difference from HDI rank Value % Value Income inequality 76
77 Table 3.4 Multidimensional Poverty Index in SADC and Changes Over Time, Country Angola Botswana Democratic Republic of Congo Lesotho Madagascar Malawi Mauritius Mozambique Year HDI Rank Year and survey, Multidimensional Poverty Index HDRO Specifications Head count Specifications (2010) Head count Population in Multidimensional Poverty, 2010 Headcount Intensity of Deprivation Population near multidimensional poverty Population in severe multidimensional poverty Contribution of deprivation to overall poverty (%) Education Health Living standards Population Below Income Poverty Line PPP $ 1.25 a Day National Poverty Line Share of Multidimensional Poor With Deprivations in Environmental Services Clean Water Improved Sanitation Index Index (%) (%) Value (%) Value (%) (Thousands) (%) (%) (%) (%) (%) (%) (%) (%) (%) (M) n.a. n.a n.a. n.a. n.a. n.a. n.a n.a. n.a. n.a. n.a. n.a. n.a. n.a. n.a. n.a. n.a. n.a. n.a. n.a. n.a. n.a. n.a. n.a n.a. n.a. n.a. n.a. n.a. n.a. n.a. n.a. n.a. n.a. n.a. n.a. n.a. n.a. n.a. n.a. n.a n.a. n.a. n.a. n.a. n.a. n.a. n.a. n.a. n.a. n.a. n.a. n.a. n.a. n.a. n.a. n.a. n.a n.a. n.a. n.a. n.a. n.a. n.a. n.a. n.a. n.a. n.a. n.a. n.a. n.a. n.a. n.a. n.a. n.a n.a. n.a. n.a. n.a. n.a. n.a. n.a. n.a. n.a. n.a. n.a. n.a. n.a. n.a. n.a. n.a. n.a n.a. n.a. n.a. n.a. n.a. n.a. n.a. n.a. n.a. n.a. n.a. n.a. n.a. n.a. n.a. n.a. n.a n.a. n.a. n.a. n.a. n.a. n.a. n.a. n.a. n.a. n.a. n.a. n.a. n.a. n.a. n.a. n.a. n.a (D) n.a. n.a n.a. n.a. n.a. n.a. n.a (M) n.a. n.a n.a. n.a. n.a. n.a. n.a M n.a. n.a. n.a. n.a. n.a M n.a. n.a. 46, n.a. n.a. n.a. n.a. n.a /2014 D , n.a. n.a. n.a (D) n.a. n.a n.a. n.a (D) n.a. n.a n.a. n.a. n.a. n.a. n.a D n.a. n.a. n.a. n.a. n.a D n.a. n.a. n.a (D) n.a. n.a n.a. n.a. n.a. n.a. n.a /2009 (D) n.a. n.a n.a. n.a. n.a. n.a. n.a /2009 D n.a. n.a. n.a. n.a. n.a /2009 D , n.a. n.a. n.a (D) n.a. n.a n.a. n.a. n.a. n.a. n.a (D) n.a. n.a n.a. n.a. n.a. n.a. n.a D n.a. n.a. n.a. n.a. n.a D , n.a. n.a. n.a n.a. n.a. n.a. n.a. n.a. n.a. n.a. n.a. n.a. n.a. n.a. n.a. n.a. n.a. n.a. n.a. n.a n.a. n.a. n.a. n.a. n.a. n.a. n.a. n.a. n.a. n.a. n.a. n.a. n.a. n.a. n.a. n.a. n.a n.a. n.a. n.a. n.a. n.a. n.a. n.a. n.a. n.a. n.a. n.a. n.a. n.a. n.a. n.a. n.a. n.a n.a. n.a. n.a. n.a. n.a. n.a. n.a. n.a. n.a. n.a. n.a. n.a. n.a. n.a. n.a. n.a. n.a (D) n.a. n.a n.a. n.a. n.a. n.a. n.a (D) n.a. n.a n.a. n.a. n.a. n.a. n.a D n.a. n.a. n.a. n.a. n.a (D) n.a. n.a. 16, n.a. n.a. n.a. n.a. n.a D , n.a. n.a. n.a. Modern Fuels Notes: D under Column D - Year and Survey, indicates data from Demographic and Health Surveys, M indicates data from Multiple Indicator Cluster Surveys and N indicates data from national surveys (see for the list of national surveys). Source: Human Development Reports : National Statistics Offices of Member States: Botswana, Mozambique, Seychelles, Swaziland 77
78 Table 3.4 (contd.) Multidimensional Poverty Index in SADC and Changes Over Time, Country Namibia Seychelles South Africa Swaziland United Republic of Tanzania Zambia Zimbabwe Year HDI Rank Year and survey, Multidimensional Poverty Index HDRO Specifications Head count Specifications (2010) Head count Population in Multidimensional Poverty, 2010 Headcount Intensity of Deprivation Population near multidimensional poverty Population in severe multidimensional poverty Contribution of deprivation to overall poverty (%) Education Health Living standards Population Below Income Poverty Line PPP $ 1.25 a Day National Poverty Line Share of Multidimensional Poor With Deprivations in Environmental Services Clean Water Improved Sanitation Index Index (%) (%) Value (%) Value (%) (Thousands) (%) (%) (%) (%) (%) (%) (%) (%) (%) (D) n.a. n.a n.a. n.a. n.a. n.a. n.a /2007 (D) n.a. n.a n.a. n.a. n.a. n.a. n.a /2007 D n.a. n.a. n.a. n.a. n.a /2007 D n.a. n.a n.a. n.a. n.a. n.a. n.a D , n.a. n.a. n.a n.a. n.a. n.a. n.a. n.a. n.a. n.a. n.a. n.a. n.a. n.a. n.a. n.a. n.a. n.a. n.a. n.a n.a. n.a. n.a. n.a. n.a. n.a. n.a. n.a. n.a. n.a. n.a. n.a. n.a. n.a. n.a. n.a. n.a n.a. n.a. n.a. n.a. n.a. n.a. n.a. n.a. n.a. n.a. n.a. n.a. n.a. n.a. n.a. n.a. n.a n.a. n.a. n.a. n.a. n.a. n.a. n.a. n.a. n.a. n.a. n.a. n.a. n.a. n.a. n.a. n.a. n.a (N) n.a. n.a n.a. n.a. n.a. n.a. n.a (N) n.a. n.a n.a. n.a. n.a. n.a. n.a N n.a. n.a. n.a. n.a. n.a (N) n.a. n.a. 4, n.a. n.a. n.a. n.a. n.a N , n.a. n.a. n.a (D) n.a. n.a n.a. n.a. n.a. n.a. n.a (M) n.a. n.a n.a. n.a. n.a. n.a. n.a M n.a. n.a. n.a n.a n.a M n.a. n.a. n.a (D) n.a. n.a n.a. n.a. n.a. n.a. n.a (D) n.a. n.a n.a. n.a. n.a. n.a. n.a D n.a. n.a. n.a. n.a. n.a D , n.a. n.a. n.a (D) n.a. n.a n.a. n.a. n.a. n.a. n.a (D) n.a. n.a n.a. n.a. n.a. n.a. n.a D n.a. n.a. n.a. n.a. n.a (D) n.a. n.a. 7, n.a. n.a. n.a. n.a. n.a /2014 D , n.a. n.a. n.a (D) n.a. n.a n.a. n.a. n.a. n.a. n.a /2011 (D) n.a. n.a n.a. n.a. n.a. n.a. n.a /2011 D n.a. n.a. n.a. n.a. n.a D n.a. n.a. 5, n.a. n.a. n.a. n.a. n.a /2011 D n.a. n.a. 5, n.a. n.a. n.a. n.a. n.a M , n.a n.a. n.a. n.a. Modern Fuels Notes: D under Column D - Year and Survey, indicates data from Demographic and Health Surveys, M indicates data from Multiple Indicator Cluster Surveys and N indicates data from national surveys (see for the list of national surveys). Source: Human Development Reports National Statistics Offices of Member States: Botswana, Mozambique, Seychelles, Swaziland 78
79 Table 3.5 Population in SADC Below National Poverty Line By Urban and Rural Areas (Poverty Headcount), (%), Country Area Urban n.a. n.a Angola Rural n.a. n.a Total n.a. n.a Urban n.a. n.a. n.a. n.a n.a. n.a. n.a. n.a. n.a. Botswana Rural n.a. n.a. n.a. n.a n.a. n.a. n.a. n.a. n.a. Total n.a. n.a. n.a. n.a n.a. n.a. n.a. n.a. n.a. Urban n.a. n.a. n.a. n.a. n.a. n.a. n.a. n.a. n.a. n.a. Democratic Republic of Congo Rural n.a. n.a. n.a. n.a. n.a. n.a. n.a. n.a. n.a. n.a. Total n.a. n.a. n.a. n.a. n.a. n.a. n.a. n.a. n.a. n.a. Urban n.a. n.a. n.a. n.a n.a. n.a. n.a. n.a. n.a. Lesotho Rural n.a. n.a. n.a. n.a n.a. n.a. n.a. n.a. n.a. Total n.a. n.a. n.a. n.a n.a. n.a. n.a. n.a. n.a. Urban n.a. n.a. n.a. n.a n.a. n.a. n.a. n.a. n.a. Madagascar Rural n.a. n.a. n.a. n.a n.a. n.a. n.a. n.a. n.a. Total n.a. n.a. n.a. n.a n.a n.a. n.a. Urban n.a. n.a. n.a. n.a n.a. n.a. n.a. n.a. n.a. Malawi Rural n.a. n.a. n.a. n.a n.a. n.a. n.a. n.a. n.a. Total n.a. n.a. n.a. n.a n.a. n.a. n.a. n.a. n.a. Urban n.a. n.a. n.a. 7.9 n.a. n.a. n.a. Mauritius Rural n.a. n.a. n.a n.a. n.a. n.a. Total n.a. n.a. n.a. Urban n.a. n.a n.a. n.a. n.a. n.a. n.a. n.a. Mozambique Rural n.a. n.a n.a. n.a. n.a. n.a. n.a. n.a. Total n.a. n.a n.a. n.a. n.a. n.a. n.a. n.a. Urban n.a. n.a. n.a n.a. n.a. n.a. n.a. n.a. Namibia Rural n.a. n.a. n.a n.a. n.a. n.a. n.a. n.a. Total n.a. n.a. n.a n.a. n.a. n.a. n.a. n.a. Urban Seychelles Rural Total 39.3 n.a. n.a. Urban 28.7 n.a n.a n.a. n.a. n.a. n.a. South Africa Rural 67.5 n.a n.a n.a. n.a. n.a. n.a. Total 42.2 n.a n.a n.a. n.a. n.a. n.a. Urban n.a. n.a. n.a Swaziland Rural n.a. n.a. n.a Total n.a. n.a. n.a Urban United Republic of Tanzania Rural Total Urban n.a. n.a. n.a. n.a n.a. n.a. n.a. n.a Zambia Rural n.a. n.a. n.a. n.a n.a. n.a. n.a. n.a Total n.a. n.a n.a n.a. n.a. n.a. n.a Urban n.a. n.a. n.a. n.a. n.a n.a. n.a. n.a. n.a. Zimbabwe Rural n.a. n.a. n.a. n.a. n.a n.a. n.a. n.a. n.a. Total n.a. n.a. n.a. n.a. n.a n.a. n.a. n.a. n.a. Source: Millennium Development Goals Database; United Nations Statistics Division: UNData - Millennium Development Goals: downloaded 11 October 2014: Democratic Republic of Congo (2005), Madagascar (2005, 2010), Mozambique (2009), Swaziland (2009), Zimbabwe (2011) National Statistics Offices of Member States 79
80 Table 3.6 Population in SADC Below $1.00, $1.25 or $2.00 (PPP) Per Day (Poverty Gap), (%), Country Angola Botswana Democratic Republic of Congo Lesotho Madagascar Malawi Mauritius Mozambique Namibia Seychelles South Africa Swaziland United Republic of Tanzania Zambia Zimbabwe $ (PPP) Per Day $1.00 n.a. n.a. n.a. n.a. n.a. n.a. n.a. n.a. n.a. n.a. $1.25 n.a. n.a. n.a n.a. n.a. n.a. n.a. n.a. n.a. $2.00 n.a. n.a. n.a. n.a. n.a. n.a. n.a. n.a. n.a. n.a. $1.00 n.a. n.a. n.a. n.a $1.25 n.a. n.a. n.a. n.a. n.a. n.a. n.a. n.a. n.a. n.a. $2.00 n.a. n.a. n.a. n.a. n.a. n.a. n.a. n.a. n.a. n.a. $ n.a. n.a. n.a. n.a. n.a. n.a. n.a. n.a. n.a. $1.25 n.a. n.a. n.a. n.a. n.a. n.a. n.a. n.a. n.a. n.a. $2.00 n.a. n.a. n.a. n.a. n.a. n.a. n.a. n.a. n.a. n.a. $1.00 n.a. n.a. n.a. n.a. n.a. n.a. n.a. n.a. n.a. n.a. $1.25 n.a. n.a. n.a. n.a n.a. n.a. n.a. n.a. n.a. $2.00 n.a. n.a. n.a. n.a n.a. n.a. n.a. n.a. n.a. $1.00 n.a. n.a. n.a. n.a. n.a. n.a. n.a. n.a. n.a. n.a. $1.25 n.a. n.a. n.a. n.a n.a n.a. n.a. $2.00 n.a. n.a. n.a. n.a n.a n.a. n.a. $1.00 n.a. n.a. n.a. n.a. n.a. n.a. n.a. n.a. n.a. n.a. $1.25 n.a. n.a. n.a. n.a n.a. n.a. n.a. n.a. n.a. $2.00 n.a. n.a. n.a. n.a. n.a. n.a. n.a. n.a. n.a. n.a. $1.00 < 1 < 1 n.a. n.a. n.a. n.a. < 1 n.a. n.a. n.a. $1.25 < 1 < 1 n.a. n.a. n.a. n.a. < 1 n.a. n.a. n.a. $ n.a. n.a. n.a. n.a. < 2 n.a. n.a. n.a. $1.00 n.a. n.a. n.a. n.a. n.a. n.a. n.a. n.a. n.a. n.a. $1.25 n.a. n.a n.a. n.a. n.a. n.a. n.a. n.a. n.a. $2.00 n.a. n.a. n.a. n.a. n.a. n.a. n.a. n.a. n.a. n.a. $1.00 n.a. n.a. n.a. n.a. n.a. n.a. n.a. n.a. n.a. n.a. $1.25 n.a. n.a. n.a. n.a. n.a. n.a. n.a. n.a. n.a. n.a. $2.00 n.a. n.a. n.a. n.a. n.a. n.a. n.a. n.a. n.a. n.a. $1.00 n.a. 2.0 n.a. n.a. n.a. n.a. n.a n.a. n.a. $1.25 n.a. 0.3 n.a. n.a. n.a. n.a. n.a. n.a. n.a. n.a. $2.00 n.a. n.a. n.a. n.a. n.a. n.a. n.a. n.a. n.a. n.a. $ n.a. n.a. 5.9 n.a. 4.0 n.a. n.a. n.a. n.a. $ n.a. n.a n.a. 7.4 n.a. n.a. n.a. n.a. $ n.a. n.a n.a n.a. n.a. n.a. n.a. $1.00 n.a. n.a. n.a. 63 n.a. n.a. n.a. n.a. n.a. n.a. $1.25 n.a. n.a. n.a. n.a n.a. n.a. n.a. n.a. n.a. $2.00 n.a. n.a. n.a. n.a. n.a. n.a. n.a. n.a. n.a. n.a. $1.00 n.a. n.a. n.a. n.a. n.a. n.a. n.a. n.a. n.a. n.a. $1.25 n.a n.a. n.a. n.a. n.a. n.a. n.a. n.a. n.a. $2.00 n.a. n.a. n.a. n.a. n.a. n.a. n.a. n.a. n.a. n.a. $1.00 n.a. n.a. n.a. n.a. n.a. n.a. n.a. n.a. n.a. n.a. $1.25 n.a. n.a. n.a. n.a n.a. n.a. n.a. n.a. n.a. $2.00 n.a. n.a. n.a. n.a. n.a. n.a. n.a. n.a. n.a. n.a. $1.00 n.a. n.a. n.a. n.a. n.a. n.a. n.a. n.a. n.a. n.a. $1.25 n.a. n.a. n.a. n.a. n.a. n.a. n.a. n.a. n.a. n.a. $2.00 n.a. n.a. n.a. n.a. n.a. n.a. n.a. n.a. n.a. n.a. Source: Millennium Development Goals Database; United Nations Statistics Division: UNData - Millennium Development Goals: downloaded 11 October 2014: Angola (2009), Malawi (2010), Mozambique (2008), Zambia (2010) National Statistics Offices of Member States 80
81 Table 3.7 Inequality (Gini Coefficient / Index) in SADC, (%), Country Angola n.a. n.a Botswana Democratic Republic of Congo 44.4 n.a. n.a. n.a. n.a. n.a. n.a. n.a. n.a. n.a. Lesotho n.a. n.a. n.a. n.a n.a. n.a. n.a. n.a. n.a. Madagascar n.a. n.a. n.a. n.a. n.a. n.a n.a. n.a. Malawi n.a. n.a. n.a. n.a n.a. n.a. n.a. n.a. n.a. Mauritius n.a. n.a. n.a. n.a n.a. n.a. n.a. Mozambique n.a. n.a. n.a. n.a. n.a. n.a. n.a. n.a. n.a. n.a. Namibia n.a. n.a. n.a n.a. n.a. n.a. n.a. n.a. Seychelles n.a. n.a. n.a. n.a. n.a. n.a. n.a n.a. n.a. Swaziland n.a. n.a. n.a. n.a n.a. n.a n.a. n.a. South Africa 67.0 n.a. n.a n.a n.a. n.a. n.a. n.a. United Republic of Tanzania n.a n.a. n.a. n.a. n.a. n.a. n.a. n.a. n.a. Zambia 56.0 n.a. n.a. n.a n.a. n.a. n.a. n.a Zimbabwe n.a. n.a. n.a. n.a. n.a. n.a. n.a. n.a. n.a. n.a. Source: African Development Indicators (ADI): World Bank staff estimates based on primary household survey data obtained from government statistical agencies and World Bank country departments. Data for highincome economies are from the Luxembourg Income Study database. For more information and methodology, please see PovcalNet ( National Statistics Offices of Member States 81
82 Table 3.8 Population in SADC by Income Share, (%), Country Income Share Held By: Lowest Ten Percent n.a. n.a. n.a. n.a. n.a. n.a. n.a. n.a. n.a. Lowest Twenty Percent n.a. n.a Second Twenty Percent n.a. n.a Angola Third Twenty Percent n.a. n.a Fourth Twenty Percent n.a. n.a Highest Twenty Percent n.a. n.a Highest Ten Percent n.a. n.a. n.a. n.a. n.a. n.a. n.a. n.a. n.a. Lowest Ten Percent n.a. n.a. n.a. n.a. n.a. n.a. n.a. n.a. n.a. Lowest Twenty Percent n.a. n.a. n.a. n.a. n.a. n.a. n.a. n.a. n.a. Second Twenty Percent n.a. n.a. n.a. n.a. n.a. n.a. n.a. n.a. n.a. Botswana Third Twenty Percent n.a. n.a. n.a. n.a. n.a. n.a. n.a. n.a. n.a. Fourth Twenty Percent n.a. n.a. n.a. n.a. n.a. n.a. n.a. n.a. n.a. Highest Twenty Percent n.a. n.a. n.a. n.a. n.a. n.a. n.a. n.a. n.a. Highest Ten Percent n.a. n.a. n.a. n.a. n.a. n.a. n.a. n.a. n.a. Lowest Ten Percent 2.3 n.a. n.a. n.a. n.a. n.a. n.a. n.a. n.a. Lowest Twenty Percent 5.5 n.a. n.a. n.a. n.a. n.a. n.a. n.a. n.a. Second Twenty Percent 9.2 n.a. n.a. n.a. n.a. n.a. n.a. n.a. n.a. Democratic Republic of Congo Third Twenty Percent 13.8 n.a. n.a. n.a. n.a. n.a. n.a. n.a. n.a. Fourth Twenty Percent 20.9 n.a. n.a. n.a. n.a. n.a. n.a. n.a. n.a. Highest Twenty Percent 50.6 n.a. n.a. n.a. n.a. n.a. n.a. n.a. n.a. Highest Ten Percent 34.7 n.a. n.a. n.a. n.a. n.a. n.a. n.a. n.a. Lowest Ten Percent n.a. n.a. n.a. n.a. n.a. n.a. n.a. n.a. n.a. Lowest Twenty Percent n.a. n.a. n.a. n.a. n.a. n.a. n.a. n.a. n.a. Second Twenty Percent n.a. n.a. n.a. n.a. n.a. n.a. n.a. n.a. n.a. Lesotho Third Twenty Percent n.a. n.a. n.a. n.a. n.a. n.a. n.a. n.a. n.a. Fourth Twenty Percent n.a. n.a. n.a. n.a. n.a. n.a. n.a. n.a. n.a. Highest Twenty Percent n.a. n.a. n.a. n.a. n.a. n.a. n.a. n.a. n.a. Highest Ten Percent n.a. n.a. n.a. n.a. n.a. n.a. n.a. n.a. n.a. Lowest Ten Percent n.a. n.a. n.a. n.a. 2.2 n.a. n.a. n.a. n.a. Lowest Twenty Percent n.a. n.a. n.a. n.a. 5.4 n.a. n.a. n.a. n.a. Second Twenty Percent n.a. n.a. n.a. n.a. 9.5 n.a. n.a. n.a. n.a. Madagascar Third Twenty Percent n.a. n.a. n.a. n.a n.a. n.a. n.a. n.a. Fourth Twenty Percent n.a. n.a. n.a. n.a n.a. n.a. n.a. n.a. Highest Twenty Percent n.a. n.a. n.a. n.a n.a. n.a. n.a. n.a. Highest Ten Percent n.a. n.a. n.a. n.a n.a. n.a. n.a. n.a. Source: World Bank - downloaded 7 June 2013 National Statistics Offices of Member States 82
83 Table 3.8 (contd.) Population in SADC by Income Share, (%), Country Income Share Held By: Lowest Ten Percent n.a. n.a. n.a. n.a. n.a. n.a. n.a. n.a. n.a. Lowest Twenty Percent n.a. n.a. n.a. n.a. n.a. n.a. n.a. n.a. n.a. Second Twenty Percent n.a. n.a. n.a. n.a. n.a. n.a. n.a. n.a. n.a. Malawi Third Twenty Percent n.a. n.a. n.a. n.a. n.a. n.a. n.a. n.a. n.a. Fourth Twenty Percent n.a. n.a. n.a. n.a. n.a. n.a. n.a. n.a. n.a. Highest Twenty Percent n.a. n.a. n.a. n.a. n.a. n.a. n.a. n.a. n.a. Highest Ten Percent n.a. n.a. n.a. n.a. n.a. n.a. n.a. n.a. n.a. Lowest Ten Percent n.a. n.a. n.a. n.a. 1.9 n.a. n.a. Lowest Twenty Percent n.a. n.a. n.a. n.a. 5.4 n.a. n.a. Second Twenty Percent n.a. n.a. n.a. n.a n.a. n.a. Mauritius Third Twenty Percent n.a. n.a. n.a. n.a n.a. n.a. Fourth Twenty Percent n.a. n.a. n.a. n.a n.a. n.a. Highest Twenty Percent n.a. n.a. n.a. n.a n.a. n.a. Highest Ten Percent n.a. n.a. n.a. n.a n.a. n.a. Lowest Ten Percent n.a. n.a. 1.9 n.a. n.a. n.a. n.a. n.a. n.a. Lowest Twenty Percent n.a. n.a. 5.2 n.a. n.a. n.a. n.a. n.a. n.a. Second Twenty Percent n.a. n.a. 9.5 n.a. n.a. n.a. n.a. n.a. n.a. Mozambique Third Twenty Percent n.a. n.a n.a. n.a. n.a. n.a. n.a. n.a. Fourth Twenty Percent n.a. n.a n.a. n.a. n.a. n.a. n.a. n.a. Highest Twenty Percent n.a. n.a n.a. n.a. n.a. n.a. n.a. n.a. Highest Ten Percent n.a. n.a n.a. n.a. n.a. n.a. n.a. n.a. Lowest Ten Percent n.a. n.a. n.a. n.a. n.a. n.a. n.a. n.a. n.a. Lowest Twenty Percent n.a. n.a. n.a. n.a. n.a. n.a. n.a. n.a. n.a. Second Twenty Percent n.a. n.a. n.a. n.a. n.a. n.a. n.a. n.a. n.a. Namibia Third Twenty Percent n.a. n.a. n.a. n.a. n.a. n.a. n.a. n.a. n.a. Fourth Twenty Percent n.a. n.a. n.a. n.a. n.a. n.a. n.a. n.a. n.a. Highest Twenty Percent n.a. n.a. n.a. n.a. n.a. n.a. n.a. n.a. n.a. Highest Ten Percent n.a. n.a. n.a. n.a. n.a. n.a. n.a. n.a. n.a. Lowest Ten Percent n.a. 1.6 n.a. n.a. n.a. n.a. n.a. n.a. n.a. Lowest Twenty Percent n.a. 3.7 n.a. n.a. n.a. n.a. n.a. n.a. n.a. Second Twenty Percent n.a. 5.7 n.a. n.a. n.a. n.a. n.a. n.a. n.a. Seychelles Third Twenty Percent n.a. 8.3 n.a. n.a. n.a. n.a. n.a. n.a. n.a. Fourth Twenty Percent n.a n.a. n.a. n.a. n.a. n.a. n.a. n.a. Highest Twenty Percent n.a n.a. n.a. n.a. n.a. n.a. n.a. n.a. Highest Ten Percent n.a n.a. n.a. n.a. n.a. n.a. n.a. n.a. Source: World Bank - downloaded 7 June 2013 National Statistics Offices of Member States 83
84 Table 3.8 (contd.) Population in SADC by Income Share, (%), Country Income Share Held By: Lowest Ten Percent 1.1 n.a. n.a. 1.2 n.a. n.a. n.a. n.a. n.a. Lowest Twenty Percent 2.5 n.a. n.a. 2.7 n.a. n.a. n.a. n.a. n.a. Second Twenty Percent 4.1 n.a. n.a. 4.6 n.a. n.a. n.a. n.a. n.a. South Africa Third Twenty Percent 7.1 n.a. n.a. 8.2 n.a. n.a. n.a. n.a. n.a. Fourth Twenty Percent 14.2 n.a. n.a n.a. n.a. n.a. n.a. n.a. Highest Twenty Percent 72.2 n.a. n.a n.a. n.a. n.a. n.a. n.a. Highest Ten Percent 57.5 n.a. n.a n.a. n.a. n.a. n.a. n.a. Lowest Ten Percent n.a. n.a. n.a. n.a Lowest Twenty Percent n.a. n.a. n.a. n.a Second Twenty Percent n.a. n.a. n.a. n.a Swaziland Third Twenty Percent n.a. n.a. n.a. n.a Fourth Twenty Percent n.a. n.a. n.a. n.a Highest Twenty Percent n.a. n.a. n.a. n.a Highest Ten Percent n.a. n.a. n.a. n.a Lowest Ten Percent n.a. 2.8 n.a. n.a. n.a. n.a. n.a. n.a. n.a. Lowest Twenty Percent n.a. 6.8 n.a. n.a. n.a. n.a. n.a. n.a. n.a. Second Twenty Percent n.a n.a. n.a. n.a. n.a. n.a. n.a. n.a. United Republic of Tanzania Third Twenty Percent n.a n.a. n.a. n.a. n.a. n.a. n.a. n.a. Fourth Twenty Percent n.a n.a. n.a. n.a. n.a. n.a. n.a. n.a. Highest Twenty Percent n.a n.a. n.a. n.a. n.a. n.a. n.a. n.a. Highest Ten Percent n.a n.a. n.a. n.a. n.a. n.a. n.a. n.a. Lowest Ten Percent 0.2 n.a. n.a. n.a. 0.5 n.a. n.a. n.a. n.a. Lowest Twenty Percent 0.9 n.a. n.a. n.a. 1.6 n.a. n.a. n.a. n.a. Second Twenty Percent 3.4 n.a. n.a. n.a. 4.1 n.a. n.a. n.a. n.a. Zambia Third Twenty Percent 8.5 n.a. n.a. n.a. 7.9 n.a. n.a. n.a. n.a. Fourth Twenty Percent 18.5 n.a. n.a. n.a n.a. n.a. n.a. n.a. Highest Twenty Percent 68.7 n.a. n.a. n.a n.a. n.a. n.a. n.a. Highest Ten Percent 51.9 n.a. n.a. n.a n.a. n.a. n.a. n.a. Lowest Ten Percent n.a. n.a. n.a. n.a. n.a. n.a. n.a. n.a. n.a. Lowest Twenty Percent n.a. n.a. n.a. n.a. n.a. n.a. n.a. n.a. n.a. Second Twenty Percent n.a. n.a. n.a. n.a. n.a. n.a. n.a. n.a. n.a. Zimbabwe Third Twenty Percent n.a. n.a. n.a. n.a. n.a. n.a. n.a. n.a. n.a. Fourth Twenty Percent n.a. n.a. n.a. n.a. n.a. n.a. n.a. n.a. n.a. Highest Twenty Percent n.a. n.a. n.a. n.a. n.a. n.a. n.a. n.a. n.a. Highest Ten Percent n.a. n.a. n.a. n.a. n.a. n.a. n.a. n.a. n.a. Source: World Bank - downloaded 7 June 2013 National Statistics Offices of Member States 84
85 4 GENDER EQUALITY 85
86 Table 4.1 Ratio of Girls/Females to Boys/Males in Primary, Secondary and Tertiary School in SADC, Country Level Country Level Pri n.a. n.a n.a. n.a n.a. Pri n.a. n.a. n.a. n.a. n.a. Angola Sec n.a. n.a n.a. n.a n.a. Namibia Sec n.a. n.a. n.a. n.a. n.a. n.a. n.a. n.a. Ter n.a. n.a. n.a. n.a n.a. n.a. n.a n.a. Ter 0.88 n.a n.a. n.a. n.a. n.a. n.a n.a. Pri n.a. n.a Pri n.a. n.a. n.a. n.a. Botswana Sec n.a. n.a. n.a. n.a Seychelles Sec n.a. n.a. n.a. n.a. Ter n.a. n.a. n.a. n.a Ter n.a. n.a. n.a. n.a n.a. n.a. n.a. Democratic Pri n.a n.a. n.a. n.a. n.a. Pri n.a. n.a. n.a. n.a. n.a. n.a. Republic of Sec n.a n.a. n.a. n.a. n.a. South Africa Sec n.a. n.a. n.a. n.a. n.a. n.a. Congo Ter n.a n.a n.a. n.a. n.a. n.a. Ter n.a. n.a. n.a. n.a. n.a. n.a. n.a. n.a. n.a. n.a. Pri Pri n.a n.a. Lesotho Sec Swaziland Sec n.a n.a. Ter 1.19 n.a. n.a. n.a. n.a. n.a Ter 0.98 n.a. n.a. n.a. n.a n.a. Pri n.a. n.a. n.a. n.a. United Pri n.a Madagascar Sec n.a. n.a. n.a. n.a. n.a. n.a. Republic of Sec n.a. n.a. n.a. n.a. n.a. n.a Ter n.a. n.a. n.a. n.a. Tanzania Ter n.a. n.a. n.a. n.a n.a Pri Pri n.a n.a. Malawi Sec Zambia Sec n.a n.a. n.a. n.a. n.a n.a. Ter n.a. n.a n.a. n.a. n.a. n.a. Ter n.a. n.a. n.a. n.a. n.a. n.a. n.a. n.a. n.a. n.a. Pri Pri 0.99 n.a. n.a n.a. n.a n.a. Mauritius Sec Zimbabwe Sec 0.92 n.a. n.a n.a. n.a n.a. Ter n.a. Ter n.a. n.a. n.a. n.a n.a. n.a. n.a. n.a. Pri Mozambique Sec Ter Notes Pri = Primary; Sec = Secondary; Ter = Tertiary Source: 86
87 Table 4.2 Employment in SADC by Sector and Sex, (%), Country Sector Sex Country Sector Sex Male n.a. n.a. n.a Male n.a. n.a. n.a. n.a. n.a. n.a. n.a. n.a. n.a. n.a. Agriculture Female n.a. n.a. n.a Agriculture Female n.a. n.a. n.a. n.a. n.a. n.a. n.a. n.a. n.a. n.a. Total n.a. n.a. n.a Total n.a. n.a. n.a. n.a. n.a. n.a. n.a. n.a. n.a. n.a. Male n.a. n.a. n.a Male n.a. n.a. n.a. n.a. n.a. n.a. n.a. n.a. n.a. n.a. Angola Industry Female n.a. n.a. n.a Madagascar Industry Female n.a. n.a. n.a. n.a. n.a. n.a. n.a. n.a. n.a. n.a. Total n.a. n.a. n.a Total n.a. n.a. n.a. n.a. n.a. n.a. n.a. n.a. n.a. n.a. Male n.a. n.a. n.a Male n.a. n.a. n.a. n.a. n.a. n.a. n.a. n.a. n.a. n.a. Services Female n.a. n.a. n.a Services Female n.a. n.a. n.a. n.a. n.a. n.a. n.a. n.a. n.a. n.a. Total n.a. n.a. n.a Total n.a. n.a. n.a. n.a. n.a. n.a. n.a. n.a. n.a. n.a. Male 35.1 n.a n.a n.a Male n.a. n.a. n.a. n.a. n.a. n.a. n.a n.a. n.a. Agriculture Female 24.3 n.a. 6.5 n.a n.a Agriculture Female n.a. n.a. n.a. n.a. n.a. n.a. n.a n.a. n.a. Total 29.9 n.a n.a n.a Total n.a. n.a. n.a. n.a. n.a. n.a. n.a n.a. n.a. Male 19.2 n.a n.a n.a Male n.a. n.a. n.a. n.a. n.a. n.a. n.a. 8.7 n.a. n.a. Botswana Industry Female 10.8 n.a n.a n.a Malawi Industry Female n.a. n.a. n.a. n.a. n.a. n.a. n.a. 4.6 n.a. n.a. Total 15.2 n.a n.a n.a Total n.a. n.a. n.a. n.a. n.a. n.a. n.a. 6.7 n.a. n.a. Male 45.5 n.a n.a n.a Male n.a. n.a. n.a. n.a. n.a. n.a. n.a n.a. n.a. Services Female 64.8 n.a n.a n.a Services Female n.a. n.a. n.a. n.a. n.a. n.a. n.a n.a. n.a. Total 54.9 n.a n.a n.a Total n.a. n.a. n.a. n.a. n.a. n.a. n.a n.a. n.a. Male n.a. n.a. n.a. n.a. n.a. n.a. n.a. n.a. n.a. n.a. Male Agriculture Female n.a. n.a. n.a. n.a. n.a. n.a. n.a. n.a. n.a. n.a. Agriculture Female Total n.a. n.a. n.a. n.a. n.a. n.a. n.a. n.a. n.a. n.a. Total Democratic Male n.a. n.a. n.a. n.a. n.a. n.a. n.a. n.a. n.a. n.a. Male Republic of Industry Female n.a. n.a. n.a. n.a. n.a. n.a. n.a. n.a. n.a. n.a. Mauritius Industry Female Congo Total n.a. n.a. n.a. n.a. n.a. n.a. n.a. n.a. n.a. n.a. Total Male n.a. n.a. n.a. n.a. n.a. n.a. n.a. n.a. n.a. n.a. Male Services Female n.a. n.a. n.a. n.a. n.a. n.a. n.a. n.a. n.a. n.a. Services Female Total n.a. n.a. n.a. n.a. n.a. n.a. n.a. n.a. n.a. n.a. Total Male n.a. n.a. n.a n.a. n.a. n.a. n.a. Male 68.0 n.a. n.a. n.a. n.a. n.a n.a Agriculture Female n.a. n.a. n.a n.a. n.a. n.a. n.a. Agriculture Female 87.3 n.a. n.a. n.a. n.a. n.a n.a Total 42.2 n.a. n.a. n.a. n.a n.a. n.a. n.a. n.a. Total 78.5 n.a. n.a. n.a. n.a. n.a n.a Male 18.8 n.a. n.a. n.a. n.a n.a. n.a. n.a. n.a. Male 8.6 n.a. n.a. n.a. n.a. n.a. 8.6 n.a Lesotho Industry Female 24.5 n.a. n.a. n.a. n.a n.a. n.a. n.a. n.a. Mozambique Industry Female 1.3 n.a. n.a. n.a. n.a. n.a. 1.3 n.a Total 21.1 n.a. n.a. n.a. n.a n.a. n.a. n.a. n.a. Total 4.6 n.a. n.a. n.a. n.a. n.a. 4.5 n.a Male 28.7 n.a. n.a. n.a. n.a n.a. n.a. n.a. n.a. Male 23.2 n.a. n.a. n.a. n.a. n.a n.a Services Female 48.6 n.a. n.a. n.a. n.a n.a. n.a. n.a. n.a. Services Female 11.3 n.a. n.a. n.a. n.a. n.a n.a Total 36.7 n.a. n.a. n.a. n.a n.a. n.a. n.a. n.a. Total 16.9 n.a. n.a. n.a. n.a. n.a n.a Source: World DataBank, World Development Indicators, database: Education Statistics - All Indicators : downloaded: 12 October 2014: Angola, Democratic Republic of Congo, Namibia ( ) World databank - Health Nutrition and Population Statistics (HNP): Lesotho (Male & Female-1997, 1999, 2007), United Republic of Tanzania (Male & Female-2001, 2006), Zambia (Male & Female-1990, 1998, 2000), Zimbabwe (Male & Female-1999) National Statistics Offices of Member States 87
88 Table 4.2 (contd.) Employment in SADC by Sector and Sex, (%), Country Sector Sex Country Sector Sex Male n.a. n.a. n.a n.a n.a. n.a. Male 71.2 n.a. n.a. n.a. n.a. n.a n.a Agriculture Female n.a. n.a. n.a. 8.2 n.a n.a. n.a. Agriculture Female 78.0 n.a. n.a. n.a. n.a. n.a n.a Total n.a. n.a. n.a n.a n.a. n.a. Total 76.5 n.a. n.a. n.a. n.a. n.a n.a Male n.a. n.a. n.a n.a n.a. n.a. United Male 7.3 n.a. n.a. n.a. n.a. n.a. 7.4 n.a Namibia Industry Female n.a. n.a. n.a. 9.1 n.a n.a. n.a. Republic of Industry Female 2.8 n.a. n.a. n.a. n.a. n.a. 5.2 n.a Total n.a. n.a. n.a n.a n.a. n.a. Tanzania Total 4.3 n.a. n.a. n.a. n.a. n.a. 6.3 n.a Male n.a. n.a. n.a n.a n.a. n.a. Male 21.5 n.a. n.a. n.a. n.a. n.a n.a Services Female n.a. n.a. n.a n.a n.a. n.a. Services Female 19.2 n.a. n.a. n.a. n.a. n.a n.a Total n.a. n.a. n.a n.a n.a. n.a. Total 19.2 n.a. n.a. n.a. n.a. n.a n.a Male n.a. n.a. n.a. n.a. n.a. n.a. n.a. n.a. n.a. n.a. Male n.a. n.a. n.a. n.a n.a. n.a. n.a n.a. Agriculture Female n.a. n.a. n.a. n.a. n.a. n.a. n.a. n.a. n.a. n.a. Agriculture Female n.a. n.a. n.a. n.a n.a. n.a. n.a n.a. Total n.a. n.a. n.a. n.a. n.a. n.a. n.a. n.a. n.a. n.a. Total n.a. n.a. n.a. n.a n.a. n.a. n.a n.a. Male n.a. n.a. n.a. n.a. n.a. n.a. n.a. n.a. n.a. n.a. Male n.a. n.a. n.a. n.a. n.a. n.a. n.a. n.a n.a. Seychelles Industry Female n.a. n.a. n.a. n.a. n.a. n.a. n.a. n.a. n.a. n.a. Zambia Industry Female n.a. n.a. n.a. n.a. n.a. n.a. n.a. n.a. 2.8 n.a. Total n.a. n.a. n.a. n.a. n.a. n.a. n.a. n.a. n.a. n.a. Total n.a. n.a. n.a. n.a. n.a. n.a. n.a. n.a. 8.8 n.a. Male n.a. n.a. n.a. n.a. n.a. n.a. n.a. n.a. n.a. n.a. Male n.a. n.a. n.a. n.a. n.a. n.a. n.a. n.a n.a. Services Female n.a. n.a. n.a. n.a. n.a. n.a. n.a. n.a. n.a. n.a. Services Female n.a. n.a. n.a. n.a. n.a. n.a. n.a. n.a n.a. Total n.a. n.a. n.a. n.a. n.a. n.a. n.a. n.a. n.a. n.a. Total n.a. n.a. n.a. n.a. n.a. n.a. n.a. n.a n.a. Male n.a Male n.a. n.a. n.a. n.a. n.a. n.a. n.a. n.a n.a. Agriculture Female n.a Agriculture Female n.a. n.a. n.a. n.a. n.a. n.a. n.a. n.a n.a. Total n.a Total n.a. n.a. n.a. n.a. n.a. n.a. n.a. n.a n.a. Male n.a Male n.a. n.a. n.a. n.a. n.a. n.a. n.a. n.a. n.a. n.a. South Africa Industry Female n.a Zimbabwe Industry Female n.a. n.a. n.a. n.a. n.a. n.a. n.a. n.a. n.a. n.a. Total n.a Total n.a. n.a. n.a. n.a. n.a. n.a. n.a. n.a. n.a. n.a. Male n.a Male n.a. n.a. n.a. n.a. n.a. n.a. n.a. n.a. n.a. n.a. Services Female n.a Services Female n.a. n.a. n.a. n.a. n.a. n.a. n.a. n.a. n.a. n.a. Total n.a Total n.a. n.a. n.a. n.a. n.a. n.a. n.a. n.a. n.a. n.a. Male n.a. n.a. n.a. n.a. n.a. n.a. n.a Agriculture Female n.a. n.a. n.a. n.a. n.a. n.a. n.a Total n.a. n.a. n.a. n.a. n.a. n.a. n.a Male n.a. n.a. n.a. n.a. n.a. n.a. n.a Swaziland Industry Female n.a. n.a. n.a. n.a. n.a. n.a. n.a Total n.a. n.a. n.a. n.a. n.a. n.a. n.a Male n.a. n.a. n.a. n.a. n.a. n.a. n.a Services Female n.a. n.a. n.a. n.a. n.a. n.a. n.a Total n.a. n.a. n.a. n.a. n.a. n.a. n.a Source: World DataBank, World Development Indicators, database: Education Statistics - All Indicators : downloaded: 12 October 2014: Angola, Democratic Republic of Congo, Namibia ( ) World databank - Health Nutrition and Population Statistics (HNP): Lesotho (Male & Female-1997, 1999, 2007), United Republic of Tanzania (Male & Female-2001, 2006), Zambia (Male & Female-1990, 1998, 2000), Zimbabwe (Male & Female-1999) National Statistics Offices of Member States 88
89 Table 4.3 Women in National Parliament in SADC, Number, Situation as of : 31-Dec-07 Country Lower or Single House Upper House or Senate Lower or Single House Upper House or Senate World Elections Seats* Women % Elections Seats* Women % Situation as World Country Elections Seats* Women % % Rank of : Rank Elections Seats* Women Women Women Women Women Angola Angola Botswana Botswana n.a n.a n.a n.a Democratic Republic of Democratic Republic of Congo Congo Lesotho Lesotho Madagascar Madagascar n.a. n.a. n.a. n.a. n.a. n.a. n.a. n.a. n.a. Malawi Malawi Mauritius Mauritius Mozambique Mozambique Dec-09 Namibia Namibia Seychelles Seychelles South Africa South Africa Swaziland Swaziland United Republic of Tanzania United Republic of Tanzania Zambia Zambia Zimbabwe Zimbabwe SADC Total SADC Total Angola Angola Botswana Botswana Democratic Republic of Congo Democratic Republic of Congo Dec-08 Lesotho Lesotho Madagascar Madagascar Malawi Malawi Mauritius Mauritius n.a n.a n.a n.a Mozambique Mozambique Dec-10 Namibia Namibia Seychelles Seychelles South Africa South Africa Swaziland Swaziland United Republic of Tanzania United Republic of Tanzania n.a n.a. n.a Zambia Zambia Zimbabwe Zimbabwe SADC Total SADC Total Notes: * Figures correspond to the number of seats currently filled in Parliament 1 - South Africa: The figures on the distribution of seats do not include the 36 special rotating delegates appointed on an ad hoc basis, and all percentages given are therefore calculated on the basis of the 54 permanent seats. Source: Inter-Parliamentary Union; Women in national parliaments: downloaded: 2 Aug 2016 Millenium Development Goals Database, downloaded: 10 October 2014: Democratic Republic og Congo (2012) and 2013 (Angola, Democratic Republic of Congo, Lesotho, Madagascar, Namibia, South Africa, United Republic of Tanzania, Zimbabwe National Statistics Offices of Member States 89
90 Table 4.3 (contd.) Women in National Parliament in SADC, Number, Situation as of : 31-Dec Dec-12 Country Lower or Single House Upper House or Senate Lower or Single House Upper House or Senate World Elections Seats* Women % Situation as World % Country Elections Seats* Women Elections Seats* Women % % Rank of : Rank Elections Seats* Women Women Women Women Women Angola Angola Botswana Botswana Democratic Republic of n.a n.a. n.a Democratic Republic of Congo Congo 8.9 Lesotho Lesotho Madagascar Madagascar Malawi Malawi Mauritius Mauritius Mozambique Mozambique Dec-13 Namibia Namibia Seychelles Seychelles South Africa South Africa Swaziland Swaziland United Republic of Tanzania United Republic of Tanzania Zambia Zambia Zimbabwe Zimbabwe SADC Total SADC Total Angola Angola Botswana Botswana Democratic Republic of Democratic Republic of Congo Congo Lesotho Lesotho Madagascar Madagascar Malawi Malawi Mauritius Mauritius Mozambique Mozambique Namibia Dec-14 Namibia Seychelles Seychelles South Africa South Africa Swaziland Swaziland United Republic of Tanzania United Republic of Tanzania Zambia Zambia Zimbabwe Zimbabwe SADC Total SADC Total Notes: * Figures correspond to the number of seats currently filled in Parliament 1 - South Africa: The figures on the distribution of seats do not include the 36 special rotating delegates appointed on an ad hoc basis, and all percentages given are therefore calculated on the basis of the 54 permanent seats. Source: Inter-Parliamentary Union; Women in national parliaments: downloaded: 2 Aug 2016 Millenium Development Goals Database, downloaded: 10 October 2014: Democratic Republic og Congo (2012) and 2013 (Angola, Democratic Republic of Congo, Lesotho, Madagascar, Namibia, South Africa, United Republic of Tanzania, Zimbabwe National Statistics Offices of Member States 90
91 Table 4.3 (contd.) Women in National Parliament in SADC, Number, Situation as of : 31-Dec-15 Country Lower or Single House Upper House or Senate World Elections Seats* Women % % Rank Elections Seats* Women Women Women Angola Botswana Democratic Republic of Congo Lesotho Madagascar Malawi Mauritius Mozambique Namibia n.a n.a n.a Seychelles South Africa Swaziland United Republic of Tanzania Zambia Zimbabwe SADC Total Notes: * Figures correspond to the number of seats currently filled in Parliament 1 - South Africa: The figures on the distribution of seats do not include the 36 special rotating delegates appointed on an ad hoc basis, and all percentages given are therefore calculated on the basis of the 54 permanent seats. Source: Inter-Parliamentary Union; Women in national parliaments: downloaded: 2 Aug 2016 Millenium Development Goals Database, downloaded: 10 October 2014: Democratic Republic og Congo (2012) and 2013 (Angola, Democratic Republic of Congo, Lesotho, Madagascar, Namibia, South Africa, United Republic of Tanzania, Zimbabwe National Statistics Offices of Member States 91
92 Table 4.4 Number of Seats* in National Parliament in SADC by Sex, Country Sex Country Sex Female Female Male Male Angola Total Namibia 2 Total Female Female Proportion (%) Proportion (%) Female Female Male Male Botswana Total Seychelles Total Female Female Proportion (%) Proportion (%) Female n.a Female Democratic Male n.a Male South Republic of Total Total Africa 3 Congo Female Female n.a Proportion (%) Proportion (%) Female Female Male Male Lesotho Total Swaziland Total Female Female Proportion (%) Proportion (%) Female Female Male United Male Madagascar 1 Total Republic of Total Female Tanzania Female Proportion (%) Proportion (%) Female Female Male Male Malawi Total Zambia Total Female Female Proportion (%) Proportion (%) Female Female Male Male Mauritius Total Zimbabwe Total Female Female Proportion (%) 11.4 Proportion (%) Female Female Male Male Mozambique Total SADC Total Female Proportion (%) Female Proportion (%) Notes: * Figures correspond to the number of seats currently filled in Parliament 1 - Madagascar: 2010 Parliament has been dissolved or suspended for an indefinite period. 2 - Namibia: 2010 Figure excludes 11 members yet to be sworn in. 3 - South Africa: The figures on the distribution of seats do not include the 36 special rotating delegates appointed on an ad hoc basis, and all percentages given are therefore calculated on the basis of the 54 permanent seats. Source: Inter-Parliamentary Union; Women in national parliaments;: downloaded, 14 September 2011, 31 October 2013, 30 November 2015 Millenium Development Goals Database, downloaded: 10 October 2014: Democratic Republic of Congo ( ), Lesotho, Madagascar, Namibia, South Africa, United Republic of Tanzania, Zimbabwe National Statistics Offices of Member States 92
93 Table 4.5 Proportion of Women in SADC in Ministerial Level Positions, (%), Country Angola Botswana Democratic Republic of Congo Lesotho Madagascar 12.5 n.a Malawi Mauritius n.a Mozambique Namibia Seychelles South Africa Swaziland United Republic of Tanzania Zambia Zimbabwe SADC - Average Definition: Women in ministerial level positions is the number of women in ministerial or equivalent positions in the government. Source: Figure 2.7: Women in Cabinet in SADC: ; SADC Gender Protocol 2012 Barometer p. 75: Data for (Angola, Botswana, Democratic Republic of Congo, Lesotho, Madagascar, Malawi, Mauritius, Mozambique, Namibia, Seychelles, South Africa, United Republic of Tanzania, Zambia, Zimbabwe), Data for (Swaziland) United Nation's, World's Women: Data for (Angola, Democratic Gender Statistics, Republic database: of Congo, Education Lesotho, Statistics Madagascar, - All Indicators, Malawi, Mauritius, The World Namibia, databank: South Africa, United Republic of Tanzania, downloaded: 12 October 2014: Data for 2008 (Angola, Mauritius, Mozambique); Data for 2008 & 2010 (Botswana, Democratic Republic of Congo, Madagascar, Malawi, Namibia, Seychelles, Swaziland, United Republic of Tanzania, Zambia, Zimbabwe) National Statistics Offices of Member States 93
94 Table 4.6 Gender Inequality Index in SADC, , Selected Years Country HDI Rank Value Gender Inequality Index Rank Maternal Mortality Ratio Deaths per 100,000 live births Adolescent Fertility Rate Births per 1,000 women ages Share of seats in parliament % held by women Angola n.a. n.a. n.a. n.a. n.a. n.a. n.a. n.a. n.a. n.a Botswana Democratic Republic of Congo Lesotho Madagascar n.a. n.a. n.a. n.a. n.a. n.a. n.a. n.a. n.a. n.a Malawi Mauritius Mozambique Namibia Seychelles n.a. n.a. n.a. n.a. n.a. n.a. n.a. n.a. n.a. n.a. n.a. n.a. n.a South Africa Swaziland United Republic of n.a n.a Tanzania Zambia Zimbabwe Table 4.6 (contd) Gender Inequality Index in SADC, , Selected Years Country Population With at Least Secondary Education (% aged 25 and above) Labour Force Participation Rate, (aged 15 and above), (%) Contraceptive Prevalence Rate, Any Method Antenatal Coverage of at Least One Visit Births Attended by Skilled Health Personnel Total Fertility Rate (% of married Female Male Female Male women ages 15 - (%) (%) Births per woman 49) Angola n.a. n.a. n.a. n.a. n.a. n.a. n.a. n.a. n.a. n.a n.a. n.a. Botswana n.a n.a Democratic Republic of n.a. Congo Lesotho n.a. Madagascar n.a. n.a. n.a. n.a. n.a. n.a. n.a. n.a. n.a. n.a n.a. Malawi n.a. Mauritius n.a n.a n.a n.a n.a. n.a n.a. Mozambique n.a. Namibia n.a. Seychelles n.a. n.a. n.a. n.a. n.a. n.a. n.a. n.a. n.a. n.a. n.a. n.a. n.a. n.a South Africa n.a. Swaziland n.a United Republic of n.a n.a Tanzania Zambia Zimbabwe n.a. Source: Human Development Report 2010: 20th Anniversary Edition, The Real Wealth of Nations: Pathways to Human Development - Human Development Report Sustainability and Equity: A Better Future for All - Table 4: HDR_2013_Statistical_Tables, Human Development Report 2013 The Rise of the South Human Progress in a Diverse World, Table 4, Human Development Report (HDR 2014), downloaded: 10 October 2014 Table 5, Human Development Report (HDR 2015), downloaded: 14 December 2015 National Statistics Offices of Member States: Total Fertility Rate - Botswana, Mauritius, Mozambique, Seychelles, Swaziland, United Republic of Tanzania, Zambia 94
95 Table 4.7: Gender-Related Development Index (GDI), Gender-Related Development Index Life Expectancy at Birth Mean Years of Schooling Expected Years of Schooling Estimated GNI Per Capita Country HDI Rank Female to Male Ratio of HDI GDI Rank GDI Group Human Development Index Value Female Male Female Male Female Male Female Male Angola n.a. n.a. n.a. n.a. n.a. n.a. n.a. n.a n.a. n.a Botswana Democratic Republic of Congo Lesotho Madagascar Malawi Mauritius Mozambique Namibia Seychelles n.a. n.a. n.a. n.a. n.a. n.a. n.a. n.a n.a. n.a n.a. n.a. n.a. n.a. South Africa n.a n.a. 3 n.a n.a Swaziland United Republic of Tanzania Zambia Zimbabwe Source: Table 5, Human Development Report (HDR 2014), downloaded: 10 October 2014 Table 4, Human Development Report (HDR 2015), downloaded: 14 December 2015 Years Years Years (2011 PPP$) Female Male 95
96 5 LABOUR AND EMPLOYMENT 96
97 Table 5.1 Number of Persons in Labour Force and Unemployed in SADC, Thousand, Total Labour Force Unemployed Country Angola n.a. n.a. n.a. n.a Botswana n.a n.a Democratic Republic of Congo n.a. n.a n.a. n.a. n.a. n.a. n.a. n.a. n.a. n.a. n.a. n.a. n.a. Lesotho n.a. n.a. 192 n.a. 201 n.a. n.a. n.a. n.a. n.a. Madagascar n.a n.a n.a n.a n.a n.a. n.a. n.a. n.a. n.a. n.a. n.a. n.a. n.a. n.a. n.a. Malawi n.a. n.a. n.a. n.a. n.a. n.a. n.a. n.a. n.a n.a. n.a. Mauritius Mozambique n.a. n.a. n.a. n.a. n.a. n.a Namibia n.a. 991 n.a. n.a. n.a. 51 n.a. n.a. n.a n.a. Seychelles n.a. n.a. n.a. n.a. n.a. n.a. n.a. n.a. 2 2 South Africa Swaziland n.a. n.a. n.a. n.a United Republic of Tanzania n.a. n.a. n.a. n.a. n.a. n.a. n.a Zambia n.a n.a n.a n.a n.a. n.a. n.a. 397 n.a. n.a. n.a n.a. Zimbabwe n.a n.a. n.a. n.a. n.a. n.a. 715 n.a. n.a. 799 n.a. SADC - Total n.a. n.a. n.a. n.a. n.a. n.a. n.a. n.a. n.a. n.a. Source: Gender Statistics, The World databank: downloaded: 12 October 2014: Angola ( ), Democratic Republic of Congo, Madagascar, Malawi ( ), Namibia ( ), South Africa, Swaziland ( , 2012), Zambia ( ), Zimbabwe ( ) International Labour Organization, using World Bank population estimates, Gender Statistics, World Bank: : downloaded 14 April 2011: Angola ( ), Democratic Republic of Congo, Malawi ( ), Namibia ( , ), South Africa ( , 2012), Zambia (2011) National Statistics Offices of Member States 97
98 Table 5.2 Labour Force Participation Rate in SADC By Sex, % of Female or Male Population of Age Years, Country Sex Female Angola Male Total Female n.a Botswana Male n.a Total n.a n.a. n.a Female n.a. n.a. n.a. Democratic Republic of Congo Male n.a. n.a. n.a. Total n.a. n.a. n.a. Female n.a. n.a n.a. n.a n.a. n.a. n.a. n.a. Lesotho Male n.a. n.a n.a. n.a n.a. n.a. n.a. n.a. Total n.a. n.a. n.a. n.a. n.a. n.a. n.a. n.a. n.a. n.a. Female n.a. n.a Madagascar Male n.a. n.a Total n.a. n.a Female n.a. n.a. Malawi Male n.a. n.a. Total n.a. n.a. n.a. n.a. n.a. n.a n.a. n.a. Female Mauritius Male Total Female n.a. n.a n.a. n.a Mozambique Male n.a. n.a n.a. n.a Total n.a. n.a n.a. n.a Female n.a. Namibia Male n.a. Total 63.8 n.a. n.a. n.a n.a. Female n.a. n.a. n.a. n.a. n.a n.a. n.a Seychelles Male n.a. n.a. n.a. n.a. n.a n.a. n.a Total n.a. n.a. n.a. n.a. n.a n.a. n.a Female n.a. South Africa Male n.a. Total n.a. Female Swaziland Male Total Female n.a United Republic of Tanzania Male n.a Total n.a Female n.a. Zambia Male n.a. Total n.a. n.a n.a n.a. Female n.a n.a. Zimbabwe Male n.a n.a. Total n.a n.a. Source: Gender Statistics, The World databank: downloaded: 12 October 2014: Angola, Democratic Republic of Congo, Madagascar, Malawi ( ), Mozambique ( ), Namibia (Total ), South Africa (Total ), United Republic of Tanzania (2012, Total : ), Zambia ( ), Zimbabwe ( ) International Labour Organization, using World Bank population estimates, Gender Statistics, World Bank: : downloaded 14 April 2011: Malawi ( ), Namibia ( ), Zambia ( ), Zimbabwe( ) National Statistics Offices of Member States 98
99 Table 5.3 Unemployment Rate in SADC for Persons of Age 15 Years And Above By Sex, (%), Country Sex Female Angola Male Total n.a. n.a Female Botswana Male Total Female n.a. n.a. n.a. Democratic Republic of Congo Male n.a. n.a. n.a. Total n.a. n.a. n.a. Female n.a. n.a n.a. n.a. n.a. n.a. n.a. n.a. n.a. Lesotho Male n.a. n.a n.a. n.a. n.a. n.a. n.a. n.a. n.a. Total n.a. n.a n.a. n.a. n.a. n.a. n.a. n.a. n.a. Female n.a. n.a. n.a. Madagascar Male n.a. n.a. n.a. Total n.a. n.a. n.a. Female n.a. n.a. Malawi Male n.a. n.a. Total n.a. n.a. Female Mauritius Male Total Female n.a. n.a n.a. n.a Mozambique Male n.a. n.a n.a. n.a Total n.a. n.a n.a. n.a Female n.a. Namibia Male n.a. Total n.a. Female n.a. n.a. n.a. n.a. n.a. 4.5 n.a. n.a Seychelles Male n.a. n.a. n.a. n.a. n.a. 3.8 n.a. n.a Total n.a. n.a. n.a. n.a. n.a. 4.1 n.a. n.a Female South Africa Male Total Female Swaziland Male Total Female n.a United Republic of Tanzania Male n.a Total n.a Female n.a. 6.5 n.a. Zambia Male n.a. 8.4 n.a. Total n.a. 7.4 n.a. Female n.a n.a. Zimbabwe Male n.a. 7.3 n.a. Total n.a n.a. Source: World Development Indicators, modelled, The World databank: downloaded: 12 October 2014: Angola, Botswana (2002, , 2007, 2009, 2012), Democratic Republic of Condo, Madagascar, Malawi, Namibia ( , , ), United Republic of Tanzania, Zambia (2000, 2011), Zimbabwe National Statistics Offices of Member States 99
100 Table 5.4 Unemployment Rate in SADC for Persons of Age Years Old By Sex, (%), Country Sex Female Angola Male Total Female Botswana Male Total n.a n.a n.a Female n.a. n.a. n.a. Democratic Republic of Congo Male n.a. n.a. n.a. Total n.a. n.a. n.a. Female n.a. n.a. n.a. Lesotho Male n.a. n.a. n.a. Total n.a n.a. n.a. n.a. Female n.a. n.a. n.a. Madagascar Male n.a. n.a. n.a. Total n.a. n.a. n.a. Female n.a. n.a. Malawi Male n.a. n.a. Total n.a. n.a. Female Mauritius Male Total Female n.a. n.a Mozambique Male n.a. n.a Total n.a. n.a Female n.a. Namibia Male n.a. Total n.a. Female n.a. n.a. n.a. n.a. n.a n.a. n.a Seychelles Male n.a. n.a. n.a. n.a. n.a. 8.4 n.a. n.a Total n.a. n.a. n.a. n.a. n.a n.a. n.a Female South Africa Male Total n.a. n.a Female n.a. Swaziland Male n.a. Total n.a. Female n.a United Republic of Tanzania Male n.a Total n.a Female n.a. n.a n.a. n.a. n.a n.a. 9.1 n.a. Zambia Male n.a. n.a n.a. n.a. n.a. 8.5 n.a n.a. Total n.a. n.a. n.a. n.a. n.a. n.a. n.a. n.a n.a. Female n.a. n.a n.a. Zimbabwe Male n.a. n.a n.a. Total n.a. n.a. n.a n.a. Source: World Development Indicators, modelled, The World databank: downloaded: 12 October 2014: Angola ( , ), Botswana, Democratic Republic of Congo, Lesotho, Madagascar, Malawi, Mozambique, Namibia, United Republic of Tanzania, Zimbabwe National Statistics Offices of Member States 100
101 6 MACROECONOMY 101
102 6.1 NATIONAL ACCOUNTS 102
103 6.1.1 GDP BY ECONOMIC ACTIVITY IN BY SADC MEMBER STATE 103
104 Table : GDP by kind of economic activity at current prices, Angola, Million US $, Year Industrial Activity Agriculture Mining and Quarrying Manufacturing Electricity, Gas and Water Construction Wholesale and Retail Trade, Restaurant & hotels Transport and Communication Finance, Insurance, Real Estate and Business Activities General Government Services Other Services GDP at Factor Cost/Basic Prices Net Taxes on products GDP at Market/Purchasers Prices Source: Computed using US dollar/kwanza period average exchange-rate for each year. Table : GDP by kind of economic activity at current prices, Botswana, Million US $, Year Industrial Activity Agriculture Mining and Quarrying Manufacturing Electricity, Gas and Water Construction Wholesale and Retail Trade, Restaurant & hotels Transport and Communication Finance, Insurance, Real Estate and Business Activities General Government Services Other Services GDP at Factor Cost/Basic Prices Net Taxes on products GDP at Market/Purchasers Prices Source: Computed using US dollar/pula period average exchange-rate for each year. 104
105 Table : GDP by kind of economic activity at current prices, Democratic Republic of Congo, Million US $, Year Industrial Activity Agriculture Mining and Quarrying Manufacturing Electricity, Gas and Water Construction Wholesale and Retail Trade, Restaurant & hotels Transport and Communication Finance, Insurance, Real Estate and Business Activities General Government Services Other Services n.a n.a n.a n.a n.a n.a n.a n.a n.a n.a GDP at Factor Cost/Basic Prices Net Taxes on products GDP at Market/Purchasers Prices Source: Computed using US dollar/franc Congolese period average exchange-rate for each year. Table : GDP by kind of economic activity at current prices, Lesotho, Million US $, Year Industrial Activity Agriculture Mining and Quarrying Manufacturing Electricity, Gas and Water Construction Wholesale and Retail Trade, Restaurant & hotels Transport and Communication Finance, Insurance, Real Estate and Business Activities General Government Services Other Services GDP at Factor Cost/Basic Prices Net Taxes on products GDP at Market/Purchasers Prices Source: Computed using US dollar/maloti period average exchange-rate for each year. 105
106 Table : GDP by kind of economic activity at current prices, Madagascar, Million US $, Year Industrial Activity Agriculture Mining and Quarrying Manufacturing Electricity, Gas and Water Construction Wholesale and Retail Trade, Restaurant & hotels Transport and Communication Finance, Insurance, Real Estate and Business Activities General Government Services Other Services GDP at Factor Cost/Basic Prices Net Taxes on products GDP at Market/Purchasers Prices Source: Computed using US dollar/ariary period average exchange-rate for each year. Table : GDP by kind of economic activity at current prices, Malawi, Million US $, Year Industrial Activity Agriculture n.a n.a n.a Mining and Quarrying n.a n.a n.a Manufacturing n.a n.a n.a Electricity, Gas and Water n.a n.a n.a Construction n.a n.a n.a Wholesale and Retail Trade, Restaurant & hotels n.a n.a n.a Transport and Communication n.a n.a n.a Finance, Insurance, Real Estate and Business Activities n.a n.a n.a General Government Services n.a n.a n.a Other Services n.a n.a n.a GDP at Factor Cost/Basic Prices n.a n.a n.a Net Taxes on products n.a n.a n.a GDP at Market/Purchasers Prices Source: Computed using US dollar/malawian Kwacha period average exchange-rate for each year. 106
107 Table : GDP by kind of economic activity at current prices, Mauritius, Million US $, Year Industrial Activity Agriculture Mining and Quarrying Manufacturing Electricity, Gas and Water Construction Wholesale and Retail Trade, Restaurant & hotels Transport and Communication Finance, Insurance, Real Estate and Business Activities General Government Services Other Services GDP at Factor Cost/Basic Prices Net Taxes on products GDP at Market/Purchasers Prices Source: Computed using US dollar/mauritian Rupee period average exchange-rate for each year. Table : GDP by kind of economic activity at current prices, Mozambique, Million US $, Year Industrial Activity Agriculture Mining and Quarrying Manufacturing Electricity, Gas and Water Construction Wholesale and Retail Trade, Restaurant & hotels Transport and Communication Finance, Insurance, Real Estate and Business Activities General Government Services Other Services GDP at Factor Cost/Basic Prices Net Taxes on products GDP at Market/Purchasers Prices Source: Computed using US dollar/metical period average exchange-rate for each year. 107
108 Table : GDP by kind of economic activity at current prices, Namibia, Million US $, Year Industrial Activity Agriculture Mining and Quarrying Manufacturing Electricity, Gas and Water Construction Wholesale and Retail Trade, Restaurant & hotels Transport and Communication Finance, Insurance, Real Estate and Business Activities General Government Services Other Services GDP at Factor Cost/Basic Prices Net Taxes on products GDP at Market/Purchasers Prices Source: Computed using US dollar/namibian dollar period average exchange-rate for each year. Table : GDP by kind of economic activity at current prices, Seychelles, Million US $, Year Industrial Activity Agriculture Mining and Quarrying Manufacturing Electricity, Gas and Water Construction Wholesale and Retail Trade, Restaurant & hotels Transport and Communication Finance, Insurance, Real Estate and Business Activities General Government Services Other Services GDP at Factor Cost/Basic Prices Net Taxes on products GDP at Market/Purchasers Prices Source: Computed using US dollar/seychelles rupee period average exchange-rate for each year. 108
109 Table : GDP by kind of economic activity at current prices, South Africa, Million US $, Year Industrial Activity Agriculture Mining and Quarrying Manufacturing Electricity, Gas and Water Construction Wholesale and Retail Trade, Restaurant & hotels Transport and Communication Finance, Insurance, Real Estate and Business Activities General Government Services Other Services GDP at Factor Cost/Basic Prices Net Taxes on products GDP at Market/Purchasers Prices Source: Computed using US dollar/rand period average exchange-rate for each year. Table : GDP by kind of economic activity at current prices, Swaziland, Million US $, Year Industrial Activity Agriculture Mining and Quarrying Manufacturing Electricity, Gas and Water Construction Wholesale and Retail Trade, Restaurant & hotels Transport and Communication Finance, Insurance, Real Estate and Business Activities General Government Services Other Services GDP at Factor Cost/Basic Prices Net Taxes on products GDP at Market/Purchasers Prices Source: Computed using US dollar/emalangeni period average exchange-rate for each year. 109
110 Table : GDP by kind of economic activity at current prices, United Republic of Tanzania, Million US $, Year Industrial Activity Agriculture Mining and Quarrying Manufacturing Electricity, Gas and Water Construction Wholesale and Retail Trade, Restaurant & hotels Transport and Communication Finance, Insurance, Real Estate and Business Activities General Government Services Other Services GDP at Factor Cost/Basic Prices Net Taxes on products GDP at Market/Purchasers Prices Source: Computed using US dollar/tanzania Shilling period average exchange-rate for each year. Table : GDP by kind of economic activity at current prices, Zambia, Million US $, Year Industrial Activity Agriculture Mining and Quarrying Manufacturing Electricity, Gas and Water Construction Wholesale and Retail Trade, Restaurant & hotels Transport and Communication Finance, Insurance, Real Estate and Business Activities General Government Services Other Services GDP at Factor Cost/Basic Prices Net Taxes on products GDP at Market/Purchasers Prices Source: Computed using US dollar/zambian kwacha period average exchange-rate for each year. 110
111 Table : GDP by kind of economic activity at current prices, Zimbabwe, Million US $, Year Industrial Activity Agriculture Mining and Quarrying Manufacturing Electricity, Gas and Water Construction Wholesale and Retail Trade, Restaurant & hotels Transport and Communication Finance, Insurance, Real Estate and Business Activities General Government Services Other Services GDP at Factor Cost/Basic Prices Net Taxes on products GDP at Market/Purchasers Prices Source: Zimbabwe National Statistics, November
112 GDP BY EXPENDITURE IN SADC MEMBER STATES 112
113 Table : GDP by Expenditure at current prices, Angola, Million US $, Year Industrial Activity Final consumption expenditure by Households Final consumption expenditure by General Government Gross Capital formation Exports of goods & services Imports of goods & services GDP at Market/Purchasers Prices Source: Computed using US dollar/kwanza period average exchange-rate for each year. Table : GDP by Expenditure at current prices, Botswana, Million US $, Year Industrial Activity Final consumption expenditure by Households Final consumption expenditure by General Government Gross Capital formation Exports of goods & services Imports of goods & services GDP at Market/Purchasers Prices Source: Computed using US dollar/pula period average exchange-rate for each year. Table : GDP by Expenditure at current prices, Democratic Republic of Congo, Million US $, Year Industrial Activity Final consumption expenditure by Households Final consumption expenditure by General Government Gross Capital formation Exports of goods & services Imports of goods & services GDP at Market/Purchasers Prices Source: Computed using US dollar/franc Congolese period average exchange-rate for each year. Table : GDP by Expenditure at current prices, Lesotho, Million US $, Year Industrial Activity Final consumption expenditure by Households n.a n.a n.a n.a n.a n.a n.a n.a n.a n.a Final consumption expenditure by General Government n.a n.a n.a n.a n.a n.a n.a n.a n.a n.a Gross Capital formation n.a n.a n.a n.a n.a n.a n.a n.a n.a n.a Exports of goods & services n.a n.a n.a n.a n.a n.a n.a n.a n.a n.a Imports of goods & services n.a n.a n.a n.a n.a n.a n.a n.a n.a n.a GDP at Market/Purchasers Prices Source: Computed using US dollar/maloti period average exchange-rate for each year. 113
114 Table : GDP by Expenditure at current prices, Madagascar, Million US $, Year Industrial Activity Final consumption expenditure by Households Final consumption expenditure by General Government Gross Capital formation Exports of goods & services Imports of goods & services GDP at Market/Purchasers Prices Source: Computed using US dollar/ariary period average exchange-rate for each year. Table : GDP by Expenditure at current prices, Malawi, Million US $, Year Industrial Activity Final consumption expenditure by Households n.a n.a n.a n.a n.a Final consumption expenditure by General Government n.a n.a n.a n.a n.a Gross Capital formation n.a n.a n.a n.a n.a Exports of goods & services n.a n.a n.a n.a n.a Imports of goods & services n.a n.a n.a n.a n.a GDP at Market/Purchasers Prices Source: Computed using US dollar/malawian kwacha period average exchange-rate for each year. Table : GDP by Expenditure at current prices, Mauritius, Million US $, Year Industrial Activity Final consumption expenditure by Households Final consumption expenditure by General Government Gross Capital formation Exports of goods & services Imports of goods & services GDP at Market/Purchasers Prices Source: Computed using US dollar/mauritian Rupee period average exchange-rate for each year. Table : GDP by Expenditure at current prices, Mozambique, Million US $, Year Industrial Activity Final consumption expenditure by Households Final consumption expenditure by General Government Gross Capital formation Exports of goods & services Imports of goods & services GDP at Market/Purchasers Prices Source: Computed using US dollar/metical period average exchange-rate for each year. 114
115 Table : GDP by Expenditure at current prices, Namibia, Million US $, Year Industrial Activity Final consumption expenditure by Households Final consumption expenditure by General Government Gross Capital formation Exports of goods & services Imports of goods & services GDP at Market/Purchasers Prices Source: Computed using US Dollar/Namibian Dollar period average exchange-rate for each year. Table : GDP by Expenditure at current prices, Seychelles, Million US $, Year Industrial Activity Final consumption expenditure by Households n.a n.a n.a n.a n.a Final consumption expenditure by General Government n.a n.a n.a n.a n.a Gross Capital formation n.a n.a n.a n.a n.a Exports of goods & services n.a n.a n.a n.a n.a Imports of goods & services n.a n.a n.a n.a n.a GDP at Market/Purchasers Prices Source: Computed using US Dollar/Seychelles Rupee period average exchange-rate for each year. Table : GDP by Expenditure at current prices, South Africa, Million US $, Year Industrial Activity Final consumption expenditure by Households Final consumption expenditure by General Government Gross Capital formation Exports of goods & services Imports of goods & services GDP at Market/Purchasers Prices Source: Computed using US Dollar/Rand period average exchange-rate for each year. Table : GDP by Expenditure at current prices, Swaziland, Million US $, Year Industrial Activity Final consumption expenditure by Households Final consumption expenditure by General Government Gross Capital formation Exports of goods & services Imports of goods & services GDP at Market/Purchasers Prices Source: Computed using US Dollar/Emalangeni period average exchange-rate for each year. 115
116 Table : GDP by Expenditure at current prices, United Republic of Tanzania, Million US $, Year Industrial Activity Final consumption expenditure by Households Final consumption expenditure by General Government Gross Capital formation Exports of goods & services Imports of goods & services GDP at Market/Purchasers Prices Source: Computed using US Dollar/Tanzanian Shilling period average exchange-rate for each year. Table : GDP by Expenditure at current prices, Zambia, Million US $, Year Industrial Activity Final consumption expenditure by Households n.a n.a n.a n.a Final consumption expenditure by General Government n.a n.a n.a n.a Gross Capital formation n.a n.a n.a n.a Exports of goods & services n.a n.a n.a n.a Imports of goods & services n.a n.a n.a n.a GDP at Market/Purchasers Prices Source: Computed using US Dollar/Zambian Kwacha period average exchange-rate for each year. Note: Disaggregated data prior to 2010 yet to linked to benchmark year Further details can be obtained from Central Statistics Office of Zambia Table : GDP by Expenditure at current prices, Zimbabwe, Million US $, Year Industrial Activity Final consumption expenditure by Households Final consumption expenditure by General Government Gross Capital formation Exports of goods & services Imports of goods & services GDP at Market/Purchasers Prices Source: Zimbabwe National Statistics, November
117 Table : GDP at Market Prices, by Member States, Million US $, Year Member States Angola Botswana Democratic Republic of Congo (DRC) Lesotho Madagascar Malawi Mauritius Mozambique Namibia Seychelles South Africa Swaziland United Republic of Tanzania Zambia Zimbabwe Total SADC Source: Computed using GDP by Expenditure data for each Member State Table : Share of GDP at Market Prices by Member States, (%), Year Member States Angola Botswana Democratic Republic of Congo (DRC) Lesotho Madagascar Malawi Mauritius Mozambique Namibia Seychelles South Africa Swaziland United Republic of Tanzania Zambia Zimbabwe Source: Computed using GDP by Expenditure dat
118 Table : GDP at Market Prices, Annual Real Growth Rates in SADC, (%), Year Member States Angola Botswana Democratic Republic of Congo (DRC) Lesotho Madagascar Malawi Mauritius Mozambique Namibia Seychelles South Africa Swaziland United Republic of Tanzania Zambia Zimbabwe Total SADC Table : Per Capita GDP at Current Market Prices, (US $ per head), Year Member States Angola Botswana Democratic Republic of Congo (DRC) Lesotho Madagascar Malawi Mauritius Mozambique Namibia Seychelles South Africa Swaziland United Republic of Tanzania Zambia Zimbabwe Total SADC Source: Computed using GDP at Market Prices data and Mid-Year Population of each Member State 118
119 Table : GDP by kind of economic activity at current prices, Total SADC, Million US $, Year Member States Agriculture Mining and Quarrying Manufacturing Electricity, Gas and Water Construction Wholesale and Retail Trade, Restaurant & hotels Transport and Communication Finance, Insurance, Real Estate and Business Activities General Government Services Other Services GDP at Factor Cost/Basic Prices Net Taxes on products GDP at Market/Purchasers Prices Source: Computed using Member States GDP by Production data Table : Share of GDP by kind of economic activity at current prices, Total SADC, (%), Year Member States Agriculture Mining and Quarrying Manufacturing Electricity, Gas and Water Construction Wholesale and Retail Trade, Restaurant & hotels Transport and Communication Finance, Insurance, Real Estate and Business Activities General Government Services Other Services GDP at Market/Purchasers Prices Source: Computed using SADC GDP by production 119
120 Table : GDP - Agriculture, Annual Real Growth Rates in SADC, (%), Year Member States Angola Botswana Democratic Republic of Congo (DRC) Lesotho Madagascar Malawi Mauritius Mozambique Namibia Seychelles South Africa Swaziland United Republic of Tanzania Zambia Zimbabwe Total SADC Table : GDP - Mining, Annual Real Growth Rates in SADC (%), Year Member States Angola Botswana Democratic Republic of Congo (DRC) Lesotho Madagascar Malawi Mauritius Mozambique Namibia Seychelles South Africa Swaziland United Republic of Tanzania Zambia Zimbabwe Total SADC Source: National Statistical Offices of Member States, November
121 Table : GDP - Manufacturing, Annual Real Growth Rates in SADC, (%), Year Member States Angola Botswana Democratic Republic of Congo (DRC) Lesotho Madagascar Malawi Mauritius Mozambique Namibia Seychelles South Africa Swaziland United Republic of Tanzania Zambia Zimbabwe Total SADC Table : GDP - Energy, Annual Real Growth Rates in SADC (%), Year Member States Angola Botswana Democratic Republic of Congo (DRC) Lesotho Madagascar Malawi Mauritius Mozambique Namibia Seychelles South Africa Swaziland United Republic of Tanzania Zambia Zimbabwe Total SADC Source: National Statistical Offices of Member States, November
122 6.1.2 NATIONAL ACCOUNTS IN NATIONAL CURRENCY 122
123 Table : GDP by kind of economic activity at current prices, Angola, Million Kwanza, Year Industrial Activity Agriculture Mining and Quarrying Manufacturing Electricity, Gas and Water Construction Wholesale and Retail Trade, Restaurant & hotels Transport and Communication Finance, Insurance, Real Estate and Business Activiti General Government Services Other Services GDP at Factor Cost/Basic Prices Net Taxes on products GDP at Market/Purchasers Prices Source: Instituto Nacional de Estatistica, Angola, November 2016 Table : Share of GDP by kind of economic activity at current prices, Angola, (%), Year Industrial Activity Agriculture Mining and Quarrying Manufacturing Electricity, Gas and Water Construction Wholesale and Retail Trade, Restaurant & hotels Transport and Communication Finance, Insurance, Real Estate and Business Activiti General Government Services Other Services GDP at Factor Cost/Basic Prices Source: Derived using GDP by Economic Activity components 123
124 Table : GDP by Expenditure at current prices, Angola, Million Kwanza, Year Industrial Activity Final consumption expenditure by Households Final consumption expenditure by General Government Gross Capital formation Exports of goods & services Imports of goods & services GDP at Market/Purchasers Prices Source: Instituto Nacional de Estatistica, Angola, November 2016 Table : Share of GDP by Expenditure at current prices, Angola, (%), Year Industrial Activity Final consumption expenditure by Households Final consumption expenditure by General Government Gross Capital formation Exports of goods & services Imports of goods & services GDP at Market/Purchasers Prices Source: Derived using GDP by Expenditure components breakdown Table : GDP by kind of economic activity, Annual Real Growth Rates, Angola, (%), Year Industrial Activity Agriculture Mining and Quarrying Manufacturing Electricity, Gas and Water Construction Wholesale and Retail Trade, Restaurant & hotels Transport and Communication Finance, Insurance, Real Estate and Business Activities General Government Services Other Services GDP at Factor Cost/Basic Prices Net Taxes on products GDP at Market/Purchasers Prices Source: Instituto Nacional de Estatistica, Angola, November
125 Table : GDP by kind of economic activity at current prices, Botswana, Million Pula, Year Industrial Activity Agriculture Mining and Quarrying Manufacturing Electricity, Gas and Water Construction Wholesale and Retail Trade, Restaurant & hotels Transport and Communication Finance, Insurance, Real Estate and Business Activities General Government Services Other Services GDP at Factor Cost/Basic Prices Net Taxes on products GDP at Market/Purchasers Prices Source: Statistics Botswana, November 2016 Table : Share of GDP by kind of economic activity at current prices, Botswana, (%), Year Industrial Activity Agriculture Mining and Quarrying Manufacturing Electricity, Gas and Water Construction Wholesale and Retail Trade, Restaurant & hotels Transport and Communication Finance, Insurance, Real Estate and Business Activities General Government Services Other Services GDP at Factor Cost/Basic Prices Source: Derived using GDP by Economic Activity components 125
126 Table : GDP by Expenditure at current prices, Botswana, Million Pula, Year Industrial Activity Final consumption expenditure by Households Final consumption expenditure by General Government Gross Capital formation Exports of goods & services Imports of goods & services GDP at Market/Purchasers Prices Source: Statistics Botswana, November 2016 Table : Share of GDP by Expenditure at current prices, Botswana, (%), Year Industrial Activity Final consumption expenditure by Households Final consumption expenditure by General Government Gross Capital formation Exports of goods & services Imports of goods & services GDP at Market/Purchasers Prices Source: Derived using GDP by Expenditure components breakdown Table : GDP by kind of economic activity, Annual Real Growth rates, Botswana, (%), Year Industrial Activity Agriculture Mining and Quarrying Manufacturing Electricity, Gas and Water Construction Wholesale and Retail Trade, Restaurant & hotels Transport and Communication Finance, Insurance, Real Estate and Business Activities General Government Services Other Services GDP at Factor Cost/Basic Prices Net Taxes on products GDP at Market/Purchasers Prices Source: Statistics Botswana, November
127 Table : GDP by kind of economic activity at current prices, Democratic Republic of Congo, Million Franc Congolais, Year Industrial Activity Agriculture Mining and Quarrying Manufacturing Electricity, Gas and Water Construction Wholesale and Retail Trade, Restaurant & hotels Transport and Communication Finance, Insurance, Real Estate and Business Activities General Government Services Other Services n.a n.a n.a n.a n.a n.a n.a n.a n.a n.a GDP at Factor Cost/Basic Prices Net Taxes on products GDP at Market/Purchasers Prices Source: Institut National de la Statistique (INS), November 2015; Year 2015: African Statistical Yearbook 2016 Table : Share of GDP by kind of economic activity at current prices, Democratic Republic of Congo, (%), Year Industrial Activity Agriculture Mining and Quarrying Manufacturing Electricity, Gas and Water Construction Wholesale and Retail Trade, Restaurant & hotels Transport and Communication Finance, Insurance, Real Estate and Business Activities General Government Services Other Services n.a n.a n.a n.a n.a n.a n.a n.a n.a n.a GDP at Factor Cost/Basic Prices Source: Derived using GDP by Economic Activity components 127
128 Table : GDP by Expenditure at current prices, Democratic Republic of Congo, Million Franc Congolais, Year Industrial Activity Final consumption expenditure by Households Final consumption expenditure by General Government Gross Capital formation Exports of goods & services Imports of goods & services GDP at Market/Purchasers Prices Source: Institut National de la Statistique (INS), November 2015; Year 2015: African Statistical Yearbook 2016 Table : Share of GDP by Expenditure at current prices, Democratic Republic of Congo, (%), Year Industrial Activity Final consumption expenditure by Households Final consumption expenditure by General Government Gross Capital formation Exports of goods & services Imports of goods & services GDP at Market/Purchasers Prices Source: Derived using GDP by Expenditure components breakdown Table : GDP by kind of economic activity, Annual Real Growth rates, Democratic Republic of Congo, (%), Year Industrial Activity Agriculture Mining and Quarrying Manufacturing Electricity, Gas and Water Construction Wholesale and Retail Trade, Restaurant & hotels Transport and Communication Finance, Insurance, Real Estate and Business Activities General Government Services Other Services n.a n.a n.a n.a n.a n.a n.a n.a n.a n.a GDP at Factor Cost/Basic Prices Net Taxes on products n.a GDP at Market/Purchasers Prices Source: Institut National de la Statistique (INS), November 2015; Year 2015: African Statistical Yearbook
129 Table : GDP by kind of economic activity at current prices, Lesotho, Million Loti, Year Industrial Activity Agriculture Mining and Quarrying Manufacturing Electricity, Gas and Water Construction Wholesale and Retail Trade, Restaurant & hotels Transport and Communication Finance, Insurance, Real Estate and Business Activities General Government Services Other Services GDP at Factor Cost/Basic Prices Net Taxes on products GDP at Market/Purchasers Prices Source: Lesotho Bureau of Statistics, November 2016 Table : Share of GDP by kind of economic activity at current prices, Lesotho, (%), Year Industrial Activity Agriculture Mining and Quarrying Manufacturing Electricity, Gas and Water Construction Wholesale and Retail Trade, Restaurant & hotels Transport and Communication Finance, Insurance, Real Estate and Business Activities General Government Services Other Services GDP at Factor Cost/Basic Prices Source: Derived using GDP by Economic Activity components 129
130 Table : GDP by Expenditure at current prices, Lesotho, Million Loti, Year Industrial Activity Final consumption expenditure by Households n.a n.a n.a n.a n.a n.a n.a n.a n.a n.a Final consumption expenditure by General Government n.a n.a n.a n.a n.a n.a n.a n.a n.a n.a Gross Capital formation n.a n.a n.a n.a n.a n.a n.a n.a n.a n.a Exports of goods & services n.a n.a n.a n.a n.a n.a n.a n.a n.a n.a Imports of goods & services n.a n.a n.a n.a n.a n.a n.a n.a n.a n.a GDP at Market/Purchasers Prices Source: Lesotho Bureau of Statistics, November 2016 Table : Share of GDP by Expenditure at current prices, Lesotho, (%), Year Industrial Activity Final consumption expenditure by Households n.a n.a Final consumption expenditure by General Government n.a n.a Gross Capital formation n.a n.a Exports of goods & services n.a n.a Imports of goods & services n.a n.a GDP at Market/Purchasers Prices Source: Derived using GDP by Expenditure components breakdown Table : GDP by kind of economic activity, Annual Real Growth Rates, Lesotho,(%), Year Industrial Activity Agriculture Mining and Quarrying Manufacturing Electricity, Gas and Water Construction Wholesale and Retail Trade, Restaurant & hotels Transport and Communication Finance, Insurance, Real Estate and Business Activities General Government Services Other Services GDP at Factor Cost/Basic Prices Net Taxes on products GDP at Market/Purchasers Prices Source: Lesotho Bureau of Statistics, November
131 Table : GDP by kind of economic activity at current prices, Madagascar, Million Ariary, Year Industrial Activity Agriculture Mining and Quarrying Manufacturing Electricity, Gas and Water Construction Wholesale and Retail Trade, Restaurant & hotels Transport and Communication Finance, Insurance, Real Estate and Business Activities General Government Services Other Services GDP at Factor Cost/Basic Prices Net Taxes on products GDP at Market/Purchasers Prices Source: INSTAT, Madagascar, November 2016 Table : Share of GDP by kind of economic activity at current prices, Madagascar, (%), Year Industrial Activity Agriculture Mining and Quarrying Manufacturing Electricity, Gas and Water Construction Wholesale and Retail Trade, Restaurant & hotels Transport and Communication Finance, Insurance, Real Estate and Business Activities General Government Services Other Services GDP at Factor Cost/Basic Prices Source: Derived using GDP by Economic Activity components 131
132 Table : GDP by Expenditure at current prices, Madagascar, Million Ariary, Year Industrial Activity Final consumption expenditure by Households Final consumption expenditure by General Government Gross Capital formation Exports of goods & services Imports of goods & services GDP at Market/Purchasers Prices Source: INSTAT, Madagascar, November 2016 Table : Share of GDP by Expenditure at current prices, Madagascar, (%), Year Industrial Activity Final consumption expenditure by Households Final consumption expenditure by General Government Gross Capital formation Exports of goods & services Imports of goods & services GDP at Market/Purchasers Prices Source: Derived using GDP by Expenditure components breakdown Table : GDP by kind of economic activity, Annual Real Growth Rates, Madagascar,(%), Year Industrial Activity Agriculture Mining and Quarrying Manufacturing Electricity, Gas and Water Construction Wholesale and Retail Trade, Restaurant & hotels Transport and Communication Finance, Insurance, Real Estate and Business Activities General Government Services Other Services GDP at Factor Cost/Basic Prices Net Taxes on products GDP at Market/Purchasers Prices Source: INSTAT, Madagascar, November
133 Table : GDP by kind of economic activity at current prices, Malawi, Million Malawian Kwacha, Year Industrial Activity Agriculture n.a n.a n.a Mining and Quarrying n.a n.a n.a Manufacturing n.a n.a n.a Electricity, Gas and Water n.a n.a n.a Construction n.a n.a n.a Wholesale and Retail Trade, Restaurant & hotels n.a n.a n.a Transport and Communication n.a n.a n.a Finance, Insurance, Real Estate and Business Activities n.a n.a n.a General Government Services n.a n.a n.a Other Services n.a n.a n.a GDP at Factor Cost/Basic Prices n.a n.a n.a Net Taxes on products n.a n.a n.a GDP at Market/Purchasers Prices Source: National Statistical Office, Malawi, November 2016 Table : Share of GDP by kind of economic activity at current prices, Malawi, (%), Year Industrial Activity Agriculture n.a n.a n.a Mining and Quarrying n.a n.a n.a Manufacturing n.a n.a n.a Electricity, Gas and Water n.a n.a n.a Construction n.a n.a n.a Wholesale and Retail Trade, Restaurant & hotels n.a n.a n.a Transport and Communication n.a n.a n.a Finance, Insurance, Real Estate and Business Activities n.a n.a n.a General Government Services n.a n.a n.a Other Services n.a n.a n.a GDP at Factor Cost/Basic Prices Source: Derived using GDP by Economic Activity components 133
134 Table : GDP by Expenditure at current prices, Malawi, Million Malawian Kwacha, Year Industrial Activity Final consumption expenditure by Households n.a n.a n.a n.a n.a Final consumption expenditure by General Government n.a n.a n.a n.a n.a Gross Capital formation n.a n.a n.a n.a n.a Exports of goods & services n.a n.a n.a n.a n.a Imports of goods & services n.a n.a n.a n.a n.a GDP at Market/Purchasers Prices Source: National Statistical Office, Malawi, November 2016 Table : Share of GDP by Expenditure at current prices, Malawi, (%), Year Industrial Activity Final consumption expenditure by Households n.a n.a n.a n.a n.a Final consumption expenditure by General Government n.a n.a n.a n.a n.a Gross Capital formation n.a n.a n.a n.a n.a Exports of goods & services n.a n.a n.a n.a n.a Imports of goods & services n.a n.a n.a n.a n.a GDP at Market/Purchasers Prices Source: Derived using GDP by Expenditure components breakdown Table : GDP by kind of economic activity, Annual Real Growth Rates, Malawi, (%), Year Industrial Activity Agriculture Mining and Quarrying Manufacturing Electricity, Gas and Water Construction Wholesale and Retail Trade, Restaurant & hotels Transport and Communication Finance, Insurance, Real Estate and Business Activities General Government Services Other Services GDP at Factor Cost/Basic Prices Net Taxes on products GDP at Market/Purchasers Prices Source: National Statistical Office, Malawi, November
135 Table : GDP by kind of economic activity at current prices, Mauritius, Million Mauritian Rupee, Year Industrial Activity Agriculture Mining and Quarrying Manufacturing Electricity, Gas and Water Construction Wholesale and Retail Trade, Restaurant & hotels Transport and Communication Finance, Insurance, Real Estate and Business Activities General Government Services Other Services GDP at Factor Cost/Basic Prices Net Taxes on products GDP at Market/Purchasers Prices Source: Statistics Mauritius, November 2016 Table : Share of GDP by kind of economic activity at current prices, Mauritius, (%), Year Industrial Activity Agriculture Mining and Quarrying Manufacturing Electricity, Gas and Water Construction Wholesale and Retail Trade, Restaurant & hotels Transport and Communication Finance, Insurance, Real Estate and Business Activities General Government Services Other Services GDP at Factor Cost/Basic Prices Source: Derived using GDP by Economic Activity components 135
136 Table : GDP by Expenditure at current prices, Mauritius, Million Mauritian Rupee, Year Industrial Activity Final consumption expenditure by Households Final consumption expenditure by General Government Gross Capital formation Exports of goods & services Imports of goods & services GDP at Market/Purchasers Prices Source: Statistics Mauritius, November 2016 Table : Share of GDP by Expenditure at current prices, Mauritius, (%), Year Industrial Activity Final consumption expenditure by Households Final consumption expenditure by General Government Gross Capital formation Exports of goods & services Imports of goods & services GDP at Market/Purchasers Prices Source: Derived using GDP by Expenditure components breakdown Table : GDP by kind of economic activity, Annual Real Growth Rates, Mauritius, (%), Year Industrial Activity Agriculture Mining and Quarrying Manufacturing Electricity, Gas and Water Construction Wholesale and Retail Trade, Restaurant & hotels Transport and Communication Finance, Insurance, Real Estate and Business Activities General Government Services Other Services GDP at Factor Cost/Basic Prices Net Taxes on products GDP at Market/Purchasers Prices Source: Statistics Mauritius, November
137 Table : GDP by kind of economic activity at current prices, Mozambique, Million Metical, Year Industrial Activity Agriculture Mining and Quarrying Manufacturing Electricity, Gas and Water Construction Wholesale and Retail Trade, Restaurant & hotels Transport and Communication Finance, Insurance, Real Estate and Business Activities General Government Services Other Services GDP at Factor Cost/Basic Prices Net Taxes on products GDP at Market/Purchasers Prices Source: INE Mozambique, November 2016 Table : Share of GDP by kind of economic activity at current prices, Mozambique, (%), Year Industrial Activity Agriculture Mining and Quarrying Manufacturing Electricity, Gas and Water Construction Wholesale and Retail Trade, Restaurant & hotels Transport and Communication Finance, Insurance, Real Estate and Business Activities General Government Services Other Services GDP at Factor Cost/Basic Prices Source: Derived using GDP by Economic Activity components 137
138 Table : GDP by Expenditure at current prices, Mozambique, Million Metical, Year Industrial Activity Final consumption expenditure by Households Final consumption expenditure by General Government Gross Capital formation Exports of goods & services Imports of goods & services GDP at Market/Purchasers Prices Source: INE Mozambique, November 2016 Table : Share of GDP by Expenditure at current prices, Mozambique, (%), Year Industrial Activity Final consumption expenditure by Households Final consumption expenditure by General Government Gross Capital formation Exports of goods & services Imports of goods & services GDP at Market/Purchasers Prices Source: Derived using GDP by Expenditure components breakdown Table : GDP by kind of economic activity, Annual Real Growth rates, Mozambique, (%), Year Industrial Activity Agriculture Mining and Quarrying Manufacturing Electricity, Gas and Water Construction Wholesale and Retail Trade, Restaurant & hotels Transport and Communication Finance, Insurance, Real Estate and Business Activities General Government Services Other Services GDP at Factor Cost/Basic Prices Net Taxes on products GDP at Market/Purchasers Prices Source: INE Mozambique, November
139 Table : GDP by kind of economic activity at current prices, Namibia, Million Namibian dollar, Year Industrial Activity Agriculture Mining and Quarrying Manufacturing Electricity, Gas and Water Construction Wholesale and Retail Trade, Restaurant & hotels Transport and Communication Finance, Insurance, Real Estate and Business Activities General Government Services Other Services GDP at Factor Cost/Basic Prices Net Taxes on products GDP at Market/Purchasers Prices Source: Namibia Statistics Agency, November 2016 Table : Share of GDP by kind of economic activity at current prices, Namibia, (%), Industrial Activity Agriculture Mining and Quarrying Manufacturing Electricity, Gas and Water Construction Wholesale and Retail Trade, Restaurant & hotels Transport and Communication Finance, Insurance, Real Estate and Business Activities General Government Services Other Services GDP at Factor Cost/Basic Prices Source: Derived using GDP by Economic Activity components Year 139
140 Table : GDP by Expenditure at current prices, Namibia, Million Namibian dollar, Year Industrial Activity Final consumption expenditure by Households Final consumption expenditure by General Government Gross Capital formation Exports of goods & services Imports of goods & services GDP at Market/Purchasers Prices Source: Namibia Statistics Agency, November 2016 Table : Share of GDP by Expenditure at current prices, Namibia, (%), Year Industrial Activity Final consumption expenditure by Households Final consumption expenditure by General Government Gross Capital formation Exports of goods & services Imports of goods & services GDP at Market/Purchasers Prices Source: Derived using GDP by Expenditure components breakdown Table : GDP by kind of economic activity, Annual Real Growth Rates, Namibia, (%), Year Industrial Activity Agriculture Mining and Quarrying Manufacturing Electricity, Gas and Water Construction Wholesale and Retail Trade, Restaurant & hotels Transport and Communication Finance, Insurance, Real Estate and Business Activities General Government Services Other Services GDP at Factor Cost/Basic Prices Net Taxes on products GDP at Market/Purchasers Prices Source: Namibia Statistics Agency, November
141 Table : GDP by kind of economic activity at current prices, Seychelles, Million Seychelles Rupee, Year Industrial Activity Agriculture Mining and Quarrying Manufacturing Electricity, Gas and Water Construction Wholesale and Retail Trade, Restaurant & hotels Transport and Communication Finance, Insurance, Real Estate and Business Activities General Government Services Other Services GDP at Factor Cost/Basic Prices Net Taxes on products GDP at Market/Purchasers Prices Source: Seychelles Bureau of Statistics, November 2016 Table : Share of GDP by kind of economic activity at current prices, Seychelles, (%), Year Industrial Activity Agriculture Mining and Quarrying Manufacturing Electricity, Gas and Water Construction Wholesale and Retail Trade, Restaurant & hotels Transport and Communication Finance, Insurance, Real Estate and Business Activities General Government Services Other Services GDP at Factor Cost/Basic Prices Source: Derived using GDP by Economic Activity components 141
142 Table : GDP by Expenditure at current prices, Seychelles, Million Seychelles Rupee, Year Industrial Activity Final consumption expenditure by Households n.a n.a n.a n.a n.a Final consumption expenditure by General Government n.a n.a n.a n.a n.a Gross Capital formation n.a n.a n.a n.a n.a Exports of goods & services n.a n.a n.a n.a n.a Imports of goods & services n.a n.a n.a n.a n.a GDP at Market/Purchasers Prices Source: Estimated by SADC Statistics unit Table : Share of GDP by Expenditure at current prices, Seychelles, (%), Year Industrial Activity Final consumption expenditure by Households n.a n.a n.a n.a n.a Final consumption expenditure by General Government n.a n.a n.a n.a n.a Gross Capital formation n.a n.a n.a n.a n.a Exports of goods & services n.a n.a n.a n.a n.a Imports of goods & services n.a n.a n.a n.a n.a GDP at Market/Purchasers Prices Source: Derived using GDP by Expenditure components breakdown Table : GDP by kind of economic activity, Annual Real Growth Rates, Seychelles, (%), Year Industrial Activity Agriculture Mining and Quarrying Manufacturing Electricity, Gas and Water Construction Wholesale and Retail Trade, Restaurant & hotels Transport and Communication Finance, Insurance, Real Estate and Business Activities General Government Services Other Services GDP at Factor Cost/Basic Prices Net Taxes on products GDP at Market/Purchasers Prices Source: Seychelles Bureau of Statistics, November
143 Table : GDP by kind of economic activity at current prices, South Africa, Million Rand, Year Industrial Activity Agriculture Mining and Quarrying Manufacturing Electricity, Gas and Water Construction Wholesale and Retail Trade, Restaurant & hotels Transport and Communication Finance, Insurance, Real Estate and Business Activities General Government Services Other Services GDP at Factor Cost/Basic Prices Net Taxes on products GDP at Market/Purchasers Prices Source: Statistics South Africa, November 2016 Table : Share of GDP by kind of economic activity at current prices, South Africa, (%), Year Industrial Activity Agriculture Mining and Quarrying Manufacturing Electricity, Gas and Water Construction Wholesale and Retail Trade, Restaurant & hotels Transport and Communication Finance, Insurance, Real Estate and Business Activities General Government Services Other Services GDP at Factor Cost/Basic Prices Source: Derived using GDP by Economic Activity components 143
144 Table : GDP by Expenditure at current prices, South Africa, Million Rand, Year Industrial Activity Final consumption expenditure by Households Final consumption expenditure by General Government Gross Capital formation Exports of goods & services Imports of goods & services GDP at Market/Purchasers Prices Source: Statistics South Africa, November 2016 Table : Share of GDP by Expenditure at current prices, South Africa, (%), Year Industrial Activity Final consumption expenditure by Households Final consumption expenditure by General Government Gross Capital formation Exports of goods & services Imports of goods & services GDP at Market/Purchasers Prices Source: Derived using GDP by Expenditure components breakdown Table : GDP by kind of economic activity, Annual Real Growth Rates, South Africa, (%), Year Industrial Activity Agriculture Mining and Quarrying Manufacturing Electricity, Gas and Water Construction Wholesale and Retail Trade, Restaurant & hotels Transport and Communication Finance, Insurance, Real Estate and Business Activities General Government Services Other Services GDP at Factor Cost/Basic Prices Net Taxes on products GDP at Market/Purchasers Prices Source: Statistics South Africa, November
145 Table : GDP by kind of economic activity at current prices, Swaziland, Million Lilangeni, Year Industrial Activity Agriculture Mining and Quarrying Manufacturing Electricity, Gas and Water Construction Wholesale and Retail Trade, Restaurant & hotels Transport and Communication Finance, Insurance, Real Estate and Business Activities General Government Services Other Services GDP at Factor Cost/Basic Prices Net Taxes on products GDP at Market/Purchasers Prices Source: Central Statistical office, Swaziland, November 2016 Table : Share of GDP by kind of economic activity at current prices, Swaziland, (%), Year Industrial Activity Agriculture Mining and Quarrying Manufacturing Electricity, Gas and Water Construction Wholesale and Retail Trade, Restaurant & hotels Transport and Communication Finance, Insurance, Real Estate and Business Activities General Government Services Other Services GDP at Factor Cost/Basic Prices Source: Derived using GDP by Economic Activity components 145
146 Table : GDP by Expenditure at current prices, Swaziland, Million Lilangeni, Year Industrial Activity Final consumption expenditure by Households Final consumption expenditure by General Government Gross Capital formation Exports of goods & services Imports of goods & services GDP at Market/Purchasers Prices Source: Central Statistical office, Swaziland, November 2016 Table : Share of GDP by Expenditure at current prices, Swaziland, (%), Year Industrial Activity Final consumption expenditure by Households Final consumption expenditure by General Government Gross Capital formation Exports of goods & services Imports of goods & services GDP at Market/Purchasers Prices Source: Derived using GDP by Expenditure components breakdown Table : GDP by kind of economic activity, Annual Real Growth Rates, Swaziland, (%), Year Industrial Activity Agriculture Mining and Quarrying Manufacturing Electricity, Gas and Water Construction Wholesale and Retail Trade, Restaurant & hotels Transport and Communication Finance, Insurance, Real Estate and Business Activities General Government Services Other Services GDP at Factor Cost/Basic Prices Net Taxes on products GDP at Market/Purchasers Prices Source: Central Statistical office, Swaziland, November
147 Table : GDP by kind of economic activity at current prices, United Republic of Tanzania, Million Tanzanian Shilling, Year Industrial Activity Agriculture Mining and Quarrying Manufacturing Electricity, Gas and Water Construction Wholesale and Retail Trade, Restaurant & hotels Transport and Communication Finance, Insurance, Real Estate and Business Activities General Government Services Other Services GDP at Factor Cost/Basic Prices Net Taxes on products GDP at Market/Purchasers Prices Source: National Bureau of Statistics, Tanzania, November 2016 Table : Share of GDP by kind of economic activity at current prices, United Republic of Tanzania, (%), Year Industrial Activity Agriculture Mining and Quarrying Manufacturing Electricity, Gas and Water Construction Wholesale and Retail Trade, Restaurant & hotels Transport and Communication Finance, Insurance, Real Estate and Business Activities General Government Services Other Services GDP at Factor Cost/Basic Prices Source: Derived using GDP by Economic Activity components 147
148 Table : GDP by Expenditure at current prices, United Republic of Tanzania, Million Tanzanian Shilling, Year Industrial Activity Final consumption expenditure by Households Final consumption expenditure by General Government Gross Capital formation Exports of goods & services Imports of goods & services GDP at Market/Purchasers Prices Source: National Bureau of Statistics, Tanzania, November 2016 Table : Share of GDP by Expenditure at current prices, United Republic of Tanzania, (%), Year Industrial Activity Final consumption expenditure by Households Final consumption expenditure by General Government Gross Capital formation Exports of goods & services Imports of goods & services GDP at Market/Purchasers Prices Source: Derived using GDP by Expenditure components breakdown Table : GDP by kind of economic activity, Annual Real Growth Rates, United Republic of Tanzania, (%), Year Industrial Activity Agriculture Mining and Quarrying Manufacturing Electricity, Gas and Water Construction Wholesale and Retail Trade, Restaurant & hotels Transport and Communication Finance, Insurance, Real Estate and Business Activities General Government Services Other Services GDP at Factor Cost/Basic Prices Net Taxes on products GDP at Market/Purchasers Prices Source: National Bureau of Statistics, Tanzania, November
149 Table : GDP by kind of economic activity at current prices, Zambia, Million Zambian Kwacha, Year Industrial Activity Agriculture Mining and Quarrying Manufacturing Electricity, Gas and Water Construction Wholesale and Retail Trade, Restaurant & hotels Transport and Communication Finance, Insurance, Real Estate and Business Activities General Government Services Other Services GDP at Factor Cost/Basic Prices Net Taxes on products GDP at Market/Purchasers Prices Source: Central Statistical office, Zambia, November 2016 Table : Share of GDP by kind of economic activity at current prices, Zambia, (%), Year Industrial Activity Agriculture Mining and Quarrying Manufacturing Electricity, Gas and Water Construction Wholesale and Retail Trade, Restaurant & hotels Transport and Communication Finance, Insurance, Real Estate and Business Activities General Government Services Other Services GDP at Factor Cost/Basic Prices Source: Derived using GDP by Economic Activity components 149
150 Table : GDP by Expenditure at current prices, Zambia, Million Zambian Kwacha, Year Industrial Activity Final consumption expenditure by Households n.a n.a n.a n.a Final consumption expenditure by General Government n.a n.a n.a n.a Gross Capital formation n.a n.a n.a n.a Exports of goods & services n.a n.a n.a n.a Imports of goods & services n.a n.a n.a n.a GDP at Market/Purchasers Prices Source: Central Statistical office, Zambia, November 2016 Table : Share of GDP by Expenditure at current prices, Zambia, (%), Year Industrial Activity Final consumption expenditure by Households n.a n.a n.a n.a Final consumption expenditure by General Government n.a n.a n.a n.a Gross Capital formation n.a n.a n.a n.a Exports of goods & services n.a n.a n.a n.a Imports of goods & services n.a n.a n.a n.a GDP at Market/Purchasers Prices Source: Derived using GDP by Expenditure components breakdown Table : GDP by kind of economic activity, Annual Real Growth Rates, Zambia, (%), Year Industrial Activity Agriculture Mining and Quarrying Manufacturing Electricity, Gas and Water Construction Wholesale and Retail Trade, Restaurant & hotels Transport and Communication Finance, Insurance, Real Estate and Business Activities General Government Services Other Services GDP at Factor Cost/Basic Prices Net Taxes on products GDP at Market/Purchasers Prices Source: Central Statistical office, Zambia, November
151 Table : GDP by kind of economic activity at current prices, Zimbabwe, Million US $, Year Industrial Activity Agriculture Mining and Quarrying Manufacturing Electricity, Gas and Water Construction Wholesale and Retail Trade, Restaurant & hotels Transport and Communication Finance, Insurance, Real Estate and Business Activities General Government Services Other Services GDP at Factor Cost/Basic Prices Net Taxes on products GDP at Market/Purchasers Prices Source: Zimbabwe National Statistics, November 2016 Table : Share of GDP by kind of economic activity at current prices, Zimbabwe, (%), Year Industrial Activity Agriculture Mining and Quarrying Manufacturing Electricity, Gas and Water Construction Wholesale and Retail Trade, Restaurant & hotels Transport and Communication Finance, Insurance, Real Estate and Business Activities General Government Services Other Services GDP at Factor Cost/Basic Prices Source: Derived using GDP by Economic Activity components 151
152 Table : GDP by Expenditure at current prices, Zimbabwe, Million US $, Year Industrial Activity Final consumption expenditure by Households Final consumption expenditure by General Government Gross Capital formation Exports of goods & services Imports of goods & services GDP at Market/Purchasers Prices Source: Zimbabwe National Statistics, November 2016 Table : Share of GDP by Expenditure at current prices, Zimbabwe, (%), Year Industrial Activity Final consumption expenditure by Households Final consumption expenditure by General Government Gross Capital formation Exports of goods & services Imports of goods & services GDP at Market/Purchasers Prices Source: Derived using GDP by Expenditure components breakdown Table : GDP by kind of economic activity, Annual Real Growth Rates, Zimbabwe, (%), Year Industrial Activity Agriculture Mining and Quarrying Manufacturing Electricity, Gas and Water Construction Wholesale and Retail Trade, Restaurant & hotels Transport and Communication Finance, Insurance, Real Estate and Business Activities General Government Services Other Services GDP at Factor Cost/Basic Prices Net Taxes on products GDP at Market/Purchasers Prices Source: Zimbabwe National Statistics, November
153 6.2 EXTERNAL SECTOR 153
154 6.2.1 BALANCE OF PAYMENTS 154
155 Table Balance of Payments, Angola, Million US $, Million US $ Current account balance Trade account Merchandise exports (f.o.b) Merchandise imports (f.o.b) Services account Receipts Payments Income account Income receipts Income payments Current transfers (net receipts) Capital and Financial account Capital account (net receipts) Financial account Direct investment Abroad In reporting economy Portfolio investment Assets Liabilities Other Investment Assets Liabilities Reserve assets of which:foreign exchange Net Errors and omissions Source: Instituto Nacional de Estatistica, Angola, November
156 Table Balance of Payments, Botswana, Million US $, Million US $ Account balance Current account balance Trade account Merchandise exports (f.o.b) Merchandise imports (f.o.b) Services account Receipts Payments Income account Income receipts Income payments Current transfers (net receipts) Capital and Financial account Capital account (net receipts) Financial account Direct investment Abroad In reporting economy Portfolio investment Assets Liabilities Other Investment Assets Liabilities Reserve assets of which:foreign exchange Net Errors and omissions Source: Statistics Botswana, November
157 Table Balance of Payments, Democratic Republic of Congo, Million US $, Million US $ Account balance Current account balance n.a Trade account n.a Merchandise exports (f.o.b) n.a Merchandise imports (f.o.b) n.a Services account n.a Receipts n.a Payments n.a Income account n.a Income receipts n.a Income payments n.a Current transfers (net receipts) n.a Capital and Financial account Capital account (net receipts) n.a Financial account Direct investment n.a Abroad n.a In reporting economy n.a Portfolio investment n.a Assets n.a Liabilities n.a Other Investment n.a Assets n.a Liabilities n.a Reserve assets of which:foreign exchange n.a Net Errors and omissions n.a Source: Institut Nationale des Statistiques, DRC, November
158 Table Balance of Payments, Lesotho, Million US $, Million US $ Account balance Current account balance Trade account Merchandise exports (f.o.b) Merchandise imports (f.o.b) Services account Receipts Payments Income account Income receipts Income payments Current transfers (net receipts) Capital and Financial account Capital account (net receipts) Financial account Direct investment Abroad In reporting economy Portfolio investment Assets Liabilities Other Investment Assets Liabilities Reserve assets of which:foreign exchange Net Errors and omissions Source: Lesotho Bureau of Statistics, November
159 Table Balance of Payments, Madagascar, Million US $, Million US $ Account balance Current account balance Trade account Merchandise exports (f.o.b) Merchandise imports (f.o.b) Services account Receipts Payments Income account Income receipts Income payments Current transfers (net receipts) Capital and Financial account Capital account (net receipts) Financial account Direct investment Abroad n.a. n.a. In reporting economy n.a. n.a. Portfolio investment Assets Liabilities Other Investment Assets Liabilities Reserve assets of which:foreign exchange n.a. n.a. Net Errors and omissions n.a. n.a. Source: INSTAT Madagascar, November
160 Table Balance of Payments, Malawi, Million US $, Million US $ Account balance Current account balance Trade account Merchandise exports (f.o.b) Merchandise imports (f.o.b) Services account Receipts Payments Income account Income receipts Income payments Current transfers (net receipts) Capital and Financial account Capital account (net receipts) Financial account Direct investment Abroad In reporting economy Portfolio investment Assets Liabilities Other Investment Assets Liabilities Reserve assets of which:foreign exchange n.a. Net Errors and omissions Source: National Statistical Office, Malawi, November
161 Table Balance of Payments, Mauritius, Million US $, Million US $ Account balance Current account balance Trade account Merchandise exports (f.o.b) Merchandise imports (f.o.b) Services account Receipts Payments Income account Income receipts Income payments Current transfers (net receipts) Capital and Financial account Capital account (net receipts) Financial account Direct investment Abroad In reporting economy Portfolio investment Assets Liabilities Other Investment Assets Liabilities Reserve assets of which:foreign exchange Net Errors and omissions Source: Statistics Mauritius, November 2016 Note: Cross-border GBC1s capital flows are excluded from the data series 161
162 Table Balance of Payments, Mozambique, Million US $, Million US $ Account balance Current account balance Trade account Merchandise exports (f.o.b) Merchandise imports (f.o.b) Services account Receipts Payments Income account Income receipts Income payments Current transfers (net receipts) Capital and Financial account Capital account (net receipts) Financial account Direct investment Abroad In reporting economy Portfolio investment Assets Liabilities Other Investment Assets Liabilities Reserve assets of which:foreign exchange Net Errors and omissions Source: INE Mozambique, November
163 Table Balance of Payments, Namibia, Million US $, Million US $ Account balance Current account balance Trade account Merchandise exports (f.o.b) Merchandise imports (f.o.b) Services account Receipts Payments Income account Income receipts Income payments Current transfers (net receipts) Capital and Financial account Capital account (net receipts) Financial account Direct investment Abroad In reporting economy Portfolio investment Assets Liabilities Other Investment Assets Liabilities Reserve assets of which:foreign exchange Net Errors and omissions Source: Namibia Statistics Agency, November
164 Table Balance of Payments, Seychelles, Million US $, Million US $ Account balance Current account balance Trade account Merchandise exports (f.o.b) Merchandise imports (f.o.b) Services account Receipts Payments Income account Income receipts Income payments Current transfers (net receipts) Capital and Financial account Capital account (net receipts) Financial account Direct investment Abroad In reporting economy Portfolio investment Assets Liabilities Other Investment Assets Liabilities Reserve assets of which:foreign exchange Net Errors and omissions Source: Seychelles Bureau of Statistics, November
165 Table Balance of Payments, South Africa, Million US $, Million US $ Account balance Current account balance Trade account Merchandise exports (f.o.b) Merchandise imports (f.o.b) Services account Receipts Payments Income account Income receipts Income payments Current transfers (net receipts) Capital and Financial account Capital account (net receipts) Financial account Direct investment Abroad In reporting economy Portfolio investment Assets Liabilities Other Investment Assets Liabilities Reserve assets of which:foreign exchange Net Errors and omissions Source: Statistics South Africa, November
166 Table Balance of Payments, Swaziland, Million US $, Million US $ Account balance Current account balance Trade account Merchandise exports (f.o.b) Merchandise imports (f.o.b) Services account Receipts Payments Income account Income receipts Income payments Current transfers (net receipts) Capital and Financial account Capital account (net receipts) Financial account Direct investment Abroad In reporting economy Portfolio investment Assets Liabilities Other Investment Assets Liabilities Reserve assets of which:foreign exchange Net Errors and omissions Source: Central Statistical office, Swaziland, November
167 Table Balance of Payments, United Republic of Tanzania, Million US $, Million US $ Account balance Current account balance Trade account Merchandise exports (f.o.b) Merchandise imports (f.o.b) Services account Receipts Payments Income account Income receipts Income payments Current transfers (net receipts) Capital and Financial account Capital account (net receipts) Financial account Direct investment Abroad In reporting economy Portfolio investment Assets na na na na na na na na Liabilities na na na na na na na na na na Other Investment Assets Liabilities Reserve assets of which:foreign exchange Net Errors and omissions Source: National Bureau of Statistics, Tanzania, November
168 Table Balance of Payments, Zambia, Million US $, Million US $ Account balance Current account balance Trade account Merchandise exports (f.o.b) Merchandise imports (f.o.b) Services account Receipts Payments Income account Income receipts Income payments Current transfers (net receipts) Capital and Financial account Capital account (net receipts) Financial account Direct investment Abroad In reporting economy Portfolio investment Assets Liabilities Other Investment Assets Liabilities Reserve assets of which:foreign exchange Net Errors and omissions Source: Central Statistical office, Zambia, November
169 Table Balance of Payments, Zimbabwe, Million US $, Million US $ Account balance Current account balance Trade account Merchandise exports (f.o.b) Merchandise imports (f.o.b) Services account Receipts Payments Income account Income receipts Income payments Current transfers (net receipts) Capital and Financial account Capital account (net receipts) Financial account Direct investment Abroad In reporting economy Portfolio investment Assets Liabilities Other Investment Assets Liabilities Reserve assets of which:foreign exchange Net Errors and omissions Source: Zimbabwe Statistics Office, November
170 6.2.2 MERCHANDISE TRADE 170
171 Table Merchandise Trade, Angola, Million $, Million US $ INDICATORS Total Exports (FOB) Total Imports (CIF) Intra-SADC Exports (FOB) Intra-SADC Imports (CIF) Extra-SADC Exports (FOB) Extra-SADC Imports (CIF) Intra SADC-Exports by country: Botswana n.a DRC n.a Lesotho n.a Madagascar n.a Malawi n.a Mauritius n.a Mozambique n.a Namibia n.a Seychelles n.a South Africa n.a Swaziland n.a Tanzania n.a Zambia n.a Zimbabwe n.a Intra SADC-Imports by country: Botswana n.a DRC n.a Lesotho n.a Madagascar n.a Malawi n.a Mauritius n.a Mozambique n.a Namibia n.a Seychelles n.a South Africa n.a Swaziland n.a Tanzania n.a Zambia n.a Zimbabwe n.a Source: Instituto Nacional de Estatistica, Angola, November
172 Table Merchandise Trade, Botswana, Million $, Million US $ INDICATORS Total Exports (FOB) Total Imports (CIF) Intra-SADC Exports (FOB) Intra-SADC Imports (CIF) Extra-SADC Exports (FOB) Extra-SADC Imports (CIF) Intra SADC-Exports by country: Angola DRC Lesotho Madagascar Malawi Mauritius Mozambique Namibia Seychelles South Africa Swaziland Tanzania Zambia Zimbabwe Intra SADC-Imports by country: Angola DRC Lesotho Madagascar Malawi Mauritius Mozambique Namibia Seychelles South Africa Swaziland Tanzania Zambia Zimbabwe Source: Statistics Botswana, November
173 Table Merchandise Trade, Democratic Republic of Congo, Million $, Million US $ INDICATORS Total Exports (FOB) n.a Total Imports (CIF) n.a Intra-SADC Exports (FOB) n.a Intra-SADC Imports (CIF) n.a Extra-SADC Exports (FOB) n.a Extra-SADC Imports (CIF) n.a Intra SADC-Exports by country: Angola n.a n.a n.a n.a n.a Botswana n.a n.a n.a n.a n.a Lesotho n.a n.a n.a n.a n.a Madagascar n.a n.a n.a n.a n.a Malawi n.a n.a n.a n.a n.a Mauritius n.a n.a n.a n.a n.a Mozambique n.a n.a n.a n.a n.a Namibia n.a n.a n.a n.a n.a Seychelles n.a n.a n.a n.a n.a South Africa n.a n.a n.a n.a n.a Swaziland n.a n.a n.a n.a n.a Tanzania n.a n.a n.a n.a n.a Zambia n.a n.a n.a n.a n.a Zimbabwe n.a n.a n.a n.a n.a Intra SADC-Imports by country: Angola n.a n.a n.a n.a n.a Botswana n.a n.a n.a n.a n.a Lesotho n.a n.a n.a n.a n.a Madagascar n.a n.a n.a n.a n.a Malawi n.a n.a n.a n.a n.a Mauritius n.a n.a n.a n.a n.a Mozambique n.a n.a n.a n.a n.a Namibia n.a n.a n.a n.a n.a Seychelles n.a n.a n.a n.a 0.20 n.a n.a South Africa n.a n.a n.a n.a n.a Swaziland n.a n.a n.a n.a n.a Tanzania n.a n.a n.a n.a n.a Zambia n.a n.a n.a n.a n.a Zimbabwe n.a n.a n.a n.a n.a Source: INSTAT RDC, November
174 Table Merchandise Trade, Lesotho, Million $, Million US $ INDICATORS Total Exports (FOB) n.a. n.a. Total Imports (CIF) n.a. n.a. Intra-SADC Exports (FOB) n.a. n.a. Intra-SADC Imports (CIF) n.a. n.a. Extra-SADC Exports (FOB) n.a. n.a. Extra-SADC Imports (CIF) n.a. n.a. Intra SADC-Exports by country: Angola n.a. n.a. Botswana n.a. n.a. DRC 0.09 n.a. n.a. Madagascar n.a. n.a. Malawi 0.03 n.a. n.a. Mauritius n.a. n.a. Mozambique n.a. n.a. Namibia n.a. n.a. Seychelles n.a. n.a. South Africa n.a. n.a. Swaziland n.a. n.a. Tanzania n.a. n.a. Zambia 0.04 n.a. n.a. Zimbabwe n.a. n.a. Intra SADC-Imports by country: Angola n.a. n.a. n.a. n.a. n.a. n.a n.a. n.a. Botswana n.a n.a n.a n.a. n.a. DRC n.a. n.a. n.a. n.a. n.a n.a. n.a. n.a. n.a. Madagascar n.a. n.a. n.a. n.a n.a. n.a n.a. n.a. Malawi n.a. n.a. n.a. n.a n.a. n.a. n.a. n.a. n.a. Mauritius n.a. n.a. n.a. n.a n.a n.a. n.a. Mozambique n.a. n.a. n.a n.a. n.a. Namibia n.a. n.a n.a n.a n.a. n.a. Seychelles n.a. n.a. n.a. n.a. n.a. n.a. n.a n.a. n.a. South Africa n.a. n.a. Swaziland n.a. n.a. Tanzania n.a n.a n.a. n.a. n.a. n.a. Zambia n.a. n.a. n.a. n.a n.a n.a. n.a. Zimbabwe n.a. n.a. n.a. n.a n.a. n.a. Source: Lesotho Bureau of Statistics, November
175 Table Merchandise Trade, Madagascar, Million $, Million US $ INDICATORS Total Exports (FOB) Total Imports (CIF) Intra-SADC Exports (FOB) Intra-SADC Imports (CIF) Extra-SADC Exports (FOB) Extra-SADC Imports (CIF) Intra SADC-Exports by country: Angola n.a n.a n.a n.a Botswana n.a n.a n.a n.a DRC n.a n.a n.a n.a Lesotho n.a n.a n.a n.a Malawi n.a n.a n.a n.a Mauritius n.a n.a n.a n.a Mozambique n.a n.a n.a n.a Namibia n.a n.a n.a n.a Seychelles n.a n.a n.a n.a South Africa n.a n.a n.a n.a Swaziland n.a n.a n.a n.a Tanzania n.a n.a n.a n.a Zambia n.a n.a n.a n.a Zimbabwe n.a n.a n.a n.a Intra SADC-Imports by country: Angola n.a n.a n.a n.a Botswana n.a n.a n.a n.a DRC n.a n.a n.a n.a Lesotho n.a n.a n.a n.a Malawi n.a n.a n.a n.a Mauritius n.a n.a n.a n.a Mozambique n.a n.a n.a n.a Namibia n.a n.a n.a n.a Seychelles n.a n.a n.a n.a South Africa n.a n.a n.a n.a Swaziland n.a n.a n.a n.a Tanzania n.a n.a n.a n.a Zambia n.a n.a n.a n.a Zimbabwe n.a n.a n.a n.a Source: INSTAT Madagascar, November
176 Table Merchandise Trade, Malawi, Million $, Million US $ INDICATORS Total Exports (FOB) Total Imports (CIF) Intra-SADC Exports (FOB) Intra-SADC Imports (CIF) Extra-SADC Exports (FOB) Extra-SADC Imports (CIF) Intra SADC-Exports by country: Angola Botswana DRC Lesotho Madagascar Mauritius Mozambique Namibia Seychelles South Africa Swaziland Tanzania Zambia Zimbabwe Intra SADC-Imports by country: Angola Botswana DRC Lesotho Madagascar Mauritius Mozambique Namibia Seychelles South Africa Swaziland Tanzania Zambia Zimbabwe Source: National Statistical Office, Malawi, November
177 Table Merchandise Trade, Mauritius, Million $, Million US $ INDICATORS Total Exports (FOB) Total Imports (CIF) Intra-SADC Exports (FOB) Intra-SADC Imports (CIF) Extra-SADC Exports (FOB) Extra-SADC Imports (CIF) Intra SADC-Exports by country: Angola Botswana DRC Lesotho Madagascar Malawi Mozambique Namibia Seychelles South Africa Swaziland Tanzania Zambia Zimbabwe Intra SADC-Imports by country: Angola Botswana DRC Lesotho Madagascar Malawi Mozambique Namibia Seychelles South Africa Swaziland Tanzania Zambia Zimbabwe Source: Statistics Mauritius, November
178 Table Merchandise Trade, Mozambique, Million $, Million US $ INDICATORS Total Exports (FOB) Total Imports (CIF) Intra-SADC Exports (FOB) Intra-SADC Imports (CIF) Extra-SADC Exports (FOB) Extra-SADC Imports (CIF) Intra SADC-Exports by country: Angola Botswana Congo (D.R.C) Lesotho Madagascar Malawi Mauritius Namibia Seychelles South Afirca (Republic of) Swaziland U. Rep. of Tanzania Zambia Zimbabwe Intra SADC-Imports by country: Angola Botswana Congo (D.R.C) Lesotho Madagascar Malawi Mauritius Namibia Seychelles South Afirca (Republic of) Swaziland U. Rep. of Tanzania Zambia Zimbabwe Source: INE Mozambique, November
179 Table Merchandise Trade, Namibia, Million $, Million US $ INDICATORS Total Exports (FOB) Total Imports (CIF) Intra-SADC Exports (FOB) Intra-SADC Imports (CIF) Extra-SADC Exports (FOB) Extra-SADC Imports (CIF) Intra SADC-Exports by country: Angola Botswana DRC Lesotho Madagascar Malawi Mauritius Mozambique Seychelles South Africa Swaziland Tanzania Zambia Zimbabwe Intra SADC-Imports by country: Angola Botswana DRC Lesotho Madagascar Malawi Mauritus Mozambique Seychelles South Africa Swaziland Tanzania Zambia Zimbabwe Source: Namibia Statistics Agency, November
180 Table Merchandise Trade, Seychelles, Million $, Million US $ INDICATORS Total Exports (FOB) Total Imports (CIF) Intra-SADC Exports (FOB) Intra-SADC Imports (CIF) Extra-SADC Exports (FOB) Extra-SADC Imports (CIF) Intra SADC-Exports by country: Angola Botswana DRC Lesotho Madagascar Malawi Mauritius Mozambique Namibia South Africa Swaziland Tanzania Zambia Zimbabwe Intra SADC-Imports by country: Angola Botswana DRC Lesotho Madagascar Malawi Mauritus Mozambique Namibia South Africa Swaziland Tanzania Zambia Zimbabwe Source: Seychelles Bureau of Statistics, November
181 Table Merchandise Trade, South Africa, Million $, Million US $ INDICATORS Total Exports (FOB) Total Imports (CIF) Intra-SADC Exports (FOB) Intra-SADC Imports (CIF) Extra-SADC Exports (FOB) Extra-SADC Imports (CIF) Intra SADC-Exports by country: Angola Botswana DRC Lesotho Madagascar Malawi Mauritius Mozambique Namibia Seychelles Swaziland Tanzania Zambia Zimbabwe Intra SADC-Imports by country: Angola Botswana DRC Lesotho Madagascar Malawi Mauritus Mozambique Namibia Seychelles Swaziland Tanzania Zambia Zimbabwe Source: Statistics South Africa, November
182 Table Merchandise Trade, Swaziland, Million $, Million US $ INDICATORS Total Exports (FOB) Total Imports (CIF) Intra-SADC Exports (FOB) Intra-SADC Imports (CIF) Extra-SADC Exports (FOB) Extra-SADC Imports (CIF) Intra SADC-Exports by country: Angola Botswana DRC Lesotho Madagascar Malawi Mauritius Mozambique Namibia Seychelles South Africa Tanzania Zambia Zimbabwe Intra SADC-Imports by country: Angola Botswana DRC Lesotho Madagascar Malawi Mauritus Mozambique Namibia Seychelles South Africa Tanzania Zambia Zimbabwe Source: Central Statistical office, Swaziland, November
183 Table Merchandise Trade, Tanzania, Million $, Million US $ INDICATORS Total Exports (FOB) Total Imports (CIF) Intra-SADC Exports (FOB) Intra-SADC Imports (CIF) Extra-SADC Exports (FOB) Extra-SADC Imports (CIF) Intra SADC-Exports by country: Angola Botswana DRC Lesotho Madagascar Malawi Mauritius Mozambique Namibia Seychelles South Africa Swaziland Zambia Zimbabwe Intra SADC-Imports by country: Angola Botswana DRC Lesotho Madagascar Malawi Mauritus Mozambique Namibia Seychelles South Africa Swaziland Zambia Zimbabwe Source: National Bureau of Statistics, Tanzania, November
184 Table Merchandise Trade, Zambia, Million $, Million US $ INDICATORS Total Exports (FOB) Total Imports (CIF) Intra-SADC Exports (FOB) Intra-SADC Imports (CIF) Extra-SADC Exports (FOB) Extra-SADC Imports (CIF) Intra SADC-Exports by country: Angola Botswana DRC Lesotho Madagascar Malawi Mauritius Mozambique Namibia Seychelles South Africa Swaziland Tanzania Zimbabwe Intra SADC-Imports by country: Angola Botswana DRC Lesotho Madagascar Malawi Mauritus Mozambique Namibia Seychelles South Africa Swaziland Tanzania Zimbabwe Source: Central Statistical office, Zambia, November
185 Table Merchandise Trade, Zimbabwe, Million $, Million US $ INDICATORS Total Exports (FOB) Total Imports (CIF) Intra-SADC Exports (FOB) Intra-SADC Imports (CIF) Extra-SADC Exports (FOB) Extra-SADC Imports (CIF) Intra SADC-Exports by country: Angola Botswana DRC Lesotho Madagascar Malawi Mauritius Mozambique Namibia Seychelles South Africa Swaziland Tanzania Zambia Intra SADC-Imports by country: Angola Botswana DRC Lesotho Madagascar Malawi Mauritus Mozambique Namibia Seychelles South Africa Swaziland Tanzania Zambia Source: Zimbabwe Statistics Office, November
186 6.2.3 EXTERNAL TRADE IN SERVICES 186
187 Table Exports of Services in SADC, Million US $, Year Member States Angola Botswana Democratic Republic of Congo (DRC) n.a Lesotho Madagascar Malawi Mauritius Mozambique Namibia Seychelles South Africa Swaziland United Republic of Tanzania Zambia Zimbabwe Table Imports of Services in SADC, Million US $, Year Member States Angola Botswana Democratic Republic of Congo (DRC) n.a Lesotho Madagascar Malawi Mauritius Mozambique Namibia n.a Seychelles South Africa Swaziland United Republic of Tanzania Zambia Zimbabwe Source: National Statistical Offices of Member States, November
188 Table Exports of Transportation Services in SADC, Million US $, Year Member States Angola Botswana Democratic Republic of Congo (DRC) n.a Lesotho Madagascar Malawi Mauritius Mozambique Namibia n.a Seychelles South Africa Swaziland United Republic of Tanzania Zambia Zimbabwe n.a n.a n.a n.a n.a n.a n.a n.a n.a n.a Table Imports of Transportation Services in SADC, Million US $, Year Member States Angola Botswana Democratic Republic of Congo (DRC) n.a Lesotho Madagascar Malawi Mauritius Mozambique Namibia Seychelles South Africa Swaziland United Republic of Tanzania Zambia Zimbabwe n.a n.a n.a n.a n.a n.a n.a n.a n.a n.a Source: National Statistical Offices of Member States, November
189 Table Exports of Travel Services in SADC, Million US $, Year Member States Angola Botswana Democratic Republic of Congo (DRC) n.a Lesotho Madagascar Malawi Mauritius Mozambique Namibia n.a Seychelles South Africa Swaziland United Republic of Tanzania Zambia Zimbabwe n.a n.a n.a n.a n.a n.a n.a n.a n.a n.a Table Imports of Travel Services in SADC, Million US $, Year Member States Angola Botswana Democratic Republic of Congo (DRC) n.a Lesotho Madagascar Malawi Mauritius Mozambique Namibia Seychelles South Africa Swaziland United Republic of Tanzania Zambia Zimbabwe n.a n.a n.a n.a n.a n.a n.a n.a n.a n.a Source: National Statistical Offices of Member States, November
190 Table Exports of Other Services in SADC, Million US $, Year Member States Angola Botswana Democratic Republic of Congo (DRC) n.a Lesotho Madagascar Malawi Mauritius Mozambique Namibia n.a Seychelles South Africa Swaziland United Republic of Tanzania Zambia Zimbabwe n.a n.a n.a n.a n.a n.a n.a n.a n.a n.a Table Imports of Other Services in SADC, Million US $, Year Member States Angola Botswana Democratic Republic of Congo (DRC) n.a Lesotho Madagascar Malawi Mauritius Mozambique Namibia n.a Seychelles South Africa Swaziland United Republic of Tanzania Zambia Zimbabwe n.a n.a n.a n.a n.a n.a n.a n.a n.a n.a Source: National Statistical Offices of Member States, November
191 6.2.4 FINANCING AND EXTERNAL DEBT 191
192 Table Current Account Balance in SADC, Million $, Year Member States Angola Botswana Democratic Republic of Congo (DRC) n.a Lesotho Madagascar Malawi Mauritius Mozambique Namibia Seychelles South Africa Swaziland United Republic of Tanzania Zambia Zimbabwe Table Current Account Balance as a % of GDP in SADC, (%), Year Member States Angola Botswana Democratic Republic of Congo (DRC) n.a Lesotho Madagascar Malawi Mauritius Mozambique Namibia Seychelles South Africa Swaziland United Republic of Tanzania Zambia Zimbabwe Source: National Statistical Offices of Member States, November
193 Table Total External Debt in SADC, Million US $, Year Member States Angola Botswana Democratic Republic of Congo (DRC) Lesotho Madagascar Malawi Mauritius Mozambique Namibia Seychelles South Africa Swaziland United Republic of Tanzania Zambia Zimbabwe TOTAL SADC Table Total External Debt as Percentage of GDP in SADC, (%), Year Member States Angola Botswana Democratic Republic of Congo (DRC) Lesotho Madagascar Malawi Mauritius Mozambique Namibia Seychelles South Africa Swaziland United Republic of Tanzania Zambia Zimbabwe TOTAL SADC Source: National Statistical Offices of Member States, November
194 Table Debt Servicing Flows in SADC, Million US $, Year Member States Angola Botswana Democratic Republic of Congo (DRC) n.a Lesotho Madagascar n.a Malawi Mauritius Mozambique n.a n.a n.a Namibia n.a n.a n.a n.a n.a n.a n.a n.a n.a n.a Seychelles n.a n.a n.a South Africa Swaziland United Republic of Tanzania Zambia Zimbabwe Table Debt Service Ratio in SADC, (%), Year Member States Angola Botswana Democratic Republic of Congo (DRC) n.a n.a Lesotho Madagascar n.a Malawi Mauritius Mozambique n.a n.a n.a Namibia n.a n.a n.a n.a n.a n.a n.a n.a n.a n.a Seychelles n.a n.a n.a South Africa Swaziland United Republic of Tanzania Zambia Zimbabwe Source: National Statistical Offices of Member States, November
195 Table International Reserves Position at end of the Year in SADC, Million US $, Year Member States Angola Botswana Democratic Republic of Congo (DRC) Lesotho Madagascar Malawi Mauritius Mozambique Namibia Seychelles South Africa Swaziland United Republic of Tanzania Zambia Zimbabwe TOTAL SADC Table Imports Cover in SADC, Number of Weeks, Year Member States Angola Botswana Democratic Republic of Congo (DRC) n.a Lesotho Madagascar Malawi Mauritius Mozambique Namibia Seychelles South Africa Swaziland United Republic of Tanzania Zambia Zimbabwe Source: National Statistical Offices of Member States, November
196 6.3 GOVERNMENT ACCOUNTS 196
197 Table Total Revenue and Grants in SADC, Million National Currency, Million National Currency Country National Currency Angola Kwanza Botswana Pula Democratic Republic of Congo Franc Congolais n.a Lesotho Loti Madagascar Ariary Malawi Malawian kwacha Mauritius Mauritian Rupee Mozambique Metical Namibia Namibia Dollar Seychelles Seychelles Rupee South Africa Rand Swaziland Lilangeni United Republic of Tanzania Shilling Zambia Zambian Kwacha Zimbabwe US dollar Source: National Statistical Offices of Member States, November 2016 Table Total Expenditures and Net Lending in SADC, Million National Currency, Million National Currency Country National Currency Angola Kwanza Botswana Pula Democratic Republic of Congo Franc Congolais n.a Lesotho Loti Madagascar Ariary Malawi Malawian kwacha Mauritius Mauritian Rupee Mozambique Metical Namibia Namibia Dollar Seychelles Seychelles Rupee South Africa Rand Swaziland Lilangeni United Republic of Tanzania Shilling Zambia Zambian Kwacha Zimbabwe US dollar Source: National Statistical Offices of Member States, November
198 Table Current Expenditure in SADC, Million National Currency, Million National Currency Country National Currency Angola Kwanza Botswana Pula Democratic Republic of Congo Franc Congolais n.a Lesotho Loti Madagascar Ariary Malawi Malawian kwacha Mauritius Mauritian Rupee Mozambique Metical Namibia Namibia Dollar Seychelles Seychelles Rupee South Africa Rand Swaziland Lilangeni United Republic of Tanzania Shilling Zambia Zambian Kwacha Zimbabwe US dollar Source: National Statistical Offices of Member States, November 2016 Table Capital Expenditure in SADC, Million National Currency, Million National Currency Country National Currency Angola Kwanza Botswana Pula Democratic Republic of Congo Franc Congolais n.a Lesotho Loti Madagascar Ariary Malawi Malawian kwacha Mauritius Mauritian Rupee Mozambique Metical Namibia Namibia Dollar Seychelles Seychelles Rupee South Africa Rand Swaziland Lilangeni United Republic of Tanzania Shilling Zambia Zambian Kwacha Zimbabwe US dollar Source: National Statistical Offices of Member States, November
199 Table Fiscal Balance in SADC, Million National Currency, Year Member States Angola Botswana Democratic Republic of Congo (DRC) n.a Lesotho Madagascar Malawi Mauritius Mozambique Namibia Seychelles South Africa Swaziland United Republic of Tanzania Zambia Zimbabwe Table Fiscal balance as a Percentage of GDP, SADC, (%), Year Member States Angola Botswana Democratic Republic of Congo (DRC) n.a Lesotho Madagascar Malawi Mauritius Mozambique Namibia Seychelles South Africa Swaziland United Republic of Tanzania Zambia Zimbabwe Source: National Statistical Offices of Member States, November
200 Table Stock of Government Debt at end of year, Million National Currency, Year Member States Angola 193, ,049 1,044,162 1,122,128 1,243,093 1,191,912 1,133,118 1,340,620 1,884,437 2,884,737 Botswana 3,699 3,788 4,505 5,864 13,938 18,790 20,608 21,902 23,609 25,447 Democratic Republic of Congo (DRC) n.a n.a n.a n.a n.a 5,408,228 5,643,992 6,114,180 5,847,492 n.a Lesotho 5,336 6,269 6,959 5,714 5,739 6,783 9,136 9,703 10,932 12,522 Madagascar 4,738, ,000 10, , , , , , ,000 1,060,600 Malawi 140, , , , , , , , ,401 1,765,969 Mauritius 114, , , , , , , , , ,475 Mozambique 88,982 92,955 95, , , , , , , ,593 Namibia 13,638 11,925 13,495 11,923 13,877 24,719 27,021 30,663 35,958 56,270 Seychelles 7,563 9,175 17,053 12,026 9,685 11,340 11,340 10,732 12,275 12,381 South Africa 528, , , , , ,171 1,187,763 1,365,646 1,584,669 1,798,812 Swaziland n.a n.a n.a 3,204 4,251 4,480 5,303 6,271 6,847 8,349 United Republic of Tanzania 9,152,261 8,845,253 9,253,094 12,847,534 15,481,788 19,492,570 21,913,743 27,219,890 29,054,830 34,950,561 Zambia 7,700,730 9,385,250 9,736,400 11,885,620 12,633,660 16,155,300 18,526,560 23,257,530 28,306,800 33,918,500 Zimbabwe 4,255 4,617 4,699 6,299 6,705 7,397 7,509 8,934 10,838 10,684 Table Stock of Government Debt as a Percentage of GDP, SADC, (%), Year Member States Angola Botswana Democratic Republic of Congo (DRC) n.a n.a n.a n.a n.a n.a Lesotho Madagascar Malawi Mauritius Mozambique Namibia Seychelles South Africa Swaziland n.a n.a n.a United Republic of Tanzania Zambia Zimbabwe Source: National Statistical Offices of Member States, November
201 6.4 MONEY AND BANKING 201
202 Table Broad Money Supply (M2) in SADC, Million National Currency, Country Angola Botswana Democratic Republic of Congo Lesotho Madagascar Malawi Mauritius Mozambique Namibia Seychelles South Africa Swaziland United Republic of Tanzania Zambia Zimbabwe National Currency Kwanza Pula Franc Congolais Loti Ariary Malawian kwacha Mauritian Rupee Metical Namibia Dollar Seychelles Rupee Rand Lilangeni Shilling Zambian Kwacha US dollar Million National Currency n.a n.a n.a n.a Source: National Statistical Offices of Member States, November
203 Table Broad Money Supply (M2) Nominal Growth, SADC, (%), Percent (%) Country Angola Botswana Democratic Republic of Congo n.a Lesotho Madagascar Malawi Mauritius Mozambique Namibia Seychelles South Africa Swaziland United Republic of Tanzania Zambia Zimbabwe n.a n.a n.a n.a Source: Computed by taking nominal change in Money Supply data in table Table Broad Money Supply (M2) as a Percentage of GDP, SADC, (%), Percent (%) Country Angola Botswana Democratic Republic of Congo n.a Lesotho Madagascar Malawi Mauritius Mozambique Namibia Seychelles South Africa Swaziland United Republic of Tanzania Zambia Zimbabwe n.a n.a n.a Source: Computed by using GDP at Market Price data in local currency for each country 203
204 Table Monetary Base in SADC, Million National Currency, Country Angola Botswana Democratic Republic of Congo Lesotho Madagascar Malawi Mauritius Mozambique Namibia Seychelles South Africa Swaziland United Republic of Tanzania Zambia Zimbabwe National Currency Kwanza Pula Franc Congolais Loti Ariary Malawian kwacha Mauritian Rupee Metical Namibia Dollar Seychelles Rupee Rand Lilangeni Shilling Zambian Kwacha US dollar Million National Currency n.a n.a n.a n.a n.a n.a n.a n.a n.a n.a n.a n.a n.a n.a n.a n.a n.a n.a n.a n.a n.a n.a n.a n.a n.a n.a n.a n.a n.a n.a n.a n.a n.a n.a n.a n.a n.a n.a n.a n.a n.a n.a n.a n.a n.a n.a Source: National Statistical Offices of Member States, November
205 Table Domestic Credit: Net Claims on Central Government Sector in SADC, Million National Currency, Million National Currency Country National Currency Angola Kwanza Botswana Pula Democratic Republic of Congo Franc Congolais n.a n.a n.a Lesotho Loti Madagascar Ariary Malawi Malawian kwacha Mauritius Mauritian Rupee Mozambique Metical Namibia Namibia Dollar Seychelles Seychelles Rupee South Africa Rand Swaziland Lilangeni United Republic of Tanzania Shilling Zambia Zambian Kwacha Zimbabwe US dollar n.a n.a n.a Source: National Statistical Offices of Member States, November 2016 Table Domestic Credit: Claims on Other Sectors in SADC, Million National Currency, Million National Currency Country National Currency Angola Kwanza Botswana Pula Democratic Republic of Congo Franc Congolais n.a n.a n.a Lesotho Loti Madagascar Ariary Malawi Malawian kwacha Mauritius Mauritian Rupee Mozambique Metical Namibia Namibia Dollar Seychelles Seychelles Rupee South Africa Rand Swaziland Lilangeni United Republic of Tanzania Shilling Zambia Zambian Kwacha Zimbabwe US dollar n.a n.a n.a Source: National Statistical Offices of Member States, November
206 Table Interest Rates : 3-Month Deposits in SADC, (%), Percent (%) Country Angola Botswana Democratic Republic of Congo n.a n.a n.a n.a n.a Lesotho Madagascar n.a n.a n.a n.a n.a n.a n.a n.a n.a n.a Malawi Mauritius Mozambique Namibia n.a Seychelles South Africa Swaziland United Republic of Tanzania Zambia Zimbabwe Source: National Statistical Offices of Member States, November 2016 Table Interest Rates : Minimum Lending Rate in SADC, (%), Percent (%) Country Angola Botswana Democratic Republic of Congo n.a n.a n.a n.a Lesotho Madagascar n.a n.a n.a n.a n.a n.a n.a n.a n.a n.a Malawi Mauritius Mozambique Namibia n.a Seychelles South Africa Swaziland United Republic of Tanzania Zambia Zimbabwe Source: National Statistical Offices of Member States, November
207 Table Exchange Rates, National Currency Per 1 US $ in SADC, National Currency per 1 USD Country National Currency Angola Kwanza Botswana Pula Democratic Republic of Congo Franc Congolais Lesotho Loti Madagascar Ariary Malawi Malawian kwacha Mauritius Mauritian Rupee Mozambique Metical Namibia Namibia Dollar Seychelles Seychelles Rupee South Africa Rand Swaziland Lilangeni United Republic of Tanzania Shilling Zambia Zambian Kwacha Zimbabwe Zimbabwean dollar Source: National Statistical Offices of Member States, November 2016 Note: The Zimbabwean economy was dollarized to the US Dollar from 2009 The Zambian currency was rebased as from 2013 Table Exchange Rates, National Currency Per 1 EURO in SADC, National Currency per 1 Euro Country National Currency Angola Kwanza Botswana Pula Democratic Republic of Congo Franc Congolais n.a n.a n.a n.a n.a n.a Lesotho Loti Madagascar Ariary Malawi Malawian kwacha Mauritius Mauritian Rupee Mozambique Metical Namibia Namibia Dollar n.a n.a Seychelles Seychelles Rupee South Africa Rand Swaziland Lilangeni United Republic of Tanzania Shilling n.a n.a Zambia Zambian Kwacha Zimbabwe US dollar n.a n.a n.a n.a n.a n.a n.a n.a n.a n.a Source: National Statistical Offices of Member States, November
208 Table Exchange Rates, National Currency Per 1 RAND in SADC, National Currency per 1 RAND Country National Currency Angola Kwanza Botswana Pula Democratic Republic of Congo Franc Congolais n.a n.a n.a n.a n.a n.a Lesotho Loti Madagascar Ariary Malawi Malawian kwacha Mauritius Mauritian Rupee Mozambique Metical Namibia Namibia Dollar Seychelles Seychelles Rupee South Africa Rand Swaziland Lilangeni United Republic of Tanzania Shilling n.a n.a Zambia Zambian Kwacha Zimbabwe US dollar n.a n.a n.a n.a n.a n.a n.a n.a n.a n.a Source: National Statistical Offices of Member States, November 2016 Table Exchange Rates, National Currency Per 1 POUND STERLING in SADC, National Currency per 1 GBP Country National Currency Angola Kwanza n.a. n.a. n.a. n.a. n.a. n.a Botswana Pula Democratic Republic of Congo Franc Congolais n.a n.a n.a n.a n.a n.a Lesotho Loti Madagascar Ariary Malawi Malawian kwacha Mauritius Mauritian Rupee Mozambique Metical Namibia Namibia Dollar n.a n.a Seychelles Seychelles Rupee South Africa Rand Swaziland Lilangeni United Republic of Tanzania Shilling n.a n.a Zambia Zambian Kwacha Zimbabwe US dollar n.a n.a n.a n.a n.a n.a n.a n.a n.a n.a Source: National Statistical Offices of Member States, November
209 6.5 PRICES 209
210 Table Annual Headline Inflation rate - Period Average, as measured by National Consumer Price Index in SADC, (%), Percent (%) Member States Angola Botswana Democratic Republic of Congo (DRC) Lesotho Madagascar Malawi Mauritius Mozambique Namibia Seychelles South Africa Swaziland United Republic of Tanzania Zambia Zimbabwe Source: National Statistical Offices of Member States, November 2016 Table Year on Year Inflation rate - as at December, as measured by National Consumer Price Index in SADC, (%), Percent (%) Member States Angola Botswana Democratic Republic of Congo (DRC) n.a n.a n.a n.a n.a n.a n.a Lesotho Madagascar Malawi n.a n.a n.a n.a n.a n.a n.a Mauritius Mozambique Namibia Seychelles n.a n.a South Africa Swaziland n.a United Republic of Tanzania Zambia n.a n.a n.a n.a n.a Zimbabwe Source: National Statistical Offices of Member States, November
211 Table Annual Inflation rate (DIV 01:Food and Non-Alcoholic Beverages) - Period Average, as measured by National Consumer Price Index in SADC, (%), Percent (%) Member States Angola Botswana Democratic Republic of Congo (DRC) n.a n.a n.a n.a n.a n.a Lesotho Madagascar Malawi n.a n.a n.a n.a n.a n.a n.a Mauritius Mozambique Namibia Seychelles n.a n.a South Africa n.a n.a n.a Swaziland n.a United Republic of Tanzania Zambia n.a n.a n.a n.a n.a Zimbabwe n.a n.a n.a n.a Source: National Statistical Offices of Member States, November 2016 Table Annual Inflation rate (DIV 04:Housing, water, electricity, gas & other fuels) - Period Average, as measured by National Consumer Price Index in SADC, (%), Percent (%) Member States Angola Botswana Democratic Republic of Congo (DRC) n.a n.a n.a n.a n.a n.a Lesotho Madagascar Malawi n.a n.a n.a n.a n.a n.a n.a Mauritius Mozambique Namibia Seychelles n.a n.a South Africa n.a n.a n.a Swaziland n.a United Republic of Tanzania Zambia n.a n.a n.a n.a n.a Zimbabwe n.a n.a n.a n.a Source: National Statistical Offices of Member States, November
212 Table Annual Inflation rate (DIV 07:Transport) - Period Average, as measured by National Consumer Price Index in SADC, (%), Percent (%) Member States Angola Botswana Democratic Republic of Congo (DRC) n.a n.a n.a n.a n.a n.a Lesotho Madagascar Malawi n.a n.a n.a n.a n.a n.a n.a Mauritius Mozambique Namibia Seychelles n.a n.a South Africa n.a n.a n.a Swaziland n.a United Republic of Tanzania Zambia n.a n.a n.a n.a n.a Zimbabwe n.a n.a n.a n.a Source: National Statistical Offices of Member States, November 2016 Table Annual Headline Inflation rate, as measured by Harmonized Consumer Price Index (HCPI) in SADC, (%), Period Average Year on Year - End Member States Angola n.a n.a n.a n.a Botswana Democratic Republic of Congo (DRC) Lesotho Madagascar Malawi Mauritius Mozambique Namibia Seychelles South Africa Swaziland United Republic of Tanzania Zambia Zimbabwe Source: NSOs of Member Stat SADC
213 Table International Comparisons Programme (ICP-Africa), Selected Indicators for SADC and 2009 Rounds Country Price level index, GDP (Africa=1), 2005 Real Per Capita Expenditures, GDP (AFRIC),2005 Real Expenditure Country Shares, GDP (Africa=100%), 2005 Price level index, ICEH (Africa=1), 2005 Price level index, ICEH (Africa=1), 2009 Per capita real Expenditure s, ICEH (AFRIC), 2005 Per capita real Expenditure s, ICEH (AFRIC), 2009 Real Expenditure in Billion AFRIC, ICEH,2009 Real Expenditures, countries shares (Africa=100 %), 2005 Real Expenditures, countries shares, ICEH (Africa=100%), 2009 Angola 1.2 1, n.a n.a n.a 0.9 n.a Botswana 1.1 5, , , Democratic Republic of Congo Lesotho Madagascar Malawi Mauritius 1.1 4, , , Mozambique Namibia 1.5 2, , , Seychelles n.a n.a n.a n.a 1.5 n.a 4, n.a 0.0 South Africa 1.4 3, , , Swaziland 1.2 1, , , Tanzania Zambia Zimbabwe Notes Sources: Comparative Outputs, Incomes and Price Levels in African Countries - Final Results of the 2005 Round of the International Comparisons Program for Africa A Comparison of Real Household Consumption Expenditures and Price Levels in Africa 2012, 2009 ICP - Africa Results Data for the GDP Indicators in the above table were obtained from Table S0: Per C apita Gross Domestic Product and Price Level Index, By Country, in the ICP - Africa report Data for the ICEH indicators were obtained from Table S1: Per Capita Individual Consumption Expenditures and Price Level, By Country International $ = PPP GDP - Gross Domestic Product PPP - Purchasing Power Parity ICEH- Individual Consumption Expenditure by Households Zimbabwe data were suppressed because of extreme volatility in the official exchange rate AFRIC- African Regional Currency Table International Comparisons Programme (Global ICP) Selected Indicators for SADC, 2005 ICP GDP GDP per capita PPP Exchange rate Price level Index, GDP (World=100) Price level index, ICEH (World=100 ) ICEH ICEH per capita Country (International $ millions) (PPP) (US $=1) (US $=1 Percent Percent (Internation al $ millions) (Internation al $) Angola Notes Botswana Table , Source, ICP Global report Democratic Republic of Congo Data for the above indicators were obtained from the following tables in the ICP Global report Lesotho Madagascar Malawi International $ = PPP Mauritius Mozambique Namibia Seychelles n.a n.a n.a n.a n.a n.a n.a n.a South Africa Exchange Rate: Refers to the exchange rate determined by national authorities or to the rate determined in the legally sanctioned exchange market. It is calculated as an annual average of local Swaziland GDP - Gross Domestic Product Tanzania PPP - Purchasing Power Parity Zambia ICEH- Individual Consumption Expenditure by Households Zimbabwe Zimbabwe data were suppressed because of extreme volatility in the official exchange rate 213
214 7 FOREIGN DIRECT INVESTMENT 214
215 Table 7.1 Foreign Direct Investment Inflows in SADC, Million US $, Million USD Country Angola Botswana Democratic Republic of Congo n.a Lesotho Madagascar n.a. n.a. Malawi Mauritius Mozambique Namibia Seychelles South Africa Swaziland United Republic of Tanzania Zambia Zimbabwe Table 7.2 Foreign Direct Investment Outflows in SADC, Million US $, Million USD Country Angola Botswana Democratic Republic of Congo n.a Lesotho Madagascar n.a. n.a. Malawi Mauritius Mozambique Namibia Seychelles South Africa Swaziland United Republic of Tanzania Zambia Zimbabwe Table 7.3 Net Foreign Direct Investment in SADC, Million US $, Million USD Country Angola Botswana Democratic Republic of Congo n.a Lesotho Madagascar n.a n.a Malawi Mauritius Mozambique Namibia Seychelles South Africa Swaziland United Republic of Tanzania Zambia Zimbabwe Source: National Statistical Offices of Member States, November
216 8 STATISTICS FOR MAJOR INDUSTRIAL GROUPS 216
217 8.1 TRANSPORT AND INFORMATION AND COMMUNICATIONS TECHNOLOGY 217
218 8.1.1 TRANSPORT 218
219 Table Total Road Network in SADC, Km, , Selected Years Country Km Angola Botswana Democratic Republic of Congo Lesotho n.a Madagascar Malawi Mauritius Mozambique Namibia Seychelles South Africa Swaziland United Republic of Tanzania Zambia Zimbabwe Source: National Statistical Offices of Member States, November
220 Table Motor Vehicle Fleet in SADC, Per Thousand People, Motor Vehicles Per Thousand People Country Angola Botswana Democratic Republic of Congo 5 Lesotho Madagascar Malawi 8 Mauritius Mozambique Namibia Seychelles South Africa Swaziland United Republic of Tanzania Zambia Zimbabwe Source: National Statistical Offices of Member States, November 2016 Table Passenger Car Fleet in SADC, Per Thousand People, Passenger Cars Per Thousand People Country Angola Botswana Democratic Republic of Congo Lesotho Madagascar Malawi 4 Mauritius Mozambique n.a n.a Namibia Seychelles South Africa Swaziland United Republic of Tanzania Zambia Zimbabwe 91 Source: National Statistical Offices of Member States, November
221 Table Railway Line Route Length in SADC, Total Route-Km, Total Route-Km Country Angola Botswana Democratic Republic of Congo Lesotho Madagascar Malawi 797 Mauritius Mozambique Namibia Seychelles South Africa Swaziland United Republic of Tanzania Zambia Zimbabwe Source: National Statistical Offices of Member States, November 2016 Table Passengers Carried through SADC Railways, Million Passenger-Km, Million Passenger-Km Country Angola Botswana n.a n.a n.a n.a n.a n.a n.a n.a n.a n.a Democratic Republic of Congo Lesotho Madagascar 10 Malawi Mauritius Mozambique Namibia Seychelles South Africa Swaziland United Republic of Tanzania Zambia Zimbabwe Source: National Statistical Offices of Member States, November
222 Table Goods Transported through SADC Railways, Million Ton-Km, Million Ton-Km Country Angola Botswana n.a n.a n.a n.a n.a n.a n.a n.a n.a n.a Democratic Republic of Congo Lesotho Madagascar Malawi Mauritius Mozambique Namibia Seychelles South Africa Swaziland United Republic of Tanzania Zambia Zimbabwe Source: National Statistical Offices of Member States, November 2016 Table Air Transport - Freight in SADC, Million Ton-Km, Million Ton-Km Country Angola Botswana n.a n.a n.a Democratic Republic of Congo Lesotho Madagascar Malawi Mauritius n.a n.a n.a n.a n.a n.a n.a n.a n.a n.a Mozambique Namibia Seychelles South Africa Swaziland United Republic of Tanzania Zambia Zimbabwe Source: National Statistical Offices of Member States, November
223 Table Air Transport - Passengers Carried in SADC, Number, Year Country Angola Botswana Democratic Republic of Congo n.a Lesotho Madagascar Malawi Mauritius Mozambique Namibia Seychelles South Africa Swaziland United Republic of Tanzania Zambia Zimbabwe Source: National Statistical Offices of Member States, November 2016 Table Air Tansport - Registered Carrier Departures Worldwide of SADC, Number, Year Country Angola n.a Botswana Democratic Republic of Congo Lesotho Madagascar Malawi Mauritius Mozambique n.a Namibia Seychelles South Africa Swaziland United Republic of Tanzania Zambia Zimbabwe Source: National Statistical Offices of Member States, November
224 8.1.2 INFORMATION AND COMMUNICATIONS TECHNOLOGY 224
225 Table Telecommunication Services - Fixed Telephone Lines in SADC, Number, Number Country Angola n.a n.a Botswana Democratic Republic of Congo n.a n.a n.a Lesotho Madagascar Malawi Mauritius Mozambique Namibia n.a n.a Seychelles South Africa n.a Swaziland United Republic of Tanzania Zambia Zimbabwe Source: National Statistical Offices of Member States, November 2016 Table Telecommunication Services - Fixed Telephone Lines, Per 100 Inhabitants in SADC, Per 100 Inhabitants Country Angola n.a n.a Botswana Democratic Republic of Congo n.a n.a n.a Lesotho Madagascar Malawi Mauritius Mozambique Namibia n.a n.a Seychelles South Africa n.a Swaziland n.a United Republic of Tanzania Zambia Zimbabwe Source: National Statistical Offices of Member States, November
226 Table Internet Services - Fixed broadband, Number of Subscriptions in SADC, Country Angola n.a n.a Botswana Democratic Republic of Congo n.a n.a n.a n.a n.a n.a Lesotho Madagascar Malawi n.a n.a n.a Mauritius Mozambique n.a Namibia n.a n.a Seychelles South Africa n.a Swaziland United Republic of Tanzania Zambia Zimbabwe Source: National Statistical Offices of Member States, November 2016 Table Internet Services - Fixed broadband, Density Per 100 Inhabitants in SADC, Country Angola n.a n.a Botswana Democratic Republic of Congo n.a n.a n.a Lesotho n.a n.a n.a n.a n.a n.a n.a n.a n.a n.a Madagascar Malawi na n.a n.a Mauritius Mozambique Namibia n.a n.a Seychelles South Africa n.a Swaziland United Republic of Tanzania Zambia Zimbabwe Source: National Statistical Offices of Member States, November
227 Table Internet Services - Fixed Internet Subscriptions, Number of Subscriptions in SADC, Number of Fixed Internet Subscriptions Angola n.a n.a n.a n.a n.a n.a Botswana Democratic Republic of Congo n.a n.a Lesotho n.a n.a n.a n.a Madagascar Malawi n.a Mauritius Mozambique n.a n.a n.a Namibia n.a n.a n.a n.a n.a n.a n.a n.a Seychelles South Africa n.a n.a n.a n.a n.a n.a n.a n.a n.a n.a Swaziland n.a n.a n.a n.a n.a n.a n.a n.a United Republic of Tanzania Zambia Zimbabwe Source: National Statistical Offices of Member States, November 2016 Table Internet Services - Fixed Internet Subscriptions, Density Per 100 Inhabitants in SADC, Subscriptions Per 100 Inhabitants Angola n.a n.a n.a n.a n.a n.a Botswana Democratic Republic of Congo n.a n.a n.a n.a n.a n.a n.a Lesotho n.a n.a n.a n.a n.a n.a n.a n.a n.a n.a Madagascar Malawi n.a n.a n.a n.a n.a n.a n.a Mauritius Mozambique n.a n.a Namibia n.a n.a n.a n.a n.a n.a n.a n.a Seychelles South Africa n.a n.a n.a n.a n.a n.a n.a n.a n.a n.a Swaziland 1.88 n.a n.a n.a n.a n.a n.a 0.10 n.a n.a United Republic of Tanzania Zambia Zimbabwe Source: National Statistical Offices of Member States, November
228 Table Internet Users Per 100 Inhabitants in SADC, Per 100 Inhabitants Angola Botswana Democratic Republic of Congo Lesotho Madagascar Malawi Mauritius Mozambique Namibia Seychelles South Africa Swaziland United Republic of Tanzania Zambia Zimbabwe n.a n.a n.a n.a n.a n.a n.a n.a n.a n.a n.a n.a n.a n.a n.a n.a n.a n.a. n.a. n.a. n.a n.a n.a n.a n.a n.a n.a n.a n.a n.a n.a n.a Source: National Statistical Offices of Member States, November
229 Table Mobile Cellular Subscribers, Number of Subscriptions in SADC, Number Country Angola n.a n.a n.a Botswana Democratic Republic of Congo n.a n.a Lesotho Madagascar Malawi Mauritius Mozambique Namibia n.a n.a Seychelles South Africa n.a Swaziland n.a United Republic of Tanzania Zambia Zimbabwe Source: National Statistical Offices of Member States, November 2016 Table Mobile Cellular Subscribers, Density Per 100 Inhabitants in SADC, Subscriptions per 100 Inhabitants Country Angola n.a n.a Botswana Democratic Republic of Congo n.a n.a Lesotho Madagascar Malawi Mauritius Mozambique Namibia n.a n.a Seychelles South Africa n.a Swaziland n.a United Republic of Tanzania Zambia Zimbabwe Source: National Statistical Offices of Member States, November
230 8.2 TOURISM 230
231 Table Arrivals of Non Resident Tourists/Visitors in SADC, Thousand, Country Angola n.a. Botswana n.a Democratic Republic of Congo n.a. n.a. Lesotho Madagascar Malawi n.a. Mauritius Mozambique Namibia n.a. n.a. Seychelles South Africa Swaziland United Republic of Tanzania Zambia Zimbabwe SADC - Total Source: World DataBank, World Development Indicators: downloaded 17 October 2013: Angola (2011), Democratic Republic of Congo ( ), Madagascar ( ), Namibia (2004, ), Zambia (2010) World DataBank, World Development Indicators: downloaded 20 September 2016: Angola ( ), Democratic Republic of Congo ( )c World Tourism Data, World Tourism Organization (UNWTO) Database: downloaded: 10 October 2014: Angola ( ), Democratic Republic of Congo ( ), Madagascar ( ), Malawi ( ), Namibia ( , ), Zambia ( ) National Statistics Offices of Member States 231
232 Table Annual Growth in Arrivals of Non Resident Tourists/Visitors in SADC, (%), Country Angola n.a. n.a. n.a. n.a. Botswana n.a. n.a. n.a. n.a. n.a. 3 Democratic Republic of Congo n.a. n.a. n.a. n.a. n.a. n.a. Lesotho Madagascar Malawi n.a. Mauritius Mozambique Namibia n.a. n.a. n.a. n.a. n.a. n.a. n.a. Seychelles South Africa Swaziland n.a. United Republic of Tanzania Zambia Zimbabwe SADC - Total n.a. n.a. n.a. n.a. Source: Derived from Table Arrivals of Non Resident Tourists/Visitors in SADC, Thousand, ; Annual growth in arrivals for the periods & = average for the period National Statistics Offices of Member States 232
233 Table Tourism Receipts in SADC, Million US$, Country Angola n.a. Botswana Democratic Republic of Congo n.a. Lesotho Madagascar Malawi n.a. Mauritius Mozambique Namibia n.a. Seychelles South Africa n.a. Swaziland n.a United Republic of Tanzania Zambia Zimbabwe n.a. SADC - Total Source: World DataBank, World Development Indicators: downloaded 12 October 2014: World DataBank, World Development Indicators: downloaded 20 September 2016: Angola ( ), Botswana ( ), Democratic Republic of Congo( ), Malawi (2013), Mauritius ( ), Namibia( ) South Africa ( ) National Statistics Offices of Member States 233
234 Table Non Resident Tourists/Visitors Average Length of Stay in SADC, Days, Country Angola n.a. n.a. n.a. n.a. n.a n.a. n.a. n.a. n.a. Botswana n.a. n.a n.a. n.a. n.a. n.a. n.a. n.a. Democratic Republic of Congo n.a. n.a n.a. n.a. n.a. n.a. n.a. n.a. Lesotho n.a. n.a Madagascar Malawi n.a. Mauritius Mozambique n.a. n.a. n.a. n.a. n.a. n.a. n.a. n.a. n.a. n.a. Namibia n.a. n.a n.a. n.a. n.a. n.a. n.a. n.a. Seychelles South Africa n.a. n.a n.a. n.a. n.a. n.a. n.a. n.a. Swaziland n.a United Republic of Tanzania n.a. n.a Zambia n.a. n.a n.a. n.a Zimbabwe n.a. n.a n.a. n.a. 3.5 n.a. 3.5 n.a. Source: Regional Tourism Organisation of Southern Africa (RETOSA): downloaded: 8 March 2013: Democratic Republic of Congo, Madagascar, Namibia, United Republic of Tanzania, Zambia, Zimbabwe ( ) National Statistics Offices of Member States 234
235 Table Tourism Bed Capacity in SADC, Thousand, Country Angola n.a. n.a. n.a. n.a. n.a. n.a. n.a. n.a. n.a. n.a. Botswana n.a. n.a Democratic Republic of Congo n.a. n.a. n.a. n.a. n.a. n.a. n.a. n.a. n.a. n.a. Lesotho Madagascar n.a. n.a n.a. n.a. n.a. n.a. n.a. n.a. Malawi n.a. n.a. n.a. n.a. n.a. n.a. n.a. n.a. n.a. n.a. Mauritius Mozambique Namibia n.a. n.a. n.a n.a. n.a. n.a. n.a. n.a. n.a. Seychelles South Africa n.a. n.a. n.a. n.a. n.a. n.a. n.a. n.a. n.a. n.a. Swaziland n.a United Republic of Tanzania n.a. n.a. n.a. n.a Zambia n.a. n.a n.a. n.a Zimbabwe Source: Regional Tourism Organisation of Southern Africa (RETOSA): downloaded: 8 March 2013: Madagascar, Namibia, United Republic of Tanzania, Zambia, National Statistics Offices of Member States 235
236 Table Tourism Bed Occupancy Rate in SADC, %, Country Angola n.a. n.a n.a. n.a n.a. n.a. n.a. n.a. Botswana n.a. n.a n.a Democratic Republic of Congo n.a. n.a n.a. n.a. n.a. n.a. n.a. n.a. n.a. Lesotho Madagascar n.a. n.a n.a. n.a. n.a. n.a. n.a. n.a. Malawi n.a. n.a n.a. n.a. n.a. n.a. n.a. n.a. Mauritius Mozambique Namibia n.a. n.a n.a. n.a. Seychelles South Africa n.a. n.a. n.a. n.a. n.a. n.a. n.a. n.a. n.a. n.a. Swaziland n.a United Republic of Tanzania Zambia n.a. n.a n.a. n.a. n.a Zimbabwe Source: Regional Tourism Organisation of Southern Africa (RETOSA): downloaded: 8 March 2013: Angola, Democratic Republic of Congo, Madagascar, Namibia, United Republic of Tanzania, Zambia National Statistics Offices of Member States Definition: Seychelles: Refers to the number of bed nights sold divided by the product of the number of bed nights available and the number of days in the reference period expressed as a percentage 236
237 Table Tourism Room Capacity in SADC, Number, Country Angola n.a. n.a. n.a. n.a. n.a. n.a. n.a. n.a. n.a. n.a. Botswana n.a. n.a Democratic Republic of Congo n.a. n.a. n.a. n.a. n.a. n.a. n.a. n.a. n.a. n.a. Lesotho n.a. n.a Madagascar Malawi n.a. n.a. n.a. n.a. n.a. n.a. n.a. n.a. n.a. n.a. Mauritius Mozambique Namibia n.a. n.a n.a. n.a. n.a. n.a. n.a. n.a. Seychelles South Africa n.a. n.a. n.a. n.a. n.a. n.a. n.a. n.a. n.a. n.a. Swaziland n.a United Republic of Tanzania n.a. n.a. n.a. n.a. n.a. n.a. n.a. n.a. n.a. n.a. Zambia n.a. n.a n.a. n.a Zimbabwe n.a. n.a n.a. n.a. n.a. n.a Source: Regional Tourism Organisation of Southern Africa (RETOSA): downloaded: 8 March 2013: Angola, Madagascar, Namibia,United Republic of Tanzania, Zambia, Zimbabwe National Statistics Offices of Member States 237
238 8.3 AGRICULTURE FOOD SECURITY AND FORESTRY 238
239 8.3.1 AGRICULTURE 239
240 Table Share of Agriculture in Gross Domestic Product (GDP), Employment, Exports and Imports in SADC, (%), Country GDP Share Employment Share Angola n.a n.a. n.a. n.a. n.a. n.a. n.a. n.a. n.a. n.a. n.a. n.a. n.a. n.a. n.a. Botswana n.a n.a. n.a. n.a. n.a. n.a. n.a. n.a. n.a. n.a. n.a. Democratic Republic of Congo n.a n.a. n.a. n.a. n.a. n.a. n.a. n.a. n.a. n.a. n.a. n.a. n.a. n.a. n.a. Lesotho n.a. n.a. n.a. n.a n.a n.a. n.a. n.a. n.a. n.a. Madagascar n.a n.a. n.a. n.a. n.a. n.a. n.a n.a. n.a. Malawi n.a n.a. n.a n.a. n.a. n.a. n.a. n.a. n.a. n.a. n.a. n.a. n.a. n.a. n.a. Mauritius n.a n.a Mozambique n.a. n.a. n.a. n.a. n.a. n.a. n.a. n.a. n.a. n.a. n.a. Namibia n.a n.a. n.a n.a. n.a. Seychelles n.a n.a. n.a. n.a. n.a. n.a. n.a. n.a. n.a. n.a. n.a. n.a. n.a. n.a. n.a. n.a. South Africa n.a n.a. n.a. n.a. n.a. Swaziland n.a n.a. n.a. n.a. n.a. n.a. n.a. n.a. n.a n.a. United Republic of Tanzania n.a n.a. Zambia n.a n.a. n.a n.a. Zimbabwe n.a n.a. n.a. n.a. n.a. n.a. n.a. n.a. n.a. n.a. n.a. n.a. n.a. n.a. n.a. Table (contd.) Share of Agriculture in Gross Domestic Product (GDP), Employment, Exports and Imports in SADC, (%), Country Export Share Import Share Angola n.a. n.a. n.a. n.a n.a. n.a. n.a. n.a. Botswana n.a. n.a. n.a. n.a n.a. n.a. n.a. n.a Democratic Republic of Congo n.a. n.a. n.a. n.a n.a. n.a. n.a. n.a. Lesotho n.a. n.a. n.a n.a. n.a. n.a. Madagascar n.a. n.a. n.a. n.a n.a. n.a. n.a. n.a. Malawi n.a. n.a. n.a. n.a n.a. n.a. n.a. n.a. Mauritius n.a n.a. Mozambique n.a n.a. Namibia n.a. n.a n.a. n.a. Seychelles n.a. n.a. n.a. n.a n.a. n.a. n.a. n.a. South Africa n.a. n.a. n.a. n.a n.a. n.a. n.a. n.a. Swaziland n.a. n.a. n.a. n.a n.a. n.a. n.a. n.a. United Republic of Tanzania n.a n.a. Zambia n.a. n.a n.a. n.a. Zimbabwe n.a n.a. Source: Food and Agriculture Organisation (FAO): ; Export & Import Share: FAO Statistical Yearbook 2010, Table c02: Exports & Imports Share, : Angola, Democratic Republic of Congo, Madagascar, Malawi, Namibia, Zambia, Zimbabwe SADC Secretariat Statistics Unit, GDP in National Currency; SADC SYB 2011: GDP Share : Angola, Democratic Republic of Congo, Madagascar, Malawi, Namibia, Zimbabwe SADC Secretariat Statistics Unit, Trade Database, Exports & Imports Share, : Angola, Democratic Republic of Congo, Madagascar, Malawi, Mozambique, Namibia, Zambia & Zimbabwe National Statistics Offices of Member States 240
241 Table Gross Capital Stock in SADC at Constant 2005 Prices, Million US $, Country Item Land Development Capital Stock, Constant 2005 Prices, Million US $, Capital Stock, Constant 2005 Prices, Million US $, Country Item Land n.a. n.a. n.a. n.a. n.a. n.a. n.a. n.a n.a. n.a. n.a. n.a. n.a. n.a. n.a. n.a. Development Angola Livestock (Fixed Assets) Livestock (inventory) Machinery & Equipment Plantation Crops Structures for Livestock Total Capital Stock Land Development n.a. n.a. n.a. n.a. n.a. n.a. n.a. n.a. Livestock (Fixed Assets) Livestock n.a. n.a. n.a. n.a. n.a. n.a. n.a. n.a. (inventory) n.a. n.a. n.a. n.a. n.a. n.a. n.a. n.a. Madagascar Machinery & Equipment Plantation n.a. n.a. n.a. n.a. n.a. n.a. n.a. n.a. Crops Structures for n.a. n.a. n.a. n.a. n.a. n.a. n.a. n.a. Livestock Total Capital n.a. n.a. n.a. n.a. n.a. n.a. n.a. n.a. Stock Land n.a. n.a. n.a. n.a. n.a Development n.a. n.a. n.a. n.a. n.a. n.a. n.a. n.a n.a. n.a. n.a. n.a. n.a. n.a. n.a. n.a n.a. n.a. n.a. n.a. n.a. n.a. n.a. n.a n.a. n.a. n.a. n.a. n.a. n.a. n.a. n.a n.a. n.a. n.a. n.a. n.a. n.a. n.a. n.a n.a. n.a. n.a. n.a. n.a. n.a. n.a. n.a n.a. n.a. n.a. n.a. n.a. n.a. n.a. n.a. Botswana Livestock (Fixed Assets) Livestock (inventory) Machinery & Equipment Plantation Crops Structures for Livestock Total Capital Stock Land Development n.a. n.a. n.a. n.a. n.a Livestock (Fixed Assets) Livestock n.a. n.a. n.a. n.a. n.a (inventory) n.a. n.a. n.a. n.a. n.a Malawi Machinery & Equipment Plantation 3 3 n.a. n.a. n.a. n.a. n.a Crops Structures for n.a. n.a. n.a. n.a. n.a Livestock Total Capital n.a. n.a. n.a. n.a. n.a Stock Land n.a. n.a. n.a. n.a. n.a. n.a. n.a. n.a. Development n.a. n.a. n.a. n.a. n.a. n.a. n.a. n.a n.a. n.a. n.a. n.a. n.a. n.a. n.a. n.a n.a. n.a. n.a. n.a. n.a. n.a. n.a. n.a n.a. n.a. n.a. n.a. n.a. n.a. n.a. n.a n.a. n.a. n.a. n.a. n.a. n.a. n.a. n.a n.a. n.a. n.a. n.a. n.a. n.a. n.a. n.a n.a. n.a. n.a. n.a. n.a. n.a. n.a. n.a. Democratic Republic of Congo Livestock (Fixed Assets) Livestock (inventory) Machinery & Equipment Plantation Crops Structures for Livestock Total Capital Stock Land Development n.a. n.a. n.a. n.a. n.a. n.a. n.a. n.a. Livestock (Fixed Assets) Livestock n.a. n.a. n.a. n.a. n.a. n.a. n.a. n.a. (inventory) n.a. n.a. n.a. n.a. n.a. n.a. n.a. n.a. Mauritius Machinery & Equipment Plantation n.a. n.a. n.a. n.a. n.a. n.a. n.a. n.a. Crops Structures for n.a. n.a. n.a. n.a. n.a. n.a. n.a. n.a. Livestock Total Capital n.a. n.a. n.a. n.a. n.a. n.a. n.a. n.a. Stock Land n.a. n.a. n.a. n.a. n.a. n.a. n.a. n.a. Development n.a. n.a. n.a. n.a. n.a. n.a. n.a. n.a n.a. n.a. n.a. n.a. n.a. n.a. n.a. n.a n.a. n.a. n.a. n.a. n.a. n.a. n.a. n.a. 5 5 n.a. n.a. n.a. n.a. n.a. n.a. n.a. n.a. 3 3 n.a. n.a. n.a. n.a. n.a. n.a. n.a. n.a n.a. n.a. n.a. n.a. n.a. n.a. n.a. n.a n.a. n.a. n.a. n.a. n.a. n.a. n.a. n.a. Lesotho Livestock (Fixed Assets) Livestock (inventory) Machinery & Equipment Plantation Crops Structures for Livestock Total Capital Stock n.a. n.a. n.a. n.a. n.a. n.a. n.a. n.a. Livestock (Fixed Assets) Livestock n.a. n.a. n.a. n.a. n.a. n.a. n.a. n.a. (inventory) n.a. n.a. n.a. n.a. n.a. n.a. n.a. n.a. Mozambique Machinery & Equipment Plantation 6 6 n.a. n.a. n.a. n.a. n.a. n.a. n.a. n.a. Crops Structures for n.a. n.a. n.a. n.a. n.a. n.a. n.a. n.a. Livestock Total Capital n.a. n.a. n.a. n.a. n.a. n.a. n.a. n.a. Stock n.a. n.a. n.a. n.a. n.a. n.a. n.a. n.a Source: Food and Agriculture Organisation (FAO): ; Downloaded 19 November 2013; 30 November 2015 National Statistics Offices of Member States 241
242 Table (contd.) Gross Capital Stock in SADC at Constant 2005 Prices, Million US $, Country Item Land Development Capital Stock, Constant 2005 Prices, Million US $, Capital Stock, Constant 2005 Prices, Million US $, Country Item Land n.a. n.a. n.a. n.a. n.a. n.a. n.a. n.a n.a. n.a. n.a. n.a. n.a. n.a. n.a. n.a. Development Namibia Livestock (Fixed Assets) Livestock (inventory) Machinery & Equipment Plantation Crops Structures for Livestock Total Capital Stock Land Development n.a. n.a. n.a. n.a. n.a. n.a. n.a. n.a. Livestock (Fixed Assets) Livestock n.a. n.a. n.a. n.a. n.a. n.a. n.a. n.a. United (inventory) n.a. n.a. n.a. n.a. n.a. n.a. n.a. n.a. Republic of Machinery & Tanzania Equipment Plantation n.a. n.a. n.a. n.a. n.a. n.a. n.a. n.a. Crops Structures for n.a. n.a. n.a. n.a. n.a. n.a. n.a. n.a. Livestock Total Capital 0 0 n.a. n.a. n.a. n.a. n.a. n.a. n.a. n.a. Stock Land 4 4 n.a. n.a. n.a. n.a. n.a. n.a. n.a. n.a. Development n.a n.a. n.a. n.a. n.a. n.a. n.a. n.a. n.a n.a n.a. n.a. n.a. n.a. n.a. n.a. n.a. n.a n.a. n.a. n.a. n.a. n.a. n.a. n.a. n.a n.a n.a. n.a. n.a. n.a. n.a. n.a. n.a. n.a. Seychelles Livestock (Fixed Assets) Livestock (inventory) Machinery & Equipment Plantation Crops Structures for Livestock Total Capital Stock Land Development 1 1 n.a. n.a. n.a. n.a. n.a. n.a. n.a. n.a. Livestock (Fixed Assets) Livestock 1 1 n.a. n.a. n.a. n.a. n.a. n.a. n.a. n.a. (inventory) 6 5 n.a. n.a. n.a. n.a. n.a. n.a. n.a. n.a. Zambia Machinery & Equipment Plantation 0 0 n.a. n.a. n.a. n.a. n.a. n.a. n.a. n.a. Crops Structures for n.a. n.a. n.a. n.a. n.a. n.a. n.a. n.a. Livestock Total Capital Stock Land Development n.a. n.a. n.a. n.a. n.a. n.a. n.a. n.a n.a. n.a. n.a. n.a. n.a. n.a. n.a. n.a n.a. n.a. n.a. n.a. n.a. n.a. n.a. n.a n.a. n.a. n.a. n.a. n.a. n.a. n.a. n.a n.a. n.a. n.a. n.a. n.a. n.a. n.a. n.a n.a. n.a. n.a. n.a. n.a. n.a. n.a. n.a n.a. n.a. n.a. n.a. n.a. n.a. n.a. n.a. Livestock (Fixed Assets) Livestock (inventory) South Africa Machinery & Equipment Plantation Crops Structures for Livestock Total Capital Stock Land Development Livestock (Fixed Assets) Livestock (inventory) Zimbabwe Machinery & Equipment Plantation Crops Structures for Livestock Total Capital Stock Land n.a. n.a. n.a. n.a. n.a. n.a. n.a. n.a. Development n.a. n.a. n.a. n.a. n.a. n.a. n.a. n.a n.a. n.a. n.a. n.a. n.a. n.a. n.a. n.a n.a. n.a. n.a. n.a. n.a. n.a. n.a. n.a n.a. n.a. n.a. n.a. n.a. n.a. n.a. n.a n.a. n.a. n.a. n.a. n.a. n.a. n.a. n.a n.a. n.a. n.a. n.a. n.a. n.a. n.a. n.a n.a. n.a. n.a. n.a. n.a. n.a. n.a. n.a. Swaziland Livestock (Fixed Assets) Livestock (inventory) Machinery & Equipment Plantation Crops Structures for Livestock Total Capital Stock n.a. n.a. n.a. n.a. n.a. n.a. n.a. n.a. Livestock (Fixed Assets) Livestock n.a. n.a. n.a. n.a. n.a. n.a. n.a. n.a. (inventory) SADC - Machinery & n.a. n.a. n.a. n.a. n.a. n.a. n.a. n.a. Total Equipment Plantation n.a. n.a. n.a. n.a. n.a. n.a. n.a. n.a. Crops Structures for n.a. n.a. n.a. n.a. n.a. n.a. n.a. n.a. Livestock Total Capital n.a. n.a. n.a. n.a. n.a. n.a. n.a. Stock n.a. n.a. n.a. n.a. n.a. n.a. n.a. n.a n.a. n.a. n.a. n.a. n.a. n.a. n.a. n.a n.a. n.a. n.a. n.a. n.a. n.a. n.a. n.a n.a. n.a. n.a. n.a. n.a. n.a. n.a. n.a n.a. n.a. n.a. n.a. n.a. n.a. n.a. n.a n.a. n.a. n.a. n.a. n.a. n.a. n.a. n.a. Source: Food and Agriculture Organisation (FAO): ; Downloaded 19 November 2013; 30 November 2015 National Statistics Offices of Member States 242
243 Table Total Land Area, Agricultural Land, Land Use and Agricultural Population in SADC, Thousand, Total Land / Country Area Land Area Country '000 Ha '000 Ha Angola Botswana Democratic Republic of Congo Lesotho Madagascar Malawi Mauritius Mozambique Namibia Seychelles South Africa Swaziland United Republic of Tanzania Zambia Zimbabwe SADC - Total Table (contd.) Total Land Area, Agricultural Land, Land Use and Agricultural Population in SADC, Thousand, , Selected Years Country Total Agricultural Land '000 Ha % of Land Area Angola Botswana Democratic Republic of Congo Lesotho Madagascar Malawi Mauritius n.a n.a. Mozambique Namibia Seychelles South Africa Swaziland United Republic of Tanzania Zambia Zimbabwe SADC - Total Source: Food and Agriculture Organisation (FAO): ;Downloaded 19 November 2013; 30 November 2015 National Statistics Offices of Member States Table total population Note: 1 sq. km = 100 ha 243
244 Table (contd.) Total Land Area, Agricultural Land, Land Use and Agricultural Population in SADC, Thousand, Country Arable Land Permanent Crop '000 Ha '000 Ha Angola Botswana Democratic Republic of Congo Lesotho Madagascar Malawi Mauritius n.a n.a. Mozambique Namibia Seychelles South Africa Swaziland United Republic of Tanzania Zambia Zimbabwe SADC - Total Table (contd.) Total Land Area, Agricultural Land, Land Use and Agricultural Population in SADC, Thousand, , Selected Years Country Permanent & Temporary Meadows & Pastures Total Population '000 Ha ' Angola Botswana Democratic Republic of Congo Lesotho Madagascar Malawi Mauritius n.a Mozambique Namibia Seychelles South Africa Swaziland United Republic of Tanzania Zambia Zimbabwe SADC - Total Source: Food and Agriculture Organisation (FAO): ;Downloaded 19 November 2013; 30 November 2015 National Statistics Offices of Member States Table total population Note: 1 sq. km = 100 ha 244
245 Table (contd.) Total Land Area, Agricultural Land, Land Use and Agricultural Population in SADC, Thousand, Agricultural Population Agricultural Population Country '000 ' Angola Botswana Democratic Republic of Congo Lesotho Madagascar Malawi Mauritius Mozambique Namibia Seychelles South Africa Swaziland United Republic of Tanzania Zambia Zimbabwe SADC - Total Source: Food and Agriculture Organisation (FAO): ;Downloaded 19 November 2013; 30 November 2015 National Statistics Offices of Member States Table total population Note: 1 sq. km = 100 ha 245
246 Table Irrigated Land in SADC and Its Share in Arable Land and Permanent Crops, Thousand Hectares, ARABLE LAND AND PERMANENT CROPS TOTAL AREA EQUIPPED FOR IRRIGATION Country '000 Ha '000 Ha Angola Botswana Democratic Republic of Congo Lesotho Madagascar Malawi Mauritius Mozambique Namibia Seychelles South Africa Swaziland United Republic of Tanzania Zambia Zimbabwe SADC - Total Table (contd.) Irrigated Land in SADC and Its Share in Arable Land and Permanent Crops, Thousand Hectares, SHARE OF TOTAL AREA EQUIPPED FOR IRRIGATION IN ARABLE LAND AND Country % Angola Botswana Democratic Republic of Congo Lesotho Madagascar Malawi Mauritius Mozambique Namibia Seychelles South Africa Swaziland United Republic of Tanzania Zambia Zimbabwe SADC - Total Source: Food and Agriculture Organisation (FAO): ; Downloaded 19 November 2013; 30 November 2015 National Statistics Offices of Member States 246
247 Table Insecticides Consumption in SADC, Tonne, Country Angola n.a. n.a. n.a. n.a. n.a. n.a. n.a. n.a. n.a. n.a. Botswana n.a. n.a. n.a. n.a. n.a. n.a. n.a Democratic Republic of Congo n.a. n.a. n.a. n.a. n.a. n.a. n.a. n.a. n.a. n.a. Lesotho n.a. n.a. n.a. n.a n.a. n.a. Madagascar n.a. n.a. n.a. Malawi n.a n.a 181 n.a. n.a. n.a. Mauritius Mozambique n.a. n.a. n.a. n.a. Namibia n.a. n.a. n.a. n.a. n.a. n.a. n.a. n.a. n.a. n.a. Seychelles South Africa Swaziland n.a. n.a. n.a. n.a. n.a. n.a. n.a. n.a. n.a. n.a. United Republic of Tanzania n.a. n.a. n.a. n.a. n.a. n.a. n.a. n.a. n.a. n.a. Zambia n.a. n.a. n.a. n.a. n.a. n.a. n.a. n.a. n.a. n.a. Zimbabwe n.a. n.a. n.a. n.a. n.a. n.a n.a. n.a. SADC - Total n.a. n.a. Source: Food and Agriculture Organisation (FAO): Downloaded 19 November 2013; 30 November 2015 National Statistics Offices of Member States 247
248 Table Herbicides Consumption in SADC, Tonne, Country Angola n.a. n.a. n.a. n.a. n.a. n.a. n.a. n.a. n.a. n.a. Botswana n.a. n.a. n.a. n.a. n.a. n.a Democratic Republic of Congo n.a. n.a. n.a. n.a. n.a. n.a. n.a. n.a. n.a. n.a. Lesotho n.a. n.a. n.a. n.a n.a. n.a. Madagascar n.a. n.a. n.a. Malawi n.a n.a. n.a. n.a. n.a. n.a. n.a. Mauritius Mozambique n.a. n.a. n.a. n.a. Namibia n.a. n.a. n.a. n.a. n.a. n.a. n.a. n.a. n.a. n.a. Seychelles South Africa Swaziland n.a. n.a. n.a. n.a. n.a. n.a. n.a. n.a. n.a. n.a. United Republic of Tanzania n.a. n.a. n.a. n.a. n.a. n.a. 41 n.a. n.a. n.a. Zambia n.a. n.a. n.a. n.a. n.a. n.a. n.a. n.a. n.a. n.a. Zimbabwe n.a. n.a. n.a. n.a. n.a. n.a n.a. n.a. SADC - Total n.a. n.a. n.a. Source: Food and Agriculture Organisation (FAO): ; Downloaded 19 November 2013; 30 November 2015 National Statistics Offices of Member States 248
249 Table Fungicides and Bactericides Consumption in SADC, Tonne, Country Angola n.a. n.a. n.a. n.a. n.a. n.a. n.a. n.a. n.a. n.a. Botswana n.a. n.a. n.a. n.a. n.a. n.a. n.a. n.a. n.a n.a Democratic Republic of Congo n.a. n.a. n.a. n.a. n.a. n.a. n.a. n.a. n.a. n.a. Lesotho n.a n.a n.a n.a n.a n.a. Madagascar n.a. n.a n.a. Malawi n.a n.a. n.a. n.a. n.a. n.a. n.a. Mauritius Mozambique n.a. n.a. n.a. n.a. Namibia n.a. n.a. n.a. n.a. n.a. n.a. n.a. n.a. n.a. n.a. Seychelles South Africa Swaziland n.a. n.a. n.a. n.a. n.a. n.a. n.a. n.a. n.a. n.a. United Republic of Tanzania n.a n.a n.a n.a n.a n.a n.a. n.a. n.a. Zambia n.a. n.a. n.a. n.a. n.a. n.a. n.a. n.a. n.a. n.a. Zimbabwe n.a. n.a. n.a. n.a. n.a. n.a n.a. n.a. SADC - Total n.a. n.a. n.a. Source: Food and Agriculture Organisation (FAO): ; Downloaded 19 November 2013; 30 November 2015 National Statistics Offices of Member States 249
250 Table Fertilizer Consumption in Nutrients in SADC by Type of Fertilizer, Thousand Tonne of Nutrients, Angola Country Botswana Democratic Republic of Congo Lesotho Madagascar Malawi Mauritius Mozambique Type of Fertilizer Country Type of Fertilizer Nitrogen n.a. n.a. Nitrogen n.a. n.a. Phosphate n.a. n.a. Phosphate n.a. n.a. Namibia Potash n.a. n.a. Potash n.a. n.a. Total n.a. n.a. Total n.a. n.a. Nitrogen n.a. n.a. n.a n.a. n.a. Nitrogen n.a. n.a. Phosphate n.a. n.a. n.a n.a. n.a. Phosphate n.a. n.a. Seychelles Potash n.a. n.a. n.a n.a. n.a. Potash n.a. n.a. Total n.a. n.a. n.a n.a. n.a. Total n.a. n.a. Nitrogen n.a. n.a. Nitrogen Phosphate n.a. n.a. Phosphate South Africa Potash n.a. n.a. Potash Total n.a. n.a. Total Nitrogen n.a. n.a. n.a. n.a. n.a. n.a. n.a. n.a. n.a. n.a. Nitrogen n.a. n.a. n.a. n.a. n.a. n.a. n.a. n.a. n.a. n.a. Phosphate n.a. n.a. n.a. n.a. n.a. n.a. n.a. n.a. n.a. n.a. Phosphate n.a. n.a. n.a. n.a. n.a. n.a. n.a. n.a. n.a. n.a. Swaziland Potash n.a. n.a. n.a. n.a. n.a. n.a. n.a. n.a. n.a. n.a. Potash n.a. n.a. n.a. n.a. n.a. n.a. n.a. n.a. n.a. n.a. Total n.a. n.a. n.a. n.a. n.a. n.a. n.a. n.a. n.a. n.a. Total n.a. n.a. n.a. Nitrogen n.a. n.a. Nitrogen n.a. n.a. United Phosphate n.a. n.a. Phosphate n.a. n.a. Republic of Potash n.a. n.a. Potash n.a. n.a. Tanzania Total n.a. n.a. Total n.a. n.a. Nitrogen n.a. n.a. Nitrogen Phosphate n.a. n.a. Phosphate Zambia Potash n.a. n.a. Potash Total n.a. n.a. Total Nitrogen n.a. n.a. Nitrogen n.a. n.a. Phosphate n.a. n.a. Phosphate n.a. n.a. Zimbabwe Potash n.a. n.a. Potash n.a. n.a. Total n.a. n.a. Total n.a. n.a. Nitrogen n.a. n.a. Nitrogen n.a. n.a. n.a. n.a. Phosphate n.a. n.a. Phosphate n.a. n.a. n.a. n.a. SADC - Total Potash n.a. n.a. Potash n.a. n.a. n.a. n.a. Total n.a. n.a. Total n.a. n.a. n.a. n.a. Source: Food and Agriculture Organisation (FAO): ; Downloaded 19 November 2013; 30 November 2015 National Statistics Offices of Member States 250
251 Table Agriculture Gross Production Index Number in SADC, (Base year: =100), Country Angola n.a. n.a. Botswana Democratic Republic of Congo n.a. n.a. Lesotho n.a. n.a. Madagascar n.a. n.a. Malawi n.a. n.a. Mauritius Mozambique n.a. n.a. Namibia n.a. n.a. Seychelles n.a. n.a. South Africa Swaziland n.a. n.a. United Republic of Tanzania n.a. n.a. Zambia n.a. n.a. Zimbabwe Source: Food and Agriculture Organisation (FAO): downloaded 9 October 2013; 30 November 2015: Angola, Botswana ( ), Democratic Republic of Congo, Lesotho, Madagascar, Malawi, Mozambique, Namibia, United Republic of Tanzania, Zambia, Zimbabwe National Statistics Offices of Member States 251
252 Table Agricultural Producer Price for Maize in SADC, US $ Per Tonne, Country Angola n.a. n.a. n.a. n.a n.a. Botswana Democratic Republic of Congo n.a. n.a. n.a. n.a. n.a. n.a. n.a. n.a. n.a. n.a. Lesotho n.a. n.a. n.a. n.a. n.a. n.a. n.a. n.a. n.a. n.a. Madagascar n.a. n.a. n.a. n.a. Malawi n.a. Mauritius n.a. n.a. n.a. n.a. n.a. n.a. Mozambique n.a. n.a. n.a. n.a. Namibia n.a. n.a. n.a. n.a. Seychelles South Africa Swaziland n.a. n.a. n.a. n.a. n.a. n.a. n.a. n.a. n.a. n.a. United Republic of Tanzania n.a. n.a. n.a. Zambia n.a. n.a. n.a n.a. Zimbabwe n.a. n.a. n.a. n.a Source: Food and Agriculture Organisation (FAO): FAOSTAT 2014, Downloaded: 13 October 2014; 30 November 2015 National Statistics Offices of Member States 252
253 Table Agricultural Producer Price for Sorghum in SADC, US $ Per Tonne, Country Angola n.a. n.a. n.a. n.a n.a. n.a. Botswana n.a. n.a. n.a. n.a. n.a. n.a. n.a. n.a. n.a. n.a. Democratic Republic of Congo n.a. n.a. n.a. n.a. n.a. n.a. n.a. n.a. n.a. n.a. Lesotho n.a. n.a. n.a. n.a. n.a. n.a. n.a. n.a. n.a. n.a. Madagascar n.a. n.a. n.a. n.a. Malawi n.a. n.a. Mauritius n.a. n.a. n.a. n.a. n.a. n.a. n.a. n.a. n.a. n.a. Mozambique n.a. n.a. n.a. n.a. Namibia n.a. n.a. n.a. n.a. Seychelles South Africa Swaziland n.a. n.a. n.a. n.a. n.a. n.a. n.a. n.a. n.a. n.a. United Republic of Tanzania n.a. n.a. n.a. Zambia n.a. n.a. n.a. n.a. n.a. n.a. Zimbabwe n.a. n.a. n.a. n.a Source: Food and Agriculture Organisation (FAO): FAOSTAT 2014, Downloaded: 13 October 2014; 30 November 2015 National Statistics Offices of Member States 253
254 Table Agricultural Producer Price for Paddy Rice in SADC, US $ Per Tonne, Country Angola n.a. n.a. n.a. n.a n.a. Botswana Democratic Republic of Congo n.a. n.a. n.a. n.a. n.a. n.a. n.a. n.a. n.a. n.a. Lesotho Madagascar n.a. n.a. n.a n.a. Malawi n.a. Mauritius n.a. n.a. n.a. n.a. n.a. n.a. n.a. n.a. n.a. n.a. Mozambique n.a. n.a. n.a. n.a. Namibia n.a. n.a. Seychelles South Africa n.a. n.a. n.a. n.a. Swaziland n.a. n.a. n.a. n.a. n.a. n.a. n.a. n.a. n.a. n.a. United Republic of Tanzania n.a. n.a. n.a. Zambia n.a. n.a. n.a. n.a. n.a. n.a. n.a n.a. Zimbabwe n.a. n.a. n.a. n.a. n.a. n.a. n.a. n.a. n.a. n.a. Source: Food and Agriculture Organisation (FAO): FAOSTAT 2014, Downloaded: 13 October 2014; 30 November 2015 National Statistics Offices of Member States 254
255 Table Agricultural Producer Price for Cassava in SADC, US $ Per Tonne, Country Angola n.a. n.a. n.a. n.a n.a. Botswana Democratic Republic of Congo n.a. n.a. n.a. n.a. n.a. n.a. n.a. n.a. n.a. n.a. Lesotho Madagascar n.a. n.a. n.a n.a. Malawi n.a. Mauritius Mozambique n.a. n.a. n.a. n.a. Namibia Seychelles South Africa n.a. n.a. n.a. n.a. n.a. n.a. n.a. n.a. n.a. n.a. Swaziland n.a. n.a. n.a. n.a. n.a. n.a. n.a. n.a. n.a. n.a. United Republic of Tanzania n.a. n.a. n.a. Zambia n.a. n.a. n.a. n.a. n.a. n.a. n.a. n.a. n.a. n.a. Zimbabwe n.a. n.a. n.a. n.a. n.a. n.a. n.a. n.a. n.a. n.a. Source: Food and Agriculture Organisation (FAO): FAOSTAT 2014, Downloaded: 13 October 2014; 30 November 2015 National Statistics Offices of Member States 255
256 Table Agricultural Producer Price for Wheat in SADC, US $ Per Tonne, Country Angola n.a. n.a. n.a. n.a. n.a. n.a. n.a. n.a. n.a. n.a. Botswana n.a. n.a. n.a. n.a. n.a. n.a. n.a. n.a. n.a. n.a. Democratic Republic of Congo n.a. n.a. n.a. n.a. n.a. n.a. n.a. n.a. n.a. n.a. Lesotho n.a. n.a. n.a. n.a. n.a. n.a. n.a. n.a. n.a. n.a. Madagascar n.a. n.a. n.a. n.a. Malawi n.a. n.a. n.a. n.a. n.a. n.a. Mauritius n.a. n.a. n.a. n.a. n.a. n.a. n.a. n.a. n.a. n.a. Mozambique n.a. n.a. n.a. n.a. Namibia n.a. n.a. n.a. n.a. Seychelles South Africa Swaziland n.a. n.a. n.a. n.a. n.a. n.a. n.a. n.a. n.a. n.a. United Republic of Tanzania n.a. n.a. n.a. Zambia n.a. n.a. n.a. n.a. n.a. n.a. n.a. n.a. n.a. n.a. Zimbabwe n.a. n.a. n.a. n.a Source: Food and Agriculture Organisation (FAO): FAOSTAT 2014, Downloaded: 13 October 2014; 30 November 2015 National Statistics Offices of Member States 256
257 Table Agricultural Producer Price for Groundnuts With Shell in SADC, US $ Per Tonne, Country Angola n.a. n.a. n.a. n.a n.a. Botswana n.a. n.a. n.a. n.a. n.a. n.a. n.a. n.a. n.a n.a. Democratic Republic of Congo n.a. n.a. n.a. n.a. n.a. n.a. n.a. n.a. n.a. n.a. Lesotho Madagascar n.a. n.a. n.a n.a. Malawi n.a. Mauritius Mozambique n.a. n.a. n.a. n.a. Namibia n.a. n.a. n.a. n.a. Seychelles South Africa Swaziland n.a. n.a. n.a. n.a. n.a. n.a. n.a. n.a. n.a. n.a. United Republic of Tanzania n.a. n.a. n.a. Zambia n.a. n.a. n.a. n.a. n.a. n.a. n.a n.a. Zimbabwe n.a. n.a. n.a. n.a Source: Food and Agriculture Organisation (FAO): FAOSTAT 2014, Downloaded: 13 October 2014; 30 November 2015 Food and Agriculture Organisation (FAO): Downloaded: 2 August 2016 (Angola, 2014), Malawi (2014), Zambia ( ) National Statistics Offices of Member States 257
258 Table Agricultural Producer Price for Soyabeans in SADC, US $ Per Tonne, Country Angola n.a. n.a. n.a. n.a n.a. Botswana Democratic Republic of Congo n.a. n.a. n.a. n.a. n.a. n.a. n.a. n.a. n.a. Lesotho Madagascar n.a. n.a. n.a. n.a. Malawi n.a. Mauritius n.a. n.a. n.a. n.a. n.a. n.a. n.a. n.a. n.a. n.a. Mozambique n.a. n.a. n.a. n.a. n.a. n.a. n.a. n.a. n.a. n.a. Namibia Seychelles South Africa Swaziland n.a. n.a. n.a. n.a. n.a. n.a. n.a. n.a. n.a. n.a. United Republic of Tanzania n.a. n.a. n.a. n.a. n.a. n.a. n.a. n.a. n.a. n.a. Zambia n.a. n.a. n.a. n.a. n.a. n.a. n.a. n.a. Zimbabwe n.a. n.a. n.a. n.a Source: Food and Agriculture Organisation (FAO): FAOSTAT 2014, Downloaded: 13 October 2014; 30 November 2015 Food and Agriculture Organisation (FAO): Downloaded: 2 August 2016 (Angola, 2014), Malawi (2014) National Statistics Offices of Member States 258
259 Table Agricultural Producer Price for Green Coffee in SADC, US $ Per Tonne, Country Angola n.a. n.a. n.a. n.a n.a. n.a. n.a. n.a. Botswana Democratic Republic of Congo n.a. n.a. n.a. n.a. n.a. n.a. n.a. n.a. n.a. n.a. Lesotho Madagascar n.a. n.a. n.a. n.a. Malawi n.a. n.a. n.a. n.a. n.a. n.a. Mauritius n.a. n.a. n.a. n.a. n.a. n.a. n.a. n.a. n.a. n.a. Mozambique n.a. n.a. n.a. n.a. Namibia Seychelles South Africa n.a. n.a. n.a. n.a. n.a. n.a. n.a. n.a. n.a. n.a. Swaziland n.a. n.a. n.a. n.a. n.a. n.a. n.a. n.a. n.a. n.a. United Republic of Tanzania n.a. n.a. Zambia n.a. n.a. n.a. n.a. n.a. n.a. n.a. n.a. n.a. n.a. Zimbabwe n.a. n.a. n.a. n.a. n.a. n.a. n.a. n.a. n.a. n.a. Source: Food and Agriculture Organisation (FAO): FAOSTAT 2014, Downloaded: 13 October 2014: National Statistics Offices of Member States 259
260 Table Agricultural Producer Price for Tea in SADC, US $ Per Tonne, Country Angola n.a. n.a. n.a. n.a. n.a. n.a. n.a. n.a. n.a. n.a. Botswana Democratic Republic of Congo n.a. n.a. n.a. n.a. n.a. n.a. n.a. n.a. n.a. n.a. Lesotho Madagascar n.a. n.a. n.a n.a. Malawi n.a. n.a. n.a. n.a. n.a. n.a. Mauritius Mozambique n.a. n.a. n.a. n.a. Namibia Seychelles n.a. n.a. n.a. n.a. n.a. n.a. n.a. n.a n.a. South Africa n.a. n.a. Swaziland n.a. n.a. n.a. n.a. n.a. n.a. n.a. n.a. n.a. n.a. United Republic of Tanzania n.a. n.a. Zambia n.a. n.a. n.a. n.a. n.a. n.a. n.a. n.a. n.a. n.a. Zimbabwe n.a. n.a. n.a. n.a. n.a. n.a. n.a. n.a. n.a. n.a. Source: Food and Agriculture Organisation (FAO): FAOSTAT 2014, Downloaded: 13 October 2014: Food and Agriculture Organisation (FAO): Downloaded: 2 August 2016: Seychelles (2014) National Statistics Offices of Member States 260
261 Table Agricultural Producer Price for Seed Cotton in SADC, US $ Per Tonne, Country Angola n.a. n.a. n.a. n.a. n.a. n.a. n.a. n.a. n.a. n.a. Botswana Democratic Republic of Congo n.a. n.a. n.a. n.a. n.a. n.a. n.a. n.a. n.a. n.a. Lesotho Madagascar n.a. n.a. n.a. n.a. Malawi n.a. n.a. n.a. n.a. n.a. n.a. Mauritius n.a. n.a. n.a. n.a. n.a. n.a. n.a. n.a. n.a. n.a. Mozambique n.a. n.a. n.a. n.a. Namibia n.a n.a n.a n.a. Seychelles South Africa Swaziland n.a. n.a. n.a. n.a. n.a. n.a. n.a. n.a. n.a. n.a. United Republic of Tanzania n.a. n.a. n.a. n.a. n.a. n.a. n.a. n.a. n.a. n.a. Zambia n.a. n.a. n.a. n.a. n.a. n.a. n.a. n.a. n.a. n.a. Zimbabwe n.a. n.a. n.a. n.a. n.a. n.a. n.a. n.a. n.a. n.a. Source: Food and Agriculture Organisation (FAO): FAOSTAT 2014, Downloaded: 13 October 2014: National Statistics Offices of Member States 261
262 Table Agricultural Producer Price for Tobacco, Unmanufactured in SADC, US $ Per Tonne, Country Angola n.a. n.a. n.a. n.a. n.a. n.a. n.a. n.a. n.a. n.a. Botswana Democratic Republic of Congo n.a. n.a. n.a. n.a. n.a. n.a. n.a. n.a. n.a. n.a. Lesotho Madagascar n.a. n.a. n.a. n.a. Malawi n.a. n.a. n.a. n.a. n.a. n.a. Mauritius n.a. n.a. Mozambique n.a. n.a. n.a. n.a. Namibia Seychelles South Africa Swaziland n.a. n.a. n.a. n.a. n.a. n.a. n.a. n.a. n.a. n.a. United Republic of Tanzania n.a. n.a. Zambia n.a. n.a. n.a. n.a. n.a. n.a. n.a. n.a. n.a. n.a. Zimbabwe n.a. n.a. n.a. n.a Source: Food and Agriculture Organisation (FAO): FAOSTAT 2014, Downloaded: 13 October 2014 National Statistics Offices of Member States 262
263 Table Agricultural Producer Price for Sugar Cane in SADC, US $ Per Tonne, Country Angola n.a. n.a. n.a. n.a. n.a. n.a. n.a. n.a. n.a. n.a. Botswana Democratic Republic of Congo n.a. n.a. n.a. n.a. n.a. n.a. n.a. n.a. n.a. n.a. Lesotho Madagascar n.a. n.a. n.a. n.a. Malawi n.a. n.a. n.a. n.a. n.a. n.a. n.a. n.a. n.a. n.a. Mauritius Mozambique n.a. n.a n.a. Namibia Seychelles South Africa Swaziland n.a. n.a. n.a. n.a. n.a. n.a. n.a. n.a. n.a. n.a. United Republic of Tanzania n.a. n.a. Zambia n.a. n.a. n.a. n.a. n.a. n.a. n.a. n.a. n.a. n.a. Zimbabwe n.a. n.a. n.a. n.a. n.a. n.a. n.a. n.a. n.a. n.a. Source: Food and Agriculture Organisation (FAO): FAOSTAT 2014, Downloaded: 13 October 2014: National Statistics Offices of Member States 263
264 Table Agricultural Producer Price for Cattle Live Weight in SADC, US $ Per Tonne, Country Angola n.a. n.a. n.a. n.a. n.a. n.a. n.a. n.a. n.a. n.a. Botswana n.a. n.a. n.a. n.a. n.a. n.a. n.a. n.a Democratic Republic of Congo n.a. n.a. n.a. n.a. n.a. n.a. n.a. n.a. n.a. n.a. Lesotho n.a. n.a. n.a. n.a. n.a Madagascar n.a. n.a. n.a. n.a. Malawi n.a. Mauritius n.a n.a. n.a. n.a. Mozambique n.a. n.a. n.a. n.a. n.a. n.a. Namibia n.a. n.a. n.a. n.a. n.a. n.a. Seychelles n.a. n.a. n.a. n.a. n.a. n.a. n.a. n.a. n.a. n.a. South Africa Swaziland n.a. n.a. n.a. n.a. n.a. n.a. n.a. n.a. n.a. n.a. United Republic of Tanzania n.a. n.a. n.a. n.a. n.a. n.a. n.a. n.a. n.a. n.a. Zambia n.a. n.a. n.a. n.a. n.a. n.a. n.a. n.a. n.a. n.a. Zimbabwe n.a. n.a. n.a. n.a. n.a. n.a. n.a Source: Food and Agriculture Organisation (FAO): FAOSTAT 2014, Downloaded: 13 October 2014; 30 November 2015 Food and Agriculture Organisation (FAO): Downloaded: 2 August 2016: Malawi (2014) National Statistics Offices of Member States 264
265 Table Agricultural Producer Price for Cattle Meat in SADC, US $ Per Tonne, Country Angola n.a. n.a. n.a. n.a. n.a. n.a. n.a. n.a. n.a. n.a. Botswana n.a. n.a. n.a. n.a. n.a. n.a. n.a Democratic Republic of Congo n.a. n.a. n.a. n.a. n.a. n.a. n.a. n.a. n.a. n.a. Lesotho n.a. n.a. n.a. n.a. n.a. n.a. n.a. n.a. n.a. n.a. Madagascar n.a. n.a. Malawi n.a. Mauritius Mozambique n.a. n.a. n.a n.a. n.a. Namibia n.a. n.a. Seychelles n.a. n.a. n.a. n.a. n.a. n.a. n.a. n.a. n.a. n.a. South Africa Swaziland n.a. n.a. n.a. n.a. n.a. n.a. n.a. n.a. n.a. n.a. United Republic of Tanzania n.a. n.a. n.a. n.a. n.a. n.a. n.a. n.a. n.a. n.a. Zambia n.a. n.a. n.a. n.a. n.a. n.a. n.a. n.a. n.a. n.a. Zimbabwe n.a. n.a. n.a. n.a. n.a. n.a. n.a Source: Food and Agriculture Organisation (FAO): FAOSTAT 2014, Downloaded: 13 October 2014; 30 November 2015 Food and Agriculture Organisation (FAO): Downloaded: 2 August 2016: Madagascar ( ), Malawi (2014), Mozambique ( ), Namibia( ) National Statistics Offices of Member States 265
266 Table Agricultural Producer Price for Fresh Whole Cow Milk in SADC, US $ Per Tonne, Country Angola n.a. n.a. n.a. n.a. n.a. n.a. n.a. n.a. n.a. n.a. n.a. n.a. n.a n.a. Botswana n.a. n.a. n.a. n.a. n.a. n.a. n.a. n.a. n.a. n.a Democratic Republic of Congo n.a. n.a. n.a. n.a. n.a. n.a. n.a. n.a. n.a. n.a. n.a. n.a. n.a. n.a. n.a. n.a. Lesotho Madagascar n.a. n.a. n.a. n.a. n.a. n.a. n.a. n.a. n.a. n.a. n.a. n.a. n.a. n.a. n.a. n.a. Malawi n.a. n.a. n.a. n.a. n.a. n.a. n.a. n.a. n.a. n.a. n.a. n.a. n.a. n.a. n.a. n.a. Mauritius Mozambique n.a. n.a. n.a. n.a. n.a. n.a. Namibia n.a. n.a. n.a. n.a. n.a. n.a. n.a. n.a. n.a. n.a. Seychelles n.a. n.a. n.a. n.a. n.a. n.a. n.a. n.a. n.a. n.a. n.a. n.a. n.a. n.a. n.a. n.a South Africa Swaziland n.a. n.a. n.a. n.a. n.a. n.a. n.a. n.a. n.a. n.a. n.a. n.a. n.a. n.a. n.a. n.a. United Republic of Tanzania n.a. n.a. n.a. n.a. n.a. n.a. n.a. n.a. n.a. n.a. n.a. n.a. n.a. n.a. n.a. n.a. Zambia n.a. n.a. n.a. n.a. n.a. n.a. n.a. n.a. n.a. n.a. n.a. n.a. n.a. n.a n.a. Zimbabwe n.a. n.a. n.a. n.a. n.a. n.a. n.a. n.a. n.a. n.a. n.a. n.a. n.a. n.a Source: Food and Agriculture Organisation (FAO): FAOSTAT 2014, Downloaded: 13 October 2014; 30 November 2015 Food and Agriculture Organisation (FAO): Downloaded: 2 August 2016: Angola (2014), Zambia (2014), Zimbabwe (2014) National Statistics Offices of Member States 266
267 Table Agricultural Producer Price for Chicken Live Weight in SADC, US $ Per Tonne, Country Angola n.a. n.a. n.a. n.a. n.a. n.a. n.a. n.a. n.a. n.a. Botswana n.a. n.a. n.a. n.a. n.a. n.a. n.a Democratic Republic of Congo n.a. n.a. n.a. n.a. n.a. n.a. n.a. n.a. n.a. n.a. Lesotho Madagascar n.a. n.a. n.a. n.a. Malawi n.a. n.a. n.a. n.a. n.a. n.a. Mauritius n.a. n.a. n.a. Mozambique n.a. n.a. n.a. n.a. n.a. n.a. Namibia n.a. n.a. n.a. n.a. n.a. n.a. Seychelles n.a. n.a. n.a. n.a. n.a. n.a. n.a. n.a. n.a. n.a. South Africa n.a. Swaziland n.a. n.a. n.a. n.a. n.a. n.a. n.a. n.a. n.a. n.a. United Republic of Tanzania n.a. n.a. n.a. n.a. n.a. n.a. n.a. n.a. n.a. n.a. Zambia n.a. n.a. n.a. n.a. n.a. n.a. n.a. n.a. n.a. n.a. Zimbabwe n.a. n.a. n.a. n.a. n.a Source: Food and Agriculture Organisation (FAO): FAOSTAT 2014, Downloaded: 13 October 2014: National Statistics Offices of Member States 267
268 Table Agricultural Producer Price for Chicken Meat in SADC, US $ Per Tonne, Country Angola n.a. n.a. n.a. n.a. n.a. n.a. n.a. n.a. n.a. n.a. Botswana n.a. n.a. n.a. n.a. n.a. n.a. n.a Democratic Republic of Congo n.a. n.a. n.a. n.a. n.a. n.a. n.a. n.a. n.a. n.a. Lesotho Madagascar n.a. n.a. Malawi n.a. n.a. n.a. n.a. n.a. n.a. Mauritius Mozambique n.a n.a. n.a. Namibia n.a. n.a. n.a. n.a. n.a. n.a. Seychelles n.a. n.a. n.a. n.a. n.a. n.a. n.a. n.a. n.a. n.a. South Africa Swaziland n.a. n.a. n.a. n.a. n.a. n.a. n.a. n.a. n.a. n.a. United Republic of Tanzania n.a. n.a. n.a. n.a. n.a. n.a. n.a. n.a. n.a. n.a. Zambia n.a. n.a. n.a. n.a. n.a. n.a. n.a. n.a. n.a. n.a. Zimbabwe n.a. n.a. n.a. n.a. n.a. n.a Source: Food and Agriculture Organisation (FAO): FAOSTAT 2014, Downloaded: 13 October 2014: Food and Agriculture Organisation (FAO): Downloaded: 2 August 2016: Madagascar ( ),Mozambique ( ) National Statistics Offices of Member States 268
269 Table Agricultural Producer Price for Goat Live Weight in SADC, US $ Per Tonne, Country Angola n.a. n.a. n.a. n.a. n.a. n.a. n.a. n.a. n.a. n.a. Botswana n.a n.a n.a n.a n.a n.a n.a Democratic Republic of Congo n.a. n.a. n.a. n.a. n.a. n.a. n.a. n.a. n.a. n.a. Lesotho Madagascar n.a. n.a. n.a. n.a. n.a. n.a. Malawi n.a. n.a. Mauritius n.a. n.a. n.a. Mozambique n.a. n.a. n.a. n.a. n.a. n.a. Namibia n.a. n.a. Seychelles n.a. n.a. n.a. n.a. n.a. n.a. n.a. n.a. n.a. n.a. South Africa n.a. Swaziland n.a. n.a. n.a. n.a. n.a. n.a. n.a. n.a n.a. n.a. United Republic of Tanzania n.a n.a n.a n.a n.a n.a n.a n.a n.a. n.a. Zambia n.a. n.a. n.a. n.a. n.a. n.a. n.a. n.a. n.a. n.a. Zimbabwe n.a. n.a. n.a. n.a. n.a. n.a. n.a. n.a. n.a. n.a. Source: Food and Agriculture Organisation (FAO): FAOSTAT 2014, Downloaded: 13 October 2014; 30 November 2015 : Madagascar, Malawi, Mauritius, Mozambique, Namibia National Statistics Offices of Member States 269
270 Table Agricultural Producer Price for Goat Meat in SADC, US $ Per Tonne, Country Angola n.a. n.a. n.a. n.a. n.a. n.a. n.a. n.a. n.a. n.a. Botswana n.a. n.a. n.a. n.a. n.a. n.a. n.a Democratic Republic of Congo n.a. n.a. n.a. n.a. n.a. n.a. n.a. n.a. n.a. n.a. Lesotho n.a. n.a. n.a. n.a. n.a. n.a. n.a. n.a. n.a. n.a. Madagascar n.a. n.a. Malawi n.a. Mauritius Mozambique n.a. n.a. Namibia n.a. n.a. Seychelles n.a. n.a. n.a. n.a. n.a. n.a. n.a. n.a. n.a. n.a. South Africa Swaziland n.a. n.a. n.a. n.a. n.a. n.a. n.a. n.a. n.a. n.a. United Republic of Tanzania n.a. n.a. n.a. n.a. n.a. n.a. n.a. n.a. n.a. n.a. Zambia n.a. n.a. n.a. n.a. n.a. n.a. n.a. n.a. n.a. n.a. Zimbabwe n.a. n.a. n.a. n.a. n.a. n.a. n.a. n.a. n.a. n.a. Source: Food and Agriculture Organisation (FAO): FAOSTAT 2014, Downloaded: 13 October 2014; 30 November 2015 Food and Agriculture Organisation (FAO): Downloaded: 2 August 2016: Madagascar ( ), Malawi (2014), Mozambique ( ), Namibia ( ) National Statistics Offices of Member States 270
271 Table Agricultural Producer Price for Pig Liveweight in SADC, US $ Per Tonne, Country Angola n.a. n.a. n.a. n.a. n.a. n.a. n.a. n.a. n.a. n.a. Botswana n.a. n.a. n.a. n.a. n.a. n.a. n.a Democratic Republic of Congo n.a. n.a. n.a. n.a. n.a. n.a. n.a. n.a. n.a. n.a. Lesotho Madagascar n.a. n.a. n.a. n.a. Malawi n.a. Mauritius n.a. n.a. n.a. Mozambique n.a. n.a. n.a. n.a. n.a. Namibia n.a. n.a. n.a. n.a. n.a. n.a. Seychelles n.a. n.a. n.a. n.a. n.a. n.a. n.a. n.a. n.a. n.a. South Africa Swaziland n.a. n.a. n.a. n.a. n.a. n.a. n.a. n.a. n.a. n.a. United Republic of Tanzania n.a. n.a. n.a. n.a. n.a. n.a. n.a. n.a. n.a. n.a. Zambia n.a. n.a. n.a. n.a. n.a. n.a. n.a. n.a. n.a. n.a. Zimbabwe n.a. n.a. n.a. n.a. n.a. n.a. n.a. n.a. n.a. n.a. Source: Food and Agriculture Organisation (FAO): FAOSTAT 2014, Downloaded: 13 October 2014; 30 November 2015 Food and Agriculture Organisation (FAO): Downloaded: 2 August 2016: Malawi (2014) National Statistics Offices of Member States 271
272 Table Agricultural Producer Price for Pig Meat in SADC, US $ Per Tonne, Country Angola n.a. n.a. n.a. n.a. n.a. n.a. n.a. n.a. n.a. n.a. Botswana n.a. n.a. n.a. n.a. n.a. n.a. n.a Democratic Republic of Congo n.a. n.a. n.a. n.a. n.a. n.a. n.a. n.a. n.a. n.a. Lesotho n.a Madagascar n.a n.a. Malawi n.a. Mauritius Mozambique n.a n.a n.a. Namibia n.a n.a. Seychelles n.a. n.a. n.a. n.a. n.a. n.a. n.a. n.a. n.a. n.a. South Africa Swaziland n.a. n.a. n.a. n.a. n.a. n.a. n.a. n.a. n.a. n.a. United Republic of Tanzania n.a. n.a. n.a. n.a. n.a. n.a. n.a. n.a. n.a. n.a. Zambia n.a. n.a. n.a. n.a. n.a. n.a. n.a. n.a. n.a. n.a. Zimbabwe n.a. n.a. n.a. n.a. n.a. n.a. n.a. n.a. n.a. n.a. Source: Food and Agriculture Organisation (FAO): FAOSTAT 2014, Downloaded: 13 October 2014; 30 November 2015 Food and Agriculture Organisation (FAO): Downloaded: 2 August 2016: Madagascar ( ), Malawi (2014), Mozambique ( ), Namibia ( ) National Statistics Offices of Member States 272
273 Table Agricultural Producer Price for Sheep Live weight in SADC, US $ Per Tonne, Country Angola n.a. n.a. n.a. n.a. n.a. n.a. n.a. n.a. n.a. n.a. Botswana n.a. n.a. n.a. n.a. n.a. n.a. n.a Democratic Republic of Congo n.a. n.a. n.a. n.a. n.a. n.a. n.a. n.a. n.a. n.a. Lesotho Madagascar n.a. n.a. n.a. n.a. n.a. n.a. Malawi n.a. Mauritius n.a. n.a. n.a. n.a. n.a. n.a. Mozambique n.a. n.a. n.a. n.a. n.a. n.a. Namibia n.a. n.a. n.a. n.a. n.a. n.a. Seychelles South Africa Swaziland n.a. n.a. n.a. n.a. n.a. n.a. n.a. n.a. n.a. n.a. United Republic of Tanzania n.a. n.a. n.a. n.a. n.a. n.a. n.a. n.a. n.a. n.a. Zambia n.a. n.a. n.a. n.a. n.a. n.a. n.a. n.a. n.a. n.a. Zimbabwe n.a. n.a. n.a. n.a. n.a. n.a. n.a. n.a Source: Food and Agriculture Organisation (FAO): FAOSTAT 2014, Downloaded: 13 October 2014; 30 November 2015 Food and Agriculture Organisation (FAO): Downloaded: 2 August 2016: Malawi (2014), Zimbabwe (2014) National Statistics Offices of Member States 273
274 Table Agricultural Producer Price for Sheep Meat in SADC, US $ Per Tonne, Country Angola n.a. n.a. n.a. n.a. n.a. n.a. n.a. n.a. n.a. n.a. Botswana n.a. n.a. n.a. n.a. n.a. n.a. n.a Democratic Republic of Congo n.a. n.a. n.a. n.a. n.a. n.a. n.a. n.a. n.a. n.a. Lesotho n.a. n.a. n.a. n.a. n.a. n.a. n.a. n.a. n.a. n.a. Madagascar n.a. n.a. n.a. n.a. n.a. n.a. Malawi n.a. n.a. n.a. n.a. n.a. n.a. Mauritius n.a. n.a. n.a. n.a. n.a. n.a. Mozambique n.a. n.a. n.a. n.a. n.a. n.a. Namibia n.a. n.a. Seychelles South Africa Swaziland n.a. n.a. n.a. n.a. n.a. n.a. n.a. n.a. n.a. n.a. United Republic of Tanzania n.a. n.a. n.a. n.a. n.a. n.a. n.a. n.a. n.a. n.a. Zambia n.a. n.a. n.a. n.a. n.a. n.a. n.a. n.a. n.a. n.a. Zimbabwe n.a. n.a. n.a. n.a. n.a. n.a. n.a. n.a. n.a. n.a. Source: Food and Agriculture Organisation (FAO): ; downloaded 19 November 2013; 30 November 2015 Food and Agriculture Organisation (FAO): Downloaded: 2 August 2016: Namibia ( ) National Statistics Offices of Member States 274
275 Table Maize Production in SADC (Production, Area, and Yield), Angola Country Unit Production (000 Tonne) n.a. n.a. Area Planted (Ha) n.a. n.a. Yield (kg/ha) n.a. n.a. Production (000 Tonne) Area Planted (Ha) Yield (kg/ha) Production (000 Tonne) n.a. n.a. Area Planted (Ha) n.a. n.a. Yield (kg/ha) n.a. n.a. Production (000 Tonne) Area Planted (Ha) Yield (kg/ha) Production (000 Tonne) n.a. Area Planted (Ha) n.a. Yield (kg/ha) n.a. Production (000 Tonne) n.a Area Planted (Ha) n.a Yield (kg/ha) n.a Production (000 Tonne) Area Planted (Ha) Yield (kg/ha) Production (000 Tonne) n.a n.a n.a Area Planted (Ha) n.a n.a n.a Yield (kg/ha) n.a n.a n.a Production (000 Tonne) n.a. n.a. Area Planted (Ha) n.a. n.a. Yield (kg/ha) n.a. n.a. Production (000 Tonne) Area Planted (Ha) Yield (kg/ha) Production (000 Tonne) Area Planted (Ha) Yield (kg/ha) Production (000 Tonne) n.a. Area Planted (Ha) n.a. Yield (kg/ha) n.a. Production (000 Tonne) n.a. Area Planted (Ha) n.a. Yield (kg/ha) n.a. Production (000 Tonne) n.a. n.a. Area Planted (Ha) n.a. n.a. Yield (kg/ha) n.a. n.a. Production (000 Tonne) Area Planted (Ha) Yield (kg/ha) Production (000 Tonne) Area Planted (Ha) Yield (kg/ha) Botswana Democratic Republic of Congo Lesotho Madagascar Malawi Mauritius Mozambique Namibia Seychelles South Africa Swaziland United Republic of Tanzania Zambia Zimbabwe SADC - Total Source: Food and Agriculture Organisation (FAO): FAOSTAT 2014, ; Downloaded: 13 October 2014: Angola (2000, 2013), Botswana (2013), Democratic Republic of Congo, Madagascar, Mozambique ( ), Namibia ( ), Zambia ( ), Zimbabwe ( ) SADC Secretariat AIMS Database, Directorate of Food, Agriculture and Natural Resources (FANR): Mozambique, ( Production), Namibia, ( ), Zimbabwe ( ) United Nations Statistics Division - UNData, Food and Agriculture Organisation (FAO): dpwnloaded 2012: Mozambique, ( Production & Area), Namibia (2010) National Statistics Offices of Member States 275
276 Table Sorghum Production in SADC (Production, Area, and Yield), Angola Country Unit Production (000 Tonne) n.a. n.a. Area Planted (Ha) n.a. n.a. Yield (kg/ha) n.a. n.a. Production (000 Tonne) Area Planted (Ha) Yield (kg/ha) Production (000 Tonne) n.a. n.a. Area Planted (Ha) n.a. n.a. Yield (kg/ha) n.a. n.a. Production (000 Tonne) Area Planted (Ha) Yield (kg/ha) Production (000 Tonne) n.a. n.a. Area Planted (Ha) n.a. n.a. Yield (kg/ha) n.a. n.a. Production (000 Tonne) Area Planted (Ha) Yield (kg/ha) Production (000 Tonne) n.a. n.a. n.a. n.a. n.a. n.a. n.a. n.a. n.a. n.a. Area Planted (Ha) n.a. n.a. n.a. n.a. n.a. n.a. n.a. n.a. n.a. n.a. Yield (kg/ha) n.a. n.a. n.a. n.a. n.a. n.a. n.a. n.a. n.a. n.a. Production (000 Tonne) n.a n.a n.a Area Planted (Ha) n.a n.a n.a Yield (kg/ha) n.a n.a n.a Production (000 Tonne) n.a. n.a. Area Planted (Ha) n.a. n.a. Yield (kg/ha) n.a. n.a. Production (000 Tonne) Area Planted (Ha) Yield (kg/ha) Production (000 Tonne) Area Planted (Ha) Yield (kg/ha) Production (000 Tonne) n.a. Area Planted (Ha) n.a. Yield (kg/ha) n.a. Production (000 Tonne) n.a n.a. Area Planted (Ha) n.a n.a. Yield (kg/ha) n.a n.a. Production (000 Tonne) Area Planted (Ha) Yield (kg/ha) Production (000 Tonne) Area Planted (Ha) Yield (kg/ha) Production (000 Tonne) Area Planted (Ha) Yield (kg/ha) Botswana Democratic Republic of Congo Lesotho Madagascar Malawi Mauritius Mozambique Namibia Seychelles South Africa Swaziland United Republic of Tanzania Zambia Zimbabwe SADC - Total Source: Food and Agriculture Organisation (FAO): FAOSTAT 2014, ; Downloaded: 13 October 2014; 30 November 2015 : Angola, Botswana (2013), Democratic Republic of Congo, Lesotho, Madagascar, Mozambique ( ), Namibia ( ), Seychelles, Swaziland ( ), Zambia ( ), Zimbabwe ( ) SADC Secretariat AIMS Database, Directorate of Food, Agriculture and Natural Resources (FANR): Mozambique, ( Production), Namibia, ( ), Zimbabwe United Nations Statistics Division - UNData, Food and Agriculture Organisation (FAO): downloaded 2012: Mozambique, ( & Area), South Africa, Zimbabwe National Statistics Offices of Member States 276
277 Table Paddy Rice Production in SADC (Production, Area, and Yield), Country Unit Production (000 Tonne) n.a. n.a. Angola Area Planted (Ha) n.a. n.a. Yield (kg/ha) n.a. n.a. Production (000 Tonne) Botswana Area Planted (Ha) Yield (kg/ha) Democratic Production (000 Tonne) n.a. n.a. Republic of Area Planted (Ha) n.a. n.a. Congo Yield (kg/ha) n.a. n.a. Production (000 Tonne) Lesotho Area Planted (Ha) Yield (kg/ha) Production (000 Tonne) n.a. Madagascar Area Planted (Ha) n.a. Yield (kg/ha) n.a. Production (000 Tonne) Malawi Area Planted (Ha) Yield (kg/ha) Production (000 Tonne) n.a. n.a. n.a. n.a. n.a Mauritius Area Planted (Ha) n.a. n.a. n.a. n.a. n.a Yield (kg/ha) n.a. n.a. n.a. n.a. n.a Production (000 Tonne) n.a n.a n.a Mozambique Area Planted (Ha) n.a n.a n.a Yield (kg/ha) n.a n.a n.a Production (000 Tonne) Namibia Area Planted (Ha) Yield (kg/ha) Production (000 Tonne) Seychelles Area Planted (Ha) Yield (kg/ha) Production (000 Tonne) n.a n.a. South Africa Area Planted (Ha) n.a n.a. Yield (kg/ha) n.a n.a. Production (000 Tonne) n.a. Swaziland Area Planted (Ha) n.a. Yield (kg/ha) n.a. United Production (000 Tonne) n.a. Republic of Area Planted (Ha) n.a. Tanzania Yield (kg/ha) n.a. Production (000 Tonne) Zambia Area Planted (Ha) Yield (kg/ha) Production (000 Tonne) Zimbabwe Area Planted (Ha) Yield (kg/ha) Production (000 Tonne) SADC - Total Area Planted (Ha) Yield (kg/ha) Source: Food and Agriculture Organisation (FAO):FAOSTAT 2014, ; Downloaded: 13 October 2014: Angola (2000, 2013), Democratic Republic of Congo, Madagascar, Mozambique ( ), South Africa ( ), Swaziland ( ), Zambia ( ), Zimbabwe ( ) SADC Secretariat AIMS Database, Directorate of Food, Agriculture and Natural Resources (FANR): Mozambique, ( Production), Zambia United Nations Statistics Division - UNData, Food and Agriculture Organisation (FAO): downloaded 2012: South Africa, Zimbabwe National Statistics Offices of Member States 277
278 Table Cassava Production in SADC (Production, Area, and Yield), Country Unit Production (000 Tonne) n.a. n.a. Angola Area Planted (Ha) n.a. n.a. Yield (kg/ha) n.a. n.a. Production (000 Tonne) n.a. n.a. n.a. n.a. n.a. n.a. n.a. n.a. n.a. n.a. Botswana Area Planted (Ha) n.a. n.a. n.a. n.a. n.a. n.a. n.a. n.a. n.a. n.a. Yield (kg/ha) n.a. n.a. n.a. n.a. n.a. n.a. n.a. n.a. n.a. n.a. Democratic Production (000 Tonne) n.a. n.a. Republic of Area Planted (Ha) n.a. n.a. Congo Yield (kg/ha) n.a. n.a. Production (000 Tonne) Lesotho Area Planted (Ha) Yield (kg/ha) Production (000 Tonne) n.a. Madagascar Area Planted (Ha) n.a. Yield (kg/ha) n.a. Production (000 Tonne) Malawi Area Planted (Ha) Yield (kg/ha) Production (000 Tonne) Mauritius Area Planted (Ha) Yield (kg/ha) Production (000 Tonne) n.a n.a n.a n.a Mozambique Area Planted (Ha) n.a n.a n.a n.a Yield (kg/ha) n.a n.a n.a n.a Production (000 Tonne) Namibia Area Planted (Ha) Yield (kg/ha) Production (000 Tonne) n.a. 0.2 Seychelles Area Planted (Ha) n.a Yield (kg/ha) n.a Production (000 Tonne) n.a. n.a. n.a. n.a. n.a. n.a. n.a. n.a. n.a. n.a. South Africa Area Planted (Ha) n.a. n.a. n.a. n.a. n.a. n.a. n.a. n.a. n.a. n.a. Yield (kg/ha) n.a. n.a. n.a. n.a. n.a. n.a. n.a. n.a. n.a. n.a. Production (000 Tonne) n.a. n.a. n.a. n.a. n.a. n.a. n.a. n.a. n.a. n.a. Swaziland Area Planted (Ha) n.a. n.a. n.a. n.a. n.a. n.a. n.a. n.a. n.a. n.a. Yield (kg/ha) n.a. n.a. n.a. n.a. n.a. n.a. n.a. n.a. n.a. n.a. United Production (000 Tonne) n.a. Republic of Area Planted (Ha) n.a. Tanzania Yield (kg/ha) n.a. Production (000 Tonne) Zambia Area Planted (Ha) Yield (kg/ha) Production (000 Tonne) Zimbabwe Area Planted (Ha) Yield (kg/ha) Production (000 Tonne) SADC - Total Area Planted (Ha) Yield (kg/ha) Source: Food and Agriculture Organisation (FAO): FAOSTAT 2014, ; Downloaded: 13 October 2014: Angola (2000, 2013), Democratic Republic of Congo, Madagascar, Mozambique, Seychelles ( ),Zambia ( ), Zimbabwe ( ) United Nations Statistics Division - UNData, Food and Agriculture Organisation (FAO): downloaded 2012: Zimbabwe ( ) National Statistics Offices of Member States 278
279 Table Wheat Production in SADC (Production, Area, and Yield), Country Unit Production (000 Tonne) n.a. n.a. Angola Area Planted (Ha) n.a. n.a. Yield (kg/ha) n.a. n.a. Production (000 Tonne) Botswana Area Planted (Ha) Yield (kg/ha) Democratic Production (000 Tonne) n.a. n.a. Republic of Area Planted (Ha) n.a. n.a. Congo Yield (kg/ha) n.a. n.a. Production (000 Tonne) Lesotho Area Planted (Ha) Yield (kg/ha) Production (000 Tonne) n.a. n.a. Madagascar Area Planted (Ha) n.a. n.a. Yield (kg/ha) n.a. n.a. Production (000 Tonne) Malawi Area Planted (Ha) Yield (kg/ha) Production (000 Tonne) n.a. n.a. n.a. n.a. n.a. n.a. n.a. n.a. n.a. n.a. Mauritius Area Planted (Ha) n.a. n.a. n.a. n.a. n.a. n.a. n.a. n.a. n.a. n.a. Yield (kg/ha) n.a. n.a. n.a. n.a. n.a. n.a. n.a. n.a. n.a. n.a. Production (000 Tonne) n.a. Mozambique Area Planted (Ha) n.a. Yield (kg/ha) n.a. Production (000 Tonne) n.a. n.a. Namibia Area Planted (Ha) n.a. n.a. Yield (kg/ha) n.a. n.a. Production (000 Tonne) Seychelles Area Planted (Ha) Yield (kg/ha) Production (000 Tonne) South Africa Area Planted (Ha) Yield (kg/ha) Production (000 Tonne) n.a. Swaziland Area Planted (Ha) n.a. Yield (kg/ha) n.a. United Production (000 Tonne) n.a. Republic of Area Planted (Ha) n.a. Tanzania Yield (kg/ha) n.a. Production (000 Tonne) Zambia Area Planted (Ha) Yield (kg/ha) Production (000 Tonne) Zimbabwe Area Planted (Ha) Yield (kg/ha) Production (000 Tonne) SADC - Total Area Planted (Ha) Yield (kg/ha) Source: Food and Agriculture Organisation (FAO): FAOSTAT 2014, ; Downloaded: 13 October 2014; 30 November 2015 : Angola ( ), Botswana (2013), Democratic Republic of Congo, Madagascar, Mozambique, Namibia ( ), Swaziland ( ), Zambia ( ), Zimbabwe ( ) SADC Secretariat AIMS Database, Directorate of Food, Agriculture and Natural Resources (FANR): Lesotho ( ), Namibia ( ) United Nations Statistics Division - UNData, Food and Agriculture Organisation (FAO): downloaded 2012: Lesotho, (2010), Zambia ( ), Zimbabwe ( ) National Statistics Offices of Member States 279
280 Table Groundnut with Shell Production in SADC (Production, Area, and Yield), Country Unit Production (000 Tonne) n.a. n.a. Angola Area Planted (Ha) n.a. n.a. Yield (kg/ha) n.a. n.a. Production (000 Tonne) Botswana Area Planted (Ha) Yield (kg/ha) Democratic Production (000 Tonne) n.a. n.a. Republic of Area Planted (Ha) n.a. n.a. Congo Yield (kg/ha) n.a. n.a. Production (000 Tonne)... Lesotho Area Planted (Ha)... Yield (kg/ha)... Production (000 Tonne) n.a. n.a. Madagascar Area Planted (Ha) n.a. n.a. Yield (kg/ha) n.a. n.a. Production (000 Tonne) n.a Malawi Area Planted (Ha) n.a Yield (kg/ha) n.a Production (000 Tonne) Mauritius Area Planted (Ha) Yield (kg/ha) Production (000 Tonne) n.a n.a n.a Mozambique Area Planted (Ha) n.a n.a n.a Yield (kg/ha) n.a n.a n.a Production (000 Tonne) n.a. n.a. Namibia Area Planted (Ha) n.a. n.a. Yield (kg/ha) n.a. n.a. Production (000 Tonne) Seychelles Area Planted (Ha) Yield (kg/ha) Production (000 Tonne) South Africa Area Planted (Ha) Yield (kg/ha) Production (000 Tonne) n.a. Swaziland Area Planted (Ha) n.a. Yield (kg/ha) n.a. United Production (000 Tonne) n.a. n.a. Republic of Area Planted (Ha) n.a. n.a. Tanzania Yield (kg/ha) n.a. n.a. Production (000 Tonne) Zambia Area Planted (Ha) Yield (kg/ha) Production (000 Tonne) Zimbabwe Area Planted (Ha) Yield (kg/ha) Production (000 Tonne) SADC - Total Area Planted (Ha) Yield (kg/ha) Source: Food and Agriculture Organisation (FAO): FAOSTAT 2014, ; Downloaded: 13 October 2014: Angola (2013), Botswana (2013), Democratic Republic of Congo, Madagascar, Mozambique ( ), Namibia ( ), Swaziland ( ), United Republic of Tanzania (2011, 203), Zambia ( ), Zimbabwe ( ) SADC Secretariat AIMS Database, Directorate of Food, Agriculture and Natural Resources (FANR): Zambia, Zimbabwe ( Production and Area) United Nations Statistics Division - UNData, Food and Agriculture Organisation (FAO): downloaded 2012: Namibia ( ) National Statistics Offices of Member States 280
281 Table Soyabeans Production in SADC (Production, Area, and Yield), Country Unit Angola Botswana Democratic Republic of Congo Lesotho Madagascar Malawi Mauritius Mozambique Namibia Seychelles South Africa Swaziland United Republic of Tanzania Zambia Zimbabwe SADC - Total Production (000 Tonne) n.a. n.a. Area Planted (Ha) n.a. n.a. Yield (kg/ha) n.a. n.a. Production (000 Tonne) Area Planted (Ha) Yield (kg/ha) Production (000 Tonne) n.a. n.a. Area Planted (Ha) n.a. n.a. Yield (kg/ha) n.a. n.a. Production (000 Tonne)... Area Planted (Ha)... Yield (kg/ha)... Production (000 Tonne) n.a. n.a. Area Planted (Ha) n.a. n.a. Yield (kg/ha) n.a. n.a. Production (000 Tonne) n.a Area Planted (Ha) n.a Yield (kg/ha) n.a Production (000 Tonne) n.a. n.a. n.a. n.a. n.a. n.a. n.a. n.a. n.a. n.a. Area Planted (Ha) n.a. n.a. n.a. n.a. n.a. n.a. n.a. n.a. n.a. n.a. Yield (kg/ha) n.a. n.a. n.a. n.a. n.a. n.a. n.a. n.a. n.a. n.a. Production (000 Tonne) n.a. n.a. n.a. n.a n.a. Area Planted (Ha) n.a. n.a. n.a. n.a n.a. Yield (kg/ha) n.a. n.a. n.a. n.a n.a. Production (000 Tonne) Area Planted (Ha) Yield (kg/ha) Production (000 Tonne) Area Planted (Ha) Yield (kg/ha) Production (000 Tonne) Area Planted (Ha) Yield (kg/ha) Production (000 Tonne) n.a. n.a. n.a. n.a. n.a. n.a. n.a. n.a. n.a. n.a. Area Planted (Ha) n.a. n.a. n.a. n.a. n.a. n.a. n.a. n.a. n.a. n.a. Yield (kg/ha) n.a. n.a. n.a. n.a. n.a. n.a. n.a. n.a. n.a. n.a. Production (000 Tonne) n.a. n.a. Area Planted (Ha) n.a. n.a. Yield (kg/ha) n.a. n.a. Production (000 Tonne) Area Planted (Ha) Yield (kg/ha) Production (000 Tonne) Area Planted (Ha) Yield (kg/ha) Production (000 Tonne) n.a. n.a. Area Planted (Ha) n.a. n.a. Yield (kg/ha) n.a. n.a. Source: Food and Agriculture Organisation (FAO): FAOSTAT 2014, ; Downloaded: 13 October 2014: Angola, Democratic Republic of Congo, Madagascar, South Africa ( ), United Republic of Tanzania (2011, 2013), Zambia ( ), Zimbabwe ( ) SADC Secretariat AIMS Database, Directorate of Food, Agriculture and Natural Resources (FANR): Angola, (2000, ), Zambia, Zimbabwe ( ) National Statistics Offices of Member States 281
282 Table Coffee Production in SADC (Production, Area, and Yield), Green, Country Unit Production (000 Tonne) n.a. n.a. Angola Area Planted (Ha) n.a. n.a. Yield (kg/ha) n.a. n.a. Production (000 Tonne) Botswana Area Planted (Ha) Yield (kg/ha) Democratic Production (000 Tonne) n.a. n.a. Republic of Area Planted (Ha) n.a. n.a. Congo Yield (kg/ha) n.a. n.a. Production (000 Tonne)... Lesotho Area Planted (Ha)... Yield (kg/ha)... Production (000 Tonne) n.a. n.a. Madagascar Area Planted (Ha) n.a. n.a. Yield (kg/ha) n.a. n.a. Production (000 Tonne) n.a. n.a. Malawi Area Planted (Ha) n.a. n.a. Yield (kg/ha) n.a. n.a. Production (000 Tonne) n.a. n.a. n.a. n.a. n.a. n.a. n.a. n.a. n.a. n.a. Mauritius Area Planted (Ha) n.a. n.a. n.a. n.a. n.a. n.a. n.a. n.a. n.a. n.a. Yield (kg/ha) n.a. n.a. n.a. n.a. n.a. n.a. n.a. n.a. n.a. n.a. Production (000 Tonne) n.a. n.a. Mozambique Area Planted (Ha) n.a. n.a. Yield (kg/ha) n.a. n.a. Production (000 Tonne) Namibia Area Planted (Ha) Yield (kg/ha) Production (000 Tonne) Seychelles Area Planted (Ha) Yield (kg/ha) Production (000 Tonne) n.a. n.a. n.a. n.a. n.a. n.a. n.a. n.a. n.a. n.a. South Africa Area Planted (Ha) n.a. n.a. n.a. n.a. n.a. n.a. n.a. n.a. n.a. n.a. Yield (kg/ha) n.a. n.a. n.a. n.a. n.a. n.a. n.a. n.a. n.a. n.a. Production (000 Tonne) n.a. n.a. n.a. n.a. n.a. n.a. n.a. n.a. n.a. n.a. Swaziland Area Planted (Ha) n.a. n.a. n.a. n.a. n.a. n.a. n.a. n.a. n.a. n.a. Yield (kg/ha) n.a. n.a. n.a. n.a. n.a. n.a. n.a. n.a. n.a. n.a. United Production (000 Tonne) n.a. Republic of Area Planted (Ha) n.a. Tanzania Yield (kg/ha) n.a. Production (000 Tonne) n.a. n.a. Zambia Area Planted (Ha) n.a. n.a. Yield (kg/ha) n.a. n.a. Production (000 Tonne) Zimbabwe Area Planted (Ha) Yield (kg/ha) Production (000 Tonne) n.a. n.a. SADC - Total Area Planted (Ha) n.a. n.a. Yield (kg/ha) n.a. n.a. Source: Food and Agriculture Organisation (FAO): FAOSTAT 2014, ; Downloaded: 13 October 2014; 30 November 2015 : Democratic Republic of Congo, Madagascar, Mozambique ( ), Zambia ( ), Zimbabwe ( ) United Nations Statistics Division - UNData, Food and Agriculture Organisation (FAO): downloaded 2012: Angola, Democratic Republic of Congo, Madagascar, Malawi ( Area), Mozambique ( ), Zambia ( ), Zimbabwe ( ) National Statistics Offices of Member States 282
283 Table Tea Production in SADC (Production, Area, and Yield), Country Unit Production (000 Tonne) n.a. n.a. n.a. n.a. n.a. n.a. n.a. n.a. n.a. n.a. Angola Area Planted (Ha) n.a. n.a. n.a. n.a. n.a. n.a. n.a. n.a. n.a. n.a. Yield (kg/ha) n.a. n.a. n.a. n.a. n.a. n.a. n.a. n.a. n.a. n.a. Production (000 Tonne) Botswana Area Planted (Ha) Yield (kg/ha) Democratic Production (000 Tonne) n.a. n.a. Republic of Area Planted (Ha) n.a. n.a. Congo Yield (kg/ha) n.a. n.a. Production (000 Tonne)... Lesotho Area Planted (Ha)... Yield (kg/ha)... Production (000 Tonne) n.a. n.a. Madagascar Area Planted (Ha) n.a. n.a. Yield (kg/ha) n.a. n.a. Production (000 Tonne) n.a. Malawi Area Planted (Ha) n.a. Yield (kg/ha) n.a. Production (000 Tonne) Mauritius Area Planted (Ha) Yield (kg/ha) Production (000 Tonne) n.a Mozambique Area Planted (Ha) n.a Yield (kg/ha) n.a Production (000 Tonne) n.a. Namibia Area Planted (Ha) n.a. Yield (kg/ha) n.a. Production (000 Tonne) Seychelles Area Planted (Ha) Yield (kg/ha) Production (000 Tonne) n.a. South Africa Area Planted (Ha) n.a. Yield (kg/ha) n.a. Production (000 Tonne) n.a. n.a. n.a. n.a. n.a. n.a. n.a. n.a. n.a. n.a. Swaziland Area Planted (Ha) n.a. n.a. n.a. n.a. n.a. n.a. n.a. n.a. n.a. n.a. Yield (kg/ha) n.a. n.a. n.a. n.a. n.a. n.a. n.a. n.a. n.a. n.a. United Production (000 Tonne) n.a. Republic of Area Planted (Ha) n.a. Tanzania Yield (kg/ha) n.a. Production (000 Tonne) n.a. n.a. Zambia Area Planted (Ha) n.a. n.a. Yield (kg/ha) n.a. n.a. Production (000 Tonne) Zimbabwe Area Planted (Ha) Yield (kg/ha) Production (000 Tonne) SADC - Total Area Planted (Ha) Yield (kg/ha) Source: Food and Agriculture Organisation (FAO): FAOSTAT 2014, ; Downloaded: 13 October 2014; 30 November 2015 : Democratic Republic of Congo, Madagascar, Malawi (2011), Mozambique ( ), Seychelles ( ), Zambia ( ), Zimbabwe ( ) United Nations Statistics Division - UNData, Food and Agriculture Organisation (FAO): downloaded 2012: Malawi ( Area), Mozambique ( ), Zambia ( ), Zimbabwe ( ) National Statistics Offices of Member States 283
284 Table Seed Cotton Production in SADC (Production, Area, and Yield), Angola Botswana Country Unit Production (000 Tonne) n.a. n.a. Area Planted (Ha) n.a. n.a. Yield (kg/ha) n.a. n.a. Production (000 Tonne) n.a. n.a. Area Planted (Ha) n.a. n.a. Yield (kg/ha) n.a. n.a. Production (000 Tonne) n.a. n.a. Area Planted (Ha) n.a. n.a. Yield (kg/ha) n.a. n.a. Production (000 Tonne)... Area Planted (Ha)... Yield (kg/ha)... Production (000 Tonne) n.a. n.a. Area Planted (Ha) n.a. n.a. Yield (kg/ha) n.a. n.a. Production (000 Tonne) n.a Area Planted (Ha) n.a Yield (kg/ha) n.a Production (000 Tonne) n.a. n.a. n.a. n.a. n.a. n.a. n.a. n.a. n.a. n.a. Area Planted (Ha) n.a. n.a. n.a. n.a. n.a. n.a. n.a. n.a. n.a. n.a. Yield (kg/ha) n.a. n.a. n.a. n.a. n.a. n.a. n.a. n.a. n.a. n.a. Production (000 Tonne) Area Planted (Ha) n.a. Yield (kg/ha) n.a. Production (000 Tonne) n.a. n.a. n.a. n.a. n.a. Area Planted (Ha) n.a. n.a. n.a. n.a. n.a. Yield (kg/ha) n.a. n.a. n.a. n.a. n.a. Production (000 Tonne) Area Planted (Ha) Yield (kg/ha) Production (000 Tonne) Area Planted (Ha) n.a. Yield (kg/ha) n.a. Production (000 Tonne) n.a. Area Planted (Ha) n.a. Yield (kg/ha) n.a. Production (000 Tonne) n.a. Area Planted (Ha) n.a. Yield (kg/ha) n.a. Production (000 Tonne) Area Planted (Ha) Yield (kg/ha) Production (000 Tonne) Area Planted (Ha) Yield (kg/ha) Production (000 Tonne) n.a. n.a. Area Planted (Ha) n.a. n.a. Yield (kg/ha) n.a. n.a. Democratic Republic of Congo Lesotho Madagascar Malawi Mauritius Mozambique Namibia Seychelles South Africa Swaziland United Republic of Tanzania Zambia Zimbabwe SADC - Total Source: Food and Agriculture Organisation (FAO): FAOSTAT 2014, ; Downloaded: 13 October 2014: Angola, Botswana ( ), Democratic Republic of Congo, Madagascar, Mozambique ( ), Swaziland ( ), Zambia ( ), Zimbabwe ( ) SADC Secretariat AIMS Database, Directorate of Food, Agriculture and Natural Resources (FANR): Madagascar ( Production), Malawi ( Production), Zimbabwe ( ) United Nations Statistics Division - UNData, Food and Agriculture Organisation (FAO): downloaded 2012: Mozambique ( ), Namibia ( ), Zambia ( ), Zimbabwe ( ) National Statistics Offices of Member States 284
285 Table Tobacco Production in SADC (Production, Area, and Yield), Unmanufactured, Country Unit Production (000 Tonne) n.a. n.a. Angola Area Planted (Ha) n.a. n.a. Yield (kg/ha) n.a. n.a. Production (000 Tonne) Botswana Area Planted (Ha) Yield (kg/ha) Democratic Production (000 Tonne) n.a. n.a. Republic of Area Planted (Ha) n.a. n.a. Congo Yield (kg/ha) n.a. n.a. Production (000 Tonne)... Lesotho Area Planted (Ha)... Yield (kg/ha)... Production (000 Tonne) n.a. n.a. Madagascar Area Planted (Ha) n.a. n.a. Yield (kg/ha) n.a. n.a. Production (000 Tonne) n.a Malawi Area Planted (Ha) n.a Yield (kg/ha) n.a Production (000 Tonne) n.a. n.a. Mauritius Area Planted (Ha) n.a. n.a. Yield (kg/ha) n.a. n.a. Production (000 Tonne) Mozambique Area Planted (Ha) Yield (kg/ha) Production (000 Tonne) Namibia Area Planted (Ha) Yield (kg/ha) Production (000 Tonne) Seychelles Area Planted (Ha) Yield (kg/ha) Production (000 Tonne) n.a. South Africa Area Planted (Ha) n.a. Yield (kg/ha) n.a. Production (000 Tonne) n.a n.a. Swaziland Area Planted (Ha) n.a n.a. Yield (kg/ha) n.a n.a. United Production (000 Tonne) n.a. Republic of Area Planted (Ha) n.a. Tanzania Yield (kg/ha) n.a. Production (000 Tonne) Zambia Area Planted (Ha) Yield (kg/ha) Production (000 Tonne) Zimbabwe Area Planted (Ha) n.a Yield (kg/ha) n.a Production (000 Tonne) n.a. n.a. SADC - Total Area Planted (Ha) n.a. n.a. Yield (kg/ha) n.a. n.a. Source: Food and Agriculture Organisation (FAO): FAOSTAT 2014, ; Downloaded: 13 October 2014; 30 November 2015 : Angola ( ), Democratic Republic of Congo, Madagascar, Mozambique ( ), Swaziland (2011), (2011), Zambia ( ), Zimbabwe ( ) SADC Secretariat AIMS Database, Directorate of Food, Agriculture and Natural Resources (FANR): Zimbabwe ( ) United Nations Statistics Division - UNData, Food and Agriculture Organisation (FAO): downloaded 2012: Angola ( ), Mozambique ( ), Zimbabwe ( ) National Statistics Offices of Member States 285
286 Table Sugarcane Production in SADC (Production, Area, and Yield), Country Unit Production (000 Tonne) n.a. n.a. Angola Area Planted (Ha) n.a. n.a. Yield (kg/ha) n.a. n.a. Production (000 Tonne) Botswana Area Planted (Ha) Yield (kg/ha) Democratic Production (000 Tonne) n.a. n.a. Republic of Area Planted (Ha) n.a. n.a. Congo Yield (kg/ha) n.a. n.a. Production (000 Tonne)... Lesotho Area Planted (Ha)... Yield (kg/ha)... Production (000 Tonne) n.a. n.a. Madagascar Area Planted (Ha) n.a. n.a. Yield (kg/ha) n.a. n.a. Production (000 Tonne) n.a. n.a. Malawi Area Planted (Ha) n.a. n.a. Yield (kg/ha) n.a. n.a. Production (000 Tonne) Mauritius Area Planted (Ha) Yield (kg/ha) Production (000 Tonne) Mozambique Area Planted (Ha) Yield (kg/ha) Production (000 Tonne) Namibia Area Planted (Ha) Yield (kg/ha) Production (000 Tonne) Seychelles Area Planted (Ha) Yield (kg/ha) Production (000 Tonne) South Africa Area Planted (Ha) Yield (kg/ha) Production (000 Tonne) n.a. n.a. Swaziland Area Planted (Ha) n.a. n.a. Yield (kg/ha) n.a. n.a. United Production (000 Tonne) n.a. Republic of Area Planted (Ha) n.a. Tanzania Yield (kg/ha) n.a. Production (000 Tonne) n.a. n.a. Zambia Area Planted (Ha) n.a. n.a. Yield (kg/ha) n.a. n.a. Production (000 Tonne) Zimbabwe Area Planted (Ha) Yield (kg/ha) Production (000 Tonne) n.a. n.a. SADC - Total Area Planted (Ha) n.a. n.a. Yield (kg/ha) n.a. n.a. Source: Food and Agriculture Organisation (FAO): FAOSTAT 2014, ; Downloaded: 13 October 2014: Angola, Democratic Republic of Congo, Madagascar, Malawi ( ), Mauritius ( ), Mozambique ( ), Swaziland( ), Zambia ( ), Zimbabwe ( ) United Nations Statistics Division - UNData, Food and Agriculture Organisation (FAO): downloaded 2012 : Malawi ( ), Mozambique ( ), Zambia ( ), Zimbabwe ( ) National Statistics Offices of Member States 286
287 Table Exports of Selected Agricultural Products and Inputs in SADC, Million US $, Product / Input Year Angola Botswana Democratic Republic of Congo Cassava Maize Rice Soya Bean Sugar Beans Lesotho Madagascar Malawi Mauritius Mozambique Namibia Seychelles South Africa Swaziland United Republic of Tanzania Zambia Zimbabwe SADC - Total 2009 n.a n.a. n.a. n.a n.a. n.a n.a n.a. n.a. n.a n.a. n.a n.a n.a. n.a n.a. n.a. n.a n.a n.a n.a n.a n.a. 0.0 n.a. n.a. n.a. n.a. n.a. 0.0 n.a. n.a. n.a. n.a n.a. n.a. n.a. n.a. n.a. 0.0 n.a. 0.8 n.a. n.a. n.a. n.a. n.a n.a. n.a. n.a. n.a. n.a. 0.0 n.a. 1.0 n.a. n.a. n.a. n.a. n.a n.a n.a n.a n.a n.a. 0.1 n.a. n.a n.a. 0.1 n.a. n.a. n.a. n.a. 0.5 n.a. n.a n.a. n.a. n.a. n.a n.a. n.a. n.a. n.a. n.a. n.a. 0.0 n.a. n.a n.a. n.a. n.a. n.a. n.a n.a. n.a. n.a. n.a. n.a. n.a. 0.0 n.a. n.a n.a. n.a. n.a. na n.a n.a n.a n.a n.a. n.a n.a. n.a n.a. n.a. n.a. n.a n.a. 0.5 n.a. n.a n.a. n.a n.a. n.a. n.a. n.a. n.a n.a. n.a. n.a n.a. n.a n.a. n.a. n.a. na n.a n.a n.a n.a n.a. 0.0 n.a n.a. n.a n.a n.a n.a n.a n.a n.a n.a. n.a n.a. 0.0 n.a. n.a. n.a. n.a. n.a. n.a n.a. n.a. n.a. n.a n.a. n.a. n.a. n.a. n.a. 0.0 n.a. n.a. 1.6 n.a. n.a. n.a. n.a. n.a n.a. n.a. n.a. n.a. n.a. 0.0 n.a. n.a. 2.7 n.a. n.a. n.a. na n.a n.a n.a n.a. n.a n.a n.a n.a. n.a n.a n.a n.a n.a. 0.0 n.a. n.a. n.a. n.a. n.a. n.a. n.a. n.a. n.a. n.a. n.a n.a. n.a. n.a. n.a. n.a. n.a. n.a. n.a. n.a. n.a. n.a. n.a. n.a. n.a n.a. n.a. n.a. n.a. n.a. n.a. n.a. n.a. n.a. n.a. n.a. n.a. n.a. n.a. Source: SADC Secretariat Statistics Unit, Trade Database, 19 November 2013: National Statistics Offices of Member States 287
288 Table (contd.) Exports of Selected Agricultural Products and Inputs in SADC, Million US $, Product / Input Year Angola Botswana Democratic Republic of Congo Fruit Cotton Tobacco Fertilizers, manufactured Fungicides, Herbicides, Insecticides Lesotho Madagascar Malawi Mauritius Mozambique Namibia Seychelles South Africa Swaziland United Republic of Tanzania Zambia Zimbabwe SADC - Total n.a n.a n.a n.a. 0.0 n.a. n.a. n.a. n.a. 6.4 n.a. n.a n.a. n.a. n.a. n.a n.a. n.a. n.a. n.a. n.a. n.a. 6.1 n.a. n.a n.a. n.a. n.a. n.a. n.a n.a. n.a. n.a. n.a. n.a. n.a. 4.7 n.a. n.a n.a. n.a. n.a. n.a. n.a n.a. 0.1 n.a. n.a n.a. 0.0 n.a n.a n.a. 0.0 n.a. n.a n.a. n.a. 1.7 n.a n.a. n.a n.a. n.a. n.a. n.a n.a. n.a. 0.9 n.a n.a. n.a. n.a n.a. n.a. n.a. n.a n.a. n.a. 1.0 n.a n.a. n.a. n.a n.a. 3.9 n.a. n.a n.a. n.a. 7.2 n.a n.a. n.a n.a. 1.3 n.a. n.a n.a. n.a. 5.6 n.a n.a. n.a. n.a n.a. n.a. n.a. n.a n.a. n.a. 7.5 n.a n.a. n.a. n.a n.a n.a n.a n.a n.a n.a n.a n.a n.a n.a n.a n.a. 0.0 n.a. n.a. n.a. n.a. 0.3 n.a. n.a. n.a. n.a. n.a. n.a. n.a n.a. n.a. n.a. n.a. n.a. n.a. 0.3 n.a. n.a. n.a. n.a. n.a. n.a. n.a. n.a n.a. n.a. n.a. n.a. n.a. n.a. 0.0 n.a. n.a. n.a. n.a. n.a. n.a. n.a. n.a n.a n.a n.a n.a n.a n.a. 0.0 n.a. n.a n.a. 0.0 n.a. n.a. n.a. n.a. 8.1 n.a. n.a. n.a. n.a. n.a. n.a. n.a n.a. n.a. n.a. n.a. n.a. n.a n.a. n.a. n.a. n.a. n.a. n.a. n.a. n.a n.a. n.a. n.a. n.a. n.a. n.a. 9.6 n.a. n.a. n.a. n.a. n.a. n.a. n.a. n.a. Source: SADC Secretariat Statistics Unit, Trade Database, 19 November 2013: National Statistics Offices of Member States 288
289 Table Imports of Selected Agricultural Products and Inputs in SADC, Million US $, Product / Input Year Angola Botswana Democratic Republic of Congo Cassava Maize Rice Soya Bean Sugar Beans Lesotho Madagascar Malawi Mauritius Mozambique Namibia Seychelles South Africa Swaziland United Republic of Tanzania Zambia Zimbabwe SADC - Total 2009 n.a n.a. n.a. n.a n.a. 0.0 n.a n.a n.a. n.a. n.a. n.a n.a. 0.0 n.a n.a n.a. n.a. n.a. n.a n.a n.a n.a. 0.0 n.a n.a. n.a n.a. n.a. n.a. n.a. n.a. n.a 0.0 n.a. n.a. n.a. n.a n.a. n.a. n.a. n.a. n.a. n.a. n.a. n.a. n.a. 0.4 n.a. n.a. n.a. n.a. n.a n.a. n.a. n.a. n.a. n.a. n.a. n.a. n.a. n.a. 0.4 n.a. n.a. n.a. n.a. n.a n.a n.a n.a. n.a n.a. n.a n.a. n.a. n.a 1.0 n.a. n.a. n.a. n.a n.a. n.a. n.a. n.a n.a. n.a. n.a 36.3 n.a. n.a. n.a. n.a. n.a n.a. n.a. n.a. n.a n.a. n.a. n.a n.a. n.a. n.a. n.a. n.a n.a n.a. n.a n.a. n.a n.a. n.a. n.a n.a. n.a. n.a. n.a n.a. n.a. n.a. n.a n.a. n.a. n.a n.a. n.a. n.a. n.a. n.a n.a. n.a. n.a. n.a n.a. n.a. n.a n.a. n.a. n.a. n.a. n.a n.a n.a n.a. n.a n.a. n.a. 0.6 n.a. n.a. n.a 3.5 n.a. n.a. n.a. n.a n.a. n.a. n.a. n.a. 0.7 n.a. n.a. n.a 50.2 n.a. n.a. n.a. n.a. n.a n.a. n.a. n.a. n.a. n.a. 0.2 n.a. n.a. n.a n.a. n.a. n.a. n.a. n.a n.a n.a n.a. n.a n.a. n.a. 0.0 n.a. n.a. n.a n.a. n.a. n.a. n.a. n.a n.a. n.a. n.a. n.a. 0.0 n.a. n.a. n.a n.a. n.a. n.a. n.a. n.a. n.a n.a. n.a. n.a. n.a. n.a. 0.0 n.a. n.a. n.a. n.a. n.a. n.a. n.a. n.a. n.a. Source: SADC Secretariat Statistics Unit, Trade Database, 19 November 2013 National Statistics Offices of Member States 289
290 Table (contd.) Imports of Selected Agricultural Products and Inputs in SADC, Million US $, Product / Input Year Angola Botswana Democratic Republic of Congo Fruit Cotton Tobacco Fertilizers, manufactured Fungicides, Herbicides, Insecticides Lesotho Madagascar Malawi Mauritius Mozambique Namibia Seychelles South Africa Swaziland United Republic of Tanzania Zambia Zimbabwe SADC - Total n.a n.a n.a. n.a n.a. n.a n.a. n.a. n.a n.a. n.a. n.a. n.a n.a. n.a. n.a. n.a n.a. n.a. n.a n.a. n.a. n.a. n.a. n.a n.a. n.a. n.a. n.a. n.a n.a. n.a. n.a n.a. n.a. n.a. n.a. n.a n.a. n.a n.a. n.a n.a. n.a. n.a 72.5 n.a. n.a. n.a. n.a n.a. n.a. n.a. n.a n.a. n.a. n.a 50.8 n.a. n.a. n.a. n.a. n.a n.a. n.a. n.a. n.a n.a. n.a. n.a n.a. n.a. n.a. n.a. n.a n.a n.a. n.a n.a. n.a. 0.0 n.a. n.a. n.a 96.3 n.a. n.a. n.a. n.a n.a. n.a. n.a. n.a. 0.0 n.a. n.a. n.a n.a. n.a. n.a. n.a. n.a n.a. n.a. n.a. n.a. 0.0 n.a. n.a. n.a n.a. n.a. n.a. n.a. n.a n.a n.a. 3.2 n.a n.a n.a n.a n.a n.a. 3.1 n.a n.a n.a. n.a n.a n.a. n.a. n.a n.a. n.a n.a. n.a n.a. n.a. n.a n.a. n.a. n.a n.a. n.a n.a. n.a. n.a n.a. n.a. n.a n.a. n.a. n.a. n.a. n.a n.a. n.a. n.a n.a n.a. n.a n.a. n.a n.a. n.a. 0.0 n.a. n.a. n.a. n.a. n.a n.a. n.a. n.a. n.a n.a. n.a. 0.0 n.a. n.a. n.a. n.a. n.a. n.a n.a. n.a. n.a. n.a n.a. n.a. 0.0 n.a. n.a. n.a. n.a. n.a. n.a. Source: SADC Secretariat Statistics Unit, Trade Database, 19 November 2013 National Statistics Offices of Member States 290
291 Table Livestock Population in SADC, Number, Year Livestock Type Angola Botswana Democratic Republic of Congo Lesotho Madagascar Malawi Mauritius Mozambique Namibia Seychelles South Africa Swaziland United Republic of Tanzania Zambia Zimbabwe SADC - Total Cattle Pigs Sheep n.a Goats Cattle Pigs Sheep n.a Goats Cattle Pigs Sheep n.a Goats Cattle Pigs Sheep n.a Goats Cattle Pigs Sheep n.a Goats Cattle Pigs Sheep n.a Goats Cattle Pigs Sheep n.a Goats Cattle Pigs Sheep n.a Goats Cattle n.a n.a n.a n.a. n.a n.a Pigs n.a n.a n.a n.a. n.a n.a Sheep n.a n.a n.a n.a. n.a n.a Goats n.a n.a n.a n.a. n.a n.a Cattle n.a n.a n.a n.a n.a n.a Pigs n.a n.a n.a n.a n.a n.a Sheep n.a n.a n.a n.a n.a. n.a n.a Goats n.a n.a n.a n.a n.a n.a Source: FAOSTAT 2014, Downloaded: 13 October 2014: Angola ( ), Botswana (2013); Democratic Republic of Congo ( ), Madagascar ( ), Mozambique ( ), Namibia (2011; 2013), Seychelles ( ), Swaziland (2011), United Republic of Tanzania (2011; 2013), Zambia ( ), Zimbabwe ( ) SADC Secretariat AIMS Database, Directorate of Food, Agriculture and Natural Resources (FANR): Angola (2008 Goats only; ); Democratic Republic of Congo ( ); Madagascar ( ); Mozambique ( for Cattle, sheep & Goats, for Cattle & Sheep); Namibia ( ); Zambia ( ), Zimbabwe (2000, for Cattle), 2001 for all types) Table 32, United Nations Statistical Yearbook 2009 (fifty fourth issue): Mozambique ( for pigs, for all livestock types, for pigs + goats), Namibia ( ), Zimbabwe ( for pigs, sheep & goats) United Nations Statistics Division - UNData, Food and Agriculture Organisation (FAO) - Angola (2000), Democratic Republic of Congo (2000, ), Madagascar (2000, ), Mozambique (2000, ), Namibia ( ), Zambia (2000, ), Zimbabwe ( ) National Statistics Offices of Member States 291
292 Table Livestock and Poultry Meat Production in SADC, Thousand Tonne, Year Animal Type Livestock Poultry Livestock Poultry Livestock Poultry Livestock Poultry Meat Type Angola Botswana Democratic Republic of Congo Lesotho Madagascar Malawi Mauritius Mozambique Namibia Seychelles South Africa Swaziland United Republic of Tanzania Zambia Zimbabwe SADC Total Beef and veal Pig/swine meat (pork) Mutton and lamb meat Goat meat Chicken meat Duck meat Beef and veal Pig/swine meat (pork) Mutton and lamb meat Goat meat Chicken meat Duck meat Beef and veal Pig/swine meat (pork) Mutton and lamb meat Goat meat Chicken meat Duck meat Beef and veal Pig/swine meat (pork) Mutton and lamb meat Goat meat Chicken meat Duck meat Source: FAO, downloaded 13 October 2014; 30 November 2015 National Statistics Offices of Member States 292
293 Table (contd.) Livestock and Poultry Meat Production in SADC, Thousand Tonne, Year Animal Type Livestock Poultry Livestock Poultry Livestock Poultry Livestock Poultry Livestock Poultry Meat Type Angola Botswana Democratic Republic of Congo Lesotho Madagascar Malawi Mauritius Mozambique Namibia Seychelles South Africa Swaziland United Republic of Tanzania Zambia Zimbabwe SADC Total Beef and veal Pig/swine meat (pork) Mutton and lamb meat Goat meat Chicken meat Duck meat Beef and veal Pig/swine meat (pork) Mutton and lamb meat n.a Goat meat n.a Chicken meat Duck meat n.a. n.a n.a Beef and veal Pig/swine meat (pork) Mutton and lamb meat n.a. n.a n.a Goat meat n.a. n.a Chicken meat Duck meat n.a. n.a. n.a. n.a n.a. n.a. n.a. n.a. 0.0 n.a. n.a. 2.0 n.a Beef and veal n.a n.a. n.a. n.a. n.a n.a. n.a n.a n.a Pig/swine meat (pork) n.a. 1.3 n.a. n.a. n.a. n.a n.a. n.a n.a n.a. n.a Mutton and lamb meat n.a. 2.5 n.a. n.a. n.a. n.a. n.a. n.a. n.a. n.a n.a n.a. n.a Goat meat n.a. 6.8 n.a. n.a. n.a. n.a. n.a. n.a. n.a. n.a n.a n.a. n.a Chicken meat n.a. 7.5 n.a. n.a. n.a. n.a n.a. n.a n.a n.a Duck meat n.a. 0.0 n.a. n.a. n.a. n.a. n.a. n.a. n.a. n.a. n.a. n.a. 2.0 n.a. n.a. 2.0 Beef and veal n.a n.a. n.a. n.a. n.a n.a. n.a n.a n.a Pig/swine meat (pork) n.a. 1.7 n.a. n.a. n.a. n.a n.a. n.a n.a n.a. n.a Mutton and lamb meat n.a. 2.8 n.a. n.a. n.a. n.a. n.a. n.a. n.a. n.a n.a n.a. n.a Goat meat n.a. 7.4 n.a. n.a. n.a. n.a. n.a. n.a. n.a. n.a n.a n.a. n.a Chicken meat n.a. 8.2 n.a. n.a. n.a. n.a n.a. n.a n.a n.a Duck meat n.a. 0.0 n.a. n.a. n.a. n.a. n.a. n.a. n.a. n.a. n.a. n.a. 2.0 n.a. n.a. 2.0 Source: FAO, downloaded 13 October 2014; 30 November 2015 National Statistics Offices of Member States 293
294 Table Fish Production in SADC, Freshwater and Marine Catch, Tonne, Country Angola n.a. Botswana n.a. Democratic Republic of Congo n.a. Lesotho n.a. Madagascar n.a. Malawi Mauritius Mozambique Namibia n.a. Seychelles South Africa n.a. Swaziland n.a. United Republic of Tanzania Zambia Zimbabwe SADC - Total n.a. Source: downloaded 21 November 2013: Angola, Botswana ( , ), Democratic Republic of Congo, Lesotho, Madagascar, Malawi ( ), Mauritius ( ), Mozambique, Namibia, Seychelles ( , South Africa, Swaziland, United Republic of Tanzania, Zambia, Zimbabwe World Band, World Development Indicators, downloaded: 20 September 2016: Data for 2012 to 2014 (Angola, Botswana, Democratic Republic of Congo, Madagascar, Mozambique, Namibia); Data for 2012 (Zambia, Zimbabwe) National Statistics Offices of Member States 294
295 8.3.2 FOOD SECURITY 295
296 Table Consumer Price Index (CPI) for Food in SADC, (Base Year 2000 = 100), Country Angola, Luanda n.a. n.a n.a. n.a. n.a. Botswana Democratic Republic of Congo n.a. n.a. n.a. n.a n.a. Lesotho n.a. n.a. n.a n.a. Madagascar n.a. n.a n.a Malawi Mauritius Mozambique n.a. n.a. n.a n.a. Namibia n.a n.a. Seychelles South Africa n.a. n.a n.a. Swaziland n.a United Republic of Tanzania Zambia Zimbabwe Source: Food and Agriculture Organisation (FAO): Downloaded 22 November 2013: Angola ( ), Botswana ( ), Madagascar ( ), Malawi (2012), Mozambique (2011), Namibia ( ), Seychelles ( ), South Africa ( ), United Republic of Tanzania (2012), Zambia ( ) Food and Agriculture Organisation (FAO): Downloaded 2012: Angola, Democratic Republic of Congo, Madagascar ( ), Mozambique ( ), South Africa ( ), Zambia ( ), Zimbabwe National Statistics Offices of Member States 296
297 8.3.3 FORESTRY 297
298 Table Total Forest Area in SADC, '000 Ha, Country Total Forest Area, 000 Ha Angola Botswana Democratic Republic of Congo Lesotho Madagascar Malawi Mauritius Mozambique Namibia Seychelles South Africa Swaziland United Republic of Tanzania Zambia Zimbabwe SADC TOTAL Source: Food and Agriculture Organisation (FAO): downloaded 19 November 2013 National Statistics Offices of Member States Note: 1 sq. km = 100 ha 298
299 Table Annual Change Rate in Total Forestry Area in SADC, '000 Ha Per Year, Country Angola Botswana Democratic Republic of Congo Lesotho Madagascar Malawi Mauritius Mozambique Namibia Seychelles South Africa Swaziland United Republic of Tanzania Zambia Zimbabwe SADC TOTAL Source: Derived from Table
300 Table Total Land Area in SADC, '000 Ha, Country Total Land Area, '000 Ha Angola Botswana Democratic Republic of Congo Lesotho Madagascar Malawi Mauritius Mozambique Namibia Seychelles South Africa Swaziland United Republic of Tanzania Zambia Zimbabwe SADC TOTAL Source: Data from Table Note: 1 sq. km = 100 ha 300
301 Table Forest Area as a Percentage of Land Area in SADC, '000 Ha, Country Forest Area as a Percentage of Land Area, (%) Angola Botswana Democratic Republic of Congo Lesotho Madagascar Malawi Mauritius Mozambique Namibia Seychelles South Africa Swaziland United Republic of Tanzania Zambia Zimbabwe SADC TOTAL Source: Derived from Tables and
302 Table Exports and Imports of Wood Related Forestry Products in SADC, Million US $, Year Exports / Imports Angola Botswana Democratic Republic of Congo Lesotho Madagascar Malawi Mauritius Mozambique Namibia Seychelles South Africa Swaziland United Republic of Tanzania Zambia Zimbabwe SADC - Total Exports Imports Exports Imports Exports Imports Exports Imports Exports Imports Exports Imports Exports Imports Exports n.a. n.a. n.a. n.a. 1.0 n.a. n.a. n.a. n.a n.a. n.a n.a. Imports n.a. n.a. n.a. n.a n.a. n.a. n.a. n.a n.a. n.a n.a. Exports n.a. n.a n.a. n.a. 1.1 n.a. n.a. n.a. n.a n.a. n.a. 0.0 n.a. Imports n.a. n.a. n.a. n.a n.a. n.a. n.a. n.a n.a. n.a. 0.0 n.a. Exports n.a. n.a n.a. n.a. n.a. n.a. n.a. n.a. n.a. 0.2 n.a. Imports n.a. n.a. n.a n.a. n.a. n.a. n.a. n.a. n.a. n.a. 0.5 n.a. Source: SADC Secretariat Statistics Unit, Trade Database, 20 November 2013 National Statistics Offices of Member States 302
303 Table Exports and Imports of Non-Wood Forestry Products in SADC, Million US $, Year Exports /Imports Angola Botswana Democratic Republic of Congo Lesotho Madagascar Malawi Mauritius Mozambique Namibia Seychelles South Africa Swaziland United Republic of Tanzania Zambia Zimbabwe SADC - Total Exports Imports Exports Imports Exports Imports Exports Imports Exports Imports Exports Imports Exports Imports Exports n.a. 0.3 n.a. n.a. n.a. n.a. 4.1 n.a. n.a. n.a. n.a. n.a. n.a. n.a. n.a. n.a. Imports n.a. n.a. n.a. n.a n.a. n.a. n.a. n.a. n.a. n.a. n.a. n.a. n.a. Exports n.a. 9.9 n.a. n.a. n.a. n.a. 4.8 n.a. n.a. n.a. n.a. n.a. n.a. n.a. n.a. n.a. Imports n.a. n.a. n.a. n.a n.a. n.a. n.a. n.a. n.a. n.a. n.a. n.a. n.a. Exports n.a. 9.6 n.a. n.a. n.a n.a. n.a. n.a. n.a. n.a. n.a. n.a. n.a. n.a. n.a. n.a. Imports n.a. n.a. n.a n.a. n.a. n.a. n.a. n.a. n.a. n.a. n.a. n.a. n.a. n.a. Source: SADC Secretariat Statistics Unit, Trade Database, 20 November 2013 National Statistics Offices of Member States 303
304 Table Exports and Imports of Wood and Non-Wood Forestry Products in SADC, Million US $, Year Exports /Imports Angola Botswana Democratic Republic of Congo Lesotho Madagascar Malawi Mauritius Mozambique Namibia Seychelles South Africa Swaziland United Republic of Tanzania Zambia Zimbabwe SADC - Total Exports Imports Exports Imports Exports Imports Exports Imports Exports Imports Exports Imports Exports Imports Exports n.a. 3.6 n.a. n.a. n.a. n.a. 5.1 n.a. n.a. n.a. n.a n.a. n.a. n.a Imports n.a. n.a. n.a. n.a n.a. n.a. n.a. n.a n.a. n.a. n.a Exports n.a. 3.2 n.a. n.a. n.a. n.a. 5.9 n.a. n.a. n.a. n.a n.a. n.a. n.a. n.a. Imports n.a. n.a. n.a. n.a n.a. n.a. n.a. n.a n.a. n.a. n.a. n.a. Exports n.a. 3.8 n.a. n.a. n.a n.a. n.a. n.a. n.a. n.a. n.a. n.a. n.a. n.a. n.a. n.a. Imports n.a. n.a. n.a n.a. n.a. n.a. n.a. n.a. n.a. n.a. n.a. n.a. n.a. n.a. Source: SADC Secretariat Statistics Unit, Trade Database, 20 November 2013 National Statistics Offices of Member States 304
305 8.4 MINING AND QUARRYING 305
306 Table Mining Production in SADC, Country Minerals Unit of measurement Diamond 000`s Carat Angola Crude Oil Metric Tonne Liquefied Petroleum Gas (Metric Tonne n.a Natural Gas Million c.c n.a n.a n.a n.a n.a n.a Nickel Contained Metal (T) Copper Contained Metal (T) Cobalt Contained Metal (T) Botswana Matte Tonnes Gold Kg Diamond 000`s Carat Coal Tonnes Soda Ash Tonnes Diamond (artisanal) 000`s Carat Diamond (industrial) 000`s Carat Cassitérite t.m Coltan t.m DRC Wolframite t.m Cuivre t.m Cobalt t.m Zinc t.m Or brut Kg Crude Oil brls Lesotho Diamond 000`s Carat Gold kg n.a. n.a. n.a. Madagascar Chrome Metric Tonne Ilménite Metric Tonne Coal Tonnes Cement Tonnes Limestone Tonnes Malawi Gemistones Tonnes Quarry Stone Tonnes Phosphate Tonnes Uranium Concentrates Tonnes n.a. Bauxite Metric Tonne Mozambique Aluminium Metric Tonne Coal Tonnes (000`s) Natural Gas terajoule (000`s) Uranium short torns n.a n.a Copper Tonne metal content n.a n.a Zinc Tonne metal contained n.a n.a Namibia Gold kilogram metal content n.a n.a Diamond Carat n.a n.a Manganese Tonnes metal content n.a n.a Lead Tonnes concentrate n.a n.a 306
307 Table Mining Production in SADC (cont ), Country Minerals Unit of measurement Diamond 000`s Carat Gold 1000 kg Platinium Group Metals 1000 kg Silver 1000 kg Chromite kt Cobalt 1000 kg Copper kt South Africa Iron ore kt Lead Concentrate kt Manganese ore kt Nickel kt Uranium oxide 1000 kg Zinc kt Coal kt Natural Gas kt Crude Petroleum 1 000bbl Swaziland Iron Ore Metric tons (000`s) Coal Metric tons (000`s) Diamond 000s Carat Gold Kgs Gemstone Tons Salt 000 Tons Gypsum 000 Tons Tanzania Limestone Tons Pozzolana Tons Coal 000 Tons Tanzanite Kilogram Phosphate Tonnes Copper 000 Pounds Copper 000 Tons Zambia Cobalt 000 Tons Gold Kg Coal Tonnes Asbestos t Chrome t Coal t Cobalt t Copper t Gold kg Zimbabwe Graphite t Nickel t Palladium kg Phosphate t Platinum kg Rhodium kg Rhuthenium kg Source: National Statistical Offices of Member States, November
308 8.5 ENERGY AND WATER 308
309 8.5.1 ENERGY 309
310 Table Energy production in SADC, kt of oil equivalent, Country kt of oil equivalent Angola Botswana n.a Democratic Republic of Congo n.a. n.a. n.a. n.a. n.a. Lesotho n.a. n.a. n.a. n.a. n.a. n.a. n.a. n.a. n.a. n.a. Madagascar n.a. n.a. n.a. n.a. n.a. n.a. n.a. n.a. n.a. n.a. Malawi n.a. n.a. n.a. n.a. n.a. n.a. n.a. n.a. n.a. n.a. Mauritius Mozambique n.a. n.a. n.a. n.a. n.a. Namibia n.a. n.a. n.a. n.a. n.a. Seychelles South Africa n.a. n.a. n.a. Swaziland United Republic of Tanzania n.a. n.a. n.a. n.a. n.a. Zambia n.a. n.a. n.a. n.a. n.a. Zimbabwe n.a. n.a. n.a. n.a. n.a. Source: World Development Indicators & Global Development Finance, The World Bank, UNData - Energy Statistics Database, National Statistics Offices of Member States Definitions: Energy production - Refers to forms of primary energy--petroleum (crude oil, natural gas liquids, and oil from nonconventional sources), natural gas, solid fuels (coal, lignite, and other derived fuels), and combustible renewables and waste--and primary electricity, all converted into oil equivalents. 310
311 Table Total Electricity Production in SADC, Million Kilowatt-Hour, Country Million Kilowatt-Hour Angola Botswana Democratic Republic of Congo n.a. Lesotho n.a. Madagacsar Malawi n.a. Mauritius Mozambique n.a n.a. Namibia n.a. n.a. n.a. n.a n.a. Seychelles South Africa n.a. n.a n.a. Swaziland n.a. United Republic of Tanzania n.a. n.a. n.a. Zambia Zimbabwe Source: UNData - Energy Statistics Database, National Statistics Offices of Member States Notes: Total electricity production = total production by public providers + total by self producers Producers of different types of electricity - public producers and self producers Data for self producers are estimates as per data source notes: Madagascar ( ); Malawi ( ); United Republic of Tanzania ( ) Data for both public and self producers are estimates as per data source notes: Malawi ( ; ) 311
312 Table Total Net Installed Capacity of Electricity Power Plants in SADC, Thousand Kilowatt, Country Angola n.a. n.a. Botswana Democratic Republic of Congo n.a. n.a. Lesotho Madagacsar Malawi n.a. n.a. Mauritius Mozambique n.a. n.a. Namibia n.a. n.a. Seychelles n.a. n.a. South Africa n.a. n.a. Swaziland n.a. n.a. United Republic of Tanzania n.a. n.a. Zambia Zimbabwe Source: UNData - Energy Statistics Database, downloaded: 2 August 2016: Data for Angola, Democrating Republic of Congo, Mozambique, Namibia, Seychelles National Statistics Offices of Member States Definitions: Installed electricity capacity is the electricity production capacity of a particular facility. It is usually expressed in Megawatts (or sometimes even Gigawatts) and can come from hydraulic, nuclear, thermal, solar or wind power. 312
313 Table Energy use (kg of oil equivalent) in SADC per $1 000 GDP (constant 2005 PPP), Thousand Barrels of Oil Equivalent Country Angola n.a. n.a. n.a. n.a. n.a. Botswana Democratic Republic of Congo n.a. n.a. n.a. n.a. n.a. Lesotho n.a. n.a. n.a. n.a. n.a. n.a. n.a. n.a. Madagascar n.a. n.a. n.a. n.a. n.a. n.a. n.a. n.a. n.a. n.a. Malawi n.a. n.a. n.a. n.a. n.a. n.a. n.a. n.a. n.a. n.a. Mauritius n.a n.a. n.a. Mozambique n.a. n.a. n.a. n.a. n.a. Namibia n.a. n.a. n.a. n.a. n.a. Seychelles n.a. n.a. n.a. n.a. n.a. n.a. n.a. n.a. South Africa n.a. n.a. n.a. Swaziland n.a. n.a. n.a. n.a. n.a. n.a. n.a. n.a. United Republic of Tanzania n.a. n.a. n.a. n.a. n.a. Zambia n.a. n.a. n.a. n.a. n.a. Zimbabwe n.a. n.a. n.a. n.a. n.a. n.a. n.a. n.a. n.a. n.a. Source: World Development Indicators & Global Development Finance, The World Bank, UNData - Energy Statistics Database, National Statistics Offices of Member States Definitions Energy use per PPP GDP is the kilogram of oil equivalent of energy use per constant PPP GDP. Energy use refers to use of primary energy before transformation to other end-use fuels, which is equal to indigenous production plus imports and stock changes, minus exports and fuels supplied to ships and aircraft engaged in international transport. PPP GDP is gross domestic product converted to 2005 constant international dollars using purchasing power parity rates. An international dollar has the same purchasing power over GDP as a U.S. dollar has in the United States. ENERGY USE PER UNIT OF GDP (ENERGY INTENSITY) (a) Name: Energy Use per unit of GDP. (b) Brief Definition: Ratio of total energy use to GDP. (c) Unit of Measurement: Megajoules (mj) per $. (d) Placement in the CSD Indicator Set: Economic/Consumption and Production Patterns/ Energy Use. 2. POLICY RELEVANCE (a) Purpose: Trends in overall energy use relative to GDP indicate the general relationship of energy consumption to economic development and provide a rough basis for projecting energy consumption and its environmental impacts with economic growth. For energy policy - making, however, sectoral or sub-sectoral energy intensities should be used. (b) Relevance to Sustainable/Unsustainable Development (theme/sub-theme): Energy is essential for economic and social development, but consumption of fossil fuels is the major cause of air pollution and climate change. Improving energy efficiency and delinking economic development from energy consumption, particularly of fossil fuels, is essential to sustainable development. (c) The ratio of energy use to GDP indicates the total energy being used to support economic and social activity. It represents an aggregate of energy consumption resulting from a wide range of production and consumption activities. In specific economic sectors and sub-sectors, the ratio of energy use to output or activity is the energy intensity (if the output is measured in economic units) or the specific energy requirement (if the output is measured in physical units such as tonnes or passenger-kilometers). 313
314 Table GDP per unit of energy use (constant 2005 PPP $ per kg of oil equivalent) in SADC, Country Constant 2005 PPP $ pr kg of oil equivalent Angola n.a. n.a. n.a. n.a. Botswana Democratic Republic of Congo n.a. n.a. n.a. n.a. Lesotho n.a. n.a. n.a. n.a. n.a. n.a. n.a. n.a Madagascar n.a. n.a. n.a. n.a. n.a. n.a. n.a. n.a. n.a. n.a Malawi n.a. n.a. n.a. n.a. n.a. n.a. n.a. n.a. n.a. n.a Mauritius n.a. n.a. n.a. n.a. n.a. n.a. n.a. n.a. n.a. n.a. Mozambique n.a. n.a. n.a. n.a. Namibia n.a. n.a. n.a. n.a. Seychelles n.a. n.a. n.a. n.a. n.a. n.a. n.a. n.a. South Africa n.a. n.a. n.a. Swaziland n.a. n.a. n.a. n.a. n.a. n.a. n.a. n.a. United Republic of Tanzania n.a. n.a. n.a. n.a. Zambia n.a. n.a. n.a. n.a. Zimbabwe n.a. n.a. n.a. n.a. n.a. n.a. n.a. n.a. n.a. n.a. Source: World Development Indicators & Global Development Finance, The World Bank, UNData - Energy Statistics Database, National Statistics Offices of Member States Definitions: GDP per unit of energy use is the PPP GDP per kilogram of oil equivalent of energy use. PPP GDP is gross domestic product converted to 2005 constant international dollars using purchasing power parity rates. An international dollar has the same purchasing power over GDP as a U.S. dollar has in the United States. 314
315 Table Energy Consumption in SADC, Total and Per Capita, by Source of Commercial Energy, Total Primary Energy Consupmtion, Kt of Oil Equivalent Solids Country Thousand Metric Ton of Oil Equivalent Angola n.a. n.a. n.a. n.a. n.a. n.a. n.a. Botswana n.a. n.a. n.a. n.a. n.a. n.a n.a. n.a. n.a. n.a. n.a. n.a. Democratic Republic of Congo n.a. n.a. n.a. n.a. n.a. n.a n.a. n.a. n.a. n.a. n.a. n.a. Lesotho n.a. n.a. n.a. n.a. n.a. n.a. n.a. n.a. n.a. n.a. n.a. n.a. n.a. n.a. n.a. n.a. Madagascar n.a. n.a. n.a. n.a. n.a. n.a n.a. n.a. n.a. n.a. n.a. n.a. Malawi n.a. n.a. n.a. n.a. n.a. n.a. *41 *43 *36 *34 n.a. n.a. n.a. n.a. n.a. n.a. Mauritius* Mozambique n.a. n.a. n.a. n.a. n.a. n.a n.a. n.a. n.a. n.a. n.a. n.a. Namibia n.a. n.a. n.a. n.a. n.a. n.a n.a. n.a. n.a. n.a. n.a. n.a. Seychelles n.a. n.a. n.a. n.a. n.a. n.a. n.a. n.a. South Africa n.a. n.a. n.a n.a. n.a. n.a. Swaziland *406 *424 *435 *419 n.a. n.a. n.a. n.a. n.a. n.a. *102 *106 *108 *96 n.a. n.a. n.a. n.a. n.a. n.a. United Republic of Tanzania n.a. n.a. n.a. n.a. n.a. n.a n.a. n.a. n.a. n.a. n.a. n.a Zambia n.a. n.a. n.a. n.a. n.a. n.a n.a. n.a. n.a. n.a. n.a. n.a. Zimbabwe n.a. n.a. n.a. n.a. n.a. n.a n.a. n.a. n.a. n.a. n.a. n.a. Table (contd.) Energy Consumption in SADC, Total and Per Capita, by Source of Commercial Energy, Liquids Gas Country Thousand Metric Ton of Oil Equivalent Angola n.a. n.a. n.a. n.a. n.a. n.a n.a. n.a. n.a. n.a. n.a. n.a. Botswana n.a. n.a. n.a. n.a. n.a. n.a. Democratic Republic of Congo n.a. n.a. n.a. n.a. n.a. n.a n.a. n.a. n.a. n.a. n.a n.a. Lesotho n.a. n.a. n.a. n.a. n.a. n.a. n.a. n.a. n.a. n.a. n.a. n.a. n.a. n.a. n.a. n.a. n.a. n.a. n.a n.a. Madagascar n.a. n.a. n.a. n.a. n.a. n.a. Malawi n.a. n.a. n.a. n.a. n.a. n.a. Mauritius* Mozambique n.a. n.a. n.a. n.a. n.a. n.a n.a. n.a. n.a. n.a. n.a. n.a. Namibia n.a. n.a. n.a. n.a. n.a. n.a. Seychelles n.a. n.a. n.a. n.a. n.a. n.a. South Africa n.a. n.a. n.a n.a. n.a. n.a. Swaziland *213 *222 *229 *223 n.a. n.a. n.a. n.a. n.a. n.a. United Republic of Tanzania n.a. n.a. n.a. n.a. n.a. n.a n.a. n.a. n.a. n.a. n.a. n.a Zambia n.a. n.a. n.a. n.a. n.a. n.a. Zimbabwe n.a. n.a. n.a. n.a. n.a. n.a. Sources: UNSD - Statistical Yearbook, 50th Issue (* ), 53rd Issue, 56th issue (2006 data revised) National Statistics Offices of Member States 315
316 Table (contd.) Energy Consumption in SADC, Total and Per Capita, by Source of Commercial Energy, Electricity Energy Consumption Per Capita Country Thousand Metric Ton of Oil Equivalent Kilogram Angola n.a. n.a. n.a. n.a. n.a. n.a n.a. n.a. n.a. n.a. n.a. n.a. Botswana n.a. n.a. n.a. n.a. n.a. n.a n.a. n.a. n.a. n.a. n.a. n.a. Democratic Republic of Congo n.a. n.a. n.a. n.a. n.a. n.a n.a. n.a. n.a. n.a. n.a. n.a. Lesotho n.a. n.a. n.a. n.a. n.a. n.a n.a. n.a. n.a. n.a. n.a. n.a. Madagascar n.a. n.a. n.a. n.a. n.a. n.a n.a. n.a. n.a. n.a. n.a. n.a. Malawi n.a n.a. n.a. n.a. n.a. n.a. n.a. Mauritius* Mozambique n.a. n.a. n.a. n.a. n.a. n.a n.a. n.a. n.a. n.a. n.a. n.a. Namibia n.a. n.a. n.a. n.a. n.a. n.a n.a. n.a. n.a. n.a. n.a. n.a. Seychelles n.a. n.a. n.a. n.a. n.a. n.a n.a. n.a. n.a. n.a. n.a. n.a. South Africa n.a. n.a. n.a n.a. n.a. n.a. n.a. n.a. n.a. Swaziland n.a. n.a. n.a. n.a. n.a. n.a. *363 *374 *378 *359 n.a. n.a. n.a. n.a. n.a. n.a. United Republic of Tanzania n.a. n.a. n.a. n.a. n.a. n.a n.a. n.a. n.a. n.a. n.a. n.a. Zambia n.a. n.a. n.a. n.a. n.a. n.a n.a. n.a. n.a. n.a. n.a. n.a. Zimbabwe n.a. n.a. n.a. n.a. n.a. n.a n.a. n.a. n.a. n.a. n.a. n.a. Sources: UNSD - Statistical Yearbook, 50th Issue (* ), 53rd Issue, 56th issue (2006 data revised) National Statistics Offices of Member States 316
317 Table Total Energy Use in SADC, Kt of Oil Equivalent, Country Angola Botswana Democratic Republic of Congo n.a. n.a. n.a. n.a. Lesotho n.a. n.a. n.a. n.a. n.a. n.a. n.a. n.a. Madagascar n.a. n.a. n.a. n.a. n.a. n.a. n.a. n.a. n.a. n.a. Malawi n.a. n.a. n.a. n.a. n.a. n.a. n.a. n.a. n.a. n.a. Mauritius Mozambique n.a. n.a. n.a. n.a. Namibia n.a. n.a. n.a. n.a. Seychelles n.a. n.a. n.a. n.a. n.a. n.a. n.a. n.a. South Africa n.a. n.a. n.a. Swaziland n.a. n.a. n.a United Republic of Tanzania n.a. n.a. n.a. n.a Zambia n.a. n.a. n.a. n.a. Zimbabwe n.a. n.a. n.a. n.a. Source: World Development Indicators & Global Development Finance, The World Bank, National Statistics Offices of Member States Definition: Energy use refers to use of primary energy before transformation to other end-use fuels, which is equal to indigenous production plus imports and stock changes, minus exports and fuels supplied to ships and aircraft engaged in international transport. 317
318 Table Total Energy Use Per Capita in SADC, Kt of Oil Equivalent, Country Angola n.a. n.a. n.a. n.a. Botswana n.a. n.a. n.a. n.a. Democratic Republic of Congo n.a. n.a. n.a. n.a. Lesotho n.a. n.a. n.a. n.a. n.a. n.a. n.a. n.a. Madagascar n.a. n.a. n.a. n.a. n.a. n.a. n.a. n.a. n.a. n.a. Malawi n.a. n.a. n.a. n.a. n.a. n.a. n.a. n.a. n.a. n.a. Mauritius* Mozambique n.a. n.a. n.a. n.a. Namibia n.a. n.a. n.a. n.a. Seychelles n.a. n.a. n.a. n.a. n.a. n.a. n.a. n.a. South Africa n.a. n.a. n.a. Swaziland n.a. n.a. n.a. n.a. n.a. n.a. n.a. n.a. United Republic of Tanzania n.a. n.a. n.a. n.a. Zambia n.a. n.a. n.a. n.a. Zimbabwe n.a. n.a. n.a. n.a. Source: World Development Indicators & Global Development Finance, The World Bank, National Statistics Offices of Member States Definition: Energy use refers to use of primary energy before transformation to other end-use fuels, which is equal to indigenous production plus imports and stock changes, minus exports and fuels supplied to ships and aircraft engaged in international transport. 318
319 Table Percentage of Population in SADC With Access to Electricity, Country Angola 40.2 n.a 34.9 n.a n.a n.a. n.a. Botswana n.a n.a. Democratic Republic of Congo n.a. n.a. n.a. n.a. n.a. Lesotho n.a. n.a. n.a. n.a. n.a. Madagascar n.a n.a. n.a. Malawi n.a. n.a. n.a. n.a. n.a. Mauritius n.a. n.a. n.a. Mozambique n.a. n.a. n.a. n.a. Namibia n.a. n.a. n.a. n.a. n.a. Seychelles 6 (2002) n.a. n.a. n.a. n.a n.a. South Africa n.a. n.a. n.a. Swaziland 7 (2007) n.a n.a n.a. United Republic of Tanzania n.a. n.a. n.a. n.a. n.a. Zambia n.a. n.a. n.a. n.a Zimbabwe n.a. n.a. n.a. n.a. n.a. Source: Energy Access Situation in Developing Countries: A Review Focusing on the Least Developed Countries and Sub-Saharan Africa, World Health Organization and United Nations Development Program, November 2009: National Statistics Offices of Member States Definitions: Access to electricity is measured as the percent of peoole that have a household electricity connectio. The electricity connection may vary by quantity (e.g., hours of availability in a day), quality (e.g., rated voltage and frequency), and use (e.g., light bulb to a wide range of end-users). 319
320 Table Fuels Used in SADC for Cooking and Access to Modern Fuels in SADC, Percent Total Population, Latest Year Country Percent Electricity Gas Kerosene Charcoal Wood Dung Coal Other Access to modern fuels Angola n.a. n.a Botswana n.a Democratic Republic of Congo 4.6 n.a n.a. n.a Lesotho Madagascar n.a. n.a Malawi Mauritius* Mozambique Namibia Seychelles n.a. n.a. n.a. n.a. n.a. n.a. n.a. n.a South Africa n.a Swaziland n.a United Republic of Tanzania Zambia Zimbabwe Year Source: Energy Access Situation in Developing Countries: A Review Focusing on the Least Developed Countries and Sub-Saharan Africa, World Health Organization and United Nations Development Program, November 2009: National Statistics Offices of Member States Definitions Access to modern fuels is measured as the percent of people that use electricity, liquid fuels, or gaseous fuels as their primary fuel to satisfy their cooking needs. These fuels include liquified petroleum gas (LPG), natural gas, kerosene (including paraffin), thanol, and biofuels, but exclude all traditional biomass (e.g., firewood, charcoal, dung, and crop residues)and coal (including coal dust and lignite) 320
321 Table Consumer Price Indices in SADC for Energy, Country Percent Angola Botswana n.a. n.a. n.a. n.a. n.a. Democratic Republic of Congo n.a. n.a. n.a. n.a. n.a. n.a. n.a. n.a. n.a. n.a. Lesotho n.a. n.a. n.a. Madagascar n.a. n.a. n.a. n.a. n.a. n.a. n.a. n.a. n.a. n.a. Malawi n.a. n.a. n.a. n.a. n.a. n.a. n.a. n.a. n.a. n.a. Mauritius Mozambique n.a. n.a. Namibia n.a. n.a. n.a. n.a. n.a. n.a. n.a. n.a. n.a. n.a. Seychelles n.a. n.a. n.a. South Africa n.a. n.a. n.a. South Africa n.a. n.a n.a. n.a. n.a. Swaziland n.a. n.a. United Republic of Tanzania n.a. n.a. n.a. Zambia n.a. n.a. n.a Zimbabwe Source: National Statistics Offices of Member States Notes: Angola: December 2010=100 Botswana: September 2006=100 Lesotho: April 1997 =100 Mauritius : 2000=100 Mozambique: 2004=100 Seychelles: July 2007 = 100 South Africa: CPI for Energy, refence year = 2000 and 2008, Energy includes electricity and household fuels Tanzania: From ; Base: DEC2001=100 and From 2010, Base: October 2009=100); Componets for energey from include Electricity,Kerosene and Charcoal while for 2010 includes Energy and Fuels - combining electricity and other fuels for use at home with petrol and diesel Zimbabwe: Before 2009, base is 2001=100. From : Base December 2012=100, Energy includes electricity, gas and other fuels 321
322 Table Electricity Tariffs in SADC by Type of Customer, US $, Type of Customer Domestic Commercial Country US $ Angola Botswana n.a. n.a. n.a. n.a. n.a. n.a Democratic Republic of Congo n.a. n.a. n.a. n.a. n.a. n.a. n.a. n.a. n.a. n.a. Lesotho (HV) n.a. n.a. n.a. n.a. n.a. n.a. n.a. n.a. n.a. n.a. Lesotho Madagascar n.a. n.a. n.a. n.a. n.a. n.a. n.a. n.a n.a. Malawi n.a. n.a. n.a. n.a. n.a. n.a. n.a. n.a. n.a. n.a. Mauritius Mozambique n.a. n.a. Namibia n.a. n.a. n.a. n.a. n.a. n.a. n.a. n.a. n.a. n.a. Seychelles n.a. n.a. n.a. South Africa - Basic charge/month n.a. n.a. n.a. n.a n.a. n.a. n.a. South Afriica - 0<500kWh n.a. n.a. n.a. n.a n.a. n.a. n.a. South Afriica - 500<1000kWh n.a. n.a. n.a. n.a n.a. n.a. n.a. South Afriica <2000kWh n.a. n.a. n.a. n.a n.a. n.a. n.a. South Afriica <3000kWh n.a. n.a. n.a. n.a n.a. n.a. n.a. South Afriica - >3000kWh n.a. n.a. n.a. n.a n.a. n.a. n.a. Swaziland United Republic of Tanzania n.a. n.a. n.a. n.a. n.a. Zambia n.a. n.a. n.a. n.a Zimbabwe n.a. Angola Botswana n.a. n.a. n.a. n.a. n.a. n.a. n.a. n.a. n.a. n.a. Democratic Republic of Congo n.a. n.a. n.a. n.a. n.a. n.a. n.a. n.a. n.a. n.a. Lesotho n.a. n.a. n.a. n.a. n.a. n.a. n.a. n.a. n.a Madagascar n.a. n.a. n.a. n.a. n.a. n.a. n.a. n.a. n.a. n.a. Malawi n.a. n.a. n.a. n.a. n.a. n.a. n.a. n.a. n.a. n.a. Mauritius Mozambique n.a. n.a. Namibia n.a. n.a. n.a. n.a. n.a. Seychelles n.a. n.a. n.a. South Africa - Basic charge/month <50kVA n.a. n.a. n.a. n.a n.a. n.a. n.a. South Africa - Basic charge/month <50kVA n.a. n.a. n.a. n.a n.a. n.a. n.a. South Africa - Basic charge/month <50kVA n.a. n.a. n.a. n.a n.a. n.a. n.a. South Africa - Basic charge/month <50kVA n.a. n.a. n.a. n.a n.a. n.a. n.a. South Africa - Summer 0<500kWh n.a. n.a. n.a. n.a n.a. n.a. n.a. South Africa - Summer 500<1000kWh n.a. n.a. n.a. n.a n.a. n.a. n.a. South Africa - Summer 1000<2000kWh n.a. n.a. n.a. n.a n.a. n.a. n.a. South Africa - Summer 2000<3000kWh n.a. n.a. n.a. n.a n.a. n.a. n.a. South Africa - Summer >3000kWh n.a. n.a. n.a. n.a n.a. n.a. n.a. South Africa - Winter 0<500kWh n.a. n.a. n.a. n.a n.a. n.a. n.a. South Africa - Winter 500<1000kWh n.a. n.a. n.a. n.a n.a. n.a. n.a. South Africa - Winter 1000<2000kWh n.a. n.a. n.a. n.a n.a. n.a. n.a. South Africa - Winter 2000<3000kWh n.a. n.a. n.a. n.a n.a. n.a. n.a. South Africa - Winter >3000kWh n.a. n.a. n.a. n.a n.a. n.a. n.a. Swaziland United Republic of Tanzania n.a. n.a. n.a. n.a. n.a. n.a. n.a. n.a. n.a. n.a. Zambia n.a. n.a. n.a. n.a Zimbabwe n.a. Source: National Statistics Offices of Member States Notes: Angola: The price of electricity in the national currency has not changed during these years. The different prices in dollars are results of exchange rate variation South Africa : The electricity tariffs are the approved tariffs from the National energy regulator of SA (NERSA) for the most representative municipality - Rand Values; Data was submitted in Rands by Statssa, converted to US$ using the average exchange rates for the relevant year Zimbabwe: In 2006 Zim dollar was revalued, that s why the prices before 2006 appear as though they are higher than from ; Zimbabwe experinced hyperinflation from
323 Table (contd.) Electricity Tariffs in SADC by Type of Customer, US $, Type of Customer Medium Industrial Large Industrial Street lighting Country US $ Angola Botswana n.a. n.a. n.a. n.a. n.a. n.a Democratic Republic of Congo n.a. n.a. n.a. n.a. n.a. n.a. n.a. n.a. n.a. n.a. Lesotho (LV) Madagascar n.a. n.a. n.a. n.a. n.a. n.a. n.a. n.a. n.a. n.a. Malawi n.a. n.a. n.a. n.a. n.a. n.a. n.a. n.a. n.a. n.a. Mauritius n.a. n.a. n.a. n.a. n.a. n.a. n.a. n.a. n.a. n.a. Mozambique n.a. n.a. Namibia n.a. n.a. n.a. n.a. n.a. Seychelles n.a. n.a. n.a. n.a. n.a. n.a. n.a. n.a. n.a. n.a. South Africa - Basic charge n.a. n.a. n.a. n.a n.a. n.a. n.a. South Africa - Summer/kWh n.a. n.a. n.a. n.a n.a. n.a. n.a. South Africa - Winter/kWh n.a. n.a. n.a. n.a n.a. n.a. n.a. Swaziland United Republic of Tanzania n.a. n.a. n.a. n.a. n.a. n.a. n.a. n.a. n.a. n.a. Zambia n.a. n.a. n.a. n.a Zimbabwe n.a. n.a. n.a. n.a. n.a. n.a. n.a. n.a. n.a. n.a. Angola Botswana n.a. n.a. n.a. n.a. n.a. n.a Democratic Republic of Congo n.a. n.a. n.a. n.a. n.a. n.a. n.a. n.a. n.a. n.a. Lesotho (MV) Madagascar n.a. n.a. n.a. n.a. n.a. n.a. n.a. n.a. n.a. n.a. Malawi n.a. n.a. n.a. n.a. n.a. n.a. n.a. n.a. n.a. n.a. Mauritius Mozambique n.a. n.a. Namibia n.a. n.a. n.a. n.a. n.a. n.a. n.a. n.a. n.a. n.a. Seychelles n.a. n.a. n.a. n.a. n.a. n.a. n.a. n.a. n.a. n.a. South Africa n.a. n.a. n.a. n.a. n.a. n.a. n.a. n.a. n.a. n.a. Swaziland United Republic of Tanzania n.a. n.a. n.a. n.a. n.a. n.a. n.a. n.a. n.a. n.a. Zambia n.a. n.a. n.a. n.a Zimbabwe n.a. n.a. n.a. n.a. n.a. n.a. n.a. n.a. n.a. n.a. Angola Botswana n.a. n.a. n.a. n.a. n.a. n.a. n.a. n.a. n.a. n.a. Democratic Republic of Congo n.a. n.a. n.a. n.a. n.a. n.a. n.a. n.a. n.a. n.a. Lesotho n.a. n.a. n.a. n.a. n.a. n.a. n.a Madagascar n.a. n.a. n.a. n.a. n.a. n.a. n.a. n.a. n.a. n.a. Malawi n.a. n.a. n.a. n.a. n.a. n.a. n.a. n.a. n.a. n.a. Mauritius Mozambique n.a. n.a. n.a. n.a. n.a. n.a. n.a. n.a. n.a. n.a. Namibia n.a. n.a. n.a. n.a. n.a. n.a. n.a. n.a. n.a. n.a. Seychelles n.a. n.a. n.a. n.a. n.a. n.a. n.a. n.a. n.a. n.a. South Africa n.a. n.a. n.a. n.a. n.a. n.a. n.a. n.a. n.a. n.a. Swaziland n.a. n.a. n.a. n.a. n.a. n.a n.a. n.a. United Republic of Tanzania n.a. n.a. n.a. n.a. n.a. n.a. n.a. n.a. n.a. n.a. Zambia n.a. n.a. n.a. n.a Zimbabwe n.a. n.a. n.a. n.a. n.a. n.a. n.a. n.a. n.a. n.a. Source: National Statistics Offices of Member States Notes: Angola: The price of electricity in the national currency has not changed during these years. The different prices in dollars are results of exchange rate variation South Africa : The electricity tariffs are the approved tariffs from the National energy regulator of SA (NERSA) for the most representative municipality - Rand Values; Data was submitted in Rands by Statssa, converted to US$ using the average exchange rates for the relevant year Zimbabwe: In 2006 Zim dollar was revalued, that s why the prices before 2006 appear as though they are higher than from ; Zimbabwe experinced hyperinflation from
324 Table Pump prices for gasoline in SADC in US cents per litre, , Selected Years Country Angola Botswana Democratic Republic of Congo n.a n.a. Lesotho n.a Madagascar n.a n.a. Malawi Mauritius Mozambique n.a. Namibia n.a n.a. Seychelles n.a South Africa n.a. Swaziland n.a. United Republic of Tanzania Zambia n.a. n.a. n.a. Zimbabwe Source: Worldwide Retail prices of gasoline (US cents per litre), German International Cooperation (GTZ). World Bank World Development Indicators, downloaded 20 September 2016: Data for Democratic Republic of Congo, Madagascar, Mozambique, Namibia, South Africa National Statistics Offices of Member States Definition: Fuel prices refer to the pump prices of the most widely sold grade of gasoline. Prices have been converted from the local currency to U.S. dollars. 324
325 Table Pump prices for diesel in SADC in US cents per litre, , Selected Years Country Angola Botswana Democratic Republic of Congo n.a n.a. Lesotho n.a. Madagascar n.a Malawi Mauritius Mozambique n.a. Namibia n.a n.a. Seychelles South Africa n.a. Swaziland United Republic of Tanzania Zambia Zimbabwe Source: Worldwide Retail prices of gasoline (US cents per litre), German International Cooperation (GTZ). World Bank World Development Indicators, downloaded 20 September 2016: Data for Democratic Republic of Congo, Madagascar, Mozambique, Namibia National Statistics Offices of Member States Definition: Fuel prices refer to the pump prices of the most widely sold grade of diesel fuel. Prices have been converted from the local currency to U.S. dollars. 325
326 Table Price for Kerosene in SADC, US $ per litre, Country Angola Botswana n.a. n.a Democratic Republic of Congo n.a. n.a. n.a. n.a. n.a. n.a. n.a. n.a. n.a. n.a. Lesotho n.a. Madagascar n.a. n.a. n.a. n.a. n.a. n.a. n.a. n.a. n.a. n.a. Malawi n.a Mauritius Mozambique n.a. n.a. Namibia n.a. n.a. n.a. n.a. n.a. n.a. n.a. n.a. n.a. n.a. Seychelles n.a. n.a. 2.3 South Africa n.a. n.a. Swaziland n.a. n.a. n.a. n.a. n.a. United Republic of Tanzania n.a. n.a. n.a. Zambia Zimbabwe Source: National Statistics Offices of Member States Notes: Lesotho : Submitted in Maloti by BOS, converted to US$ using the average exchange rates for the year Mauritius : Mauritius kerosene excludes jet fuel South Africa : For kerosene: Average price calculated per annum (source: Department of Energy) - Regulated at wholesale level, therefore the prices in this table is that of whole sale; stats SA does not publish retail level prices; and converted to R per liter, from c per liter; SA does not publish tariffs; Submitted in Rands by Statssa, converted to US$ using the average exchange rates for the year 326
327 8.5.2 WATER 327
328 Table Total Annual Renewable Water Resources Available in SADC, , Selected years Country Total annual renewable fresh water available by country (km3) Per capita water availabity [Total annual renewable water recources per capita) (m3) Total annual renewable fresh water available by country (km3) Per capita water availabity [Total annual renewable water recources per capita) (m3) Total annual renewable fresh water available by country (km3) Per capita water availabity [Total annual renewable water recources per capita) (m3) Angola n.a Botswana n.a. n.a. n.a. n.a Democratic Republic of Congo n.a. n.a. n.a. n.a Lesotho n.a. n.a. n.a. n.a Madagascar n.a. n.a. n.a. n.a Malawi n.a. n.a. n.a. n.a Mauritius Mozambique n.a. n.a. n.a. n.a Namibia n.a. n.a. n.a. n.a Seychelles 0.8 n.a. 0.9 n.a. 0.7 South Africa n.a. n.a. n.a. n.a Swaziland n.a. n.a. n.a. n.a United Republic of Tanzania n.a. n.a. n.a. n.a Zambia n.a. n.a. n.a. n.a Zimbabwe n.a. n.a. n.a. n.a Table (contd.) Total Annual Renewable Water Resources Available in SADC, , Selected years Country Total annual renewable fresh water available by country (km3) Per capita water availabity [Total annual renewable water recources per capita) (m3) Total annual renewable fresh water available by country (km3) Per capita water availabity [Total annual renewable water recources per capita) (m3) Total annual renewable fresh water available by country (km3) Per capita water availabity [Total annual renewable water recources per capita) (m3) Angola n.a n.a n.a. Botswana n.a. n.a n.a. n.a. Democratic Republic of Congo n.a. n.a n.a. n.a. Lesotho n.a. n.a n.a. n.a. Madagascar n.a. n.a n.a. n.a. Malawi n.a. n.a n.a. n.a. Mauritius Mozambique n.a. n.a n.a. n.a. Namibia n.a. n.a n.a. n.a. Seychelles 1.3 n.a. n.a. n.a. n.a. n.a. South Africa n.a. n.a n.a. n.a. Swaziland n.a. n.a n.a. n.a. United Republic of Tanzania n.a. n.a n.a. n.a. Zambia n.a. n.a n.a. n.a. Zimbabwe n.a. n.a n.a. n.a. Source: Implementing the SADC Regional Strategic Plan for Integrated Waters Resource Management ( ). Lessons and best practices World Development Indicators, Data for 2012&2014: Botswana, Democratic Republic Of Congo, Lesotho, Madagascar, Malawi, Mozambique, Namibia, South Africa, Swaziland, Tanzania, Zambia, Zimbabwe National Statistics Offices of Member States Definition: Water resources: total renewable (natural) Total Natural Renewable Water Resources (TRWR_natural): The long-term average sum of internal renewable water resources (IRWR) and external natural renewable water resources (ERWR_natural). It corresponds to the maximum theoretical yearly amount of water actually available for a country at a given moment. Proportion of total water resources used = surface water and ground water withdrawal as percentage of total renewable water resources. Water withdrawal is the quantity of water removed from available sources for human use (in the agricultural, domestic and industrial sectors), expressed as a percentage of the total volume of water 1 cubic kilometer = 1e+9 cubic meter = cubic meter 328
329 Table Total annual renewable internal water resources per capita in SADC, , Selected years Country Angola n.a. n.a. n.a. n.a. Botswana Democratic Republic of Congo n.a. n.a. n.a. n.a. Lesotho n.a. n.a. n.a. n.a. Madagascar n.a. n.a. n.a. n.a. Malawi n.a. n.a. n.a. n.a. Mauritius Mozambique n.a. n.a. n.a. n.a. Namibia n.a. n.a. n.a. n.a. Seychelles n.a. n.a. South Africa n.a. n.a. n.a. n.a. Swaziland n.a. n.a. n.a. n.a. United Republic of Tanzania n.a. n.a. n.a. n.a. Zambia n.a. n.a. n.a. n.a. Zimbabwe Source: World Development Indicators & Global Development Finance, The World Bank, National Statistics Offices of Member States Definition: Renewable internal freshwater resources flows refer to internal renewable resources (internal river flows and groundwater from rainfall) in the country. Renewable internal freshwater resources per capita are calculated using the World Bank's population estimates. 329
330 Table Total Annual Freshwater Withdrawals in SADC, Billion Cubic Meter, , Selected Years Country Billion Cubic Meter Angola Botswana n.a. n.a n.a Democratic Republic of Congo n.a. n.a n.a. Lesotho n.a n.a n.a. Madagascar n.a. n.a n.a. Malawi n.a. n.a n.a. Mauritius Mozambique n.a. n.a n.a. Namibia n.a. n.a n.a. Seychelles n.a. South Africa n.a. n.a n.a. Swaziland n.a. n.a n.a. United Republic of Tanzania n.a. n.a n.a. Zambia n.a. n.a n.a. Zimbabwe Source: World Development Indicators & Global Development Finance, The World Bank, World Development Indicators, Data for 2014: Botswana, Democratic Republic Of Congo, Lesotho, Madagascar, Malawi, Mozambique, Namibia, South Africa, Swaziland, Tanzania, Zambia National Statistics Offices of Member States Definition: Freshwater : Surface water and ground water. While desalinated water, reused wastewater and saline water are used by different sectors, AQUASTAT does not consider any of these water types to be freshwater. Percentage of total actual renewable freshwater resources withdrawn: Total freshwater withdrawn in a given year, expressed in percentage of the actual total renewable water resources (TRWR_actual). This parameter is an indication of the pressure on the renewable water resources. 330
331 Table Percentage of Total Annual Freshwater Withdrawals Used for Domestic Use in SADC, , Selected Years Country Percent Angola Botswana Democratic Republic of Congo n.a. n.a n.a. Lesotho n.a. n.a n.a. Madagascar n.a. n.a n.a. Malawi n.a. n.a n.a. Mauritius Mozambique n.a. n.a n.a. Namibia n.a. n.a n.a. Seychelles n.a. n.a. South Africa n.a. n.a n.a. Swaziland n.a n.a. United Republic of Tanzania n.a. n.a n.a. Zambia n.a. n.a n.a. Zimbabwe Source: World Development Indicators & Global Development Finance, The World Bank, World Development Indicators, Data for 2014: Botswana, Democratic Republic Of Congo, Lesotho, Madagascar, Malawi, Mozambique, Namibia, South Africa, Swaziland, Tanzania, Zambia National Statistics Offices of Member States Definition: Freshwater : Surface water and ground water. While desalinated water, reused wastewater and saline water are used by different sectors, AQUASTAT does not consider any of these water types to be freshwater Percentage of total actual renewable freshwater resources withdrawn: Total freshwater withdrawn in a given year, expressed in percentage of the actual total renewable water resources (TRWR_actual). This parameter is an indication of the pressure on the renewable water resources. 331
332 Table Percentage of Total Annual Freshwater Withdrawals Used for Agriculture (Irrigation) in SADC, , Selected Years Country Percent Angola n.a. n.a n.a. Botswana Democratic Republic of Congo n.a. n.a n.a. Lesotho n.a. n.a. 8.7 n.a. Madagascar n.a. n.a n.a. Malawi n.a. n.a n.a. Mauritius Mozambique n.a. n.a n.a. Namibia n.a. n.a n.a. Seychelles n.a. South Africa n.a. n.a n.a. Swaziland n.a. n.a n.a. United Republic of Tanzania n.a. n.a n.a. Zambia n.a. n.a n.a. Zimbabwe Source: World Development Indicators & Global Development Finance, The World Bank, World Development Indicators, Data for 2014: Angola, Democratic Republic Of Congo, Lesotho, Madagascar, Malawi, Mozambique, Namibia, Seychelles, South Africa, Swaziland, Tanzania, Zambia National Statistics Offices of Member States Definition: Freshwater : Surface water and ground water. While desalinated water, reused wastewater and saline water are used by different sectors, AQUASTAT does not consider any of these water types to be freshwater. Percentage of total actual renewable freshwater resources withdrawn: Total freshwater withdrawn in a given year, expressed in percentage of the actual total renewable water resources (TRWR_actual). This parameter is an indication of the pressure on the renewable water resources. 332
333 Table Percentage of Total Annual Freshwater Withdrawals Used for Industry in SADC, , Selected Years Country Percent Angola Botswana Democratic Republic of Congo n.a. n.a n.a. Lesotho n.a. n.a n.a. Madagascar n.a. n.a. 0.8 n.a. Malawi n.a. n.a. 4.5 n.a. Mauritius Mozambique n.a. n.a. 2.7 n.a. Namibia n.a. n.a. 4.9 n.a. Seychelles n.a. South Africa n.a. n.a. 6.0 n.a. Swaziland n.a n.a. United Republic of Tanzania n.a. n.a. 0.5 n.a. Zambia n.a. n.a. 8.3 n.a. Zimbabwe Source: World Development Indicators & Global Development Finance, The World Bank, World Development Indicators, Data for 2014: Democratic Republic Of Congo, Lesotho, Madagascar, Mozambique, Namibia, Seychelles, South Africa, Swaziland, Tanzania, Zambia National Statistics Offices of Member States Definition: Freshwater : Surface water and ground water. While desalinated water, reused wastewater and saline water are used by different sectors, AQUASTAT does not consider any of these water types to be freshwater Percentage of total actual renewable freshwater resources withdrawn: Total freshwater withdrawn in a given year, expressed in percentage of the actual total renewable water resources (TRWR_actual). This parameter is an indication of the pressure on the renewable water resources. 333
334 Table Percentage Population Connected to Public Water Supply in SADC, (%), Percent Country Urban Rural Urban Rural Urban Rural Urban Rural Urban Rural Urban Rural Urban Rural Urban Rural Urban Rural Urban Rural Angola n.a. n.a. n.a. n.a n.a. n.a. n.a. n.a n.a. n.a. n.a. n.a. n.a n.a n.a. n.a. Botswana n.a. n.a. n.a. n.a. n.a. n.a. n.a. n.a Democratic Republic of Congo n.a. n.a n.a. n.a. n.a. n.a. n.a. n.a. n.a. n.a. n.a. n.a. n.a. n.a. n.a. n.a. n.a. n.a. Lesotho n.a. n.a. n.a. n.a. n.a. n.a. n.a. n.a. n.a. n.a. n.a. n.a. n.a. n.a. n.a. n.a. n.a. n.a. n.a. n.a. Madagascar n.a. n.a. n.a. n.a. n.a. n.a. n.a. n.a. n.a. n.a. n.a. n.a. n.a. n.a. n.a. n.a. n.a. n.a. n.a. n.a. Malawi n.a. n.a. n.a. n.a. n.a. n.a. n.a. n.a. n.a. n.a. n.a. n.a. n.a. n.a. n.a. n.a. n.a. n.a. Mauritius n.a. n.a. n.a. n.a. n.a. n.a. n.a. n.a. n.a. n.a n.a. n.a. n.a. n.a. n.a. n.a. n.a. n.a. Mozambique n.a. n.a. n.a. n.a n.a. n.a. n.a. n.a. n.a. n.a. n.a. n.a. n.a. n.a. n.a. n.a. n.a. n.a. Namibia n.a. n.a n.a. n.a. n.a. n.a. n.a. n.a. n.a. n.a. n.a. n.a. n.a. n.a. n.a. n.a. n.a. n.a. Seychelles South Africa n.a. n.a. n.a. n.a. n.a. n.a. n.a. n.a. n.a. n.a. n.a. n.a. n.a. n.a. n.a. n.a. Swaziland n.a. n.a. n.a. n.a. United Republic of Tanzania n.a. n.a. n.a. n.a n.a. n.a. n.a. n.a. n.a. n.a. n.a. n.a. n.a. n.a. n.a. n.a. n.a. n.a. Zambia n.a. n.a. n.a. n.a. n.a. n.a. n.a. n.a. n.a. n.a. n.a. n.a. n.a. n.a. n.a. n.a. Zimbabwe n.a. n.a. n.a. n.a. n.a. n.a. n.a. n.a. n.a. n.a. n.a. n.a. n.a. n.a. n.a. n.a. n.a. n.a. n.a. n.a. SADC - Total n.a. n.a. n.a. n.a. n.a. n.a. n.a. n.a. n.a. n.a. n.a. n.a. n.a. n.a. n.a. n.a. n.a. n.a. n.a. n.a. Source: WHO/UNICEF Joint Monitoring Programme for Water Supply and Sanitation, Estimates for the improved Drinking-Water Sources. Updated March wssinfo.org National Statistics Offices of Member States Definition: Public water supply = " public tap/tap water/standpipe Percentage of urban and rural population connected to public water supply 334
335 Table Water Tariffs in SADC, US $, Type of Tariff Domestic Commercial Country US Dollar Angola Botswana n.a. n.a. n.a. n.a. n.a. n.a. n.a. n.a Democratic Republic of Congo n.a. n.a. n.a. n.a. n.a. n.a. n.a. n.a. n.a. n.a. Lesotho - (Band A. 0 to 5 Kilolitres) n.a. n.a. Lesotho - (Band B. >5 to 10 Kilolitres) n.a. n.a. Lesotho - (Band C. >10 to 15 Kilolitres) n.a. n.a. Lesotho - (Band D. ABOVE 15 Kilolitres) n.a. n.a. Madagascar n.a. n.a. n.a. n.a. n.a. n.a. n.a. n.a. n.a. n.a. Malawi n.a. n.a. n.a. n.a. n.a. n.a. n.a. n.a. n.a. n.a. Mauritius Mozambique n.a. n.a. n.a. Namibia n.a. n.a. n.a. n.a. n.a. n.a. n.a. n.a. n.a. n.a. Seychelles n.a n.a. n.a. South Africa - charge per Kl: 7-10 kl n.a. n.a. n.a n.a. n.a. South Africa - charge per Kl: kl n.a. n.a. n.a n.a. n.a. South Africa - charge per Kl: kl n.a. n.a. n.a n.a. n.a. South Africa - charge per Kl: kl n.a. n.a. n.a n.a. n.a. South Africa - charge per Kl: kl n.a. n.a. n.a n.a. n.a. South Africa - charge per Kl: > 41kl n.a. n.a. n.a n.a. n.a. Swaziland n.a. n.a. United Republic of Tanzania n.a. n.a. n.a. Zambia n.a. n.a. n.a. n.a. n.a. n.a. n.a. n.a. n.a. n.a. Zimbabwe Angola n.a. n.a. n.a. n.a. n.a. n.a. n.a. n.a. n.a. n.a. Botswana n.a. n.a. n.a. n.a. n.a. n.a. n.a. n.a Democratic Republic of Congo n.a. n.a. n.a. n.a. n.a. n.a. n.a. n.a. n.a. n.a. Lesotho (M) n.a. n.a. n.a. Madagascar n.a. n.a. n.a. n.a. n.a. n.a. n.a. n.a. n.a. n.a. Malawi n.a. n.a. n.a. n.a. n.a. n.a. n.a. n.a. n.a. n.a. Mauritius Mozambique n.a. n.a n.a. Namibia n.a. n.a. n.a. n.a. n.a. n.a. n.a. n.a. n.a. n.a. Seychelles n.a. n.a. n.a. n.a. n.a. n.a. n.a. n.a. n.a. n.a. South Africa n.a. n.a. n.a. n.a. n.a. n.a. n.a. n.a. n.a. n.a. Swaziland n.a. n.a. United Republic of Tanzania n.a. n.a. n.a. n.a. n.a. n.a. n.a. n.a. n.a. n.a. Zambia n.a. n.a. n.a. n.a. n.a. n.a. n.a. n.a. n.a. n.a. Zimbabwe Source: National Statistics Offices of Member States Notes: Angola : Water supply parallel is measured in grade (0 to 10 m3 / Escalão (0 a 10 m3)); Water supply parallel is measured in 200 litres / (200Ltros Grade (0 to 10 m3) Lesotho: Price data submitted in Maloti by BOS, converted to US$ using the average exchange rates for the year Seychelles: Water not a separate indicator in CPI. It is part of the energy index which include housing, cooking gas, electricity etc. South Africa : Tariffs for the most representative municipality - in Rand value; Price data submitted in Rands by Statssa, converted to US$ using the average exchange rates for the year 335
336 Table Consumer Price Indices for Water in SADC, Country Percent Angola Botswana Democratic Republic of Congo n.a. n.a. n.a. n.a. n.a. n.a. n.a. n.a. n.a. n.a. Lesotho n.a n.a. n.a. Madagascar n.a. n.a. n.a. n.a. n.a. n.a. n.a. n.a. n.a. n.a. Malawi n.a. n.a. n.a. n.a. n.a. n.a. n.a. n.a. n.a. n.a. Mauritius Mozambique n.a n.a. n.a. Namibia n.a. n.a. n.a. n.a. n.a. n.a. n.a. n.a. n.a. n.a. Seychelles n.a. n.a. n.a. n.a. n.a. n.a. n.a. n.a. n.a. n.a. South Africa n.a. n.a. Swaziland n.a. n.a. United Republic of Tanzania n.a. n.a. n.a. Zambia n.a. n.a. n.a. n.a. n.a. n.a Zimbabwe Source: National Statistics Offices of Member States Notes: Angola: December 2010=100 Botswana : September 2006=100 Lesotho : April 1997 =100; Quarterly CPI Mauritius : 2000=100 Mozambique : from 2004 till 2010 (2004=100) and from 2011 till 2012 (2010=100) Seychelles : Water not a separate indicator in CPI. It is part of the energy index which include housing, cooking gas, electricity etc. South Africa : CPI for Water, reference year = Dec 2012=100; Tanzania : From ; Base: DEC2001=100 and From 2010, Base: October 2009=100) Zimbabwe : From : Base December 2012=
337 Table Total Emissions of Organic Water Pollutants(BOD) in SADC Per Day, Unit, Country Angola n.a. n.a. n.a. n.a. n.a. n.a. n.a. n.a. n.a. n.a. Botswana n.a. n.a. n.a. n.a. n.a. n.a. n.a. n.a. Democratic Republic of Congo n.a. n.a. n.a. n.a. n.a. n.a. n.a. n.a. n.a. n.a. Lesotho n.a. n.a. n.a. n.a. n.a. n.a. n.a. n.a. Madagascar n.a. n.a. n.a. n.a. n.a. n.a. n.a. n.a. n.a. Malawi n.a. n.a. n.a. n.a. n.a. n.a. n.a. n.a. n.a. n.a. Mauritius n.a. n.a. n.a. n.a. n.a. n.a. n.a. n.a. Mozambique n.a. n.a. n.a. n.a. n.a. n.a. n.a. n.a. n.a. n.a. Namibia n.a. n.a. n.a. n.a. n.a. n.a. n.a. n.a. n.a. n.a. Seychelles n.a. n.a. n.a. n.a. n.a. n.a. n.a. n.a. n.a. n.a. South Africa n.a. n.a. n.a. n.a. n.a. n.a. n.a. n.a. Swaziland n.a. n.a. n.a. n.a. n.a. n.a. n.a. n.a. n.a. n.a. United Republic of Tanzania n.a. n.a. n.a. n.a. n.a. n.a. n.a. n.a. Zambia n.a. n.a. n.a. n.a. n.a. n.a. n.a. n.a. n.a. n.a. Zimbabwe n.a. n.a. n.a. n.a. n.a. n.a. n.a. n.a. n.a. n.a. Source: World Development Indicators & Global Development Finance, The World Bank, National Statistics Offices of Member States 337
338 9 ENVIRONMENTAL AND SUSTAINABLE DEVELOPMENT 338
339 Table 9.1 Carbon Dioxide Emissions in SADC, Total and Per Capita, Country Angola Botswana Democratic Republic of Congo Lesotho Madagascar Malawi Mauritius* Mozambique Namibia Seychelles South Africa Swaziland United Republic of Tanzania Zambia Zimbabwe SADC - Total Variable Carbon Dioxide Emissions in SADC Total CO2 Emissions (Mio. Tonnes) n.a. n.a. n.a. n.a. CO2 Emissions Per Capita (Tonnes) n.a. n.a. n.a. n.a. Total CO2 Emissions (Mio. Tonnes) n.a. n.a. n.a. n.a. CO2 Emissions Per Capita (Tonnes) n.a. n.a. n.a. n.a. Total CO2 Emissions (Mio. Tonnes) n.a. n.a. n.a. n.a. CO2 Emissions Per Capita (Tonnes) n.a. n.a. n.a. n.a. Total CO2 Emissions (Mio. Tonnes) n.a n.a. n.a. n.a. n.a. CO2 Emissions Per Capita (Tonnes) n.a. n.a n.a. n.a. n.a. n.a. Total CO2 Emissions (Mio. Tonnes) n.a. n.a. n.a. n.a. CO2 Emissions Per Capita (Tonnes) n.a. n.a. n.a. n.a. Total CO2 Emissions (Mio. Tonnes) n.a. n.a. n.a. n.a. CO2 Emissions Per Capita (Tonnes) n.a. n.a. n.a. n.a. Total CO2 Emissions (Mio. Tonnes) CO2 Emissions Per Capita (Tonnes) Total CO2 Emissions (Mio. Tonnes) n.a. n.a. n.a. n.a. CO2 Emissions Per Capita (Tonnes) n.a. n.a. n.a. n.a. Total CO2 Emissions (Mio. Tonnes) n.a. n.a. n.a. n.a. CO2 Emissions Per Capita (Tonnes) n.a. n.a. n.a. n.a. Total CO2 Emissions (Mio. Tonnes) n.a. n.a. n.a. n.a. CO2 Emissions Per Capita (Tonnes) n.a. n.a. n.a. n.a. Total CO2 Emissions (Mio. Tonnes) n.a. n.a. n.a. n.a. CO2 Emissions Per Capita (Tonnes) n.a. n.a. n.a. n.a. Total CO2 Emissions (Mio. Tonnes) n.a. n.a. n.a. n.a. CO2 Emissions Per Capita (Tonnes) n.a. n.a. n.a. n.a. Total CO2 Emissions (Mio. Tonnes) n.a. n.a. n.a. n.a. CO2 Emissions Per Capita (Tonnes) n.a. n.a. n.a. n.a. Total CO2 Emissions (Mio. Tonnes) n.a. n.a. n.a. n.a. CO2 Emissions Per Capita (Tonnes) n.a. n.a. n.a. n.a. Total CO2 Emissions (Mio. Tonnes) n.a. n.a. n.a. n.a. CO2 Emissions Per Capita (Tonnes) n.a. n.a. n.a. n.a. Total CO2 Emissions (Mio. Tonnes) n.a. n.a. n.a. n.a. CO2 Emissions Per Capita (Tonnes) n.a. n.a. n.a. n.a. n.a. n.a. n.a. n.a. n.a. n.a. Source: UNSD Millennium Development Goals Indicators database (see UNSD Millennium Development Goals Indicators database (see downloaded: 22 September 2016: Data for 2011: Angola, Botswana, Democratic of Congo, Lesotho, Madagascar, Malawi, Mauritius, Mozambique, Namibia, Seychelles, South Afria, Tanzania, Zambia, Zimbabwe National Statistics Offices of Member States Definitions & Technical notes: CO2 emission sources include emissions from energy industry, from transport, from fuel combustion in industry, services, households, etc. and industrial processes, such as the production of cement. Changes in how land is used can also result in the emission of CO2, or in the removal of CO2 from the atmosphere. However, as there is not yet an agreed method for estimating this, it is not included in the figures for CO2 emissions. Burning of biomass such as wood and straw also emits CO2; however, unless there has been a change in land use, it is considered that CO2 emitted from biomass is removed from the air by new growth, and therefore it should not included in the total for CO2. 339
340 Table 9.2 Mean Annual Rainfall in SADC, mm, Country Mean Annual Rainfall, mm Angola n.a. n.a. n.a. n.a. n.a. n.a. n.a. n.a. n.a. n.a. Botswana Democratic Republic of Congo n.a n.a. Lesotho n.a. n.a n.a. n.a. n.a. Madagascar n.a. n.a. n.a. n.a. n.a. n.a. n.a. n.a. n.a. n.a. Malawi Mauritius Mozambique n.a. n.a. n.a. n.a. n.a. n.a. n.a. n.a. n.a. n.a. Namibia n.a. n.a. n.a. n.a. n.a. n.a. n.a. n.a. n.a. n.a. Seychelles South Africa n.a. n.a. n.a. n.a. n.a. n.a. n.a. n.a. n.a. n.a. Swaziland n.a. n.a. n.a. n.a. n.a. n.a. n.a. n.a. n.a. n.a. United Republic of Tanzania n.a. n.a. n.a. n.a. n.a. n.a. n.a. n.a. n.a. n.a. Zambia n.a. n.a. n.a. n.a. n.a. n.a. n.a. n.a. Zimbabwe n.a. n.a. n.a. n.a. n.a. n.a. n.a. n.a. n.a. n.a. SADC - Total n.a. n.a. n.a. n.a. n.a. n.a. n.a. n.a. n.a. n.a. Source: National Statistics Offices of Member States 340
341 Table 9.3 Mean Annual Temperature in SADC, 0 C, Country Mean Annual Temperature, 0 C Angola n.a. n.a. n.a. n.a. n.a. n.a. n.a. n.a. n.a. n.a. Botswana Democratic Republic of Congo n.a n.a. Lesotho n.a n.a. n.a. n.a. Madagascar n.a. n.a. n.a. n.a. n.a. n.a. n.a. n.a. n.a. n.a. Malawi Mauritius Mozambique n.a. n.a. n.a. n.a. n.a. n.a. n.a. n.a. n.a. n.a. Namibia n.a. n.a. n.a. n.a. n.a. n.a. n.a. n.a. n.a. n.a. Seychelles South Africa n.a. n.a. n.a. n.a. n.a. n.a. n.a. n.a. n.a. n.a. Swaziland n.a. n.a. n.a. n.a. n.a. n.a. n.a. n.a. n.a. n.a. United Republic of Tanzania n.a. n.a. n.a. n.a. n.a. n.a. n.a. n.a. n.a. n.a. Zambia n.a. n.a. n.a. n.a. n.a. n.a. n.a. n.a. n.a. n.a. Zimbabwe n.a. n.a. n.a. n.a. n.a. n.a. n.a. n.a. n.a. n.a. SADC - Total n.a. n.a. n.a. n.a. n.a. n.a. n.a. n.a. n.a. n.a. Source: National Statistics Offices of Member States 341
342 Table 9.4 Consumption of Ozone-Depleting Chlorofluorocarbons (CFCs) in SADC, Tons of Ozone-Depleting Potential, Country Tons of ozone-depleting potential (ODP) Baseline, Angola n.a. n.a. n.a. n.a. n.a. n.a. n.a. Botswana n.a. n.a. Democratic Republic of Congo n.a. n.a. n.a. n.a. n.a. n.a. n.a. Lesotho n.a. n.a. n.a. n.a. n.a. n.a. n.a. Madagascar n.a. n.a. n.a. n.a. n.a. n.a. n.a. Malawi n.a. n.a. n.a. n.a. n.a. n.a. n.a. Mauritius Mozambique n.a. n.a. n.a. n.a. n.a. n.a. n.a. Namibia n.a. n.a. n.a. n.a. n.a. n.a. n.a. Seychelles n.a. South Africa n.a. n.a. n.a. n.a. n.a. n.a. n.a. Swaziland n.a. n.a. n.a. n.a. n.a. n.a. n.a. United Republic of Tanzania n.a. n.a. n.a. n.a. n.a. n.a. n.a. Zambia n.a. n.a. n.a. n.a. n.a. n.a. n.a. Zimbabwe n.a. n.a. n.a. n.a. n.a. n.a. n.a. Sources: UNSD Millennium Development Goals Database ( National Statistics Offices of Member States Notes: The baseline value for CFCs, , is calculated by the Ozone Secretariat for monitoring compliance in reducing consumption of ODS. The calculation of the baseline varies across parties and substance categories. In the case of CFCs, the baseline for developing countries (Article 5) is the average annual consumption from 1995 to 1998 Data Quality: Data reported to the Ozone Secretariat by the Montreal Protocol parties are collected using a variety of methods. These include registries or other collections from known producers and consumers, use of estimates and surveys, collecting information through (or from) customs, among other methods. National figures are used directly without adjustment. Currently, there is no validation by the Ozone Secretariat of the reported data. However, inconsistencies in the data are checked and rectified in consultation with the countries (e.g. reporting production for a specific use exceeding total production, or reporting abnormally high values compared to previous trends). Any missing values are left as non-reported in the Ozone Secretariat website (no attempts are made to estimate or impute values for missing years). For more information visit the Ozone Secretariat's website at: 342
343 Table 9.5 Total Land Area in SADC, Km2, Country Angola Botswana Democratic Republic of Congo Lesotho Madagascar Variable Km 2 Total Area (km 2 ) Land Area (km 2 ) Agric. Land (km 2 ) Arable Land (km 2 ) Area of Permanent Crops (km 2 ) Area of Permanent Pastureland (km 2 ) Forest Cover (km 2 ) Irrigated Area (km 2 ) Total Area (km 2 ) Land Area (km 2 ) Agric. Land (km 2 ) Arable Land (km 2 ) Area of Permanent Crops (km 2 ) Area of Permanent Pastureland (km 2 ) Forest Cover (km 2 ) Irrigated Area (km 2 ) Total Area (km 2 ) Land Area (km 2 ) Agric. Land (km 2 ) Arable Land (km 2 ) Area of Permanent Crops (km 2 ) Area of Permanent Pastureland (km 2 ) Forest Cover (km 2 ) Irrigated Area (km 2 ) Total Area (km 2 ) Land Area (km 2 ) Agric. Land (km 2 ) Arable Land (km 2 ) Area of Permanent Crops (km 2 ) Area of Permanent Pastureland (km 2 ) Forest Cover (km 2 ) Irrigated Area (km 2 ) Total Area (km 2 ) Land Area (km 2 ) Agric. Land (km 2 ) Arable Land (km 2 ) Area of Permanent Crops (km 2 ) Area of Permanent Pastureland (km 2 ) Forest Cover (km 2 ) Irrigated Area (km 2 ) Source: Table total area, land area, agricultural land, arable land, area of permanent crops and area of permanent pastureland Table irrigated land Table forest cover 343
344 Table 9.5 (contd.) Total Land Area in SADC, Km2, Country Malawi Mauritius Mozambique Namibia Seychelles Variable Km 2 Total Area (km 2 ) Land Area (km 2 ) Agric. Land (km 2 ) Arable Land (km 2 ) Area of Permanent Crops (km 2 ) Area of Permanent Pastureland (km 2 ) Forest Cover (km 2 ) Irrigated Area (km 2 ) Total Area (km 2 ) Land Area (km 2 ) Agric. Land (km 2 ) Arable Land (km 2 ) Area of Permanent Crops (km 2 ) Area of Permanent Pastureland (km 2 ) Forest Cover (km 2 ) Irrigated Area (km 2 ) Total Area (km 2 ) Land Area (km 2 ) Agric. Land (km 2 ) Arable Land (km 2 ) Area of Permanent Crops (km 2 ) Area of Permanent Pastureland (km 2 ) Forest Cover (km 2 ) Irrigated Area (km 2 ) Total Area (km 2 ) Land Area (km 2 ) Agric. Land (km 2 ) Arable Land (km 2 ) Area of Permanent Crops (km 2 ) Area of Permanent Pastureland (km 2 ) Forest Cover (km 2 ) Irrigated Area (km 2 ) Total Area (km 2 ) Land Area (km 2 ) Agric. Land (km 2 ) Arable Land (km 2 ) Area of Permanent Crops (km 2 ) Area of Permanent Pastureland (km 2 ) Forest Cover (km 2 ) Irrigated Area (km 2 ) Source: Table total area, land area, agricultural land, arable land, area of permanent crops and area of permanent pastureland Table irrigated land Table fore 344
345 Table 9.5 (contd.) Total Land Area in SADC, Km2, Country South Africa Swaziland United Republic of Tanzania Zambia Zimbabwe SADC Total Variable Km 2 Total Area (km 2 ) Land Area (km 2 ) Agric. Land (km 2 ) Arable Land (km 2 ) Area of Permanent Crops (km 2 ) Area of Permanent Pastureland (km 2 ) Forest Cover (km 2 ) Irrigated Area (km 2 ) Total Area (km 2 ) Land Area (km 2 ) Agric. Land (km 2 ) Arable Land (km 2 ) Area of Permanent Crops (km 2 ) Area of Permanent Pastureland (km 2 ) Forest Cover (km 2 ) Irrigated Area (km 2 ) Total Area (km 2 ) Land Area (km 2 ) Agric. Land (km 2 ) Arable Land (km 2 ) Area of Permanent Crops (km 2 ) Area of Permanent Pastureland (km 2 ) Forest Cover (km 2 ) Irrigated Area (km 2 ) Total Area (km 2 ) Land Area (km 2 ) Agric. Land (km 2 ) Arable Land (km 2 ) Area of Permanent Crops (km 2 ) Area of Permanent Pastureland (km 2 ) Forest Cover (km 2 ) Irrigated Area (km 2 ) Total Area (km 2 ) Land Area (km 2 ) Agric. Land (km 2 ) Arable Land (km 2 ) Area of Permanent Crops (km 2 ) Area of Permanent Pastureland (km 2 ) Forest Cover (km 2 ) Irrigated Area (km 2 ) Total Area (km 2 ) Land Area (km 2 ) Agric. Land (km 2 ) Arable Land (km 2 ) Area of Permanent Crops (km 2 ) Area of Permanent Pastureland (km 2 ) Forest Cover (km 2 ) Irrigated Area (km 2 ) Source: Table total area, land area, agricultural land, arable land, area of permanent crops and area of permanent pastureland Table irrigated land Table fore 345
346 Table 9.6 Number of Threatened Plant Species in SADC, , Selected Years Country Number Angola Botswana Democratic Republic of Congo Lesotho Madagascar Malawi Mauritius Mozambique Namibia Seychelles South Africa Swaziland United Republic of Tanzania Zambia Zimbabwe Source: UNSD Statistical Yearbook 2010 as extracte National Statistics Offices of Member States 346
347 Table 9.7 Number of Threatned Animal Species in SADC, , Selected Years Country Number Angola Botswana Democratic Republic of Congo Lesotho Madagascar Malawi Mauritius Mozambique Namibia Seychelles South Africa Swaziland United Republic of Tanzania Zambia Zimbabwe Source: UNSD Statistical Yearbook 2010 as extracte National Statistics Offices of Member States 347
348 10 SADC PROTOCOLS AND DECLARATIONS 348
349 Table 10.1 Status on Protocols and Declarations in SADC as of 30 July 2015 Type of SADC Legal Instrument Sr. No. Legal Instrument Open for (or Date) of Signature Date of Entry into Force Total Number of Countries Which Have: Protocol 1 Treaty of the Southern African Development Community (SADC) 19 17/8/ /9/ R R C R C R C R R X C R R R R 2 Protocol to the Treaty Establishing the Southern African Development Community on Immunities and Privileges R R C R C R C R R X X R R R R 3 Protocol on Shared Watercourse Systems S R X R X R R S R X R R R R R 4 Protocol on Energy R R X R X R R R R X R R R R R 5 Protocol on Transport, Communication and Meteorology R R X R X R R R R X R R R R R 6 Protocol on Illicit Drugs S R X R X R R R R X R R R R R 7 Protocol on Trade C R X R C R R R R X R R R R R 8 Protocol on Education and Training /09/ S R X R X R R R R X R R R R R 9 Protocol on Mining S R X R X R R R R X R S R R R 10 Protocol on Development of Tourism X R S R X R R R R X R R R S R 11 Protocol on Health S R S R X R R R R X R R R R R 12 Protocol on Wildlife Conservation and Law Enforcement S R S R X R R R R X R S R R C 13 Protocol on Tribunal and the Rules of Procedure 2000** /8/ S R X R C R R S R X S S S S S 14 Protocol on Legal Affairs R R X R X R R S R X S R R R S 15 Revised Protocol on Shared Watercourses C R X R X R C R R X R R R R S 16 Amendment Protocol on Trade /08/2000*** R A A R R A R R A X A R A A A 17 Agreement Amending the Treaty of SADC A A A A S A A A A S A A A A A 18 Protocol on Politics, Defence and Security Cooperation C R S R X R R R R X R R R R R 19 Protocol on the Control of Firearms, Ammunition and Other Related Materials in SADC X R S R X R R R R X R R R R R 20 Protocol on Fisheries R R S R X R R R R X R R R R C 21 Protocol on Culture, Information and Sport R R S R X R R R R X R R R R S 22 Protocol Against Corruption R R R R X R R R R X R R R R R Ratified - R Ceded - C Signed - S Adopted - A NoAction=X Total Member States Angola Botswana Democratic Republic of Congo Lesotho Status in Member States Madagascar Malawi Mauritius Mozambique Namibia Seychelles South Africa Swaziland United Republic of Tanzania Zambia Zimbabwe Notes: R: Country Ratified; C: Country acceded; S: Country signed; A: Country adopted # Madagascar is required to accede to the Treaty * MoU Memorandum of Understanding ** The protocol entered into force upon the adoption of the agreement amending the Treaty of SADC at Blantyre in August Thus there will be no further requirement for individual SADC member states to ratify the protocol. *** Angola, DRC and Madagascar are required to deposit instruments of implementation Source: Legal Unit, SADC Secretariat 349
350 Table 10.1 (contd.) Status on Protocols and Declarations in SADC as of 30 July 2015 Type of SADC Legal Instrument Sr. No. Legal Instrument Open for (or Date) of Signature Date of Entry into Force Total Number of Countries Which Have: Protocol 23 Protocol on Extradition R R R R X R R S R X R R R R S 24 Protocol on Forestry /7/ S R S R X S R R R X R R R R R 25 Protocol on Mutual Legal Assistance in Criminal Matters R R S R X S R S R X R R R R A 26 Agreement Amending the Protocol on Tribunal S S S S S S S X S X S S S S S 27 Mutual Defence Pact /8/ /8/ A R S R X S R R R X R R R R R 28 Agreement on the Establishment of the Zambezi Watercourse Commission /7/ R R X X X S X R R X X X R C R 29 Protocol on the Facilitation of Movement of Persons X S S X X X R S S R R X X S 30 Protocol on Finance and Investment /04/ R R S R S R R R R X R C S R C 31 Agreement Amending Annex VI to Protocol on Trade concerning settlement of disputes amongst Member States /08/ /08/ S S S S S S S S S X S S S S X 32 Agreement Amending Article 22 of the Treaty of SADC /08/ /08/ S S S S S S S S S X S S S S S 33 Agreement Amending the Protocol on the Tribunal /08/ /08/ S S S S S S S S S X S S S S S 34 Protocol on Science, Technology and Innovation S R S S X S R R S X R R S R S 35 Agreement Amending the Protocol on the Tribunal X S S S S S S S X X S S S S X 36 Protocol on Gender and Development R X S R S R X R R R R R R R R 37 Agreement Amending Article 6 of the Protocol on the Tribunal S S S S S S S S S X S S S S S 38 Agreement Amending the Treaty S S S S S X S S S S S S S S S 39 Agreement Amending Article 20 of the Protocol on Trade S S S S S X S S S S S S S S S 40 Agreement Amending the Protocol on Politics S X S S X S S S S S S S S S X 41 Agreement Amending the Protocol on the Development of Tourism in SADC X S X S X S S S S X S S S X X 42 Agreement Amending the Treaty DES S X S S X S S S S S S S S S X 43 Agreement Amending the Treaty 2009 ORGAN S X S S X S S S S S S S S S X 44 Protocol on Trade in Services /8/ S R S S X S R R X S R S S S S 45 Agreement on Assistance in Tax Matters X R S S X S S S X S R S S S X 46 Protocol on the Tribunal in the Southern African Development Community X X S S X S X S S X S X S S S 47 Protocol on Environmental Management for Sustainable Development S X S S X S X S S X X X X S S 48 Protocol on Employment and Labor X X S S X S X S S X S X X S S 49 Agreement Amending the Treaty S S S S S S X S X S S S S S S 50 Agreement Amending the Protocol on Politics S S S S S S X S X S S S S S X 51 Agreement Amending the Protocol on Politics S S S S S S X S X S S S S S X Ratified - R Ceded - C Signed - S Adopted - A NoAction=X Total Member States Angola Botswana Democratic Republic of Congo Lesotho Status in Member States Madagascar Malawi Mauritius Mozambique Namibia Seychelles South Africa Swaziland United Republic of Tanzania Zambia Zimbabwe Notes: R: Country Ratified; C: Country acceded; S: Country signed; A: Country adopted # Madagascar is required to accede to the Treaty * MoU Memorandum of Understanding ** The protocol entered into force upon the adoption of the agreement amending the Treaty of SADC at Blantyre in August Thus there will be no further requirement for individual SADC member states to ratify the protocol. *** Angola, DRC and Madagascar are required to deposit instruments of implementation Source: Legal Unit, SADC Secretariat 350
351 Table 10.1 (contd.) Status on Protocols and Declarations in SADC as of 30 July 2015 Type of SADC Legal Instrument Charter 52 Charter of the Regional Tourism Organisation of Southern Africa (RETOSA) S S X S X S S S S X S S S S S 53 Charter of the Fundamental Social Rights X X S S X S S S S X S S S S S Declaration 54 Declaration on Gender and Development X X X X X X X X X X X X X X X 55 Declaration Towards a Southern Africa Free of Anti-personnel Landmines X X X X X X X X X X X X X X X 56 Declaration of Productivity X X X X X X X X X X X X X X X Memorandum of Understanding Sr. No. Legal Instrument Open for (or Date) of Signature Date of Entry into Force Total Number of Countries Which Have: 57 Declaration Concerning Firearms, Ammunition and Other Related Materials X X X X X X X X X X X X X X X 58 Declaration on Information and Communications Technology (ICT) X X X X X X X X X X X X X X X 59 Declaration on HIV and AIDS X X X X X X X X X X X X X X X 60 Declaration Agriculture and Food Security X X X X X X X X X X X X X X X 61 Declaration on Regional Cooperation in Competition and Consumer Policies S X S S X S S S S S S S S S X 62 in SADC (SQAM) S S X S X S S S S X S X S S S 63 SADC MoU on Cooperation in Taxation and Related Matters S S X S X S S X S X S S S S S 64 SADC MoU on Macroeconomic Convergence S S X S X X S S S X S S S X S Ratified - R Ceded - C Signed - S Adopted - A NoAction=X Total Member States Angola Botswana Democratic Republic of Congo Lesotho Status in Member States Madagascar Malawi Mauritius Mozambique Namibia Seychelles South Africa Swaziland United Republic of Tanzania Zambia Zimbabwe Key: R: Country Ratified; C: Country acceded; S: Country signed; A: Country adopted # Madagascar is required to accede to the Treaty * MoU Memorandum of Understanding ** The protocol entered into force upon the adoption of the agreement amending the Treaty of SADC at Blantyre in August Thus there will be no further requirement for individual SADC member states to ratify the protocol. *** Angola, DRC and Madagascar are required to deposit instruments of implementation Source: Legal Unit, SADC Secretariat 351
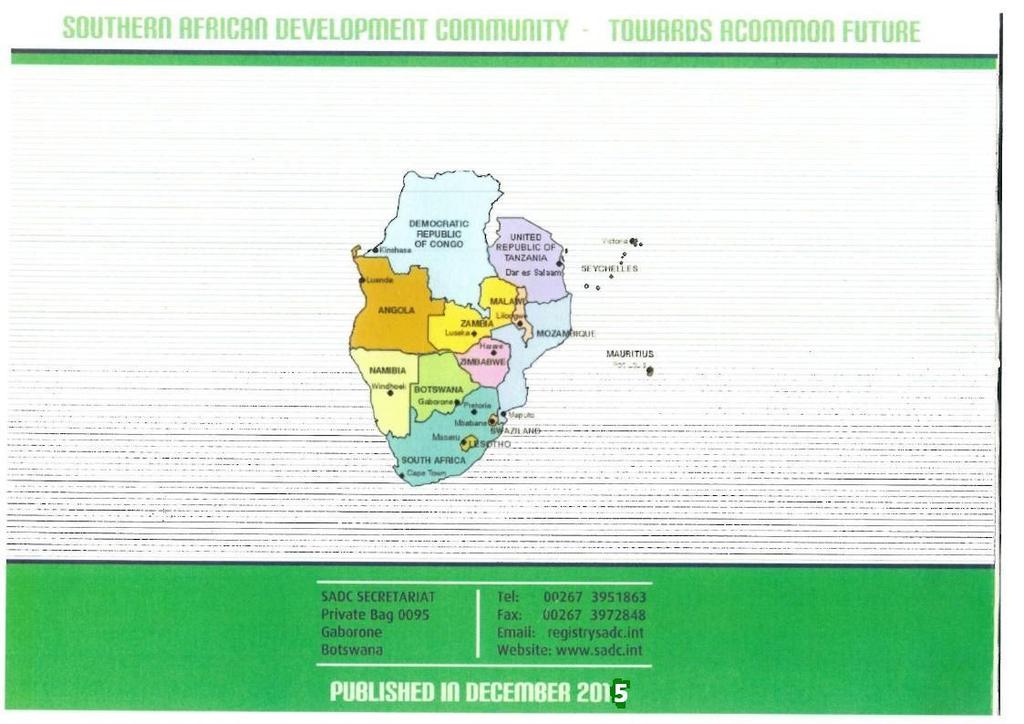
352
National Accounts Workshop for SADC countries
 ESA/STAT/AC.184/21 National Accounts Workshop for SADC countries 16-19 June 2009, Windhoek, Namibia Strengthening statistical capacity-building in support of progress towards the Internationally Agreed
SADC SELECTED ECONOMIC AND SOCIAL INDICATORS, 2016
 SADC SELECTED ECONOMIC AND SOCIAL INDICATORS, 2016 1. INTRODUCTION This report is an attempt to provide data series and a brief trend analysis of the major socio-economic characteristics of SADC region
Monthly inflation rates (%) for SADC, April April 2012
 for SADC, April April 2012") Apr11 May11 Jun11 Jul11 Aug11 Sep11 Oct11 Nov11 Dec11 Jan12 Feb12 Mar12 Apr12 Monthly change (%) Stage I SADC Harmonised Consumer Price Indices (HCPI) April 2012 News Release Issue No. 9 SADC Secretariat
Apr11 May11 Jun11 Jul11 Aug11 Sep11 Oct11 Nov11 Dec11 Jan12 Feb12 Mar12 Apr12 Monthly change (%) Stage I SADC Harmonised Consumer Price Indices (HCPI) April 2012 News Release Issue No. 9 SADC Secretariat
SADC Harmonised Consumer Price Indices (HCPI) September 2017
 September 2017") News Release Issue No. 73 SADC Harmonised Consumer Price Indices (HCPI) September 2017 SADC Secretariat Telephone: (267) 3951863 Directorate -Policy Planning and Resource Mobilization Telefax: (267) 3972848/3181070
News Release Issue No. 73 SADC Harmonised Consumer Price Indices (HCPI) September 2017 SADC Secretariat Telephone: (267) 3951863 Directorate -Policy Planning and Resource Mobilization Telefax: (267) 3972848/3181070
SADC Harmonised Consumer Price Indices (HCPI) February 2017
 February 2017") News Release Issue No. 66 SADC Harmonised Consumer Price Indices (HCPI) February 2017 SADC Secretariat Telephone: (267) 3951863 Directorate -Policy Planning and Resource Mobilization Telefax: (267) 3972848/3181070
News Release Issue No. 66 SADC Harmonised Consumer Price Indices (HCPI) February 2017 SADC Secretariat Telephone: (267) 3951863 Directorate -Policy Planning and Resource Mobilization Telefax: (267) 3972848/3181070
SADC Harmonised Consumer Price Indices (HCPI) March 2017
 March 2017") News Release Issue No. 67 SADC Harmonised Consumer Price Indices (HCPI) March 2017 SADC Secretariat Telephone: (267) 3951863 Directorate -Policy Planning and Resource Mobilization Telefax: (267) 3972848/3181070
News Release Issue No. 67 SADC Harmonised Consumer Price Indices (HCPI) March 2017 SADC Secretariat Telephone: (267) 3951863 Directorate -Policy Planning and Resource Mobilization Telefax: (267) 3972848/3181070
Millennium Development Goal 1: eradicate extreme poverty and hunger. International poverty line a Share of population below PPP $1.
 3.1 Millennium Development Goal 1: eradicate extreme poverty and hunger International poverty line a Share of population below PPP $1.25 a day Poverty gap ratio at PPP $1.25 a day Share of population below
TABLE OF CONTENTS COUNTRY FOCUS: BENIN
 Africa Statistics Flash Selected Socio-Economic Indicators on Africa March 218 TABLE OF CONTENTS COUNTRY FOCUS: BENIN ------------------------------------------------------------------------------------------------
Southern African Development Community (SADC) Grain Trade What does the data say?
 Grain Trade What does the data say?") 15 October 2015 Southern African Development Community (SADC) Grain Trade What does the data say? Tinashe Kapuya (Agbiz Head: International Trade and Investment) and Wandile Sihlobo (Economist at Grain
15 October 2015 Southern African Development Community (SADC) Grain Trade What does the data say? Tinashe Kapuya (Agbiz Head: International Trade and Investment) and Wandile Sihlobo (Economist at Grain
TABLE OF CONTENTS COUNTRY FOCUS: ALGERIA
 Africa Statistics Flash Selected Socio-Economic Indicators on Africa May 218 TABLE OF CONTENTS COUNTRY FOCUS: ALGERIA ---------------------------------------------------------------------------------------------
Table of CONTENTS. COUNTRY FOCUS: Equatorial Guinea
 Africa Statistics Flash Selected Socio-Economic Indicators on Africa August 217 Table of CONTENTS COUNTRY FOCUS: Equatorial Guinea ---------------------------------------------------------------------------
E-Commerce Readiness Study in the SADC sub-region
 E-Commerce Readiness Study in the SADC sub-region Validation workshop 16 th -17 th April 2012 Balaclava, Mauritius Country assesment Mustapha Mezghani Agenda ICT indicators: Postal indicators Cyber & e-commerce
Table of CONTENTS. COUNTRY FOCUS: United Republic of Tanzania
 Africa Statistics Flash Selected Socio-Economic Indicators on Africa December 216 Table of CONTENTS COUNTRY FOCUS: United Republic of Tanzania ------------------------------------------------------------
HCPI COMESA Monthly News Release
 HCPI COMESA Monthly News Release Is sue No. 84 March 2018 Common Market for Eastern and Southern Africa (COMESA) Macroeconomic Indicators COMESA region annual inflation rate stood at 19.4% in March 2018
Regional outlook Sub-Saharan Africa 24/11/2015. Share commodities in good exports. Share commodities in goods imports
 Table 1: Economic structure indicators Number of Inhabitants (m.) Size of the economy (in USD bn.) Size of the economy (% of world GDP) Share commodities in good exports Share commodities in goods imports
Table of CONTENTS. COUNTRY FOCUS: Tunisia
 Africa Statistics Flash Selected Socio-Economic Indicators on Africa October 217 Table of CONTENTS COUNTRY FOCUS: Tunisia ----------------------------------------------------------------------------------------------
Key Indicators for South Sudan
 Key Indicators for South Sudan National Bureau of Statistics Fast Facts Total Population of South Sudan is 8.26 million Total Area of South Sudan is 644,329 sq. km More than half (51%) of the population
SOUTHERN AFRICA TRAVEL AND TOURISM BAROMETER REPORT 2015
 SOUTHERN AFRICA TRAVEL AND TOURISM BAROMETER REPORT 2015 1 Contents 1. TOURISM TRENDS: GLOBAL AND SOUTHERN AFRICA S MARKET SHARE IN AFRICA... 4 1.1. TOURIST ARRIVALS... 4 1.1.1. Global Tourist Arrivals
East African Community Facts and Figures 2014
 The East African Community EAC IRC Repository http://repository.eac.int 1. EAC Secretariat Reports/Publications 2014-09 East African Community Facts and Figures 2014 EAC EAC http://hdl.handle.net/11671/219
Swaziland. HDI values and rank changes in the 2013 Human Development Report
 Human Development Report 2013 The Rise of the South: Human Progress in a Diverse World Explanatory note on 2013 HDR composite indices Swaziland HDI values and rank changes in the 2013 Human Development
Zambia by Numbers. Foreign Exchange Reserves $1.892 Billion (Dec.2013) Public Debt as a % of GDP 36% (2013)
 Public Debt as a % of GDP 36% (2013)") . Area: 752,614km 2 (39 th ) Population: 14.1 million (71 st ) GDP (PPP): $24.714 billion Per Capita: $1,752 GDP Growth Rate 6.6% 2013 Trade Export: $10.434bn 2013 (f.o.b) Import: $9.414bn Foreign Exchange
. Area: 752,614km 2 (39 th ) Population: 14.1 million (71 st ) GDP (PPP): $24.714 billion Per Capita: $1,752 GDP Growth Rate 6.6% 2013 Trade Export: $10.434bn 2013 (f.o.b) Import: $9.414bn Foreign Exchange
Data Limitations. Index Choices
 Section 3. Annexes The Index is part of a central database and system for collecting data on regional integration. It will capture additional data for indicators that are not part of the Index but that
UNSD Environment Statistics Self Assessment Tool (ESSAT) and COMESA Environmental Statistics Assessment 2014
 and COMESA Environmental Statistics Assessment 2014") UNITED NATIONS STATISTICS DIVISION (UNSD) Workshop on Environment Statistics in support of the implementation of the Framework for the Development of Environment Statistics (FDES 2013) Balaclava, Mauritius
UNITED NATIONS STATISTICS DIVISION (UNSD) Workshop on Environment Statistics in support of the implementation of the Framework for the Development of Environment Statistics (FDES 2013) Balaclava, Mauritius
STATUS OF THE COMESA SEED HARMONISATION PROGRAMME (COMSHIP) John Mukuka, COMESA Seed Development Expert. June, 2018
 John Mukuka, COMESA Seed Development Expert. June, 2018") STATUS OF THE COMESA SEED HARMONISATION PROGRAMME (COMSHIP) John Mukuka, COMESA Seed Development Expert. June, 2018 COMESA COVERAGE Size: 11.6 Million sq. km Population: 510 million (2018) GDP: $950 billion
STATUS OF THE COMESA SEED HARMONISATION PROGRAMME (COMSHIP) John Mukuka, COMESA Seed Development Expert. June, 2018 COMESA COVERAGE Size: 11.6 Million sq. km Population: 510 million (2018) GDP: $950 billion
Catchment and Lake Research
 LARS 2007 Catchment and Lake Research Multilateral versus bilateral agreements for the establishment of river based organizations: comparison of legal, economic and social benefits in the Zambian experience.
Regional Investment rules in Eastern and Southern Africa
 Regional Investment rules in Eastern and Southern Africa : COMESA Common Investment Area (CCIA) towards the Tripartite COMESA-EAC-SADC and Pan African investment arrangements London, 14 September 2012
Energy Poverty in Africa
 African Energy Commission (AFREC) Paper on Energy Poverty in Africa By Dr. Gilbert NZOBADILA Consultant Energy Policy- AFREC 1 1- Introduction: African background : The African Energy Commission (AFREC)
Session 6: The 2017 ReNAPRI Outlook on Maize, Wheat, Rice, Soybeans and Sugar
 Session 6: The 217 ReNAPRI Outlook on Maize, Wheat, Rice, Soybeans and Sugar Session Moderator: Prof. Ferdi Meyer Presenters: Brian Chisanga and Tracy Davids ACKNOWLEDGEMENTS This study was made possible
Section 1. The Index
 Section 1. The Index Measuring where Africa stands on regional gives an assessment of what is happening across the continent and is an important way of highlighting where the gaps are. It is a dynamic,
Germany s bilateral development cooperation with Sub-Saharan Africa: An Agenda for Reform
 Germany s bilateral development cooperation with Sub-Saharan Africa: An Agenda for Reform Limited share of development cooperation in the context of donors ODA net payments (incl. debt r elief ) f or SSA
Opportunities and Risks in Africa
 Opportunities and Risks in Africa Africa is not a country Note: Graphic layout for visualization only (some countries are cut and rotated) Source: Creative Commons. Africa at a glance 212 Total GDP: $2.1
ZAMBIA Land of OPPORTUNITIES & PROFITS. Zambia Development Agency
 ZAMBIA Land of OPPORTUNITIES & PROFITS Zambia Development Agency Presentation Strategy Strengths of Zambia Key Investment Consideration Zambia from a Foreign Perspective Sectors of focus for Investment
List of Figures List of Tables. List of Abbreviations. 1 Introduction 1
 Contents List of Tables Preface List of Abbreviations page x xv xvii xix 1 Introduction 1 part i. the caribbean in the age of free trade: from the napoleonic wars to 1900 2 The Core and the Caribbean 21
2. Industry and Business
 72 Statistical Yearbook of Abu Dhabi 2016 2. Industry and Business Business Enviroment Manufacturing Oil and Gas Petrochemicals Electricity and Water Construction Transport Information and Communication
1 What is the African Economic Outlook Project? 2 African Economic Performance: Multifaceted Growth. 3 Africa and Globalization
 African Economic Outlook 2007 Measuring the Pulse of Africa Nicolas Pinaud, OECD Development Centre 经合组织 发展中心 Standard Chartered & the OECD Development Centre AFRICA AND CHINA: ECONOMIC AND BUSINESS PERSPECTIVES
International migration data in the case of South Africa
 International migration data in the case of South Africa A presentation made at the Workshop on strengthening the collection and use of international migration data for development held in Addis Ababa,
Annual profile: Swaziland
 Economics Div ision Annual profile: Swaziland Background January 23 The British guaranteed autonomy for the Swazis in the late 19th century; independence was granted in 1968. Student and labour unrest
STATISTICS BOTSWANA 1
 STATISTICS BOTSWANA 1 Prices Stats Brief No: 2017/1 May 2017 Statistics Botswana. Private Bag 0024 Gaborone Botswana Tel: (+267) 367 1300. Fax: (+267) 395 2201. Email: info@statsbots.org.bw Website: www.statsbots.org.bw
COMESA VACANCIES OFFICE OF THE SECRETARY GENERAL
 COMESA VACANCIES OFFICE OF THE SECRETARY GENERAL VACANCY NOTICE I. EXECUTIVE SECRETARY OF COMESA CLEARING HOUSE II. DIRECTOR OF COMESA MONETARY INSTITUTE Background The Common Market for Eastern and Southern
Why Namibia. Abundant Resources. Striking Opportunities. Competitive Economy. Top Quality Exports. Gateway to SADC
 Why Namibia Abundant Resources Striking Opportunities Competitive Economy Top Quality Exports Gateway to SADC Land of Contrast Sweeping Scenery Abundant Wildlife Hospitable People Modern Infrastructure
Investment Opportunities in ZAMBIA
 Investment Opportunities in ZAMBIA ZAMBIA BULGARIA INVESTMENT FORUM SOFIA, BULGARIA Presentation Outline Location of Zambia Economy at a glance Priority Sectors and Investment Opportunities Why Invest
1.0 Introduction Zambia s Major Trading Partners Zambia s Major Export Markets... 4
 Bank of Zambia CONTENTS 1.0 Introduction... 3 2.0 Zambia s Major Trading Partners... 3 3.0 Zambia s Major Export Markets... 4 4.0 Major Source Countries Of Zambia s Imports... 5 5.0 Direction Of Trade
Structure. Introduction
 1 Introduction Structure Demographic Dynamics in Africa Determinants of the Demographic Transition Human Development Payoffs Jobs Payoffs Economic Growth in Africa Policies to Speed up the Demographic
5th NAMIBIA TOURISM SATELLITE ACCOUNT. Edition
 5th NAMIBIA TOURISM SATELLITE ACCOUNT Edition PREFACE I am pleased to present to you the 5 th edition of the Tourism Satellite Account (TSA). TSA is an accounting framework and economic statistical tool
Africa at a glance. Annual real GDP growth ( average): 4.97% Official development assistance (2010): $48 billion
: 4.97% Official development assistance (2010): $48 billion") Africa at a glance Population (212): 1,38 million Annual real GDP growth (25-212 average): 4.97% Official development assistance (21): $48 billion Net foreign direct investment (211): $43 billion Sources:
Africa at a glance Population (212): 1,38 million Annual real GDP growth (25-212 average): 4.97% Official development assistance (21): $48 billion Net foreign direct investment (211): $43 billion Sources:
COMESA WTO AND WORLD BANK TRAINING ON TRADE IN COMMUNICATIONS SERVICES APRIL 2007 GENEVA
 COMESA WTO AND WORLD BANK TRAINING ON TRADE IN COMMUNICATIONS SERVICES 23-27 APRIL 2007 GENEVA TRADE IN COMMUNICATIONS SERVICES AND DEVELOPMENT IMPLICATIONS IN THE COMESA REGION Introduction COMESA - a
Islamic Development Bank
 Islamic Development Bank KEY SOCIO-ECONOMIC STATISTICS ON IDB MEMBER COUNTRIES STATISTICAL MONOGRAPH NO. 25 ECONOMIC POLICY AND STRATEGIN PLANNING DEPARTMENT Rabi II 1426H (May 2005) PREFACE This 25 th
APEC. in Charts 2016 POLICY SUPPORT UNIT
 APEC in Charts 2016 POLICY SUPPORT UNIT Asia-Pacific Economic Cooperation (APEC) was established in 1989. The 21 Member Economies are Australia; Brunei Darussalam; Canada; Chile; China; Hong Kong, China;
Development Issues and Indicators
 Development Issues and Indicators 1 2 Budgetausgaben in % des BIP gesamter Staatshaushalt 60 50 40 30 20 10 Albanien Kroatien Montenegro Bosnien und Herzegowina Mazedonien Serbien 0 2000 2001 2002 2003
THE AFRICAN DEVELOPMENT BANK GROUP. At the centre of Africa s transformation
 THE AFRICAN DEVELOPMENT BANK GROUP At the centre of Africa s transformation African Development Bank Group At the centre of Africa s transformation The African Development Bank Group is a multilateral
Market Brief on Zambia
 Market Brief on Zambia Jan 2018 Location Facts and Figures Zambia is a landlocked country in Southern Africa, neighbouring the Democratic Republic of the Congo to the north, Tanzania to the north-east,
Part 2 Country/Economy Profiles and Data Presentation
 Part 2 Country/Economy Profiles and Data Presentation 2.1 Country/Economy Profiles How to Read the Country/Economy Profiles THIERRY GEIGER, Economist, World Economic Forum This section presents two-page
REPORT ON IMPLEMENTATION OF THE VIENNA PROGRAMME OF ACTION MARCH 2019
 REPORT ON IMPLEMENTATION OF THE VIENNA PROGRAMME OF ACTION 18-19 MARCH 2019 Name:COLATOR MAOKO Designation: DEPUTY DIRECTOR/ CHIEF ECONOMIST Organization: MINISTRY OF INDUSTRY AND COMMERCE Country: ZIMBABWE
From: OECD Tourism Trends and Policies Access the complete publication at: Chile
 From: OECD Tourism Trends and Policies 2014 Access the complete publication at: http://dx.doi.org/10.1787/tour-2014-en Chile Please cite this chapter as: OECD (2014), Chile, in OECD Tourism Trends and
What do regional trade reforms mean for Zambia?
 POLICY BRIEF What do regional trade reforms mean for Zambia? Based on the ZIPAR report What do the COMESA Customs Union and COMESA- EAC- SADC Tripartite Free Trade Area mean for Zambia s import trade and
AFSEC Workshop Johannesburg 27 March 2017
 Evah Oduor IEC-AFRC Director AFSEC Workshop Johannesburg 27 March 2017 INTERNATIONAL ELECTROTECHNICAL COMMISSION About the IEC Africa Quality Infrastructure IEC-AFRC Mission Recommendations Conclusion
CHINGOLA-SOLWEZI-JIMBE RAILWAY LINE
 From a landlocked to a land linked Zambia CHINGOLA-SOLWEZI-JIMBE RAILWAY LINE Presented by Ministry of Transport Works Supply and Communications and October 2013 Presented to PUBLIC-PRIVATE DIALOGUE FORUM
Status of Compilation of Tourism Satellite Accounts for India
 Status of Compilation of Tourism Satellite Accounts for India S V Ramana Murthy Deputy Director General Ministry of Statistics & Programme Implementation Email: svr.murthy@nic.in What are Satellite Accounts?
WORLD TRADE ORGANIZATION
 WORLD TRADE ORGANIZATION Trade Policy Review Body RESTRICTED 1 October 2007 (07-3988) Original: English TRADE POLICY REVIEW Report by SAINT KITTS AND NEVIS Pursuant to the Agreement Establishing the Trade
Zambia s Investment Opportunities
 Zambia s Investment Opportunities 1 Presented by: Charity Zulu-Mkandawire, First Secretary -Trade Embassy of the Republic of Zambia Washington DC 2 About Zambia Located in the Southern African Sub-region,
EXECUTIVE COUNCIL Twenty-Fifth Ordinary Session June 2014 Malabo, EQUATORIAL GUINEA EX.CL/862(XXV) Add.2 Original: English
 Add.2 Original: English") AFRICAN UNION UNION AFRICAINE UNIÃO AFRICANA Addis Ababa, ETHIOPIA P. O. Box 3243 Telephone: 517 700 Fax: 5130 36 website: www. www.au.int SC12404 EXECUTIVE COUNCIL Twenty-Fifth Ordinary Session 20 24
AFRICAN UNION UNION AFRICAINE UNIÃO AFRICANA Addis Ababa, ETHIOPIA P. O. Box 3243 Telephone: 517 700 Fax: 5130 36 website: www. www.au.int SC12404 EXECUTIVE COUNCIL Twenty-Fifth Ordinary Session 20 24
THE CARICOM REGIONAL IMPLEMENTATION PLAN
 THE CARICOM REGIONAL IMPLEMENTATION PLAN Presented at the First Regional Workshop on Ensemble Climate Modeling August 20-29, 2012 University of the West Indies, Mona, Jamaica By Joseph McGann, Programme
Market Brief on Tanzania
 Market Brief on Tanzania February 2017 Location Facts and Figures Total Population 50,7 million (2015) Tanzania is located in the African Great Lakes region on the East coast of the continent. It is bordered
1.0 Introduction Zambia s Major Trading Partners Zambia s Major Export Markets... 4
 Bank of Zambia CONTENTS 1.0 Introduction... 3 2.0 Zambia s Major Trading Partners... 3 3.0 Zambia s Major Export Markets... 4 4.0 Major Source Countries Of Zambia s Imports... 5 5.0 Direction Of Trade
1.0 Introduction Zambia s Major Trading Partners Zambia s Major Export Markets... 4
 Bank of Zambia CONTENTS 1.0 Introduction... 3 2.0 Zambia s Major Trading Partners... 3 3.0 Zambia s Major Export Markets... 4 4.0 Major Source Countries Of Zambia s Imports... 5 5.0 Direction Of Trade
From: OECD Tourism Trends and Policies Access the complete publication at: Mexico
 From: OECD Tourism Trends and Policies 2014 Access the complete publication at: http://dx.doi.org/10.1787/tour-2014-en Mexico Please cite this chapter as: OECD (2014), Mexico, in OECD Tourism Trends and
Market Brief on DRC. Jan Total Population million (2016) sq. km. International Telephone Code US$: 1,
 sq. km. International Telephone Code US$: 1,") Market Brief on DRC Jan 2018 Location Facts and Figures Total Population 84.13 million (2016) The Democratic Republic of the Congo, also known as DR Congo, DRC, DROC, RDC, Congo-, or simply Congo is a
Market Brief on DRC Jan 2018 Location Facts and Figures Total Population 84.13 million (2016) The Democratic Republic of the Congo, also known as DR Congo, DRC, DROC, RDC, Congo-, or simply Congo is a
Noted the efforts of the Secretariat to enhance the production of Social/ Gender Statistics and Indicators in the Region;
 5 PROGRESS OF WORK ON THE SOCIAL GENDER COMPONENT OF THE CARICOM PROGRAMME ON STRENGTHENING CAPACITY IN THE COMPILATION OF SOCIAL/GENDER AND ENVIRONMENT STATISTICS IN THE CARICOM 5.1. Establishment Of
THE AFRICAN DEVELOPMENT BANK GROUP. At the centre of Africa s transformation
 THE AFRICAN DEVELOPMENT BANK GROUP At the centre of Africa s transformation African Development Bank Group The African Development Bank Group is a multilateral development finance institution. It was established
ICAO/AFCAC Regional Symposium on Airport & Air Navigation Services Infrastructure Financing Maputo, Mozambique
 ICAO/AFCAC Regional Symposium on Airport & Air Navigation Services Infrastructure Financing Maputo, Mozambique 29 Nov 1 Dec 2010 Session 3: International Cooperation COMESA-EAC- SADC Tripartite Experience
SADC PPP Network PPPs in SADC
 SADC PPP Network PPPs in SADC Kogan Pillay Head: SADC PPP Network German Africa Investment Conference Munich December 6 th, 2013 SADC DFRC, Botswana What is the SADC PPP Network» Created by the Ministers
AIRLIFT STRATEGY PRESENTATION TO INDUSTRY GROWTH & SAFETY CONFERENCE: DATE: NOVEMBER 2014
 AIRLIFT STRATEGY PRESENTATION TO INDUSTRY GROWTH & SAFETY CONFERENCE: DATE: 04-06 NOVEMBER 2014 Table of Contents Section 1 Section 2 Section 3 Section 4 INTRODUCTION & EXECUTIVE SUMMARY OBJECTIVES MANDATE
Canadian Tourism Satellite Account Demystified
 Canadian Tourism Satellite Account Demystified Charles Morissette R & D Projects and Analysis Section Income and Expenditure Division Presentation for TTRA Conference October, 2010 Outline The economic
THE TWENTY SECOND SOUTHERN AFRICA REGIONAL CLIMATE OUTLOOK FORUM MID-SEASON REVIEW AND UPDATE
 STATEMENT FROM THE TWENTY SECOND SOUTHERN AFRICA REGIONAL CLIMATE OUTLOOK FORUM (SARCOF-22) MID-SEASON REVIEW AND UPDATE, CRESTA MAUN HOTEL, MAUN, BOTSWANA, 13 14 DECEMBER 2018. SUMMARY The bulk of the
PROMOTING INNOVATION AND TRADE IN HORTICULTURE 25-27th NOVEMBER 2015, KIGALI,RWANDA
 PROMOTING INNOVATION AND TRADE IN HORTICULTURE 25-27th NOVEMBER 2015, KIGALI,RWANDA FACTS AND FIGURES Introduction The Common Market for Eastern and Southern Africa was formed in 1994 as it replaced the
Presented by: Ms. Kanageswary Ramasamy Department of Statistics, Malaysia February 2017
 Presented by: Ms. Kanageswary Ramasamy Department of Statistics, Malaysia 14-16 February 2017 1 INTRODUCTION 2 HISTORICAL DEVELOPMENT OF TOURISM SATELLITE ACCOUNT 3 THE IMPORTANCE OF TOURISM SATELLITE
Ibrahim Index of African Governance SUB-CATEGORY INSIGHTS RULE OF LAW MO IBRAHIM FOUNDATION
 2015 Ibrahim Index of African Governance SUB-CATEGORY INSIGHTS RULE OF LAW MO IBRAHIM FOUNDATION Contents Rule of Law within the IIAG Rule of Law Key Findings Rule of Law Spotlight > Country and group
Chile. Tourism in the economy. Tourism governance and funding
 Chile Tourism in the economy Tourism in Chile has experienced a sustained rise in recent years and has become one of the sectors delivering the fastest growth and employment generation. It has been estimated
International economic context and regional impact
 Contents I. GDP growth trends in Latin America and the Caribbean in 2012 II. Regional performance in 2012: Inflation, employment and wages External sector Policies: Fiscal and Monetary III. Conclusions
Estonia. Tourism in the economy. Tourism governance and funding
 Estonia Tourism in the economy Tourism contributes directly around 4.6% of Estonia s GDP, rising to 6.6% if indirect impacts are also included. Export revenues from tourism amount to approximately EUR
Article: Quarterly Bulletin
 Article: Quarterly Bulletin December 1998 South African Reserve Bank South Africa in the finance and investment sector of the Southern African Development Community (SADC) 1. Introduction by W. Brümmerhoff
10 reasons to invest in France February 2012 IFA
 10 reasons to invest in France February 2012 IFA 1 France: A global economic power The 2 nd largest economic power in the European Union. Source: IMF, 2011 The world s 6 th largest exporter of goods and
Africa in 2018 What to expect
 Africa in 218 What to expect A presentation to the Norwegian African Business Association (NABA) January 218 Roy Mutooni, CFA, MBA (Tel: + 27 () 11 243-44, roy.mutooni@abam.com) African Growth: Cyclically
Tanzania s Transport Hub: What Prospects for Regional Integration and Investment? 22 NOVEMBER 2016, JOHANNESBURG, CHELSEA MARKOWITZ
 Tanzania s Transport Hub: What Prospects for Regional Integration and Investment? 22 NOVEMBER 2016, JOHANNESBURG, CHELSEA MARKOWITZ OUTLINE 1. Current Condition of Transport Infrastructure in Tanzania
Swaziland. Sugar Annual. The supply and demand of sugar in Swaziland
 THIS REPORT CONTAINS ASSESSMENTS OF COMMODITY AND TRADE ISSUES MADE BY USDA STAFF AND NOT NECESSARILY STATEMENTS OF OFFICIAL U.S. GOVERNMENT POLICY Required Report - public distribution Date: GAIN Report
South Australian Centre for Economic Studies June 2016 Economic Briefing Report 28 June, 2016
 Steve Whetton, Executive Director, SA Centre for Economic Studies South Australian Centre for Economic Studies June 216 Economic Briefing Report 28 June, 216 Per cent Global GDP Growth 1 8 Developing Countries
SUB-SAHARAN AFRICA (2): POPULATION AND SETTLEMENT GEOGRAPHY
: POPULATION AND SETTLEMENT GEOGRAPHY") SUB-SAHARAN AFRICA (2): POPULATION AND SETTLEMENT GEOGRAPHY 1. Introduction 2. Demographics: population growth and AIDS 3. Rural settlement patterns 4. Urban structures 5. Globalization and Africa: the
SUB-SAHARAN AFRICA (2): POPULATION AND SETTLEMENT GEOGRAPHY 1. Introduction 2. Demographics: population growth and AIDS 3. Rural settlement patterns 4. Urban structures 5. Globalization and Africa: the
Commercial Exchange Rate
 Commercial Exchange Rate Real (R$) / US dollar (US$), daily report R$ / US$ 4.5 4 3.5 3 2.5 2 1.5 1 25 26 27 28 29 2 211 212 213 214 215 216 Source: Central Bank of Brazil (Banco Central do Brasil, Sistema
WHY AFRICA? BY BENOIT LA SALLE December 2014
 WHY AFRICA? BY BENOIT LA SALLE December 2014 AFRICA IS THE FUTURE 2 1950 1960 1970 1980 1990 2000 2010 2020 2030 2040 2050 2060 2070 2080 2090 2100 (THOUSANDS) WORKING-AGE POPULATION WORLDWIDE 7 000 000
 10 to 24 year olds as proportion of total population in this Population aged group of countries, Region 10 to 24 years per cent Least developed countries 274,842,000 32.2 Less developed regions 1,595,761,000
BOTSWANA AGRICULTURAL CENSUS REPORT 2015
 BOTSWANA AGRICULTURAL CENSUS REPORT 2015 STATISTICS BOTSWANA BOTSWANA AGRICULTURAL CENSUS REPORT 2015 1 BOTSWANA AGRICULTURAL CENSUS REPORT 2015 2 BOTSWANA AGRICULTURAL CENSUS REPORT 2015 BOTSWANA AGRICULTURAL
Asia-Pacific Trade Briefs: New Zealand
 i Asia-Pacific Trade Briefs: New Zealand Merchandise Trade New Zealand has a trade-to-gdp ratio of 51.96%. Merchandise trade accounted for 73.1% of New Zealand's total trade in 2017. New Zealand's merchandise
GALVmed / OIE Stakeholder Workshop on harmonisation of registration requirements for Veterinary Medicinal Products
 GALVmed / OIE Stakeholder Workshop on harmonisation of registration requirements for Veterinary Medicinal Products Johannesburg, 9-11 May 2017 Gillian Cowan 2. Results of Survey on Current Status of Veterinary
Indonesia. Market overview. Opportunities and challenges. Jakarta. Austrade in Indonesia
 INDONESIA Indonesia Market overview Indonesia is an emerging economic force. After India and China, Indonesia is the world s fastest growing consumer market. GDP reached US$1.2 trillion in 2012 and is
APEC. in Charts Policy Support Unit
 APEC in Charts 2018 Policy Support Unit Asia-Pacific Economic Cooperation (APEC) was established in 1989. The 21 Member Economies are Australia; Brunei Darussalam; Canada; Chile; China; Hong Kong, China;
International Conference on Promoting Sustainable Tourism, a tool for inclusive growth and community engagement in Africa
 International Conference on Promoting Sustainable Tourism, a tool for inclusive growth and community engagement in Africa LUSAKA, ZAMBIA 16-18 NOVEMBER 2017 GENERAL INFORMATION NOTE 1 P a g e The International
THE TWENTY FIRST ANNUAL SOUTHERN AFRICA REGIONAL CLIMATE OUTLOOK FORUM
 STATEMENT FROM THE TWENTY FIRST ANNUAL SOUTHERN AFRICAN REGIONAL CLIMATE OUTLOOK FORUM (SARCOF-21), MASA CONFERENCE CENTRE, GABORONE, BOTSWANA, 23 25 AUGUST 2017. SUMMARY The bulk of Southern African Development
Presented by Matti Amukwa Chairman Confederation of Namibian Fishing Associations November 2012
 Presented by Matti Amukwa Chairman Confederation of Namibian Fishing Associations November 2012 European Commission Regional Seminar on the EU- SADC Economic Partnership Agreement in Botswana, 14-15 November
Outlıne of the Presentatıon
 Outlıne of the Presentatıon Background and Objectives What has been achieved National Perspective Regional Perspective Estimated Financing Requirements What is Needed Chingola-Solwezi-Jimbe Railway Line
CONTENTS Executive Summary... iii 1. Introduction Major Destinations for Zambia s Exports Major Source Countries for Zambia s
 Bank of Zambia CONTENTS Executive Summary... iii 1. Introduction... 1 2. Major Destinations for Zambia s Exports... 1 3. Major Source Countries for Zambia s Imports... 4 4. Conclusion... 6 ii Executive