Key Indicators for South Sudan
|
|
|
- Augustine Barnett
- 5 years ago
- Views:
Transcription
1 Key Indicators for South Sudan National Bureau of Statistics Fast Facts Total Population of South Sudan is 8.26 million Total Area of South Sudan is 644,329 sq. km More than half (51%) of the population is below the age of eighteen. 72% of the population is below the age of thirty 83% of the population is rural 27% of the adult population is literate 51% of the population live below the poverty line 78% of households depend on crop farming or animal husbandry as their primary source of livelihood 69% of the population has access to improved sources of drinking water Introduction On 9th July 2011 the Republic of South Sudan became the world s newest country when it seceded from Sudan following an historic referendum on self-determination that took place in January South Sudan is bordered by Sudan to the North, Ethiopia to the east, Kenya, Uganda, and the Democratic Republic of the Congo to the south, and the Central African Republic to the west. South Sudan consists of ten states. Its capital city is Juba, in Central Equatoria State. In the key transitional period following independence, it is vital to ensure that the latest data is widely disseminated and put to the best possible use. This document is intended as a quick reference to available statistical information on South Sudan. Additional information on all the included indicators as well as others are available on or on request from the NBS. We hope that it will serve its purpose of being an introduction to the most up-to-date statistics available for government, policy makers, the international community and all those who are interested in South Sudan. Population Pyramid (Percent) to 94 Male Female 85 to to to to to to to to to to to to to to to to 14 5 to 9 0 to
2 Chad SOUTH SUDAN COUNTIES KM Western Bahr el Ghazal Aweil Northern Bahr el Ghazal Kuajok Wau Unity Bentiu Sudan N Upper Nile Malakal State Capital Abyei State Boundary County Boundary International Boundary Ethiopia C.A.R Rumbek Geographic Coordinate System: GCS_WGS_1984 Datum: D_WGS_1984 Data Sources States and Counties NBS (version 2) 5th Sudan Population and Household Census 2008 Abyei boundary: Permanent court of Arbitration. The administrative boundaries and names shown on this map do not imply acceptance or recognition by the Government of The Republic of South Sudan. They are shown for census and statistical purposes only. D.R.C Western Equatoria Yambio Bor Juba Central Equatoria Torit Eastern Equatoria Kenya Copyright 2011 National Bereau of statistics: GIS, Remote sensing and carthography Department Uganda Chad SOUTH SUDAN TOTAL POPULATION KM N Sudan State Capital State Boundary International Boundary Total Population Western Bahr el Ghazal Northern Bahr el Ghazal Unity Upper Nile C.A.R Geographic Coordinate System: GCS_WGS_1984 Datum: D_WGS_1984 Data Sources University of Bern CDE States and Counties NBS (version 2) 5th Sudan Population and Household Census 2008 Abyei boundary: Permanent court of Arbitration. The administrative boundaries and names shown on this map do not imply acceptance or recognition by the Government of The Republic of South Sudan. They are shown for census and statistical purposes only. D.R.C Western Equatoria Central Equatoria Eastern Equatoria Kenya Ethiopia Copyright 2011 National Bureau of statistics: GIS, Remote sensing and carthography Deprtment Uganda 2 Key Indicators for South Sudan
3 National Bureau of Statistics National Bureau of Statistics (NBS) is the official statistical agency of the Government of South Sudan. It is mandated to collect, analyse and disseminate all official economic, social and demographic statistics. Under the provisions of the CPA and the Interim Constitution of South Sudan, NBS was assigned responsibility for conducting the South Sudan section of the 5th Sudan Population and Housing Census in While the 2008 Census remains the largest undertaking by the NBS, it has carried out other large nationally representative surveys, most notably the 2006 and 2010 rounds of the Sudan Household Health Survey (SHHS) and the National Baseline Household Survey (NBHS), Population The population of South Sudan was 8.26 million in the 2008 Census. Of this 4.29 million are male, and 3.97 million are female. The population is a very young one, with 16% of the population under the age of 5, 32% under the age of 10, 51% under the age of 18 and 72% of the population under the age of 30. There is a wide variation in the population between states, with being the most populous at 1,358,602 people and 16% of the total population. The least populous is Western Bahr El Ghazal, with 333,431 and 4% of the total population. The average number of members in a private household in South Sudan is 7. The population is largely rural with 83% residing in rural areas. This varies widely between states with 92% of the population in Northern Bahr El Ghazal classified as rural, compared to 57% in Western Bahr El Ghazal. The population density in South Sudan is 13/sq. km, which is less than one tenth of Uganda, where the density is 136/sq. km. Source: 5th Population and Housing Census (2008) Population by State (Thousands) Upper Nile Unity N.B.G W.B.G W. Equatoria C. Equatoria E. Equatoria Key Indicators for South Sudan 3
4 Chad MAJOR RIVERS AND WATERBODIES KM Sudan N Western Bahr el Ghazal Northern Bahr el Ghazal Aweil Kuajok Unity Bentiu Upper Nile Malakal Ethiopia Wau C.A.R Rumbek Geographic Coordinate System: GCS_WGS_1984 Datum: D_WGS_1984 Data Sources University of Bern CDE States NBS (version 2) Rivers: FAO 5th Sudan Population and Household Census 2008 Abyei boundary: Permanent court of Arbitration. The administrative boundaries and names shown on this map do not imply acceptance or recognition by the Government of The Republic of South Sudan. They are shown for census and statistical purposes only. D.R.C Western Equatoria Yambio Bor Juba Central Equatoria Torit Eastern Equatoria Kenya Copyright 2011 National Bureau of statistics: GIS, Remote sensing and carthography Deprtment Uganda Chad SOUTH SUDAN ROAD NETWORK KM Western Bahr el Ghazal Northern Bahr el Ghazal Aweil Kuajok Wau Unity Bentiu Sudan N Upper Nile Malakal Geographic Coordinate System: GCS_WGS_1984 Datum: D_WGS_1984 Data Sources University of Bern CDE States NBS (version 2) Roads: UNJLC 5th Sudan Population and Household Census 2008 Abyei boundary: Permanent court of Arbitration. The administrative boundaries and names shown on this map do not imply acceptance or recognition by the Government of The Republic of South Sudan. They are shown for census and statistical purposes only. Ethiopia C.A.R State Capital Abyei State Boundary Rumbek Bor County Boundary International Boundary Roads CLASS Primary Western Equatoria Yambio Juba Central Equatoria Torit Eastern Equatoria Secondary Tertiary D.R.C Copyright 2011 National Bureau of statistics: GIS, Remote sensing and carthography Deprtment Uganda Kenya 4 Key Indicators for South Sudan
5 The Government Central government expenditure (including transfers to the states) in 2010 was 5.76 billion SDG. Of this, 2.21 billion SDG was salaries, 2.28 billion SDG was operating costs and 1.09 billion SDG was capital expenditure. GOSS revenue, by sources Customs, VAT and other National Revenue 0.5 % Personal Income Tax 1.1 % Oil revenues % Other GOSS Revenue 0.7 % * The 2011 Budget was constructed for January to December A new financial year began on 9th July 2011, running to 30th June Figures for 2011/12 are not yet available. Source: Ministry of Finance and Economic Planning. GOSS Expenditure by Sector, 2010 Block transfers to states 10 % Humanitarian affairs 1 % Security 28 % Rule of law 12 % Accountability 10 % Economic Functions 3 % Education 5 % Health 2 % Infrastructure 11 % Natural Resources 3 % Public Administration 15 % * The 2011 Budget was constructed for January to December A new financial year began on 9th July 2011, running to 30th June Figures for 2011/12 are not yet available. Source: Ministry of Finance and Economic Planning. Donor and government expenditure by sector (USD) Donor Government Education Accountability Economic Functions Infrastructure Health Natural Resources Public Administration Rule of law Security Humanitarian affairs 1 Government spending in SDG converted at the average official exchange rate prevailing in 2010 Source: Ministry of Finance and Economic Planning. Key Indicators for South Sudan 5
6 6 Key Indicators for South Sudan

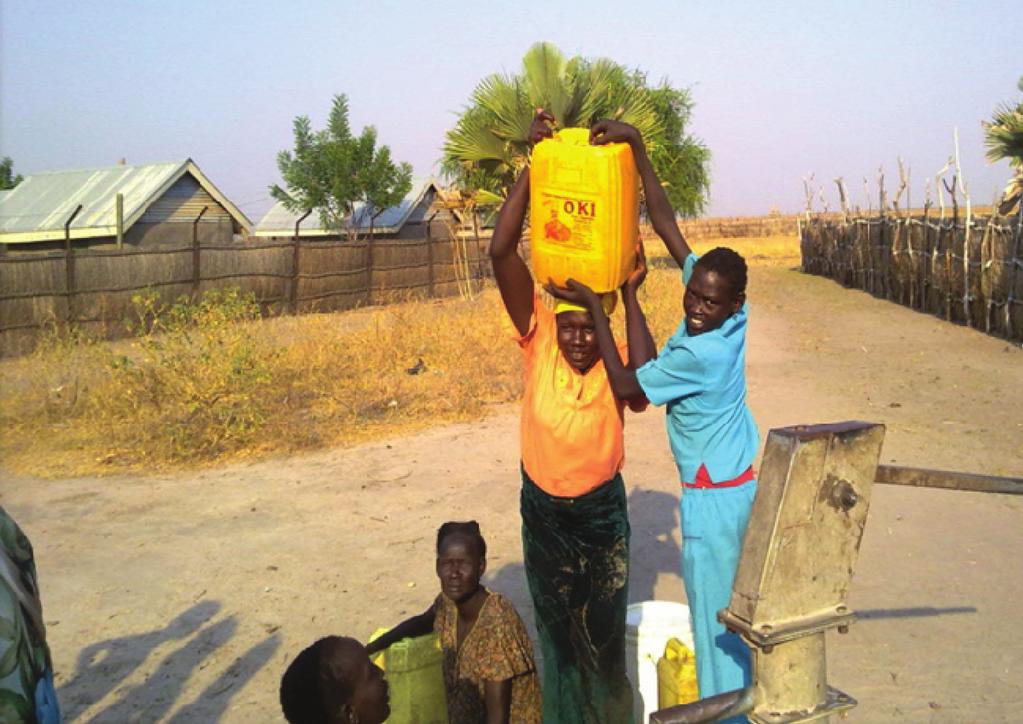
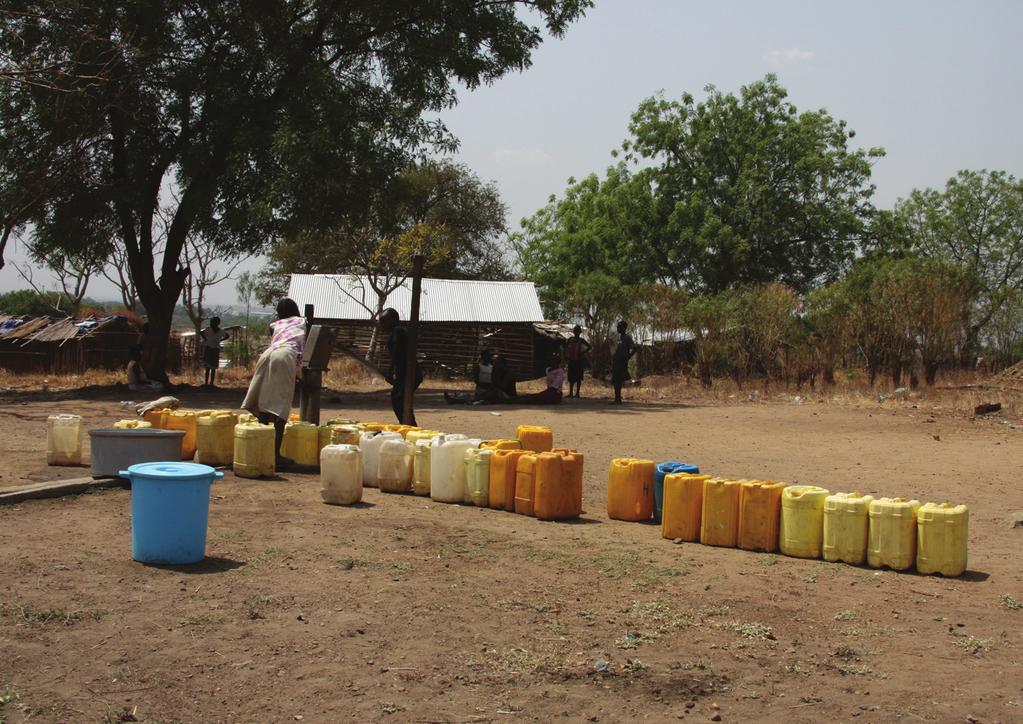
7 Water, Health and Sanitation 69% of the population has access to improved sources of drinking water. 73% of the urban population has access to improved sources of drinking water compared with 67% of the rural population. 52% of households own at least one mosquito net and 34% own at least one long-lasting treated net. 7% of households have access to improved sanitation. Infant mortality rate is 75 (per 1,000 live births). Under 5 mortality rate is 105 (per 1,000 live births). 6% of children aged months are fully immunized. 28% of children under 5 are moderately or severely underweight. Source: Sudan Household Health Survey II (2010) Maternal mortality rate is 2,052 per 1,000 live births Source: Sudan Household Health Survey (2006) 47% of the population is food-deprived Source: National Baseline Household Survey (2009) Household Characteristics 83% of the population live in tukuls. 38% of the population has to walk for more than 30 minutes one way to collect drinking water. 50% of the population use firewood or grass as the primary source of lighting. 27% have no lighting at all. 96% of the population uses firewood or charcoal as the primary fuel for cooking. 15% of households own a phone. This increases to 59% in urban areas compared to 8% in rural areas. Source: National Baseline Household Survey (2009) Nutritional status of children under age 5 by state Percent of population affected Upper Nile Unity Northern Bahr El Ghazal Western Bahr El Ghazal Western Equatoria Central Equatoria Eastern Equatoria Stunting (height for age) Underweight (weight for age) Wasting (weight for height) Key Indicators for South Sudan 7
 EMIS-2010 5th Sudan Population and Household Census 2008 Abyei boundary:")
8 Chad PRIMARY NET ENROLMENT RATE BY STATES KM Western Bahr el Ghazal 54.9 Northern Bahr el Ghazal Unity 53.3 Sudan N Upper Nile 53.6 Geographic Coordinate System: GCS_WGS_1984 Datum: D_WGS_1984 Data Sources University of Bern CDE States NBS (version 2) EMIS th Sudan Population and Household Census 2008 Abyei boundary: Permanent court of Arbitration. The administrative boundaries and names shown on this map do not imply acceptance or recognition by the Government of The Republic of South Sudan. They are shown for census and statistical purposes only. Ethiopia 46.7 C.A.R State Capital State Boundary 42.9 International Boundary Net Enrolment Rate Percentage Western Equatoria Central Equatoria Eastern Equatoria D.R.C Copyright 2011 National Bureau of statistics: GIS, Remote sensing and carthography Deprtment Uganda Kenya School Attendance by Age 8 Key Indicators for South Sudan

9 Education 27% of the 15 years and above population is literate. The literacy rate for males is 40% compared to 16% for females. 53% of the urban adult population is literate, compared to 22% of the rural adult population. 40% of the population between is literate. The literacy rate for males in this age group is 55% compared to 28% for females. Source: National Baseline Household Survey (2009) The Gross Enrolment Rate for primary school in 2009 is 72%. The Net Enrolment Rate (NER) for primary school in 2009 is 48%. The NER is highest in Upper Nile at 60% and lowest in Eastern Equatoria at 37%. The gross intake rate was 66% compared to the net intake rate of 14.9% for Primary 1. Source: National Educational Statistical Booklet, EMIS, Ministry of Education (2009) Literacy by Age Groups (Per cent) Age Groups Panyagoor Primary School. Only 37% of the population above the age of 6 has ever attended school. In 2009 there were 52 students per teacher. In 2009 there were 129 students per classroom. Key Indicators for South Sudan 9

10 Poverty and Consumption Average per capita consumption in South Sudan is 100 Sudanese Pounds (SDG) per person per month. The average consumption of the poor is 39 SDG per person per month compared to 163 SDG per person per month for the non poor. Average consumption in urban areas is 168 SDG per person per month compared to 88 SDG per person per month in rural areas. 51% of the population is below the poverty line. This varies greatly depending on place of residence, with 55% of the population in rural areas classified as poor, compared to 24% in urban areas. Northern Bahr El Ghazal has the highest rate of poverty at 76%, and Upper Nile the lowest, at 26%. The Gini coefficient for South Sudan is 46. Source: Poverty in South Sudan: Estimates from NBHS (2010) Poverty by State 10 Key Indicators for South Sudan
11 Economic and Business Activity Gross Domestic Product (GDP) of South Sudan was 30.5 billion SDG (13.2 billion USD) in GDP per capita was 3,564 SDG (1,546 USD). Value of oil production was 21.7 billion SDG, or 71% of GDP Source: NBS GDP estimates (2011) Cereal production in 2011 was 563,000 tonnes. Source: Crop and Food Security Assessment Mission Report (2012) 4% of the total land in South Sudan is used for agricultural production Source: Land Use Cover Database (2011) 78% of households depend on crop farming or animal husbandry as their primary source of livelihood. 1% of households in South Sudan have a bank account. 18% of households have borrowed money from some source. Source: National Baseline Household Survey (2009) 53% of the working population in South Sudan were unpaid family workers. 12% were paid employees. Source: Census Long Form Questionnaire (2008) There are a total of 7,333 formal businesses in the ten state capitals of South Sudan. 84% of these businesses are shops or restaurants. Torit had the least with 259, and Juba the most with Source: Business Survey Listing (2010) Number of businesses by state capital Malakal Bor Bentiu Kuajok Aweil Wau Rumbek Yambio Juba Torit Source: Business Survey Listing, Key Indicators for South Sudan 11
 Monthly CPI for Juba (2007-Present) South Sudan Livelihood Profiles (2008) Census Priority Results (2009) South Sudan")
12 SSCCSE data collection. List of Major Publications South Sudan Household Health Survey Report (2006) Monthly CPI for Juba (2007-Present) South Sudan Livelihood Profiles (2008) Census Priority Results (2009) South Sudan Statistical Yearbook (2009, 2010 and 2011) Poverty in South Sudan: Estimates from NBHS (2010) South Sudan Counts: Tables from the 5th Population and Housing Census (2011) National Baseline Household Survey 2009: Report for South Sudan (2012) Reports can be downloaded from the NBS webpage National Bureau of Statistics (NBS) P.O. Box 137 Juba Tel: or June 2012 Design: HN Photos: NBS/Statiscs Norway 12 Key Indicators for South Sudan
July 2014 Volume 6. Figure 1: Main Staple Food Commodities Informally Traded Across Selected Borders in Eastern Africa Between January and June 2014
 July 2014 Volume 6 Figure 1: Main Staple Food Commodities Informally Traded Across Selected Borders in Eastern Africa Between January and June 2014 The Market Analysis Sub-group of the Food Security and
Millennium Development Goal 1: eradicate extreme poverty and hunger. International poverty line a Share of population below PPP $1.
 3.1 Millennium Development Goal 1: eradicate extreme poverty and hunger International poverty line a Share of population below PPP $1.25 a day Poverty gap ratio at PPP $1.25 a day Share of population below
ISRAEL- COUNTRY FACTS
 ISRAEL- COUNTRY FACTS ISRAEL-NEIGHBOURING COUNTRIES AND POLITICAL MAP Area: 22,072 sq. km Land area: 21,643 sq. km. Fast Facts Area of lakes: 429 sq. km. (Sea of Galilee 164 sq. km., the Dead Sea - 265
Structure. Introduction
 1 Introduction Structure Demographic Dynamics in Africa Determinants of the Demographic Transition Human Development Payoffs Jobs Payoffs Economic Growth in Africa Policies to Speed up the Demographic
COUNTRY CASE STUDIES: OVERVIEW
 APPENDIX C: COUNTRY CASE STUDIES: OVERVIEW The countries selected as cases for this evaluation include some of the Bank Group s oldest (Brazil and India) and largest clients in terms of both territory
Swaziland. HDI values and rank changes in the 2013 Human Development Report
 Human Development Report 2013 The Rise of the South: Human Progress in a Diverse World Explanatory note on 2013 HDR composite indices Swaziland HDI values and rank changes in the 2013 Human Development
TABLE OF CONTENTS COUNTRY FOCUS: ALGERIA
 Africa Statistics Flash Selected Socio-Economic Indicators on Africa May 218 TABLE OF CONTENTS COUNTRY FOCUS: ALGERIA ---------------------------------------------------------------------------------------------
Table of CONTENTS. COUNTRY FOCUS: United Republic of Tanzania
 Africa Statistics Flash Selected Socio-Economic Indicators on Africa December 216 Table of CONTENTS COUNTRY FOCUS: United Republic of Tanzania ------------------------------------------------------------
Poverty eradication means doubling the lowest household incomes globally in just 15 years after they have stagnated for the last years
 $ per person per day (2005 PPP) 1.4 Estimated Global Consumption Floor, 1981-2011, and 2030 Target 1.2 1 0.8 0.6 0.4 0.2 Pre- MDGs MDGs SDGs $1.25-a-day basis $1.00-a-day basis Poverty eradication means
Table of CONTENTS. COUNTRY FOCUS: Equatorial Guinea
 Africa Statistics Flash Selected Socio-Economic Indicators on Africa August 217 Table of CONTENTS COUNTRY FOCUS: Equatorial Guinea ---------------------------------------------------------------------------
2nd Quarter. AEDC is pleased to present the Anchorage Quarterly Economic Indicators Report for the second quarter of 2010.
 2010 AEDC is pleased to present the Anchorage Quarterly Economic Indicators Report for the second quarter of 2010. This report summarizes recently updated data from the Anchorage Economic Indicators Database,
Regional outlook Sub-Saharan Africa 24/11/2015. Share commodities in good exports. Share commodities in goods imports
 Table 1: Economic structure indicators Number of Inhabitants (m.) Size of the economy (in USD bn.) Size of the economy (% of world GDP) Share commodities in good exports Share commodities in goods imports
TABLE OF CONTENTS COUNTRY FOCUS: BENIN
 Africa Statistics Flash Selected Socio-Economic Indicators on Africa March 218 TABLE OF CONTENTS COUNTRY FOCUS: BENIN ------------------------------------------------------------------------------------------------
Table of CONTENTS. COUNTRY FOCUS: Tunisia
 Africa Statistics Flash Selected Socio-Economic Indicators on Africa October 217 Table of CONTENTS COUNTRY FOCUS: Tunisia ----------------------------------------------------------------------------------------------
OILS AND FATS IN EAST AFRICA REGION
 OILS AND FATS IN EAST AFRICA REGION ASSESSMENT, TRENDS & OPPORTUNITIES R. Vijayraghavan, CEO East Coast Oils & Fats Limited Tanzania East Africa Africa is the world's second-largest and second-most-populous
GOAL. Achieve gender equality and empower all women and girls NATURE COUNT$ How do ecosystems and biodiversity support this SDG?
 NATURE COUNT$ GOAL 5 Achieve gender equality and empower all women and girls Photo: UNDP Afghanistan/Robert Few SDG 5 promotes equality between men and women through the elimination of discrimination,
Where are the poor: Region and District Poverty Estimates for Tanzania, 2012
 Where are the poor: Region and District Poverty Estimates for Tanzania, 2012 Blandina Kilama bkilama@repoa.or.tz SK Conference Room, Umoja House Building, Ground Floor 30 June 2016 Outline Overview Population,
United Nations Joint Logistics Centre Sudan Light Vehicle Convoy from Khartoum to Juba April 2007
 UNJLC South Sudan Office OCHA-AFEX Compound Juba, South Sudan United Nations Joint Logistics Centre Sudan Light Vehicle Convoy from Khartoum to Juba April 2007 Introduction: In April of 2007, UNJLC organized
HCPI COMESA Monthly News Release
 HCPI COMESA Monthly News Release Is sue No. 84 March 2018 Common Market for Eastern and Southern Africa (COMESA) Macroeconomic Indicators COMESA region annual inflation rate stood at 19.4% in March 2018
East African Community Facts and Figures 2014
 The East African Community EAC IRC Repository http://repository.eac.int 1. EAC Secretariat Reports/Publications 2014-09 East African Community Facts and Figures 2014 EAC EAC http://hdl.handle.net/11671/219
Energy Poverty in Africa
 African Energy Commission (AFREC) Paper on Energy Poverty in Africa By Dr. Gilbert NZOBADILA Consultant Energy Policy- AFREC 1 1- Introduction: African background : The African Energy Commission (AFREC)
SUB-SAHARAN AFRICA (2): POPULATION AND SETTLEMENT GEOGRAPHY
: POPULATION AND SETTLEMENT GEOGRAPHY") SUB-SAHARAN AFRICA (2): POPULATION AND SETTLEMENT GEOGRAPHY 1. Introduction 2. Demographics: population growth and AIDS 3. Rural settlement patterns 4. Urban structures 5. Globalization and Africa: the
SUB-SAHARAN AFRICA (2): POPULATION AND SETTLEMENT GEOGRAPHY 1. Introduction 2. Demographics: population growth and AIDS 3. Rural settlement patterns 4. Urban structures 5. Globalization and Africa: the
From: OECD Tourism Trends and Policies Access the complete publication at: Chile
 From: OECD Tourism Trends and Policies 2014 Access the complete publication at: http://dx.doi.org/10.1787/tour-2014-en Chile Please cite this chapter as: OECD (2014), Chile, in OECD Tourism Trends and
 10 to 24 year olds as proportion of total population in this Population aged group of countries, Region 10 to 24 years per cent Least developed countries 274,842,000 32.2 Less developed regions 1,595,761,000
Introduction to Investment Opportunities by His Excellency The Minister of Commerce, Industry and Investment
 Introduction to Investment Opportunities by His Excellency The Minister of Commerce, Industry and Investment Investment Seminar : Juba, South Sudan 10 October 2011 Presentation Overview South Sudan The
HIGH-END ECOTOURISM AS A SUSTAINABLE LAND USE OPTION IN RURAL AFRICA:
 HIGH-END ECOTOURISM AS A SUSTAINABLE LAND USE OPTION IN RURAL AFRICA: THE ROLE OF EMPLOYMENT IN POVERTY REDUCTION & SOCIAL WELFARE Sue Snyman, March 2011 sues@wilderness.co.za INTRODUCTION Rural Communities
Africa at a glance. Annual real GDP growth ( average): 4.97% Official development assistance (2010): $48 billion
: 4.97% Official development assistance (2010): $48 billion") Africa at a glance Population (212): 1,38 million Annual real GDP growth (25-212 average): 4.97% Official development assistance (21): $48 billion Net foreign direct investment (211): $43 billion Sources:
Africa at a glance Population (212): 1,38 million Annual real GDP growth (25-212 average): 4.97% Official development assistance (21): $48 billion Net foreign direct investment (211): $43 billion Sources:
THE MOST AND LEAST CHILD-FRIENDLY GOVERNMENTS IN AFRICA
 The Most and Least Child-friendly Governments in Africa 5 THE MOST AND LEAST CHILD-FRIENDLY GOVERNMENTS IN AFRICA We must put the best interests of children at the heart of all political and business decision-making,
The Economic Impact of Tourism on the District of Thanet 2011
 The Economic Impact of Tourism on the District of Thanet 2011 Prepared by: Tourism South East Research Unit 40 Chamberlayne Road Eastleigh Hampshire SO50 5JH CONTENTS 1. Summary of Results 1 2. Table of
Islamic Development Bank
 Islamic Development Bank KEY SOCIO-ECONOMIC STATISTICS ON IDB MEMBER COUNTRIES STATISTICAL MONOGRAPH NO. 25 ECONOMIC POLICY AND STRATEGIN PLANNING DEPARTMENT Rabi II 1426H (May 2005) PREFACE This 25 th
Provincial Review 2016: KwaZulu-Natal KwaZulu-Natal
 Provincial Review 2016: KwaZulu-Natal KwaZulu-Natal KwaZulu-Natal has a strong role in South Africa s manufacturing and agriculture, and has its largest port and main North-South freight corridor. Its
Provincial Review 2016: Limpopo
 Provincial Review 2016: Limpopo Limpopo s growth since 2003 has been dominated by the mining sector, especially platinum, and by national construction projects. As a result, the provincial economy grew
Annex III: Statistics
 Annex III: Statistics Table A.3.1 Physical characteristics of Arab countries Country Area, 2011 (thousand square kilometres) Length of coast, 2005 (kilometres) Rainfall, 2002 (millimetres per year) Total
SADC SELECTED ECONOMIC AND SOCIAL INDICATORS, 2016
 SADC SELECTED ECONOMIC AND SOCIAL INDICATORS, 2016 1. INTRODUCTION This report is an attempt to provide data series and a brief trend analysis of the major socio-economic characteristics of SADC region
Former Yugoslav Republic of Macedonia (FYROM)
") Former Yugoslav Republic of Macedonia (FYROM) Tourism in the economy Tourism directly contributed MKD 6.4 billion or 1.3% of GDP in 2013, and accounted for 3.3% of total employment. Estimates for 2014
Former Yugoslav Republic of Macedonia (FYROM) Tourism in the economy Tourism directly contributed MKD 6.4 billion or 1.3% of GDP in 2013, and accounted for 3.3% of total employment. Estimates for 2014
Development Impacts of the GMS East- West Economic Corridor (EWEC) on Savannakhet Province of Lao PDR
 on Savannakhet Province of Lao PDR") Disclaimer: The views expressed in this article are those of the author and do not necessarily reflect the views and policies of the Asian Development Bank, or its Board of Governors or the governments
Disclaimer: The views expressed in this article are those of the author and do not necessarily reflect the views and policies of the Asian Development Bank, or its Board of Governors or the governments
Czech Republic. Tourism in the economy. Tourism governance and funding
 Czech Republic Tourism in the economy Tourism s share of GDP in the Czech Republic has been increasing over the last two years from 2.7% in 2012 to 2.9 % in 2013. The number of people employed in tourism
From: OECD Tourism Trends and Policies Access the complete publication at: Mexico
 From: OECD Tourism Trends and Policies 2014 Access the complete publication at: http://dx.doi.org/10.1787/tour-2014-en Mexico Please cite this chapter as: OECD (2014), Mexico, in OECD Tourism Trends and
Tourism in South Africa A statistical overview
 Tourism in South Africa A statistical overview Purpose of presentation Purpose of the presentation is to present different tourism statistics produced by Stats SA People like to travel we are a country
China Interests in Sub-Saharan Africa. Economic and Political Interests between the Growing Superpower and Continent
 China Interests in Sub-Saharan Africa Economic and Political Interests between the Growing Superpower and Continent China s Current Situation Rapidly growing economy o GDP growth rate ~10% in last 3 decades
Aqqaba Village Profile
 Aqqaba Village Profile Produced by The Applied Research Institute - Jerusalem In cooperation with Funded by February, 2006 This document has been produced with the financial assistance of the European
Economic Impact Analysis. Tourism on Tasmania s King Island
 Economic Impact Analysis Tourism on Tasmania s King Island i Economic Impact Analysis Tourism on Tasmania s King Island This project has been conducted by REMPLAN Project Team Matthew Nichol Principal
Estonia. Tourism in the economy. Tourism governance and funding
 Estonia Tourism in the economy Tourism contributes directly around 4.6% of Estonia s GDP, rising to 6.6% if indirect impacts are also included. Export revenues from tourism amount to approximately EUR
Commercial Exchange Rate
 Commercial Exchange Rate Real (R$) / US dollar (US$), daily report R$ / US$ 4.5 4 3.5 3 2.5 2 1.5 1 25 26 27 28 29 2 211 212 213 214 215 216 Source: Central Bank of Brazil (Banco Central do Brasil, Sistema
Bardala village profile
 Bardala village profile Produced by The Applied Research Institute - Jerusalem In cooperation with Funded by February, 2006 This document has been produced with the financial assistance of the European
OFFICIAL DEVELOPMENT ASSISTANCE PROFILE. East Africa Region
 OFFICIAL DEVELOPMENT ASSISTANCE PROFILE East Africa Region MARCH 2017 Introduc on This profile gives an analysis of the trends in ODA for the East African region ODA is classified as by the OECD/DAC as flows
How much will the SDGs cost and can developing countries afford them? Chris Hoy, Independent Consultant and PhD Econ. Candidate
 How much will the SDGs cost and can developing countries afford them? Chris Hoy, Independent Consultant and PhD Econ. Candidate To implement the SDGs, national governments and aid donors need to know 1.
Table. Population Statistics of Kerala
 Table 3 Population Statistics of Kerala Sl. No Table Pages 3.1 Population Growth of Kerala 1901 2011 2 3.2 Districtwise Distribution of Population in 2001 and 2011 3 3.3 Decennial Population Growth Rate
January 2015 Volume 8
 January 2015 Volume 8 Figure 1: Main Staple Food Commodities Informally Traded Across Selected Borders in Eastern Africa in 2014. The Market Analysis Sub-group of the Food Security and Nutrition Working
Puerto Ricans in Rhode Island, the United States, and Puerto Rico, 2013
 Issued September 2016 Centro DS2015US-07 Puerto Ricans in Rhode Island, the United States, and Puerto Rico, 2013 In 2013 an estimated 36,217 Puerto Ricans lived in Rhode Island and accounted for at least
WFP Chad SPECIAL OPERATION SO
 WFP Chad SPECIAL OPERATION SO 200058 Country: Chad Type of project: Special Operation Title: Provision of Air Services to Humanitarian Community in Chad Total cost (US$): US$ 11,362,014 Duration: 12 months
A COMPARISON OF THE MILWAUKEE METROPOLITAN AREA TO ITS PEERS
 KRY/WJS/EDL #222377 (PDF: #223479) 1/30/15 PRELIMINARY DRAFT Memorandum Report A COMPARISON OF THE MILWAUKEE METROPOLITAN AREA TO ITS PEERS EXECUTIVE SUMMARY This memorandum report provides a statistical
Sub - Saharan Africa
 Sub - Saharan Africa 4/14/2015 Countries with Relative Importance GDP South Africa Gabon Botswana Land Size Sudan Chad Mozambique Madagascar Democratic Republic of the Congo (formerly Zaire) Population
Regional Universities Network. Introduction. Regional Universities Network. Economic Impact of the Universities in the Regional Universities Network
 Regional Universities Network Economic Impact of the Universities in the Regional Universities Network Introduction The Regional Universities Network (RUN) is a network of six universities with headquarters
IPAR 4 TH ANNUAL RESEARCH CONFERENCE Kigali 28 th -29 th January Prof Herman Musahara OSSREA
 IPAR 4 TH ANNUAL RESEARCH CONFERENCE Kigali 28 th -29 th January 2015 MDGs, Inclusive and Sustainable Development today and after 2015. Reflections on Eastern and Southern African countries and role of
URBAN DYNAMICS WESTERN CAPE 67
 URBAN DYNAMICS WESTERN CAPE 67 5. SOCIO-ECONOMIC CONTEXT 5.1 Demographic Profile 5.1.1 Introduction The demographic information contained in the synopsis is derived from the supposedly inaccurate 2001
What I want to know about the Balkans.
 Name Balkan Basics KWL What I know about the Balkans. What I want to know about the Balkans. What I learned about the Balkans. Name Balkan Basics Country Profile T-Chart Use the Balkan Basics Country Profile
Chapter 1: The Population of NHS Greater Glasgow and Clyde
 Population Estimate (thousands) Chapter 1: The Population of NHS Greater Glasgow and Clyde Population Trends and Projections National Records of Scotland estimated (NRS SAPE) 1 the 2013 NHS Greater Glasgow
Project Titled: Dr. John Garang Green City
 Project Titled: Dr. John Garang Green City Submitted to National Government of Republic of South Sudan, South Sudanese s Friends such as African Development Bank, USAID, the World Bank, Norfund, that s
Sweden. Tourism in the economy. Tourism governance and funding
 Sweden Tourism in the economy In 2014 Sweden s GDP was SEK 3 907 billion. Tourism s share of GDP is 2.8%, and has been growing steadily for the last ten years and is an important contributor to the economy
From: OECD Tourism Trends and Policies Access the complete publication at: Japan
 From: OECD Tourism Trends and Policies 2014 Access the complete publication at: http://dx.doi.org/10.1787/tour-2014-en Japan Please cite this chapter as: OECD (2014), Japan, in OECD Tourism Trends and
Czech Development Cooperation Plan indicative
 Czech Development Cooperation Plan 2018 + indicative 2019-2020 Region / country Development Cooperation by the Czech Development Agency (CzDA) ODA PRIORITY COUNTRIES (Gov. Decision No. 631/2016) Sustainable
Projected Rural Population % (2030) and Rural Population Growth % pa ( )
 and Rural Population Growth % pa ( )") This presentation This presentation Rural Population Growth, 2013-30 (% pa) 4 3 2 Projected Rural Population % (2030) and Rural Population Growth % pa (2013-30) Majority urban; Rural population increasing
This presentation This presentation Rural Population Growth, 2013-30 (% pa) 4 3 2 Projected Rural Population % (2030) and Rural Population Growth % pa (2013-30) Majority urban; Rural population increasing
CORNWALL VISITOR FREQUENCY SURVEY
 CORNWALL VISITOR FREQUENCY SURVEY Analysis and Report from PFA Research Ltd 2 nd December 2015 Authors: Robert Rush, Managing Director robert.rush@pfa-research.com Emma Lydon, Research & Marketing Consultant
Opportunities and Risks in Africa
 Opportunities and Risks in Africa Africa is not a country Note: Graphic layout for visualization only (some countries are cut and rotated) Source: Creative Commons. Africa at a glance 212 Total GDP: $2.1
Egypt. Tourism in the economy. Tourism governance and funding. Ref. Ares(2016) /06/2016
 /06/2016") Ref. Ares(2016)3120133-30/06/2016 II. PARTNER COUNTRY PROFILES EGYPT Egypt Tourism in the economy International visitor arrivals to Egypt reached 9.9 million in 2014, generating a total of USD 7.2 billion
Ref. Ares(2016)3120133-30/06/2016 II. PARTNER COUNTRY PROFILES EGYPT Egypt Tourism in the economy International visitor arrivals to Egypt reached 9.9 million in 2014, generating a total of USD 7.2 billion
Development Issues and Indicators
 Development Issues and Indicators 1 2 Budgetausgaben in % des BIP gesamter Staatshaushalt 60 50 40 30 20 10 Albanien Kroatien Montenegro Bosnien und Herzegowina Mazedonien Serbien 0 2000 2001 2002 2003
T HE C AYMAN I SLANDS C OMPENDIUM OF S TATISTICS 2012
 T HE C AYMAN I SLANDS C OMPENDIUM OF S TATISTICS 2012 JUNE 2013 THE ECONOMICS AND STATISTICS OFFICE MINISTRY OF FINANCE AND ECONOMIC DEVELOPMENT ACKNOWLEDGMENT The Economics and Statistics Office would
Educational inequality in Mozambique
 Educational inequality in Mozambique Servaas van der Berg (Resep, Stellenbosch University) Carlos da Maia (World Bank) Cobus Burger (Resep, Stellenbosch University) WIDER conference on Poverty and Inequality
Population (million) % of Africa
 % of Africa") FAO. Irrigation in in figures: AQUASTAT Survey 2005 TABLE 1 al distribution of cultivable and cultivated areas Cultivable areas Cultivated areas in 2002 In cultivable areas (ha) (ha) (%) Northern 65 320
FAO. Irrigation in in figures: AQUASTAT Survey 2005 TABLE 1 al distribution of cultivable and cultivated areas Cultivable areas Cultivated areas in 2002 In cultivable areas (ha) (ha) (%) Northern 65 320
Africa the potential for growth
 Africa the potential for growth Ian Taylor President & CEO, Vitol March 2015 The oil price a long term view 2010 to date - $94 2000s - $49.6 1980s - $25.8 1990s - $18.3 1970s $10.5 1 Q1-14 Q2-14 Q3-14
Cambridge International Examinations Cambridge International Advanced Subsidiary and Advanced Level
 Cambridge International Examinations Cambridge International Advanced Subsidiary and Advanced Level *5153973671-I* TRAVEL AND TOURISM 9395/11 Paper 1 Core May/June 2016 INSERT 2 hours 30 minutes READ THESE
Africa s s Economic Prospect and Challenges
 Africa s s Economic Prospect and Challenges Louis Kasekende Chief Economist, African Development Bank and Sudhir Shetty Sector Director, Poverty Reduction & Economic Management, Africa Region The World
Entrepreneurial Universities and Private Higher Education Institutions
 Entrepreneurial Universities and Private Higher Education Institutions Professor Moses Oketch University College London, Institute of Education m.oketch@ucl.ac.uk Presentation at International Seminar
From: OECD Tourism Trends and Policies Access the complete publication at:
 From: OECD Tourism Trends and Policies 2014 Access the complete publication at: http://dx.doi.org/10.1787/tour-2014-en Netherlands Please cite this chapter as: OECD (2014), Netherlands, in OECD Tourism
AGRICULTURAL SOCIETY OF KENYA Your Leading Exhibition Partner
 AGRICULTURAL SOCIETY OF KENYA Your Leading Exhibition Partner NAIROBI INTERNATIONAL TRADE FAIR Agricultural Society of Kenya @AgriSocietyOfKe 1 AGRICULTU About Nairobi International Trade Fair The Nairobi
Fiji s Tourism Satellite Accounts
 Asia-Pacific Economic Statistics Week Bangkok 2 4 May 2016 Fiji s Tourism Satellite Accounts Mr. Bimlesh Krishna Divisional Manager Economic Statistics Fiji s Tourism Satellite Introduction The Tourism
ECONOMIC ENVIRONMENT IN
 Croatian Chamber of Economy ECONOMIC ENVIRONMENT IN C R O A T I A Croatian Business Forum Tokyo March 5, 2008 GEOGRAPHIC PROFILE Area: 56,538 km2 Population: 4.4 mil Coastline: 1,778km Islands: 1,185 Capital:
The Economic Impact of Tourism on Calderdale Prepared by: Tourism South East Research Unit 40 Chamberlayne Road Eastleigh Hampshire SO50 5JH
 The Economic Impact of Tourism on Calderdale 2015 Prepared by: Tourism South East Research Unit 40 Chamberlayne Road Eastleigh Hampshire SO50 5JH CONTENTS 1. Summary of Results 1 2. Table of Results Table
DBSA Perspectives on African Aviation: A High-Level Overview
 DBSA Perspectives on African Aviation: A High-Level Overview Date: 11 November 2015 Dr Sifiso Mbatha MANAGER: Pan African Capacity Building Programme (PACBP) DBSA Mandate and Strategy DBSA Mandate: To
Statistical Picture of Aboriginal and Torres Strait Islander School Students in Australia
 Chapter 2 Statistical Picture of Aboriginal and Torres Strait Islander School Students in Australia Statistical Picture The Australian Bureau of Statistics (ABS) reported that the estimated resident Aboriginal
Ireland. Tourism in the economy. Tourism governance and funding
 Ireland Tourism in the economy Tourism is one of Ireland s most important economic sectors and has significant potential to play a further role in Ireland s economic renewal. In 2014, spending by visitors
A COMPARISON OF THE MILWAUKEE METROPOLITAN AREA TO ITS PEERS
 KRY/WJS/EDL #222377 v4 (PDF: #223479v2) 4/1/15 APPENDIX D REVISED DRAFT Memorandum Report A COMPARISON OF THE MILWAUKEE METROPOLITAN AREA TO ITS PEERS EXECUTIVE SUMMARY This report provides a statistical
EU / CZECH REPUBLIC RELATIONS
 MEMO/98/69 Brussels, 29 September 1998 EU / CZECH REPUBLIC RELATIONS GENERAL DATA Population 10.3 million Total Area 78 864 km2 Density 131 inhabitants per km2 Neighbouring countries Austria, Germany,
UNSD Environment Statistics Self Assessment Tool (ESSAT) and COMESA Environmental Statistics Assessment 2014
 and COMESA Environmental Statistics Assessment 2014") UNITED NATIONS STATISTICS DIVISION (UNSD) Workshop on Environment Statistics in support of the implementation of the Framework for the Development of Environment Statistics (FDES 2013) Balaclava, Mauritius
UNITED NATIONS STATISTICS DIVISION (UNSD) Workshop on Environment Statistics in support of the implementation of the Framework for the Development of Environment Statistics (FDES 2013) Balaclava, Mauritius
WORKSHOP ON COMPILATION OF INTERNATIONAL MERCHANDISE TRADE STATISTICTS ADDIS ABABA, 8-11 NOVEMBER, 2004 COUNTRY REPORT
 WORKSHOP ON COMPILATION OF INTERNATIONAL MERCHANDISE TRADE STATISTICTS ADDIS ABABA, 8-11 NOVEMBER, 2004 COUNTRY REPORT BY: SALEH MZEE SALEH THE CHIEF GOVERNMENT STATISTICIAN (OCGS) ZANZIBAR- TANZANIA NOVEMBER,
The Economic Impact of Tourism on Scarborough District 2014
 The Economic Impact of Tourism on Scarborough District 2014 Prepared by: Tourism South East Research Unit 40 Chamberlayne Road Eastleigh Hampshire SO50 5JH CONTENTS 1. Summary of Results 1 2. Table of
Tourist satellite account for Poland for the years 2005 simplified version
 Tourist satellite account for Poland for the years 2005 simplified version Department of Tourism Ministry of Sport and Tourism of Poland - In 2005 tourism consumption within the economic territory of Poland
Israel. Tourism in the economy. Tourism governance and funding
 Israel Tourism in the economy Tourism accounts directly for 2.8% of Israel s GDP and about 3.5% of total employment. The combined total of direct and indirect tourism jobs is estimated at 230 000, representing
Puerto Ricans in Ohio, the United States, and Puerto Rico, 2014
 Issued April 2016 Centro DS2015US-12 Puerto Ricans in Ohio, the United States, and Puerto Rico, 2014 In 2014, Ohio had the tenth largest number of Puerto Ricans in the United States with 108,174 residents,
INFRASTRUCTURE DEVELOPMENT IN TANZANIA
 INFRASTRUCTURE DEVELOPMENT IN TANZANIA PROF JOSEPH MSAMBICHAKA MBEYA UNIVERSITY OF SCIENCE AND TECHNOLOGY 50 TH YEARS ERB ANNIVERSARY 5 TH TO 7 TH SEPTEMBER 2018 PRESENTATION LAYOUT 1. DEFINITION OF INFRASTRUCTURE
Chile. Tourism in the economy. Tourism governance and funding
 Chile Tourism in the economy Tourism in Chile has experienced a sustained rise in recent years and has become one of the sectors delivering the fastest growth and employment generation. It has been estimated
Impacts of Visitor Spending on the Local Economy: George Washington Birthplace National Monument, 2004
 Impacts of Visitor Spending on the Local Economy: George Washington Birthplace National Monument, 2004 Daniel J. Stynes Department of Community, Agriculture, Recreation and Resource Studies Michigan State
Hotel. Price Index. November Released Date: January Hotel Price Index
 Hotel Price Index November 2015 1 Released Date: January 2016 Introduction The Emirate of Abu Dhabi is one of the most attractive tourist destinations in the Middle East because of the developed infrastructure
COUNTRY DATA: Costa Rica : Information from the CIA World Factbook! INTRODUCTION GEOGRAPHY
 ! COUNTRY DATA: Costa Rica : Information from the CIA World Factbook! INTRODUCTION GEOGRAPHY Location Area Central America, bordering both the Caribbean Sea and the North Pacific Ocean, between Nicaragua
The Economic Impact of Tourism on Galveston Island, Texas
 The Economic Impact of Tourism on Galveston Island, Texas 2017 Analysis Prepared for: Headline Results Headline results Tourism is an integral part of the Galveston Island economy and continues to be a
Puerto Ricans in Massachusetts, the United States, and Puerto Rico, 2014
 Issued April 2016 Centro DS2016US-07 Puerto Ricans in Massachusetts, the United States, and Puerto Rico, 2014 In 2014, Massachusetts was the fifth state with most Puerto Ricans in the United States. In
The Economic Impact of Tourism in North Carolina. Tourism Satellite Account Calendar Year 2013
 The Economic Impact of Tourism in North Carolina Tourism Satellite Account Calendar Year 2013 Key results 2 Total tourism demand tallied $26 billion in 2013, expanding 3.9%. This marks another new high
Trade Fair. Your Leading Exhibition Partner AGRICULTURAL SOCIETY OF KENYA. Nairobi International. Trade Fair
 . 1 SOCIETY OF KENYA Your Leading Exhibition Partner AGRICULTU About The Trade Fair (NITF) is the premier convergence point for trade, commerce and knowledge sharing in both the agriculture and trade sector.
WHITE MAIZE: The markets below represent the major producer and consumer markets in countries where white maize is heavily consumed as the staple.
 KES/9 kg KES/9 kg November 211 The Famine Early Warning Systems Network (FEWS NET) monitors trends in staple food prices in countries vulnerable to food insecurity. For each FEWS NET country and region,