Doing Business in South Africa and Tanzania Webinar. Zoë Munro
|
|
|
- Mitchell Montgomery
- 6 years ago
- Views:
Transcription

1 Doing Business in South Africa and Tanzania Webinar Zoë Munro February 6, 2018

2 Great Lakes St. Lawrence Governors & Premiers Formed in 2015, building on 30 years of collaboration through the Council of Great Lakes Governors Chief executives of: Illinois Indiana Michigan Minnesota New York Ohio Ontario Pennsylvania Québec Wisconsin Growing the region s $6 trillion economy and protecting the world s greatest freshwater system Chair: Michigan Governor Rick Snyder Vice Chair: Wisconsin Governor Scott Walker


3 Great Lakes St. Lawrence Governors & Premiers Award-Winning Project Portfolio Economy Promoting SME Exports Growing Strong Clusters Maritime Transportation Tourism Attracting Foreign Investment Environment Managing Sustainable Water Use Restoring and Protecting the Great Lakes St. Lawrence
4


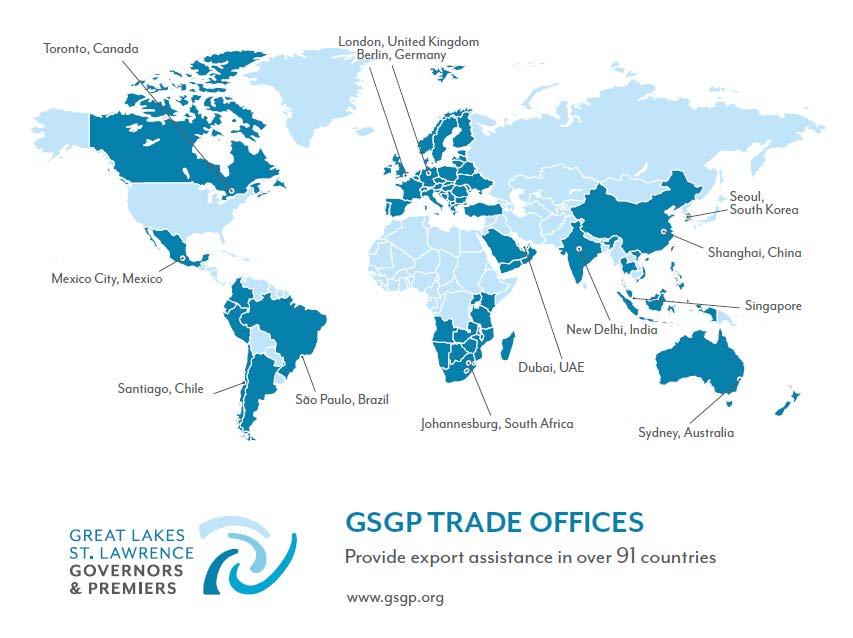
5 GSGP Trade Missions have assisted over 400 Great Lakes companies to export their products and services to 23 international markets Abu Dhabi, Argentina, Australia, Brazil, Chile, Czech Republic, Colombia, Dubai, Germany, India, Indonesia, Mexico, New Zealand, Peru, Poland, Romania, South Africa, Qatar, Québec, Thailand, Turkey, Vietnam, UAE and the United Kingdom


6 GSGP AFRICA TRADE MISSION: South Africa / Tanzania + JUNE 1-9, 2018 Great Lakes St. Lawrence Governors & Premiers / Online / February 2017 Richard Zurba, Director / GSGP Africa Office
7 GSGP sub-saharan Africa Coverage Management Office Pretoria, South Africa Serving Great Lakes companies since Other Zurcom staff and contractors: Durban, South Africa, Maputo, Mozambique, Port Louis, Mauritius, Nairobi, Kenya, Dar es Salaam, Tanzania, Lusaka, Zambia Harare, Zimbabwe Accra, Ghana, Addis Abba, Ethiopia (Q1 2018), Dakar, Senegal* Abuja, Nigeria* *through partnering companies.

8 Sub-Saharan Africa Something to Shout About
9 Sub-Saharan Africa Demographics Today: One Billion People Source: World Bank


10 Sub-Saharan Africa Demographics The current growth rate is 2.3%. The UN predicts for the region a population between 1.5 and 2 billion by 2050 with a population density of 80 per km 2 compared to 170 for Western Europe, 140 for Asia and 30 for the Americas. Source: United Nations
11 Sub-Saharan Africa Wealth Per Capita Growth Source: IMF
12 Sub-Saharan Africa Growth Growth in Sub-Saharan Africa is projected to recover moderately in 2018 to +/- 3.5%. Growth will continue to strengthen in 2018, helped by improvements in commodity prices and domestic conditions. Angola, Nigeria and South Africa rebound from a sharp slowdown in (World Bank) Zambia, Zimbabwe, South Africa and others already showing signs of vast improvements in late 2017 and early Source: IMF

13 Sub-Saharan Africa Key Business Takeaways 1. Fast Growing Economies / Long term Positive Outlook 2. Youthful Populations 3. Growing Middle Classes 4. Rapid Urbanization / Industrialization Selected Export Sectors: Aviation Agricultural Technology Chemicals Cosmetics/Beauty Energy / Energy Sources Hospitality Sector Healthcare Devices/Consumables Information Technology Mining Equipment Machinery / Processing Transport / Infrastructure Water/Sanitation

14 Don t be just one of the herd.. Join us on our African trade mission!
 GDP (FX): $280 billion (2016 est.) Per Capita GDP (PPP): $13,200 (2016 est.")
 Geographic Size: 1,219,090 sq km Currency: South African rand $1 = 12.")
 Imports: $85.03 billion (2016 est.")
15 SOUTH AFRICA Population: 54.3 million GDP (PPP): $736.3 billion (2016 est.) GDP (FX): $280 billion (2016 est.) Per Capita GDP (PPP): $13,200 (2016 est.) Economic Growth: 2% (2018 est. real growth) Geographic Size: 1,219,090 sq km Currency: South African rand $1 = (Jan 2018) Industries: agriculture: 2.2%; industry: 29.2% services: 68.7% (2016 est.) Imports: $85.03 billion (2016 est.) Capitals: Pretoria, Cape Town, Bloemfontein Languages: IsiZulu (official) 22.7%, IsiXhosa (official) 16%, Afrikaans (official) 13.5%, English (official) 10% other.


16 SOUTH AFRICA Best Export Prospects (but not limited to) Agricultural Equipment Aviation aftermarket Chemicals Construction / Mining Equipment Healthcare Devices / Consumables Infrastructure: Road, Port, Water, Power Industrial Supplies ( non food) Transport Equipment
 GDP (FX): $44.9 billion (2015 est.")
 Economic Growth: Geographic Size: 947,300 sq km Currency: Tanzanian")
 Imports: $9.")
 Capital: Dar es Salaam Languages: Swahili (official), English")
17 TANZANIA (EAST AFRICA) Population: 52.4 million GDP (PPP): $138.5 billion (2015 est.) GDP (FX): $44.9 billion (2015 est.) Per Capita GDP (PPP): $2,900 (2015 est.) Economic Growth: Geographic Size: 947,300 sq km Currency: Tanzanian shilling (TZS) $1 = 2,181 (Oct 2016) Industries: agriculture: 25.6%, industry: 26.5% services: 47.4% (2015 est.) Imports: $9.843 billion (2015 est.) Capital: Dar es Salaam Languages: Swahili (official), English (official, primary language of commerce, administration, and higher education), Arabic (widely spoken in Zanzibar), many local languages


18 TANZANIA Best Export Prospects (but not limited to) Agricultural Technology including Livestock, Energy generation / Renewable energy Infrastructure Build Support Mining equipment, Manufacturing machinery Tourism and Tour operation systems support

19 Trade Mission Itinerary
20 Trade Mission Itinerary Day Location Activity Friday June 1 Arrive in South Africa Travel to Pilannesburg / Sun City Saturday June 2 Optional Safari Pilanesburg / Sun City Sunday June 3 Optional Safari Pilanesburg / Sun City Optional Safari Optional Safari Arrive at Hotel, Johanneburg Monday June 4 Johannesburg, Pretoria, South Africa Orientation Business Meetings Welcome Dinner (GSGP) Tuesday June 5 Johannesburg/Pretoria, South Africa Business Meetings Informal Dinner (own cost) Wednesday June 6 Johannesburg/Pretoria, South Africa Business Meetings Flight to other city destination Thursday June 7 Dar es Salaam, Tanzania (or alternative country based on requirements) Business Meetings Friday June 8 Saturday Dar es Salaam, Tanzania (or alternative country based on requirements) Depart for USA Business Meetings

 GDP (FX): $103 billion (2015 est.")
 Geographic Size: 1,246,700 sq km Currency: Angolan Kwanza (AOA) $1 = 165.")
 Imports Total: $21.15 billion (2015 est.) Capital: Luanda Languages: Portuguese 71.")
21 ANGOLA Best Export Prospects (but not limited to) Agricultural technology Aviation aftermarket Food / processed food Oil and gas equipment and technology Construction and manufacturing machinery/ equipment Infrastructure support / projects Information systems technology Medical / healthcare / life sciences Population: 25.8 million GDP: $184.4 billion (2015 est.) GDP (FX): $103 billion (2015 est.) Per Capita GDP (PPP): $7,300 (2015 est.) Economic Growth: 3% (2015 est. real growth) Geographic Size: 1,246,700 sq km Currency: Angolan Kwanza (AOA) $1 = (Oct 2016) Industries: agriculture: 10.2%, industry/petroluem: 61.4% services: 28.4% (2011 est.) Imports Total: $21.15 billion (2015 est.) Capital: Luanda Languages: Portuguese 71.2% (official), Umbundu 23%, Kikongo 8.2%, Kimbundu 7.8%, Chokwe 6.5%, Nhaneca 3.4%

 Per Capita GDP (PPP): $16,400 (2015 est.) Economic Growth: 3.2% (2014 est.")
 Industries: agriculture: 1.9%, industry: 30.2% services: 67.9% (2015 est.) Imports Total: $7.")
22 BOTSWANA Best Export Prospects (but not limited to) Energy Renewable and for Isolated Regions Information Technology Mining equipment Medical / healthcare / life sciences Transport equipment Tourism management and support Population: 2.3 million GDP (PPP): $34.84 billion (2015 est.) GDP (FX): $12.86 billion (2015 est.) Per Capita GDP (PPP): $16,400 (2015 est.) Economic Growth: 3.2% (2014 est. real growth) Geographic Size: 581,730 sq km Currency: Botswana Pula (BWP) $1 = (Oct 2016) Industries: agriculture: 1.9%, industry: 30.2% services: 67.9% (2015 est.) Imports Total: $7.09 billion (2015 est.) Capital: Gaborone Languages: English (official) 2.8%, Setswana 77.3%, Sekalanga 7.4%, Shekgalagadi 3.4%,

: $20.36 billion (2015 est.) GDP (FX): $6.")
 Economic Growth: 3% (2015 est.")
 $1 = 720 (Oct 2106) Industries: agriculture: 32.")

23 MALAWI Best Export Prospects (but not limited to) Agricultural technology Consumer Goods Healthcare / Life sciences Transportation equipment; Semi-manufactured goods Population: 18.6 million GDP (PPP): $20.36 billion (2015 est.) GDP (FX): $6.416 billion (2015 est.) Per Capita GDP (PPP): $1,100 (2015 est.) Economic Growth: 3% (2015 est. real growth) Geographic Size: 118,484 sq km Currency: Malawian Kwacha (MWK) $1 = 720 (Oct 2106) Industries: agriculture: 32.7%, industry: 17.2% services: 50.1% (2015 est.) Imports: $2.607 billion (2015 est.) Capital: Llongwe Languages: English (official), Chichewa (common), Chinyanja, Chiyao, Chitumbuka, Chilomwe

 GDP (FX): $14.97 billion (2015 est.) Per Capita GDP (PPP): $1,200 (2015 est.")
 Geographic Size: 799,380 sq km Currency: Mozamibquean Metical MZN $1 = 78.")
 Imports: $7.577 billion (2015 est.")
24 MOZAMBIQUE Best Export Prospects (but not limited to) Agricultural technology Maritime technology Mining equipment Construction / infrastructure projects Energy generation hydroelectric Tourism Population: 25.9 million GDP (PPP): $33.19 billion (2015 est.) GDP (FX): $14.97 billion (2015 est.) Per Capita GDP (PPP): $1,200 (2015 est.) Economic Growth: 6.3% (2015 est. real growth) Geographic Size: 799,380 sq km Currency: Mozamibquean Metical MZN $1 = 78.3 (Oct 2016) Industries: agriculture: 25.5%, industry: 20.1% services: 54.4% (2015 est.) Imports: $7.577 billion (2015 est.) Capital: Maputo Languages: Portuguese (official) 10.7%, Emakhuwa 25.3%, Xichangana 10.3%, Cisena 7.5%, Elomwe 7%

: $25.34 billion (2015 est.) Per Capita GDP (PPP): $12.")
 Geographic Size: 824,292 sq km Currency: Namibian dollar (NAD) $1 =")
 Imports: $6.914 billion (2015 est.")

25 NAMIBIA Best Export Prospects (but not limited to) Tourism management and systems support Agricultural technology Energy hydroelectricity, wind energy, solar. Machinery Mining and heavy equipment Population: GDP (PPP): 2.5 million GDP (FX): $25.34 billion (2015 est.) Per Capita GDP (PPP): $12.83 billion (2015 est.) Economic Growth: 4.5% (2015 est. real growth) Geographic Size: 824,292 sq km Currency: Namibian dollar (NAD) $1 = N$13.94 (Oct 2016) Industries: agriculture: 5.9%, industry: 29% services: 65.1% (2015 est.) Imports: $6.914 billion (2015 est.) Capital: Windhoek Languages: English (official) 3.4%, Oshiwambo languages 48.9%, Nama/Damara 11.3%, Afrikaans 10.4% (common language of most of the population and about 60% of the white population), Otjiherero languages 8.6%, Kavango languages 8.5%, Caprivi languages 4.8%,


 Per Capita GDP (PPP): $3,900 (2015 est.")
 Geographic Size: 752,618 sq km Currency: Zambian Kwacha")
 Imports: $7.711 billion (2015 est.")
26 ZAMBIA Best Export Prospects (but not limited to) Agricultural technology / food processing Mining and heavy equipment, Construction / infrastructure projects Energy generation hydroelectric Water and Sanitation Tourism systems and support Telecommunications Population: 15.5 million GDP (PPP): $62.71 billion (2015 est.) GDP (FX): $21.89 billion (2015 est.) Per Capita GDP (PPP): $3,900 (2015 est.) Economic Growth: 3.6% (2015 est. real growth) Geographic Size: 752,618 sq km Currency: Zambian Kwacha (ZMW) $1 = 9.90 Industries: agriculture: 8.9%, industry: 30% services: 61.1% (2015 est.) Imports: $7.711 billion (2015 est.) Capital: Lusaka Languages: English (official) 1.7%, Bembe 33.4%, Nyanja 14.7%, Tonga 11.4%, Lozi 5.5%, others.
 Per Capita GDP (PPP): $19,500 (2015 est.) Economic Growth: 3.4% (2015 est.")
 Industries: agriculture: 4%, industry: 22.3% services: 73.7% (2015 est.) Imports: $4.")


27 MAURITIUS (INDIAN OCEAN) Population: 1.4 million GDP (PPP): $24.57 billion (2015 est.) GDP (FX): $11.61 billion (2015 est.) Per Capita GDP (PPP): $19,500 (2015 est.) Economic Growth: 3.4% (2015 est. real growth) Geographic Size: 2,040 sq km Currency: Mauritian Rupee (MUR) $1 = Rs 35.7 (Oct 2106) Industries: agriculture: 4%, industry: 22.3% services: 73.7% (2015 est.) Imports: $4.526 billion (2015 est.) Capital: Port Louis Languages: English (official), Creole 86.5%, Bhojpuri 5.3%, French 4.1%, Best Export Prospects (but not limited to) Chemicals for further beneficiation Consumer/Commercial items in tourism trade Energy generation wind, tide, bio-alternatives Financial Information Technology Information Technology/Telecommunication Manufacturing equipment/machinery Port/logistics engineering and equipment Maritime technology

 Medical / Healthcare Technology Transport Equipment Population: 46.")
 Per Capita GDP (PPP): $3,200 (2015 est.")
 Geographic Size: 580,367 sq km Currency: Kenyan Shilling")
 Imports: $15.56 billion (2015 est.")
28 KENYA (EAST AFRICA) Best Export Prospects (but not limited to) Agricultural Technology and Chemical Fertilizers Aviation aftermarket Construction Equipment Information Technology Industrial Supplies ( non food) Medical / Healthcare Technology Transport Equipment Population: 46.7 million GDP (PPP): $141.6 billion (2015 est.) GDP (FX): $61.41 billion (2015 est.) Per Capita GDP (PPP): $3,200 (2015 est.) Economic Growth: 5.4% (2015 est. real growth) Geographic Size: 580,367 sq km Currency: Kenyan Shilling (KES) $1 = 101 (Oct 2016) Industries: agriculture: 32.9%, industry: 17.8% services: 49.2% (2015 est.) Imports: $15.56 billion (2015 est.) Capital: Nairobi Languages: English (official), Kiswahili (official), numerous indigenous languages
")
 GDP (FX): $69.2 billion (2015 4st.) Per Capita GDP (PPP): $1,900 (2015 est.")
 Geographic Size: 1,104,300 sq km Currency: Ethiopian Birr $1 = 22.")
 Capital: Addis Ababa Languages: Oromo (official working language in the State of Oromiya)")
29 ETHIOPIA (EAST AFRICA) Best Export Prospects (but not limited to) Agricultural Technology and Chemical Fertilizers Aviation aftermarket Construction Equipment Information Technology Industrial Supplies ( non food) Medical / Healthcare Technology Transport Equipment Population: million GDP (PPP): $174.7 billion (2016 est.) GDP (FX): $69.2 billion (2015 4st.) Per Capita GDP (PPP): $1,900 (2015 est.) Economic Growth: 6.5% (2016 est. real growth) Geographic Size: 1,104,300 sq km Currency: Ethiopian Birr $1 = (Jan 2017) Industries: agriculture: 36.2%; industry: 17%; services: 46.8% Imports: $14.7 billion Exports: $2.9 billion (2016 est) Capital: Addis Ababa Languages: Oromo (official working language in the State of Oromiya) 33.8%, Amharic (official national language) 29.3%, Somali (official working language of the State of Sumale) 6.2%. English taught widely in schools.

: $114.")
 Per Capita GDP (PPP): $4,300 (2015 est.) Economic Growth: 3.5% (2015 est.")
 Industries: agriculture: 20.7%, industry: 27.")
 Capital: Accra Languages: English (official), Asante 16%, Ewe 14%, Fante")
30 GHANA (WEST AFRICA) Best Export Prospects (but not limited to) Agricultural Equipment Aviation aftermarket Construction / Mining Equipment Industrial Supplies ( non food) Transport Equipment Medicinal and Pharmaceutical Products / Healthcare Devices Population: 26.9 million GDP (PPP): $114.7 billion (2015 est.) GDP (FX): $36.04 billion (2015 est.) Per Capita GDP (PPP): $4,300 (2015 est.) Economic Growth: 3.5% (2015 est. real growth) Geographic Size: 238,533 sq km Currency: Ghanian cedi (GHS) $1 = 4.02 (Oct 2016) Industries: agriculture: 20.7%, industry: 27.7% services: 51.6% (2015 est.) Imports: $13.47 billion (2015 est.) Capital: Accra Languages: English (official), Asante 16%, Ewe 14%, Fante 11.6%, Boron (Brong) 4.9%, Dagomba 4.4%, others.

31 Your Bridge to Africa and the World Great Lakes St. Lawrence Governors & Premiers Africa Trade Office 670 Lobelia Street, Ground Floor Lobelia Office Park Moreleta Park 0044 South Africa P.O. Box 450 Menlyn 0063 South Africa Thanks! Tel: Websites: /

 Customized B2B Meeting Schedule $3,700 Grant funding is available in many States to offset travel costs and")
32 South Africa & Tanzania Trade Mission 2018 June 1-9, 2018 Multi-sector trade mission to Johannesburg and Dar-es-Salaam, Tanzania Customized one-on-one business appointments with interested distributors, agents and other prospective business partners set up by the GSGP Southern Africa Trade Office Mission registration deadline: March 15, 2018 Mission Participation Fee US$1,350 per person (each additional participant $400) Customized B2B Meeting Schedule $3,700 Grant funding is available in many States to offset travel costs and mission fees.
33 Mission Itinerary DAY 1 -Friday, June 1 Arrive in South Africa- Travel to Pilannesburg / Sun City DAY 2 - Saturday, June 2 Optional Safari - Pilanesburg / Sun City Arrive at Hotel, Johanneburg DAY 3 - Sunday, June 3 Optional Safari - Pilanesburg / Sun City DAY 4 - Monday, June 4 Orientation, Johannesburg, South Africa Business Meetings Johannesburg/Pretoria, South Africa Welcome Dinner DAY 5 - Tuesday, June 5 Business Meetings Johannesburg/Pretoria, South Africa
 DAY")
34 Mission Itinerary DAY 6 - Wednesday, June 6 Business Meetings, Johannesburg/Pretoria, South Africa Flight to other city destination DAY 7 - Thursday, June 7 Business Meetings, Dar es Salaam, Tanzania (or alternative country based on requirements) DAY 8 - Friday, June 8 Business Meetings, Dar es Salaam, Tanzania (or alternative country based on requirements) DAY 8 - Saturday, June 9 Depart for U.S.A.


35 South Africa & Tanzania Trade Mission 2018 In-country market business briefings and networking events In-country staff support of GSGP Group assistance with logistics

36 Trade Mission Website ational- trade/trade- missions/southafrica- and- tanzania- trade- mission- 2018/


37 Zoë Munro Program Manager P E zmunro@gsgp.org gsgp.org
africa s hospitality market
 africa s hospitality market Year in Review 2016 Ghana Nigeria Ethiopia Addis Ababa Kenya In this issue 3 Introduction Windhoek Zambia Lusaka Gabarone Pretoria Dar es Salaam Hahare Namibia Zimbabwe Botswana
Africa South of the Sahara
 Africa South of the Sahara MAURITANIA MALI NIGER SENEGAL CHAD SUDAN ERITREA GAMBIA BURKINA- GUINEA FASO DJIBOUTI GUINEA- CÔTE NIGERIA BISSAU CENTRAL ETHIOPIA D IVOIRE SIERRA AFRICAN REP. BENIN LEONE
Intra-African Air Services Liberalization
 Intra-African Air Services Liberalization James Wiltshire Senior Economist, www.iata.org/economics To represent, lead and serve the airline industry Aviation connects African businesses to world markets
FUTURE OPPORTUNITIES IN
 FUTURE OPPORTUNITIES IN BUSINESS AND THE DIGITAL ECONOMY Clifford D. Mpare, CFA Chairman and CEO Frontline Capital Advisors, Ltd. 2022 Vision: Whose GDP will grow most in the world by 2022? RANK EXPECTED
21st ACI AFRICA REGION ANNUAL ASSEMBLY CONFERENCE AND EXHIBITION
 21st ACI AFRICA REGION ANNUAL ASSEMBLY CONFERENCE AND EXHIBITION LIVINGSTONE, ZAMBIA 28 AUGUST 2012 Angela Gittens Director General ACI World 1 Airports Council International ACI AFRICA ACI World 577 members
REPORT ON HUMAN RESOURCES IN WHO IN THE AFRICAN REGION. Information Document CONTENTS INTRODUCTION... 1
 AFR/RC56/INF.DOC/3 12 July 2006 REGIONAL COMMITTEE FOR AFRICA ORIGINAL: ENGLISH Fifty-sixth session Addis Ababa, Ethiopia, 28 August 1 September 2006 Provisional agenda item 10.4 REPORT ON HUMAN RESOURCES
1.0 Introduction Zambia s Major Trading Partners Zambia s Major Export Markets... 4
 Bank of Zambia CONTENTS 1.0 Introduction... 3 2.0 Zambia s Major Trading Partners... 3 3.0 Zambia s Major Export Markets... 4 4.0 Major Source Countries Of Zambia s Imports... 5 5.0 Direction Of Trade
REPORT ON WHO STAFF IN THE AFRICAN REGION. Information Document CONTENTS
 6 September 2013 REGIONAL COMMITTEE FOR AFRICA ORIGINAL: ENGLISH Sixty-third session Brazzaville, Republic of Congo, 2 6 September 2013 Agenda item 20.1 REPORT ON WHO STAFF IN THE AFRICAN REGION Information
Regional outlook Sub-Saharan Africa 24/11/2015. Share commodities in good exports. Share commodities in goods imports
 Table 1: Economic structure indicators Number of Inhabitants (m.) Size of the economy (in USD bn.) Size of the economy (% of world GDP) Share commodities in good exports Share commodities in goods imports
1.0 Introduction Zambia s Major Trading Partners Zambia s Major Export Markets... 4
 Bank of Zambia CONTENTS 1.0 Introduction... 3 2.0 Zambia s Major Trading Partners... 3 3.0 Zambia s Major Export Markets... 4 4.0 Major Source Countries Of Zambia s Imports... 5 5.0 Direction Of Trade
1.0 Introduction Zambia s Major Trading Partners Zambia s Major Export Markets... 4
 Bank of Zambia CONTENTS 1.0 Introduction... 3 2.0 Zambia s Major Trading Partners... 3 3.0 Zambia s Major Export Markets... 4 4.0 Major Source Countries Of Zambia s Imports... 5 5.0 Direction Of Trade
AFRICA. Cape Town, April Experience the World
 AFRICA Cape Town, 10 12 April 2019 Experience the World at WTM Africa 2019 Why WTM Africa? In the Host City of Cape Town Takes place in April every year - the optimal time in the Travel Industry s buying
Trade Blocs, Development Hotspots and Changing Trade Patterns. Breakbulk Africa, 18 th February 2015
 Trade Blocs, Development Hotspots and Changing Trade Patterns Breakbulk Africa, 18 th February 2015 Background Multiplicity of Trade Blocs in ever convergent economic spaces; Need for harmonisation of
The W20. The 20 wealthiest countries in the world. Publication Date: October 2015 NEW WORLD WEALTH
 The W20 The 20 wealthiest countries in the world Publication Date: October 2015 W20 wealth rankings The following tables ranks the top 20 countries in the world by total individual wealth held. Total individual
SOUTHERN AFRICA TRAVEL AND TOURISM BAROMETER REPORT 2015
 SOUTHERN AFRICA TRAVEL AND TOURISM BAROMETER REPORT 2015 1 Contents 1. TOURISM TRENDS: GLOBAL AND SOUTHERN AFRICA S MARKET SHARE IN AFRICA... 4 1.1. TOURIST ARRIVALS... 4 1.1.1. Global Tourist Arrivals
Market Brief on Tanzania
 Market Brief on Tanzania February 2017 Location Facts and Figures Total Population 50,7 million (2015) Tanzania is located in the African Great Lakes region on the East coast of the continent. It is bordered
TOURISM BUSINESS COUNCIL OF SOUTH AFRICA TRENDS AND INDICATORS REPORT. May 2018
 TOURISM BUSINESS COUNCIL OF SOUTH AFRICA TRENDS AND INDICATORS REPORT May 2018 Compiled by: Ms. Tebogo Umanah General Manager: Policy Analysis and Strategic Projects May 2018 Page 1 CONTENTS INTRODUCTION...
REPORT ON WHO STAFF IN THE AFRICAN REGION. Information Document CONTENTS
 10 July 2009 REGIONAL COMMITTEE FOR AFRICA ORIGINAL: ENGLISH Fifty-ninth session Kigali, Republic of Rwanda, 31 August 4 September 2009 Provisional agenda item 9.5 REPORT ON WHO STAFF IN THE AFRICAN REGION
Africa. Display Transparency 6 on the overhead. Explain to students that Africa is the
 3S 4S 1S 2S 3N 4N Banjul Bissau SIERRA LEONE 5N MADEIRA IS. CANARY IS. (SPAIN) (disputed) Dakar Freetown (PORTUGAL) GAMBIA Bamako Conakry Monrovia Rabat BURKINA FASO 1W Accra Lomé ~ Niamey BENIN Algiers
A F R I C A TANZANIA. 21 st POST SHOW REPORT
 21 st TANZANIA A F R I C A 2 0 1 8 East Africa s Largest International Trade Exhibition On Building & Construction Products, Equipments & Machinery POST SHOW REPORT 01-03 November 2018 Diamond Jubilee
KEY TRENDS IN TOURISM IN AFRICA 41ST ANNUAL WORLD TOURISM CONFERENCE, KIGALI, RWANDA CHRISTY TAWII, RESEARCH ANALYST
 KEY TRENDS IN TOURISM IN AFRICA 41ST ANNUAL WORLD TOURISM CONFERENCE, KIGALI, RWANDA CHRISTY TAWII, RESEARCH ANALYST ABOUT EUROMONITOR INTERNATIONAL GLOBAL OVERVIEW AFRICA S PERFORMANCE REVIEW TOURISM
URBAN & BOUTIQUE HOTELS
 URBAN & BOUTIQUE HOTELS Urban & Boutique Hotels www.dsa-arch.com Urban & Boutique Hotels Company Profile Architects International is a leading architectural practice with a passion for creative DSA Architectural
Growing Business Tourism in Africa
 Growing Business Tourism in Africa Esmaré Steinhöfel Regional Director: Africa 20 July 2018 wwwiccaworldorg ICCA Introduction wwwiccaworldorg Industry Associations wwwiccaworldorg Introduction The global
German South African Business Relation. 9 May 2018 Rechtsanwalt Frank Aletter, LL.M.
 German South African Business Relation 9 May 2018 Rechtsanwalt Frank Aletter, LL.M. Content A. South Africa at a Glance B. Strong provinces C. Trade Relations D. The German Chamber Network A. South Africa
Opportunities and Risks in Africa
 Opportunities and Risks in Africa Africa is not a country Note: Graphic layout for visualization only (some countries are cut and rotated) Source: Creative Commons. Africa at a glance 212 Total GDP: $2.1
Growing Africa Cities Helping you size the market
 Growing Africa Cities Helping you size the market October, 2013 1 In a world struggling for growth, Africa stands out 2 The rate of growth is significant in all African countries EIU forecast for GDP Growth
Table of CONTENTS. COUNTRY FOCUS: United Republic of Tanzania
 Africa Statistics Flash Selected Socio-Economic Indicators on Africa December 216 Table of CONTENTS COUNTRY FOCUS: United Republic of Tanzania ------------------------------------------------------------
Africa at a glance. Annual real GDP growth ( average): 4.97% Official development assistance (2010): $48 billion
: 4.97% Official development assistance (2010): $48 billion") Africa at a glance Population (212): 1,38 million Annual real GDP growth (25-212 average): 4.97% Official development assistance (21): $48 billion Net foreign direct investment (211): $43 billion Sources:
Africa at a glance Population (212): 1,38 million Annual real GDP growth (25-212 average): 4.97% Official development assistance (21): $48 billion Net foreign direct investment (211): $43 billion Sources:
Western Cape Destination Performance Report: April-June 2016
 Number of arrivals (millions) Western Cape Destination Performance Report: April-June 2016 Global Tourism Performance According to the United Nations World Tourism Organisation, international tourist arrivals
Federal Ministry of Transportation. Nigeria Business Investor Forum Briefing on Aviation Sector Reform and Investment Opportunities
 Federal Ministry of Transportation Nigeria Business Investor Forum Briefing on Aviation Sector Reform and Investment Opportunities By Senator Hadi Abubakar Sirika Honourable Minister of State Aviation
Market Brief on Tanzania
 Market Brief on Tanzania January 2018 Location Facts and Figures Tanzania is located in the African Great Lakes region on the East coast of the continent. It is bordered by Kenya and Uganda to the north;
AFRICA. Cape Town, April Connect with the World
 AFRICA Cape Town, 10-12 April 2019 Connect with the World at WTM Africa 2019 Why WTM Africa? In the Host City of Cape The only Travel Trade Show of its kind on the African Continent Takes place in April
Copyrights Statistics Botswana 2016
 STATISTICS BOTSWANA TOURISM STATISTICS ANNUAL REPORT 2014 Copyrights Statistics Botswana 2016 Statistics Botswana. Private Bag 0024 Botswana Tel: (267) 367 1300. Fax: (267) 395 2201.Email: info@statsbots.org.bw
AFRICAN GROWTH MARKETS AND OPPORTUNITIES
 AFRICAN GROWTH MARKETS AND OPPORTUNITIES Presentation at the PMA Fresh Connections Conference By Hannah Edinger, Frontier Advisory Cape Town, August 13, 2015 Contents of Presentation Africa Overview Disaggregating
BUSINESS OPPORTUNITIES IN TANZANIA
 BUSINESS OPPORTUNITIES IN TANZANIA FACT PACK June 2015 Business Sweden in Nairobi TANZANIA BRIEF FACTS BASIC FACTS Population: 49,639,138 (2014) Area: 947,300* sq. km Capital: Dar es Salaam Languages:
ZAMBIA Land of OPPORTUNITIES & PROFITS. Zambia Development Agency
 ZAMBIA Land of OPPORTUNITIES & PROFITS Zambia Development Agency Presentation Strategy Strengths of Zambia Key Investment Consideration Zambia from a Foreign Perspective Sectors of focus for Investment
TOURISM BUSINESS COUNCIL OF SOUTH AFRICA TRENDS AND INDICATORS REPORT. March 2018
 TOURISM BUSINESS COUNCIL OF SOUTH AFRICA TRENDS AND INDICATORS REPORT March 2018 Compiled by: Ms. Tebogo Umanah General Manager: Policy Analysis and Strategic Projects March 2018 Page 1 CONTENTS INTRODUCTION...
Special Note: Upcoming Group Visits:
 Weekly Bulletin, 04 Special Note: Upcoming Group Visits: 05 October Richards Bay Day Visit 08 to 13 October Zambia Group Visit 12 to 17 Group Visit Angola US$97.9 million budgeted for Luanda and Benguela
Africa attractiveness program 2017 Country profiles. 2 June 2017
 Africa attractiveness program 07 Country profiles June 07 The key economies attract the largest share of FDI Countries ranked by FDI projects 0 - (project numbers below are data) South Africa Nigeria Morocco
East African Power Industry Convention 2007, Addis Ababa, ETHIOPIA
 Pan African Electrical Interconnection and Power rade By Dr. Fatma Moustafa, Dr. Babiker Ibrahim, Dr. azem anafi, Mr. Jelal Shafi Eastern Nile echnical Regional Office Nile Basin Initiative East African
Table of CONTENTS. COUNTRY FOCUS: Tunisia
 Africa Statistics Flash Selected Socio-Economic Indicators on Africa October 217 Table of CONTENTS COUNTRY FOCUS: Tunisia ----------------------------------------------------------------------------------------------
REPORT ON WHO STAFF IN THE AFRICAN REGION. Information Document CONTENTS
 11 July 2014 REGIONAL COMMITTEE FOR AFRICA ORIGINAL: ENGLISH Sixty-four session Cotonou, Republic of Benin, 1 5 September 2014 Provisional agenda item 18.1 REPORT ON WHO STAFF IN THE AFRICAN REGION Information
Published 2018 by DSA Architects International 2018 DSA Architects International SAFARI LODGES & GAME RESORTS
 Published 2018 by DSA Architects International 2018 DSA Architects International SAFARI LODGES & GAME RESORTS Safari Lodges & Game Resorts www.dsa-arch.com Published 2018 by DSA Architects International
International migration data in the case of South Africa
 International migration data in the case of South Africa A presentation made at the Workshop on strengthening the collection and use of international migration data for development held in Addis Ababa,
WHY AFRICA? BY BENOIT LA SALLE December 2014
 WHY AFRICA? BY BENOIT LA SALLE December 2014 AFRICA IS THE FUTURE 2 1950 1960 1970 1980 1990 2000 2010 2020 2030 2040 2050 2060 2070 2080 2090 2100 (THOUSANDS) WORKING-AGE POPULATION WORLDWIDE 7 000 000
MEDEXP A F R I C A th. POST SHOW REPORT August Mlimani Conference Centre, Dar-es-Salaam, Tanzania
 20 th MEDEXP A F R I C A 2 0 1 7 East Africa s Largest Int l. Medical, Healthcare, Hospital Supplies & Pharmaceuticals Products & Eqpt. Trade Exhibition POST SHOW REPORT 22-24 August Mlimani Conference
TOURISM STATISTICS ANNUAL REPORT 2012
 TOURISM STATISTICS ANNUAL REPORT 2012 Published by Statistics Botswana, Private Bag 0024, Gaborone Tel: (267) 3934968 Fax: (267) 3952201/3935628 Email: info@statsbots.org.bw Website: www.cso.gov.bw February
Framework for Progressive Destination Competitiveness
 Sub-Saharan Africa Framework for Progressive Destination Competitiveness SSA Countries by Tourism Development Level and World Bank Income Ranking Tourism development level Pre-emerging Low income Central
Table of CONTENTS. COUNTRY FOCUS: Equatorial Guinea
 Africa Statistics Flash Selected Socio-Economic Indicators on Africa August 217 Table of CONTENTS COUNTRY FOCUS: Equatorial Guinea ---------------------------------------------------------------------------
THE AFRICAN DEVELOPMENT BANK GROUP. At the centre of Africa s transformation
 THE AFRICAN DEVELOPMENT BANK GROUP At the centre of Africa s transformation African Development Bank Group At the centre of Africa s transformation The African Development Bank Group is a multilateral
Africa Levant Land of Endless Opportunity. Yvon le Roux Vice President Africa and Levant
 Africa Levant Land of Endless Opportunity Yvon le Roux Vice President Africa and Levant JANUARY 2010 Egypt and Cisco Enabling Transformation A top reformer in the ease of doing business, Egypt is transforming
State of South Africa s Maritime Industry Transport Portfolio Committee. 08 May 2012 Commander Tsietsi Mokhele Chief Executive Officer
 State of South Africa s Maritime Industry Transport Portfolio Committee 08 May 2012 Commander Tsietsi Mokhele Chief Executive Officer An Overview of the SA Maritime Industry 3,000 km coastline in 3 oceans
TABLE OF CONTENTS COUNTRY FOCUS: ALGERIA
 Africa Statistics Flash Selected Socio-Economic Indicators on Africa May 218 TABLE OF CONTENTS COUNTRY FOCUS: ALGERIA ---------------------------------------------------------------------------------------------
SUB-SAHARAN AFRICA (2): POPULATION AND SETTLEMENT GEOGRAPHY
: POPULATION AND SETTLEMENT GEOGRAPHY") SUB-SAHARAN AFRICA (2): POPULATION AND SETTLEMENT GEOGRAPHY 1. Introduction 2. Demographics: population growth and AIDS 3. Rural settlement patterns 4. Urban structures 5. Globalization and Africa: the
SUB-SAHARAN AFRICA (2): POPULATION AND SETTLEMENT GEOGRAPHY 1. Introduction 2. Demographics: population growth and AIDS 3. Rural settlement patterns 4. Urban structures 5. Globalization and Africa: the
Zambia s Investment Opportunities
 Zambia s Investment Opportunities 1 Presented by: Charity Zulu-Mkandawire, First Secretary -Trade Embassy of the Republic of Zambia Washington DC 2 About Zambia Located in the Southern African Sub-region,
THE AFRICAN DEVELOPMENT BANK GROUP. At the centre of Africa s transformation
 THE AFRICAN DEVELOPMENT BANK GROUP At the centre of Africa s transformation African Development Bank Group The African Development Bank Group is a multilateral development finance institution. It was established
Structure. Introduction
 1 Introduction Structure Demographic Dynamics in Africa Determinants of the Demographic Transition Human Development Payoffs Jobs Payoffs Economic Growth in Africa Policies to Speed up the Demographic
22 PEW RESEARCH CENTER. Topline Results. Pew Research Center Spring 2014 survey October 16, 2014 Release
 22 Topline Results Pew Research Center Spring 2014 survey October 16, 2014 Release Methodological notes: Survey results are based on national samples. For further details on sample designs, see Survey
COUNTRY CASE STUDIES: OVERVIEW
 APPENDIX C: COUNTRY CASE STUDIES: OVERVIEW The countries selected as cases for this evaluation include some of the Bank Group s oldest (Brazil and India) and largest clients in terms of both territory
African Infrastructure
 2016 Edition Investment and Market Opportunities in n Infrastructure India Infrastructure Research www.indiainfrastructure.com Table of Contents SECTION I MACRO ANALYSIS 1. Summary and the Way Forward
CONTENTS Executive Summary... iii 1. Introduction Major Destinations for Zambia s Exports Major Source Countries for Zambia s
 Bank of Zambia CONTENTS Executive Summary... iii 1. Introduction... 1 2. Major Destinations for Zambia s Exports... 1 3. Major Source Countries for Zambia s Imports... 4 4. Conclusion... 6 ii Executive
Southern African Development Community (SADC) Grain Trade What does the data say?
 Grain Trade What does the data say?") 15 October 2015 Southern African Development Community (SADC) Grain Trade What does the data say? Tinashe Kapuya (Agbiz Head: International Trade and Investment) and Wandile Sihlobo (Economist at Grain
15 October 2015 Southern African Development Community (SADC) Grain Trade What does the data say? Tinashe Kapuya (Agbiz Head: International Trade and Investment) and Wandile Sihlobo (Economist at Grain
Abercrombie & Kent Southern Africa MICE and Incentive Travel
 Abercrombie & Kent Southern Africa MICE and Incentive Travel 51 offices 26 countries 2,300 employees Argentina Australia Botswana Cambodia Chile China Ecuador Egypt Europe Hong Kong India Italy Jordan
Air Transport: An Engine to Prosperity
 Air Transport: An Engine to Prosperity Mark Smyth Senior Economist, IATA To represent, lead and serve the airline industry Africa in a Global Economic Context Relatively low shares of GDP, trade and air
Financing Sustainable Transport in LLDCs in Africa High Level Meeting October Santa Cruz, Bolivia
 Gylfi Palsson, Lead Transport Specialist and Acting Manager for the LAC Region, World Bank Financing Sustainable Transport in LLDCs in Africa High Level Meeting 13-14 October 2016 - Santa Cruz, Bolivia
TABLE OF CONTENTS COUNTRY FOCUS: BENIN
 Africa Statistics Flash Selected Socio-Economic Indicators on Africa March 218 TABLE OF CONTENTS COUNTRY FOCUS: BENIN ------------------------------------------------------------------------------------------------
Sub-Sahara Capital African Real Estate Update (July 2015)
") Sub-Sahara Capital African Real Estate Update (July 2015) Real estate is one of the best ways to benefit from two powerful African trends, population growth and urbanization. Between 2010 and 2025 the
Sub-Sahara Capital African Real Estate Update (July 2015) Real estate is one of the best ways to benefit from two powerful African trends, population growth and urbanization. Between 2010 and 2025 the
WORLD PRESS FREEDOM INDEX 2012
 WORLD PRESS FREEDOM INDEX 2012 1 Finland -10,00 = - Norway -10,00 = 3 Estonia -9,00 - Netherlands -9,00 5 Austria -8,00 6 Iceland -7,00 - Luxembourg -7,00 8 Switzerland -6,20 9 Cape Verde -6,00 10 Canada
Dealing with the Gathering Clouds
 Dealing with the Gathering Clouds Regional Economic Outlook for sub-saharan Africa Christian Beddies Resident Representative, Zimbabwe International Monetary Fund November 11, 2015 1 Percent Growth in
Benchmarking Travel & Tourism in United Arab Emirates
 Benchmarking Travel & Tourism in United Arab Emirates How does Travel & Tourism compare to other sectors? Summary of Findings, November 2013 Sponsored by: Outline Introduction... 3 UAE summary...... 8
1 What is the African Economic Outlook Project? 2 African Economic Performance: Multifaceted Growth. 3 Africa and Globalization
 African Economic Outlook 2007 Measuring the Pulse of Africa Nicolas Pinaud, OECD Development Centre 经合组织 发展中心 Standard Chartered & the OECD Development Centre AFRICA AND CHINA: ECONOMIC AND BUSINESS PERSPECTIVES
MACRO ECONOMIC PROSPECTS OF AFRICA
 Main Sources: MACRO ECONOMIC PROSPECTS OF AFRICA Africa s Macroeconomic prospects, www.africaneconomicoutlook.org, AfDB, OECD, UNDP (2015) World Bank Statistics (2014) Africa s Economic Growth Africa s
GBTA BTI Outlook and Economic Forecast for Business Travel in Asia Pacific, Thailand and around the World
 GBTA BTI Outlook and Economic Forecast for Business Travel in Asia Pacific, Thailand and around the World Research Sponsored by: Welf J Ebeling Vice President, Operations - Asia Pacific Global Business
cdmccmcml<cm SPOTLIGHT ON AFRICA Clifford D. Mpare, CFA. Chairman and Chief Executive Officer CFA EUROPEAN INVESTMENT CONFERENCE LONDON, 2013.
 1 cdmccmcml
Zambia by Numbers. Foreign Exchange Reserves $1.892 Billion (Dec.2013) Public Debt as a % of GDP 36% (2013)
 Public Debt as a % of GDP 36% (2013)") . Area: 752,614km 2 (39 th ) Population: 14.1 million (71 st ) GDP (PPP): $24.714 billion Per Capita: $1,752 GDP Growth Rate 6.6% 2013 Trade Export: $10.434bn 2013 (f.o.b) Import: $9.414bn Foreign Exchange
. Area: 752,614km 2 (39 th ) Population: 14.1 million (71 st ) GDP (PPP): $24.714 billion Per Capita: $1,752 GDP Growth Rate 6.6% 2013 Trade Export: $10.434bn 2013 (f.o.b) Import: $9.414bn Foreign Exchange
Cambridge International Examinations Cambridge International Advanced Subsidiary and Advanced Level
 Cambridge International Examinations Cambridge International Advanced Subsidiary and Advanced Level *5153973671-I* TRAVEL AND TOURISM 9395/11 Paper 1 Core May/June 2016 INSERT 2 hours 30 minutes READ THESE
Supporting Road Infrastructure Development to Connect Africa: Actions to be taken under the TICAD Process and Japan s Initiatives
 Supporting Road Infrastructure Development to Connect Africa: Actions to be taken under the TICAD Process and Japan s Initiatives Hajime Ueda Principal Deputy Director, Country Assistance Planning Division,
CONTENTS Executive Summary... iii 1. Introduction Major Destinations for Zambia s Exports Major Source Countries for Zambia s
 Bank of Zambia CONTENTS Executive Summary... iii 1. Introduction... 1 2. Major Destinations for Zambia s Exports... 1 3. Major Source Countries for Zambia s Imports... 4 4. Conclusion... 6 ii Executive
`Density of GDP TEXT BOX. GDP per square kilometre
 `Density of GDP TEXT BOX GDP per square kilometre The world at night Light indicates development? Southern Africa State of Cities Finances 2007 Tshwane Ekurhuleni Johannesburg Mangaung Msunduzi ethekwini
The Nordic Countries in an International Comparison. Helga Kristjánsdóttir 20. apríl 2012
 The Nordic Countries in an International Comparison Helga Kristjánsdóttir 20. apríl 2012 15 Figure 1. World Bank, GDP growth (annual %) 10 5 0 1961 1963 1965 1967 1969 1971 1973 1975 1977 1979 1981 1983
EARTHQUAKE HAZARD ZONES - AFRICA
 GAP.15.2.3.1 A Publication of Global Asset Protection Services LLC EARTHQUAKE HAZARD ZONES - AFRICA Algeria Hazard Zones... 1,2,3,4,5,6 Algiers... 6 Oran... 5 Constantine... 5 100 Constitution Plaza, Hartford,
Sub - Saharan Africa
 Sub - Saharan Africa 4/14/2015 Countries with Relative Importance GDP South Africa Gabon Botswana Land Size Sudan Chad Mozambique Madagascar Democratic Republic of the Congo (formerly Zaire) Population
2015 CRS ICT4D CONFERENCE INTRODUCING THE BANDWIDTH AGGREGATION BUYING PROGRAM
 2015 CRS ICT4D CONFERENCE INTRODUCING THE BANDWIDTH AGGREGATION BUYING PROGRAM InsideNGO and NetHope s first connectivity demand-aggregation program, implemented by Hutchison Global Communications (HGC)
Energy Poverty in Africa
 African Energy Commission (AFREC) Paper on Energy Poverty in Africa By Dr. Gilbert NZOBADILA Consultant Energy Policy- AFREC 1 1- Introduction: African background : The African Energy Commission (AFREC)
Market Brief on Zambia
 Market Brief on Zambia Jan 2018 Location Facts and Figures Zambia is a landlocked country in Southern Africa, neighbouring the Democratic Republic of the Congo to the north, Tanzania to the north-east,
Sub-Regional Workshop on the Development and Effective Use of Intellectual Property Statistics for ARIPO Member States
 Sub-Regional Workshop on the Development and Effective Use of Intellectual Property Statistics for ARIPO Member States FERNANDO DOS SANTOS DIRECTOR GENERAL Meikles Hotel, Harare, Zimbabwe September 14,
TOURISM PERFORMANCE HIGHLIGHTS 2016
 TOURISM PERFORMANCE HIGHLIGHTS 2016 Foreword As the tourism marketing arm of the South African Government, South African Tourism has developed an integrated marketing strategy that focuses on leisure and
CONTENTS Executive Summary... iii 1. Introduction Major Destinations for Zambia s Exports Major Source Countries for Zambia s
 Bank of Zambia CONTENTS Executive Summary... iii 1. Introduction... 1 2. Major Destinations for Zambia s Exports... 1 3. Major Source Countries for Zambia s Imports... 3 4. Conclusion... 6 ii Executive
Central Bank of Different Countries
 Country name Afghanistan Albania Algeria Argentina Armenia Aruba Australia Austria Azerbaijan Bahamas Bahrain Bangladesh Barbados Belarus Belgium Belize Benin Bermuda Bhutan Bolivia Bosnia Botswana Brazil
IMD World Talent Report Factor 1 : Investment and Development
 THAILAND 2012 2013 2014 2015 2016 Overall Investment & Development Appeal Rank 2016 37 42 24 Readiness 49 of 61 Factor 1 : Investment and Development Total Public Expenditure on Education Percentage of
Corporate Overview Brochure
 Corporate Overview Brochure Vision: To be recognised as the master distributor, stockist and supplier of reputable brands into Africa. Mission: By consistently exceeding customer expectations, utilising
03 rd. POST SHOW REPORT August Mlimani Conference Centre, Dar-es-Salaam, Tanzania
 03 rd AFRICA 2017 East Africa s Largest International Trade Exhibition On Mining, Processing of Minerals & Safety Eqpt. POST SHOW REPORT 10-12 August Mlimani Conference Centre, Dar-es-Salaam, Tanzania
Market Brief on Ethiopia
 Market Brief on Ethiopia July 2017 Location Facts and Figures Ethiopia, a landlocked, mountainous country in north-eastern Africa in the Horn of Africa. It is bordered by Djibouti, Eritrea, Kenya, Somalia,
ALAN GOLDING ANALYTIKA HOLDINGS (PTY) LTD. Exploration Management, BOTSWANA
 LTD. Exploration Management, BOTSWANA") ALAN GOLDING ANALYTIKA OLDINGS (PTY) LTD Exploration Management, BOTSWANA World Coal July 2014 The challenges in the development of Botswana s coal resources. Where is Botswana? Gabon Congo Dem Rep of
ALAN GOLDING ANALYTIKA OLDINGS (PTY) LTD Exploration Management, BOTSWANA World Coal July 2014 The challenges in the development of Botswana s coal resources. Where is Botswana? Gabon Congo Dem Rep of
Country-wise branches of Indian Banks at Overseas Centres as on January 31, 2018
 Name of the Country Country-wise branches of Indian s at Overseas Centres as on January 31, 2018 Public Sector s Private sector s Total State of of Union Punjab Allahabad Indian Indian UCO Canara Syndica
Sub-Saharan Africa I10- Southern Africa
 GEOGRAPHY Realms, Regions, and Concepts Sub-Saharan Africa I10- Southern Africa THE REGIONS OF SUBSAHARAN AFRICA 1 Southern Africa 10 states 2 East Africa 7 states 3 Equatorial Africa 9 states 4 West Africa
Economic Climate and changing passenger trends in Russia Will claims cost more, or less? RAAKS Conference 25 February 2016 President Hotel, Moscow
 Economic Climate and changing passenger trends in Russia Will claims cost more, or less? RAAKS Conference 25 February 2016 President Hotel, Moscow Outline What do other courts/legal systems do? Economic
INTERNATIONAL TRAVEL AND TOURISM
 INTERNATIONAL TRAVEL AND TOURISM YEAR 2017 1. INTRODUCTION This issue of the Economic and Social Indicators presents data on International Travel and Tourism for the year 2017. A brief on the compilation
Benchmarking Travel & Tourism in Russia
 Benchmarking Travel & Tourism in Russia How does Travel & Tourism compare to other sectors? Sponsored by: Summary of Findings, November 2013 Outline Introduction... 3 Russia summary..... 8 Data sources
Southern Illinois Trade. March 16-27, 2009
 ILLINOIS SBDC INTERNATIONAL TRADE CENTER & AND ILLINOIS OFFICE OF TRADE AND INVESTMENT: Southern Illinois Trade Mission to South America March 16-27, 2009 Brazil, Argentina, Chile, Peru SOUTHERN ILLINOIS