Norwegian's Free Airfare Promotion
|
|
|
- Colleen Sharp
- 5 years ago
- Views:
Transcription
1 Norwegian's Free Airfare Promotion Start planning your next vacation with 200+ cruises to incredible destinations, including Alaska, Bahamas & Florida, Bermuda, Canada & New England, Caribbean, Mexican Riviera and Panama Canal. Plus, choose up to 5 Free Offers and we'll throw in Free Unlimited WiFi. Learn more about your local airport gateways in this document. 1
2 Gateways Akron, OH Chattanooga, TN Grand Forks, ND Manchester, NH Orange County (Santa Ana), CA Santa Barbara, CA Albany, NY Chicago, IL Grand Rapids, MI McAllen, TX Orlando, FL Savannah, GA Albuquerque, NM Cincinnati, OH Great Falls, MT Medford, OR Ottawa - Hull Seattle, WA Allentown, PA Cleveland, Hopkins, OH Greensboro/Winston Salem, NC Memphis, TN Pensacola, FL Shreveport, LA Amarillo, TX Colorado Springs, CO Greenville/Spartanburg, SC Miami, FL Peoria/Bloomington, IL Spokane, WA Atlanta, GA Columbia, SC Harlingen/South Padre Island, TX Midland/Odessa, TX Philadelphia, PA - Int'l Springfield, MO Augusta, GA Columbus, GA Harrisburg, PA Milwaukee, WI Phoenix, AZ St. Louis, MO Austin, TX Columbus, OH Hartford, CT/Springfield, MA Minneapolis - St. Paul, MN Pittsburgh, PA Syracuse, NY Baltimore, MD Corpus Christi, TX Honolulu, HI Mobile, AL - Pascagoula, MS Portland, ME Tallahassee, FL Baton Rouge, LA Dallas/Ft. Worth, TX Houston, TX Moline/Quad Cities, IL Portland, OR Tampa, FL Billings, MT Dayton, OH Huntsville, AL Montgomery, AL Providence, RI Toledo, OH Birmingham, AL Denver, CO Indianapolis, IN Montreal - Dorval Raleigh/Durham, NC Toronto - Lester B. Pearson Bismarck/Mandan, ND Des Moines, IA Jackson, MS Montreal, Canada Reno, NV Toronto, Canada Boise, ID Detroit, MI Jacksonville, FL Nashville, TN Richmond, VA Tri-Cities Regional, TN Boston - Logan, MA Edmonton, International Kansas City, MO New Orleans, LA Roanoke, VA Tucson, AZ Buffalo/Niagara Falls, NY El Paso, TX Knoxville, TN New York - John F. Kennedy, NY Rochester, MN Tulsa, OK Burbank, CA Erie, PA Las Vegas, NV New York - La Guardia, NY Rochester, NY Vancouver, Canada Burlington, VT Eugene, OR Lexington, KY New York - Newark, NJ Sacramento, CA Washington DC - Dulles Int'l Calgary/Banff Cedar Rapids, IA Champaign, IL Charleston, SC Charleston, WV Evansville, IN Flint, MI Fort Lauderdale/Hollywood, FL Fort Myers, FL Fort Wayne, IN Lincoln, NE Little Rock, AR Los Angeles, CA Louisville, KY Lubbock, TX Newport News, VA Norfolk/Virginia Beach, VA Oakland, CA Oklahoma City, OK Omaha, NE Saginaw/Bay City/Midland, MI Salt Lake City, UT San Antonio, TX San Diego, CA San Francisco, CA Washington DC - Ronald Reagan National West Palm Beach, FL Wichita, KS Wilkes Barre/Scranton, PA Charlotte, NC Fresno, CA Madison, WI Ontario, CA San Jose, CA Winnipeg Int'l 3
3 Akron, OH 4
4 Albany, NY 5
5 Albuquerque, NM 6
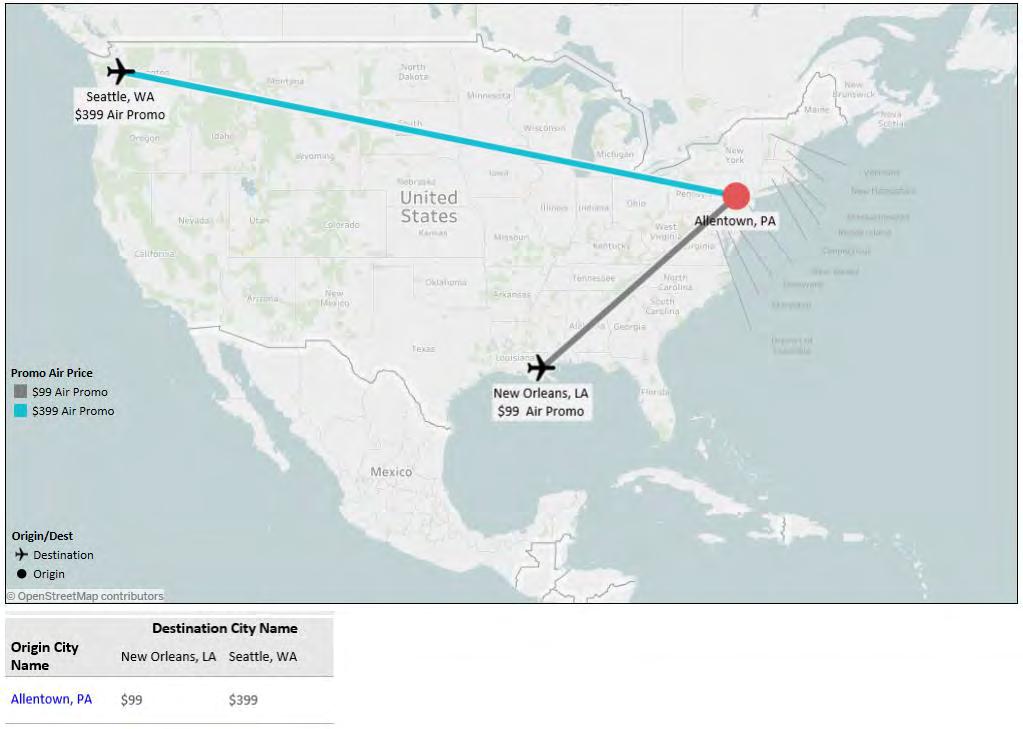
6 Allentown, PA 7
7 Amarillo, TX 8
8 Atlanta, GA 9
9 Augusta, GA 10
10 Austin, TX 11
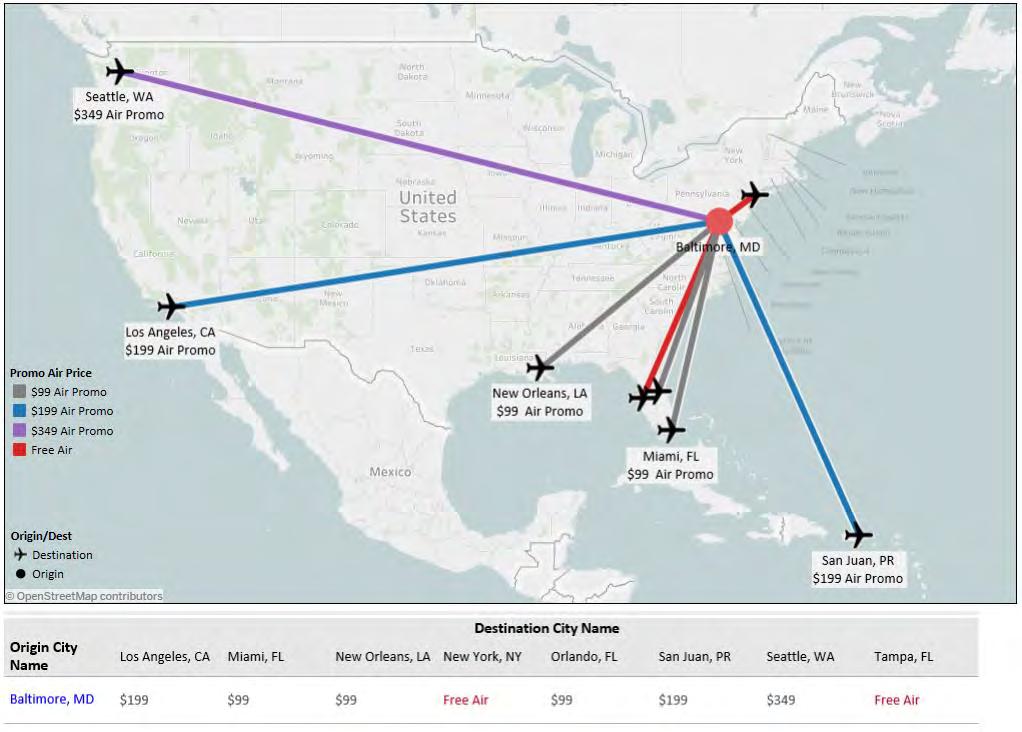
11 Baltimore, MD 12
12 Baton Rouge, LA 13
13 Billings, MT 14
14 Birmingham, AL 15
15 Bismarck/Mandan, ND 16
16 Boise, ID 17

17 Boston - Logan, MA 18
18 Buffalo/Niagara Falls, NY 19
19 Burbank, CA 20
20 Burlington, VT 21
21 Calgary/Banff 22
22 Cedar Rapids, IA 23
23 Champaign, IL 24
24 Charleston, SC 25
25 Charleston, WV 26
26 Charlotte, NC 27
27 Chattanooga, TN 28
28 Chicago, IL 29
29 Cincinnati, OH 30
30 Cleveland, Hopkins, OH 31
31 Colorado Springs, CO 32
32 Columbia, SC 33
33 Columbus, GA 34
34 Columbus, OH 35
35 Corpus Christi, TX 36
36 Dallas/Ft. Worth, TX 37
37 Dayton, OH 38
38 Denver, CO 39
39 Des Moines, IA 40
40 Detroit, MI 41
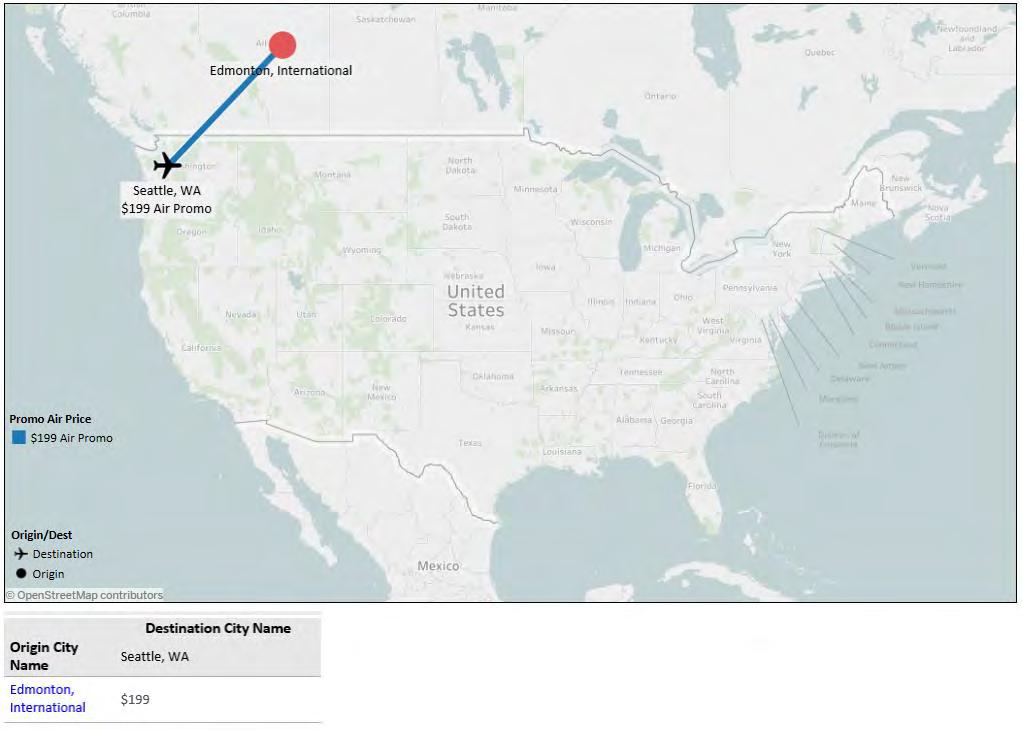
41 Edmonton, International 42
42 El Paso, TX 43
43 Erie, PA 44
44 Eugene, OR 45
45 Evansville, IN 46
46 Flint, MI 47
47 Fort Lauderdale/Hollywood, FL 48
48 Fort Myers, FL 49
49 Fort Wayne, IN 50
50 Fresno, CA 51
51 Grand Forks, ND 52
52 Grand Rapids, MI 53
53 Great Falls, MT 54
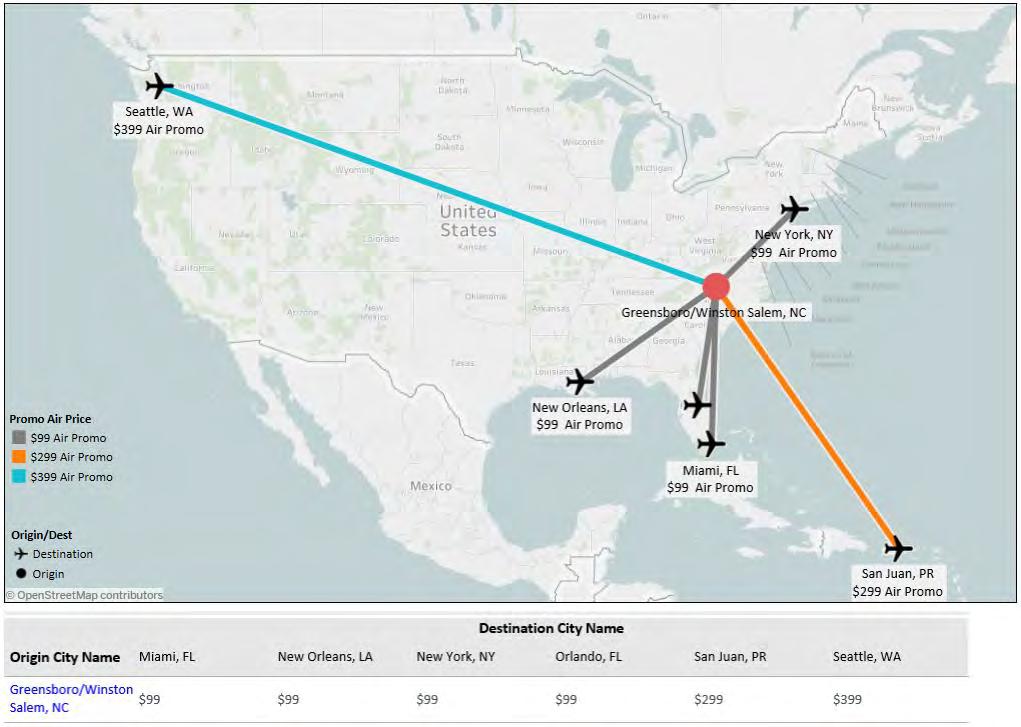
54 Greensboro/Winston Salem, NC 55
55 Greenville/Spartanburg, SC 56
56 Harlingen/South Padre Island, TX 57
57 Harrisburg, PA 58

58 Hartford, CT/Springfield, MA 59

59 Honolulu, HI 60
60 Houston, TX 61
61 Huntsville, AL 62
62 Indianapolis, IN 63
63 Jackson, MS 64
64 Jacksonville, FL 65
65 Kansas City, MO 66
66 Knoxville, TN 67
67 Las Vegas, NV 68
68 Lexington, KY 69
69 Lincoln, NE 70
70 Little Rock, AR 71
71 Los Angeles, CA 72
72 Louisville, KY 73
73 Lubbock, TX 74
74 Madison, WI 75
75 Manchester, NH 76
76 McAllen, TX 77
77 Medford, OR 78
78 Memphis, TN 79
79 Miami, FL 80
80 Midland/Odessa, TX 81
81 Milwaukee, WI 82

82 Minneapolis - St. Paul, MN 83
83 Mobile, AL - Pascagoula, MS 84
84 Moline/Quad Cities, IL 85
85 Montgomery, AL 86
86 Montreal Dorval 87
87 Montreal, Canada 88
88 Nashville, TN 89
89 New Orleans, LA 90
90 New York - John F. Kennedy, NY 91
91 New York - La Guardia, NY 92
92 New York - Newark, NJ 93
93 Newport News, VA 94
94 Norfolk/Virginia Beach, VA 95
95 Oakland, CA 96
96 Oklahoma City, OK 97
97 Omaha, NE 98
98 Ontario, CA 99
99 Orange County (Santa Ana), CA 100
100 Orlando, FL 101
101 Ottawa Hull 102
102 Pensacola, FL 103
103 Peoria/Bloomington, IL 104
104 Philadelphia, PA - Int'l 105
105 Phoenix, AZ 106
106 Pittsburgh, PA 107
107 Portland, ME 108
108 Portland, OR 109
109 Providence, RI 110
110 Raleigh/Durham, NC 111
111 Reno, NV 112
112 Richmond, VA 113
113 Roanoke, VA 114
114 Rochester, MN 115
115 Rochester, NY 116
116 Sacramento, CA 117
117 Saginaw/Bay City/Midland, MI 118
118 Salt Lake City, UT 119
119 San Antonio, TX 120
120 San Diego, CA 121
121 San Francisco, CA 122
122 San Jose, CA 123
123 Santa Barbara, CA 124
124 Savannah, GA 125
125 Seattle, WA 126
126 Shreveport, LA 127
127 Spokane, WA 128
128 Springfield, MO 129
129 St. Louis, MO 130
130 Syracuse, NY 131
131 Tallahassee, FL 132
132 Tampa, FL 133
133 Toledo, OH 134
134 Toronto - Lester B. Pearson 135
135 Toronto, Canada 136
136 Tri-Cities Regional, TN 137
137 Tucson, AZ 138
138 Tulsa, OK 139
139 Vancouver, Canada 140
140 Washington DC - Dulles Int'l 141
141 Washington DC - Ronald Reagan National 142
142 West Palm Beach, FL 143
143 Wichita, KS 144
144 Wilkes Barre/Scranton, PA 145
145 Winnipeg Int'l 146
Location, Location, Location. 19 th Annual NIC Conference NIC MAP Data & Analysis Service
 Location, Location, Location 19 th Annual NIC Conference NIC MAP Data & Analysis Service The Great Occupancy Decline 94% Occupancy Trends Majority Nursing Seniors Housing 93% 92% 91% 92.8% 91.0% 90% 89%
Hector International Airport Fargo, North Dakota
 Hector International Airport Fargo, North Dakota Volume 073 Twelve Months Ended September 2007 January 2008 Airlines Serving Fargo Carried 831 Onboard Passengers Per Day for the Twelve Months Ended September
Hector International Airport Fargo, North Dakota
 Hector International Airport Fargo, North Dakota Volume 072 Twelve Months Ended June 2007 November 2007 Airlines Serving Fargo Carried 830 Onboard Passengers Per Day for the Twelve Months Ended June 2007,
Lower Income Journey to Work Market Share From American Community Survey
 Lower Income Journey to Work Market Share From American Community Survey 2006-2010 Table 1: Overall National Data Table 2: Car, Truck or Van Table 3: Transit Table 4: Metrics Table 1 Work Trip Market Share:
Hector International Airport Fargo, North Dakota
 Hector International Airport Fargo, North Dakota Volume 081 Twelve Months Ended March 2008 July 2008 Airlines Serving Fargo Carried 838 Onboard Passengers Per Day for the Twelve Months Ended March 2008,
Rank Place State Native Hawaiian and Pacific Islander population (alone or in combination
 TABLE 2a: 100 Largest Places Ranked by Number of s (race alone or in *) Living in Hard-to- Census Rank Place State (alone or in 1 Honolulu (CDP) HI 64,196 11,130 17.3 2 New York City NY 14,981 8,211 54.8
333 W. Campbell Road, Suite 440 Richardson, Texas Cruising for Charity with Randy Limbacher in Tahiti July 28, 2007
 333 W. Campbell Road, Suite 440 Richardson, Texas 75080 972.238.1998 800.952.1998 Cruising for Charity with Randy Limbacher in Tahiti July 28, 2007 Join me for this special annual event to raise money
District Match Data Availability
 District Match Data Availability National & State Data Location Available National Data Australia Parliament, Provincial and Territory Assemblies Canada Parliament, Provincial Legislative Assemblies New
Major Metropolitan Area Sales Tax Rates
 August 19, 2010 No. 239 FISCAL FACT Major Metropolitan Area Sales Tax Rates By Lawrence Summers Introduction General sales taxes levied by state, county and city governments in the United States vary greatly,
Appendix A TRIP Urban Roads Report 2018
 Appendix A TRIP Urban Roads Report 2018 Pavement Conditions and Extra Vehicle Operating Costs for Urban Areas with Population of 500K or More Akron OH 49% 12% 14% 25% $837 Albany Schenectady Troy NY 15%
Charleston, WV 18 Juneau, AK Peoria, IL Jefferson City,
 2004 Ranking Diocese Catholics Diocesan Seminarians 2004 Ratio (Catholics / Seminarians) 2003 Ranking 1 Lincoln, NE 89431 35 2555 2 2 Yakima, WA 68561 20 3428 5 3 Savannah, GA 75987 22 3454 13 4 Cheyenne,
Per capita carbon emissions from transportation and residential energy use, 2005
 Per capita carbon emissions from transportation and residential energy use, 2005 Metropolitan Area Carbon Footprint Honolulu, HI 1 1.356 Los Angeles-Long Beach-Santa Ana, CA 2 1.413 Portland-Vancouver-Beaverton,
STATE OF UTAH "BEST VALUE" COOPERATIVE CONTRACT CONTRACT NUMBER: AR2270 November 14, 2016
 Item: Contracted Airline Fares Purchasing Agent: Chad Hinds Phone #: (801) 538-1287 Email: chinds@utah.gov Vendor: 112932A Internet Homepage: Delta Air Lines, Inc. 1030 Delta Blvd. Atlanta, GA 30354 www.statetravel.utah.gov
Item 185 Storage-In-Transit First Ea. Add'l. Service
 Service Day Day 4 Birmingham, AL 19.62 0.68 2 8 Dothan, AL 15.08 0.48 2 12 Huntsville, AL 15.55 0.50 2 16 Mobile, AL 16.23 0.68 3 20 Montgomery, AL 16.23 0.68 3 22 State of Alaska 14.76 0.55 4 24 Flagstaff,
Service Service Area Name
 Atlas Van Lines, Inc. Origin and Destination s Effective: 05/15/2018 Area Name 4 Birmingham, AL 6.99 8 Dothan, AL 4.80 12 Huntsville, AL 7.37 16 Mobile, AL 4.80 20 Montgomery, AL 7.37 22 State of Alaska
Population Estimates for U.S. Cities Report 1: Fastest Growing Cities Based on Numeric Increase,
 ulation s for U.S. Cities Report 1: Fastest Growing Cities Based on Numeric Increase, 2015-2015 1 Phoenix AZ 32,113 2.0 1,582,904 1,615,017 167,393 11.6 2 Los Angeles CA 27,173 0.7 3,949,149 3,976,322
ALN Apartment Data, Inc. (Continued on next page)
") AK - Anchorage 93.0% 90.9% -210-2.2% $1,035 $1,018-1.7% 93.0% 90.9% -210-2.2% $1,035 $1,018-1.7% AK - Misc. AK 90.3% 86.8% -350-3.8% $1,218 $1,245 2.3% 90.3% 86.8% -350-3.8% $1,218 $1,245 2.3% Alaska Average
AK - Anchorage 93.0% 90.9% -210-2.2% $1,035 $1,018-1.7% 93.0% 90.9% -210-2.2% $1,035 $1,018-1.7% AK - Misc. AK 90.3% 86.8% -350-3.8% $1,218 $1,245 2.3% 90.3% 86.8% -350-3.8% $1,218 $1,245 2.3% Alaska Average
Appendix D: Aggregation Error for New England Metro Areas and for Places
 Appendix D: for New England Metro Areas and for Places D-1 Appendix D: s Figure D-1: New England Metro Areas - Summary of Tract s (2000) Metro ID (msapma99) Metro Area Name Census NCDB 1120 Boston, MA-NH
Non-stop Scheduled Passenger Service at Fargo as of October Top 20 Domestic O&D Passenger Markets at Fargo Twelve Months Ended June 2006
 0 5000 10000 15000 20000 25000 30000 35000 40000 45000 50000 Airport Traffic Quarterly Non-stop Scheduled Passenger Service at Fargo as of October 2006 Top 20 Domestic O&D Passenger Markets at Fargo Twelve
Oct-17 Oct-18 bps %CHG Oct-17 Oct-18 %CHG Oct-17 Oct-18 bps %CHG Oct-17 Oct-18 %CHG
 AK - Anchorage 92.6% 89.9% -270-2.9% $1,023 $1,011-1.2% 92.6% 89.9% -270-2.9% $1,023 $1,011-1.2% AK - Misc. AK 89.9% 85.8% -410-4.6% $1,227 $1,230 0.2% 89.9% 85.8% -410-4.6% $1,227 $1,230 0.2% Alaska Average
US Cities Over 100,000 Population in 1998 & 1990
 US Cities Over 100,000 Population in 1998 & 1990 Population Ranking Alphabetical Listing Population Change Ranking Percentage Population Change Ranking DEMOGRAPHIA An undertaking of Wendell Cox Consultancy
Initial Locations of 2020 Area Census Offices
 1 of 6 Anchorage* AK At Large Birmingham* AL 007 Huntsville AL 005 Mobile AL 001 Fayetteville AR 003 Little Rock AR 002 Flagstaff AZ 001 Window Rock AZ 001 Maricopa (Central)* AZ 006 Maricopa (South) AZ
FBI Drug Demand Reduction Coordinators
 FBI Drug Demand Reduction Coordinators Alabama 2121 Building, Room 1400 Birmingham, AL 35203 (205) 252 7705 One St. Louis Centre One St. Louis Street Mobile, AL 36602 (334) 438 3674 Alaska 222 West Seventh
DEGREE DAY AND DESIGN TEMPERATURES
 DEGREE DAY AND TABLE D DEGREE DAY AND a FOR CITIES IN THE UNITED S / % Dry bulb / % Wet bulb / % AL Birmingham Huntsville Mobile Montgomery, 3,,, 33 3 3 3 3 AK Anchorage Fairbanks Juneau Nome,,,, -8-8
(See Note 1) Solar Energy Factor (SEF D ) Solar Fraction (SF D ) Estimated Energy Savings SYSTEM DETAILS
 Solar Energy Factor (SEF D ) Solar Fraction (SF D ) Estimated Energy Savings SYSTEM DETAILS") OG-300 ICC-SRCC TM CERTIFIED SOLAR SYSTEM # SYSTEM INFORMATION Pumped Internal Backup: Gas Tank Collector Type: Glazed Flat Plate Solar Tank Volume: 379 liter (100 gal) Collector Heat Transfer Fluid: GRAS
OG-300 ICC-SRCC TM CERTIFIED SOLAR SYSTEM # SYSTEM INFORMATION Pumped Internal Backup: Gas Tank Collector Type: Glazed Flat Plate Solar Tank Volume: 379 liter (100 gal) Collector Heat Transfer Fluid: GRAS
2012 Airfares CA Out-of-State City Pairs -
 2012 Airfares Out-of-State City Pairs - Contracted rates are from July 1, 2012 through June 30, 2013. Please note all fares are designated as () and ( ) in airline computer reservation systems. fares are
INDIANA INTERSTATE AND INTRASTATE LOCAL REDUCED CITY-PAIR FARES
 The following section contains city-pair fares that are lower than walkup mileage-based fares. Although shown in only one direction, the fares in this section apply in both directions, unless otherwise
Census Affects Children in Poverty by Professors Donald Hernandez and Nancy Denton State University of New York, Albany
 Phone: (301) 457-9900 4700 Silver Hill Road, Suite 1250-3, Suitland, MD 20746 Fax: (301) 457-9901 Census Affects in Poverty by Professors Donald Hernandez and Nancy Denton State University of New York,
CONNECTICUT INTERSTATE AND INTRASTATE LOCAL REDUCED CITY-PAIR FARES
 PASSENGER TARIFF AND SALES MANUAL CONNECTICUT INTERSTATE AND INTRASTATE LOCAL REDUCED CITY-PAIR S The following section contains city-pair fares that are lower than walkup mileage-based fares. Although
ILLINOIS INTERSTATE AND INTRASTATE LOCAL REDUCED CITY-PAIR FARES
 The following section contains city-pair fares that are lower than walkup mileage-based fares. Although shown in only one direction, the fares in this section apply in both directions, unless otherwise
Park-Related Total* Expenditure per Resident, by City
 Park-Related Total* per Resident, by City FY 2008 City Population Total Park per Resident Washington, D.C. 591,833 $153,324,830 $259 Seattle 598,541 $150,672,543 $252 Scottsdale 235,371 $50,429,049 $214
TOP 100. Transit Bus Fleets Agency 35 ft. Over Artic and 35 ft. Total +/- under 0 3, ,426 82
 L.A. Metro-No. 3 1 1 MTA New York City Transit New York City 2 2 New Jersey Transit Corp. Newark, N.J. 3 3 Metro Los Angeles 4 5 Toronto Transit Commission Toronto 5 10 Chicago Transit Authority Chicago
Agency 35 ft. Over Artic. Trolley 2012 Total and 35 ft. under. 1 1 MTA New York City Transit 0 3, ,344 New York City
 Capital Metro-No. 40 Courtesy Capital Metro 1 1 MTA New York City Transit 0 3,704 640 0 4,344 New York City 2 3 New Jersey Transit Corp. 47 2,263 85 0 2,395 Newark, N.J. 3 2 Metro 50 1,956 378 0 2,384
2012 Airport Ground Transportation
 212 Airport Ground Transportation Fees and Fares Survey Summary March 212 AGTA 212 Airport Fees and Fares Survey Summary Survey Respondents Atlantic City International Airport Gulfport-Biloxi International
TOP 100 Bus Fleets Agency 35 ft. and Over Artic under 35 ft. Total. 18 < metro magazine SEPTEMBER/OCTOBER 2018 metro-magazine.
 1 1 MTA New York City Transit/MTA Bus Co. 0 4,860 951 5,811 New York City 2 3 New Jersey Transit Corp. 418 2,879 85 3,382 Newark, N.J. 3 2 Los Angeles County Metropolitan Transportation Authority 50 1,882
Higher Education in America s Metropolitan Areas A Statistical Profile
 Higher Education in America s Metropolitan Areas A Statistical Profile MSA Study No.2 Higher Education in America s Metropolitan Areas A Statistical Profile CONTENTS Why Metro Areas? 1 Executive Summary
 Snakes & Lattes is currently composed of three corporate owned and operated board game cafes in Toronto, ON. Over the last 7 years these have become renowned as Toronto's premiere board game cafe destinations.
RANKING OF THE 100 MOST POPULOUS U.S. CITIES 12/7/ /31/2016
 OVERVIEW OF THE DATA The following information is based on incoming communication to the National Human Trafficking Hotline via phone, email, and online tip report from December 7, 2007 December 31, 2016
2015 U.S. PLACE EQUITY INDEX RESONANCE REPORT
 2015 U.S. PLACE EQUITY INDEX RESONANCE REPORT RESONANCE CONSULTANCY CREATES DEVELOPMENT STRATEGIES, PLANS, POLICIES AND BRANDS THAT SHAPE THE FUTURE OF PLACES AROUND THE WORLD. INTRODUCTION All cities,
Monthly Employment Watch: Milwaukee and the Nation's Largest Cities
 Monthly Employment Watch: Milwaukee and the Nation's Largest Cities A monthly report on employment trends in the nation s largest cities Prepared by: The University of Wisconsin-Milwaukee Center for Economic
Greater Orlando Aviation Authority Orlando International Airport Destinations by Airline December 2017
 Aer Lingus Dublin, Ireland 3 3 0 0 Aeromexico Mexico City, Mexico 19 4 19 4 0 Air Canada Halifax, Nova Scotia 2 2 Montreal/Dorval, Quebec 12 1 Ottawa, Ontario 5 3 1 Toronto, Ontario 20 1 Vancouver, British
Access Across America: Transit 2014
 Access Across America: Transit 2014 Final Report CTS 14-11 Prepared by: Andrew Owen David Levinson Accessibility Observatory Department of Civil, Environmental, and Geo- Engineering University of Minnesota
National Electric Rate Study
 National Electric Rate Study Ranking of typical residential, commercial and industrial electric bills 2017 Study 1040 O Street, P.O. Box 80869 Lincoln, NE 68501-0869 p: 402.475.4211 www.les.com Lincoln
Metropolitan Votes and the 2012 U.S. Election: Population, GDP, Patents and Creative Class
 politan Votes and the 2012 U.S. Election: Population, GDP, Patents and Creative Class Author: Shawn Gilligan, Shawn.Gilligan@rotman.utoronto.ca Zara Matheson, Zara.Matheson@rotman.utoronto.ca Kevin Stolarick,
The 156 Arts & Economic Prosperity III Study Regions
 Full-Time Resident Local NATIONAL ESTIMATES OF ECONOMIC IMPACT $63,053,399,000 $103,145,088,000 $166,198,487,000 5,695,361 $104,234,116,000 $7,936,383,000 $9,140,633,000 AK City of Homer A 5,364 $1,248,208
MARKETBEAT U.S. Office
 MARKETBEAT U.S. Office Q4 2018 U.S. OFFICE Employment Indicators Market Indicators (Overall) Office: Net Absorption/Asking Rent 4Q TRAILING AVERAGE Office: Overall Vacancy Q4 17 Q4 18 Total Nonfarm Employment
Average Years Between Claims Best Drivers Report Ranking. Change in Ranking From 2017 to 2018
 2018 Best Drivers Report Ranking City Average Years Between Claims Relative Claim Likelihood (Compared to National Average) 2018 Drivewise Hard-Braking Events Per 1,000 Miles 1 2017 Best Drivers Report
Alabama Y Y Birmingham-Hoover, AL Y Y. Alaska N/A. Arizona N Y Phoenix-Mesa-Scottsdale, AZ N Y Tucson, AZ N Y
 - requires bidders to obtain out of state Alabama Y Y Birmingham-Hoover, AL Y Y Alaska Arizona N Y Phoenix-Mesa-Scottsdale, AZ N Y Tucson, AZ N Y Arkansas Y N Little Rock-North Little Rock, AR Y N Memphis,
SAMPLE SAMPLE. Metro Housing Starts Forecast Chartbook October
 2.5 Metro Housing Starts Forecast Chartbook 2016-2018 October 2016 2.0 1.5 0.5 1990 1994 1998 2002 2006 2010 2014 2018 www.housingeconomics.com Table of Contents (Metro Housing Starts Forecasts and Economic
Passengers Boarded At The Top 50 U. S. Airports ( Updated April 2
 (Ranked By Passenger Enplanements in 2006) Airport Table 1-41: Passengers Boarded at the Top 50 U.S. Airportsa Atlanta, GA (Hartsfield-Jackson Atlanta International) Chicago, IL (Chicago O'Hare International)
Monthly Employment Watch: Milwaukee and the Nation's Largest Cities
 Monthly Employment Watch: Milwaukee and the Nation's Largest Cities A monthly report on employment trends in the nation s largest cities Prepared by: The University of Wisconsin-Milwaukee Center for Economic
MARKETBEAT U.S. Office
 MARKETBEAT U.S. Office Q3 2018 U.S. OFFICE Employment Indicators Market Indicators (Overall) Office: Net Absorption/Asking Rent 4Q TRAILING AVERAGE Office: Overall Vacancy Q3 17 Q3 18 Total Nonfarm Employment
MARKETBEAT U.S. Industrial Snapshot Q4 2015
 MARKETBEAT U.S. Industrial Snapshot Q4 2015 U.S. INDUSTRIAL Employment Indicators Q4 14 Q4 15 Total Nonfarm Employment 140.2M 143.0M Industrial Employment 23.4M 23.6M Unemployment 5.7% 5.0% Market Indicators
MARKETBEAT U.S. Office
 MARKETBEAT U.S. Office Q2 2017 U.S. OFFICE Employment Indicators Q2 16 Q2 17 Total Nonfarm Employment 143.9M 146.2M Office-using Employment 30.1M 31.8M Unemployment 4.9% 4.4% Source: BLS Market Indicators
Social Media In Your New & Improved Phoenix Sky Harbor
 Social Media In Your New & Improved Phoenix Sky Harbor AZ Chapter of HSMAI September 19, 2013 It always begins & ends with: skyharbor.com Began Facebook page in October 2010 More than 27,000 people Like
NCCCO Certifications
 NCCCO Certifications NCCCO Mobile Crane Operator (CCOP-MC) The Preparatory Program will prepare experienced operators for their NCCCO Written & Practical Exams on Lattice Boom and/or Telescopic Boom Fixed
MARKETBEAT U.S. Office
 MARKETBEAT U.S. Office Q3 2017 U.S. OFFICE Employment Indicators Net Absorption/Rent 4-QTR TRAILING AVERAGE Q3 16 Q3 17 Total Nonfarm Employment 144.7M 146.6M Office-using Employment 31.3M 31.9M Unemployment
Florida's Scheduled Commercial Service Airports
 Florida's Scheduled Commercial Service Airports Volume 154 May 2016 - Domestic Airlines Serving Florida Carried 170,726 Onboard Passengers Per Day for, up 7.7% over the previous 12 months. Highlights in
The FMR history file contains the following fields, all for 2-bedroom FMRs. It is in EXCEL format for easy use with database or spreadsheet programs.
 The FMR history file contains the following fields, all for 2-bedroom FMRs. It is in EXCEL format for easy use with database or spreadsheet programs. GENERAL NOTES 1. There are no Fiscal Year 1984 FMRs
World Class Airport For A World Class City
 World Class Airport For A World Class City Air Service Update October 2017 2017 Air Service Updates February 2017 Cleveland new destination, 2x weekly Raleigh-Durham new destination, 2x weekly March 2017
Greater Orlando Aviation Authority Orlando International Airport Airlines by Destination April 2017
 s by Destination Aguadilla, PR JetBlue 7 Akron/Canton, OH Southwest 1 4 Spirit 7 7 Albany, NY JetBlue 7 Southwest 20 1 1 Albuquerque, NM Southwest 1 1 Aruba, Netherlands Antilles Southwest 7 Atlanta, GA
International Convention Badges
 Images may not be the actual size. (Reduced the image sizes to save white space in the catalog) Images provided by Lion Verle Malik Created 07/24/2015. 1923 1924 1925 7th Annual Convention June 26-29,
MARKETBEAT U.S. Office
 MARKETBEAT U.S. Office Q4 2017 U.S. OFFICE Employment Indicators Q4 16 Q4 17 Total Nonfarm Employment 145.2M 147.2M Office-using Employment 31.5M 32.1M Unemployment 4.7% 4.1% Source: BLS Market Indicators
MANGO MARKET DEVELOPMENT INDEX REPORT
 MANGO MARKET DEVELOPMENT INDEX REPORT 2015-2016 UNDERSTANDING THE MARKET INDEX The Mango Market Development Index is designed to measure and compare mango sales volume relative to population by region
Peak to Trough Price Decline of less that 10% Peak to Trough Price Decline between 10% and 20%
 Peak to Trough Price Decline of less that 10% Minimal Price Decline Pop. Rank Market Peak to Trough % Decline Current Rebound% 4 Dallas-Fort Worth-Arlington, TX -4.68% 115.17% 35 Austin-Round Rock, TX
2015 Region 1 Conference in Manchester, NH Attendance by States/Provinces
 Rgion 1 Confrnc Yar Attndanc 2017 448 2016 490 2015 457 2014 527 2013 308 2017 Rgion 1 Vrona, NY 2016 Rgion 1 Portland, ME 2015 Rgion 1 Manchstr, NH 2014 Rgion 1 Manchstr, NH CT 25 CT 41 CT 50 CT 59 CT
MARKETBEAT U.S. Office
 MARKETBEAT U.S. Office Q4 2016 U.S. OFFICE Employment Indicators Market Indicators (Overall) Q4 15 Q4 16 Vacancy Rate 13.5% 13.2% Net Absorption 20.5M 6.9M Under Construction 94.5M 100.2M Weighted Asking
World Class Airport For A World Class City
 World Class Airport For A World Class City Air Service Update December 2018 2018 Air Service Updates February 2018 Delta Air Lines Seattle new departure, seasonal, 2x weekly Delta Air Lines Boston new
2016 Air Service Updates
 Air Service Update May 2016 2016 Air Service Updates February 2016 Pittsburgh new destination, 2x weekly April 2016 Los Angeles new departure, 1x daily Atlanta new departure, 1x daily Jacksonville new
MARKETBEAT U.S. Office
 MARKETBEAT U.S. Office Q1 2017 U.S. OFFICE Employment Indicators Q1 16 Q1 17 Total Nonfarm Employment 143.4M 145.7M Offi ce-using Employment 30.9M 31.7M Unemployment 4.9% 4.6% Source: BLS Market Indicators
2016 Air Service Updates
 Air Service Update September 2016 2016 Air Service Updates February 2016 Pittsburgh new destination, 2x weekly April 2016 Los Angeles new departure, 1x daily Atlanta new departure, 1x daily Jacksonville
PUBLIC TRANSPORTATION INTRODUCTION
 PUBLIC TRANSPORTATION INTRODUCTION 1 OUTLINE Current Status and Recent Trends Significant Influences A Critical Assessment Arguments Supporting Public Transport Future Influences Ingredients for Future
ECON 166 Lecture 2. J. M. Pogodzinski
 ECON 166 Lecture 2 J. M. Pogodzinski Broad Themes in the Course Measurement Theory Policy 8/27/2014 J. M. Pogodzinski 2 Measurement What is urban? What is the record of urban growth? What is distinct about
Corrupt convictions: *cities 250k 150k since 1990
 Corrupt convictions: *Mayor of New Orleans, LA Mayor Ray Nagin Mayor/Council *Mayor of Baltimore, MD Sheila Dixon Mayor/Council *Mayor of Detroit, MI Kwame Kilpatrick Mayor/Council *Mayor of Birmingham,
MARKETBEAT U.S. Industrial
 MARKETBEAT U.S. Industrial Q2 2018 U.S. INDUSTRIAL Employment Indicators Q2 17 Q2 18 Total Nonfarm Employment 146.3M 148.7M Industrial Employment 31.6M 32.5M Unemployment 4.3% 3.9% Source: BLS Market Indicators
MARKETBEAT U.S. Industrial
 MARKETBEAT U.S. Industrial Q3 2018 U.S. INDUSTRIAL Employment Indicators Q3 17 Q3 18 Total Nonfarm Employment 146.9M 149.3M Industrial Employment 31.5M 32.3M Unemployment 4.4% 3.9% Source: BLS Market Indicators
MTL MOUNT LAUREL NJ 5,841 5, , ,890 5,804 2,069 NEW NEWARK NJ 32,490 29,227 3,168 12, ,675 32,558 12,583 NOL
 2010 ABQ ALBUQUERQUE NM 1,657 1,560 75 604 23 21 1 2 1,680 1,657 606 AGA AGANA GUAM 672 650 55 304 91 44 16 34 763 765 338 ALB ALBANY NY 2,018 1,809 123 774 16 4-8 2,034 1,936 782 ANC ANCHORAGE AK 956
World Class Airport For A World Class City
 World Class Airport For A World Class City Air Service Update April 2017 2017 Air Service Updates February 2017 Cleveland new destination, 2x weekly Raleigh-Durham new destination, 2x weekly March 2017
Greater Orlando Aviation Authority Orlando International Airport Airlines by Destination December 2017
 s by Destination Aguadilla, PR JetBlue 7 2 Akron/Canton, OH Southwest 1 Spirit 6 1 Albany, NY JetBlue 7 Southwest 14 1 Aruba, Netherlands Antilles Southwest 7 Atlanta, GA Delta 112 1 3 Frontier s 7 Southwest
Airport Code BTR Airport Code GGG. Departure Times Arrival Times Departure Times Arrival Times
 Baton Rouge, LA and Longview, TX Airport Code BTR Airport Code GGG Sun Country Airlines Ticket Counter - Next to United - Main Times Arrival Times Terminal. Times Arrival Times Main Terminal - One Ticket
Mango Market Development Index
 Mango Market Development Index 2016-2017 Understanding the Market Index The Mango Market Development Index is designed to measure and compare mango volume sold at retail relative to population by region
U.S. Metropolitan Area Exports, 2015
 U.S. Metropolitan Area Exports, 2015 Jeffrey Hall Office of Trade and Economic Analysis Industry and Analysis Department of Commerce International Trade Administration September 2016 U.S. Metro Exports:
2016 Training Schedule
 2016 Training Schedule NCCCO Certifications NCCCO Mobile Crane Operator (CCOP-MC) The Preparatory Program will prepare experienced operators for their NCCCO Written & Practical exams on Lattice Boom and/or
U.S. Office Snapshot Q1 2016
 MARKETBEAT U.S. Office Snapshot Q1 2016 U.S. OFFICE Employment Indicators Q1 15 Q1 16 Total Nonfarm Employment 140.8M 143.5M Offi ce-using Employment 30.2M 31.0M Unemployment 5.6% 4.9% Source: BLS Market
MARKETBEAT U.S. Industrial
 MARKETBEAT U.S. Industrial Q2 2017 U.S. INDUSTRIAL Employment Indicators Q2 16 Q2 17 Total Nonfarm Employment 143.9M 146.2M Industrial Employment 25.2M 25.6M Unemployment 4.9% 4.4% Source: BLS Market Indicators
United States Office 2Q 2016
 MARKETBEAT United States Office 2Q 2016 U.S. OFFICE Employment Indicators Market Indicators Net Absorption/Rent 4Q TRAILING AVERAGE Overall Vacancy 2Q 15 2Q 16 Total Nonfarm Employment 141.5M 143.9M Offi
Augusta-Richmond County MSA in the Top Ten for Cities Winning the Battle For Information Jobs 2014
 For Additional Information: Walter C. Sprouse, Jr., CEcD, CCE, FM 706-821-1321 706-284-5610 FOR IMMEDIATE RELEASE Augusta-Richmond County MSA in the Top Ten for Cities Winning the Battle For Information
Monthly Employment Watch: Milwaukee and the Nation's Largest Cities
 Monthly Employment Watch: Milwaukee and the Nation's Largest Cities A monthly report on employment trends in the nation s largest cities Prepared by: The University of Wisconsin-Milwaukee Center for Economic
Southern Innkeepers 104 th Annual Meeting Lodging Overview. Jan D. Freitag Senior Vice President
 Southern Innkeepers 104 th Annual Meeting Lodging Overview Jan D. Freitag Senior Vice President 1 Agenda Total US Review Scales Segmentation Markets Pipeline Southern Innkeepers Hotels Performance 2012
World Class Airport For A World Class City
 World Class Airport For A World Class City Air Service Update April 2018 2018 Air Service Updates February 2018 Seattle new departure, seasonal, 2x weekly Boston new departure, seasonal, 2x weekly March
CAREER HIGHLIGHTS. TV Host. National & Local Media Star. NY Times Bestseller. Weight Loss Expert. & much more
 OVERVIEW Media Personality, Healthy Comfort Food Chef, Weight Loss Expert, and New York Times Bestselling Author Devin Alexander is Chef on NBC s The Biggest Loser and the author of 8 cookbooks including
MARKETBEAT U.S. Industrial
 MARKETBEAT U.S. Industrial Q4 2018 U.S. INDUSTRIAL Employment Indicators Market Indicators Net Absorption/Rent NNN 4-QTR TRAILING AVERAGE Overall Vacancy Q4 17 Q4 18 Total Nonfarm Employment 147.4M 149.9M
2016 Air Service Updates
 Air Service Update June 2016 2016 Air Service Updates February 2016 Pittsburgh new destination, 2x weekly April 2016 Los Angeles new departure, 1x daily Atlanta new departure, 1x daily Jacksonville new
A&I Distributors 900 1st Avenue North Billings, MT
 A&I Distributors 900 1st Avenue North Billings, MT 59101 800-829-7877 16316 SW 72 nd Avenue Portland, OR 97224 503-905-2245 Eastern WA, OR, ID, MT, ND, Western SD, Northern WY, Western NE Allied Oil &
Beta Radiation in the United States Following the Fukushima Disaster. by Bobby1
 Beta Radiation in the United States Following the Fukushima Disaster by Bobby1 This is a statistical study of beta radiation in the United States following the Fukushima nuclear disaster. Its purpose is
Impact of Hurricane Irma on US Metropolitan Areas
 Impact of Hurricane Irma on US Metropolitan Areas Puerto Ricans in mainland Prepared for: Jorge Restrepo, CEO 2017 EurekaFacts LLC September 29, 2017 Climate refugees from Puerto Rico in US metropolitan
Monthly Employment Watch: Milwaukee and the Nation's Largest Cities
 Monthly Employment Watch: Milwaukee and the Nation's Largest Cities A monthly report on employment trends in the nation s largest cities Prepared by: The University of Wisconsin-Milwaukee Center for Economic
Monthly Employment Watch: Milwaukee and the Nation's Largest Cities
 Monthly Employment Watch: Milwaukee and the Nation's Largest Cities A monthly report on employment trends in the nation s largest cities Prepared by: The University of Wisconsin-Milwaukee Center for Economic
Who Sprawls the Most?
 SPRAWL AMERICAN STYLE Who Sprawls the Most? Jackie Cutsinger Research Assistant, Center for Urban Studies Wayne State University Measuring Sprawl in Major Metros Regionally stratified, nationally representative
The 182 Arts & Economic Prosperity IV Study Regions
 Group Arts ECONOMIC IMPACT OF SPENDING NATIONAL ESTIMATES OF ECONOMIC IMPACT $61.1 Billion $74.1 Billion $135.2 Billion 4.1 Million $86.7 Billion $6.7 Billion $9.6 Billion AK City and Borough of Juneau