333 W. Campbell Road, Suite 440 Richardson, Texas Cruising for Charity with Randy Limbacher in Tahiti July 28, 2007
|
|
|
- Jesse Powell
- 5 years ago
- Views:
Transcription


1 333 W. Campbell Road, Suite 440 Richardson, Texas Cruising for Charity with Randy Limbacher in Tahiti July 28, 2007 Join me for this special annual event to raise money for your favorite charity. Regent Seven Seas Cruises and Canyon Creek Travel will contribute up to $1000 per cabin to the charity of your choice in addition to the exclusive discounted cruise fares. This is a perfect opportunity to enjoy a trip of a lifetime and allow your favorite charity to benefit!


2 DATE DAY PORT ARRIVE DEPART Jul 28 Saturday Papeete, Tahiti 22:00 Jul 29 Sunday Raiatea 11:00 18:00 Jul 30 Monday Taha'a Motu Mahana 09:00 17:00 Jul 31 Tuesday Bora Bora 09:00 Aug 1 Wednesday Bora Bora 18:00 Aug 2 Thursday Moorea 09:00 Aug 3 Friday Moorea 17:00 Aug 3 Friday Papeete, Tahiti 19:30 Aug 4 Saturday Papeete, Tahiti Exclusive Cruise Only Fares Owners Suite $9,970 per person Stateroom 457 sq ft/veranda 77 sq ft Bathroom includes separate shower and dressing area. Owner s Suite includes butler service. Grand Suite $7,405 per person Stateroom 332 sq ft/veranda 197 sq ft Grand Suites include butler service.


3 Deluxe Ocean View Suite $5,885 per person Stateroom 300 sq ft/veranda 58sq ft Category A Suites include butler service. Veranda Stateroom $4,650 per person Stateroom 256 sq ft/veranda 47sq ft Category B Suites include butler service. Balcony Stateroom $3,510 per person Stateroom 202sq ft/balcony 37 sq ft Category C Window Stateroom $2,750 D, $2,465 E, $2,275 F per person Stateroom 200 sq ft with picture window or portholes Category D, E, F Port and security charges are $210 per person


4 What s included All shipboard meals- daily breakfast, lunch, and dinner, late night snacks and 24 hour room service All shipboard amenities, activities and entertainment All shipboard gratuities Complimentary, all inclusive select fine wines and spirits Complimentary alcoholic and non alcoholic beverages Comprehensive guest lecturer programs Private cocktail reception onboard The Paul Gauguin was designed specifically for sailing French Polynesia year-round. She offers an extension of the informal, relaxing environment of the islands, with Regent Seven Seas Cruises' interpretation of sixstar service, comfort and luxury. Spacious staterooms (50% with private balconies), a watersports marina, a choice of three single seating dining venues and an extensive spa are among her six-star attributes. The atmosphere aboard radiates warmth and informality. And her beloved troupe of Gauguines - part cruise staff, part entertainers, part storytellers, add the unique personality of French Polynesia to every cruise.


5 The delightfully informal, unhurried and unregimented way of life of the Polynesian experience is emulated on board with a visit to the spa operated by legendary Carita of Paris. Paul Gauguin's restaurants are designed to complement and enhance the dining experience, not overwhelm it. Fresh fruit and flowers grace the beautiful ocean-view staterooms and suites, 50% with private balconies
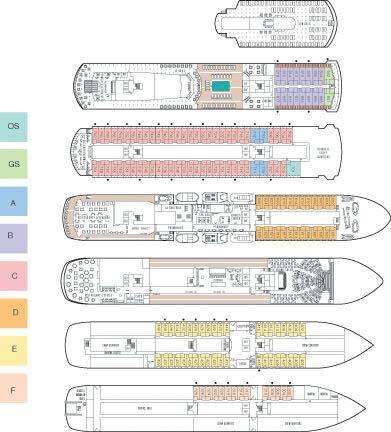
6 Deck Plan
7 Low cost air add-ons for roundtrip Economy Class, Business Class, and First Class travel are available from 86 gateways. North East ALBANY, NY $5,400 $3,900 $1,699 BALTIMORE, MD $5,400 $3,900 $1,699 BOSTON, MA $5,400 $3,900 $1,699 BUFFALO, NY $5,400 $3,900 $1,699 HARTFORD, CT $5,400 $3,900 $1,699 MONTREAL, QC $5,600 $4,100 $1,899 NEW YORK CITY, NY $5,400 $3,900 $1,699 NEW YORK CITY, NY $5,400 $3,900 $1,699 NEWARK, NJ $5,400 $3,900 $1,699 NORFOLK, VA $5,400 $3,900 $1,699 OTTAWA, ON $5,600 $4,100 $1,899 PHILADELPHIA, PA $5,400 $3,900 $1,699 PITTSBURGH, PA $5,400 $3,900 $1,699 PORTLAND, ME $5,400 $3,900 $1,699 PROVIDENCE, RI $5,400 $3,900 $1,699 RICHMOND, VA $5,400 $3,900 $1,699 ROCHESTER, NY $5,400 $3,900 $1,699 SYRACUSE, NY $5,400 $3,900 $1,699 TORONTO, ON $5,600 $4,100 $1,899 WASHINGTON D.C., DC $5,400 $3,900 $1,699 WASHINGTON D.C., DC $5,400 $3,900 $1,699 South East ATLANTA, GA $5,400 $3,900 $1,699 CHARLESTON, SC $5,400 $3,900 $1,699 CHARLOTTE, NC $5,400 $3,900 $1,699 FT. LAUDERDALE, FL $5,400 $3,900 $1,699 FT. MYERS, FL $5,400 $3,900 $1,699 GREENSBORO, NC $5,400 $3,900 $1,699 JACKSONVILLE, FL $5,400 $3,900 $1,699 MIAMI, FL $5,400 $3,900 $1,699 ORLANDO, FL $5,400 $3,900 $1,699 RALEIGH/DURHAM, NC $5,400 $3,900 $1,699 SAN JUAN $5,400 $3,900 $1,699 SAVANNAH, GA $5,400 $3,900 $1,699 TAMPA, FL $5,400 $3,900 $1,699 WEST PALM BEACH, FL $5,400 $3,900 $1,699 North Central CEDAR RAPIDS, IA $5,300 $3,800 $1,599 CHICAGO, IL $5,300 $3,800 $1,599 CINCINNATI, OH $5,300 $3,800 $1,599 CLEVELAND, OH $5,300 $3,800 $1,599 COLUMBUS, OH $5,300 $3,800 $1,599 DES MOINES, IA $5,300 $3,800 $1,599 DETROIT, MI $5,300 $3,800 $1,599 GRAND RAPIDS, MI $5,300 $3,800 $1,599 INDIANAPOLIS, IN $5,300 $3,800 $1,599 LOUISVILLE, KY $5,300 $3,800 $1,599 MILWAUKEE, WI $5,300 $3,800 $1,599 MINNEAPOLIS, MN $5,300 $3,800 $1,599 OMAHA, NE $5,300 $3,800 $1,599
8 ST. LOUIS, MO $5,300 $3,800 $1,599 South Central AUSTIN, TX $5,300 $3,800 $1,599 BIRMINGHAM, AL $5,300 $3,800 $1,599 DALLAS/FT. WORTH, TX $5,300 $3,800 $1,599 EL PASO, TX $5,300 $3,800 $1,599 HOUSTON, TX $5,300 $3,800 $1,599 JACKSON, MS $5,300 $3,800 $1,599 KANSAS CITY, MO $5,300 $3,800 $1,599 KNOXVILLE, TN $5,300 $3,800 $1,599 LITTLE ROCK, AR $5,300 $3,800 $1,599 MEMPHIS, TN $5,300 $3,800 $1,599 NASHVILLE, TN $5,300 $3,800 $1,599 NEW ORLEANS, LA $5,300 $3,800 $1,599 OKLAHOMA CITY, OK $5,300 $3,800 $1,599 SAN ANTONIO, TX $5,300 $3,800 $1,599 SHREVEPORT, LA $5,300 $3,800 $1,599 TULSA, OK $5,300 $3,800 $1,599 WICHITA, KS $5,300 $3,800 $1,599 North West BOISE, ID $5,200 $3,700 $1,499 CALGARY, AB $5,200 $3,700 $1,499 EDMONTON, AB $5,200 $3,700 $1,499 FARGO, ND $5,200 $3,700 $1,499 GREAT FALLS, MT $5,200 $3,700 $1,499 HONOLULU, HI $5,200 $3,700 $1,499 PORTLAND, OR $5,200 $3,700 $1,499 SEATTLE, WA $5,200 $3,700 $1,499 VANCOUVER, BC $5,200 $3,700 $1,499 South West ALBUQUERQUE, NM $5,050 $3,550 $1,349 DENVER, CO $5,050 $3,550 $1,349 LAS VEGAS, NV $5,050 $3,550 $1,349 LOS ANGELES, CA $4,800 $3,300 $1,099 PALM SPRINGS, CA $5,050 $3,550 $1,349 PHOENIX, AZ $5,050 $3,550 $1,349 RENO, NV $5,050 $3,550 $1,349 SACRAMENTO, CA $5,050 $3,550 $1,349 SALT LAKE CITY, UT $5,050 $3,550 $1,349 SAN DIEGO, CA $5,050 $3,550 $1,349 SAN FRANCISCO, CA $5,050 $3,550 $1,349 SANTA BARBARA $5,050 $3,550 $1,349 TUCSON, AZ $5,050 $3,550 $1,349 Contact Randy Limbacher
Lower Income Journey to Work Market Share From American Community Survey
 Lower Income Journey to Work Market Share From American Community Survey 2006-2010 Table 1: Overall National Data Table 2: Car, Truck or Van Table 3: Transit Table 4: Metrics Table 1 Work Trip Market Share:
Norwegian's Free Airfare Promotion
 Norwegian's Free Airfare Promotion Start planning your next vacation with 200+ cruises to incredible destinations, including Alaska, Bahamas & Florida, Bermuda, Canada & New England, Caribbean, Mexican
Location, Location, Location. 19 th Annual NIC Conference NIC MAP Data & Analysis Service
 Location, Location, Location 19 th Annual NIC Conference NIC MAP Data & Analysis Service The Great Occupancy Decline 94% Occupancy Trends Majority Nursing Seniors Housing 93% 92% 91% 92.8% 91.0% 90% 89%
Hector International Airport Fargo, North Dakota
 Hector International Airport Fargo, North Dakota Volume 073 Twelve Months Ended September 2007 January 2008 Airlines Serving Fargo Carried 831 Onboard Passengers Per Day for the Twelve Months Ended September
Hector International Airport Fargo, North Dakota
 Hector International Airport Fargo, North Dakota Volume 072 Twelve Months Ended June 2007 November 2007 Airlines Serving Fargo Carried 830 Onboard Passengers Per Day for the Twelve Months Ended June 2007,
Hector International Airport Fargo, North Dakota
 Hector International Airport Fargo, North Dakota Volume 081 Twelve Months Ended March 2008 July 2008 Airlines Serving Fargo Carried 838 Onboard Passengers Per Day for the Twelve Months Ended March 2008,
Rank Place State Native Hawaiian and Pacific Islander population (alone or in combination
 TABLE 2a: 100 Largest Places Ranked by Number of s (race alone or in *) Living in Hard-to- Census Rank Place State (alone or in 1 Honolulu (CDP) HI 64,196 11,130 17.3 2 New York City NY 14,981 8,211 54.8
FBI Drug Demand Reduction Coordinators
 FBI Drug Demand Reduction Coordinators Alabama 2121 Building, Room 1400 Birmingham, AL 35203 (205) 252 7705 One St. Louis Centre One St. Louis Street Mobile, AL 36602 (334) 438 3674 Alaska 222 West Seventh
District Match Data Availability
 District Match Data Availability National & State Data Location Available National Data Australia Parliament, Provincial and Territory Assemblies Canada Parliament, Provincial Legislative Assemblies New
Population Estimates for U.S. Cities Report 1: Fastest Growing Cities Based on Numeric Increase,
 ulation s for U.S. Cities Report 1: Fastest Growing Cities Based on Numeric Increase, 2015-2015 1 Phoenix AZ 32,113 2.0 1,582,904 1,615,017 167,393 11.6 2 Los Angeles CA 27,173 0.7 3,949,149 3,976,322
Major Metropolitan Area Sales Tax Rates
 August 19, 2010 No. 239 FISCAL FACT Major Metropolitan Area Sales Tax Rates By Lawrence Summers Introduction General sales taxes levied by state, county and city governments in the United States vary greatly,
 Snakes & Lattes is currently composed of three corporate owned and operated board game cafes in Toronto, ON. Over the last 7 years these have become renowned as Toronto's premiere board game cafe destinations.
Higher Education in America s Metropolitan Areas A Statistical Profile
 Higher Education in America s Metropolitan Areas A Statistical Profile MSA Study No.2 Higher Education in America s Metropolitan Areas A Statistical Profile CONTENTS Why Metro Areas? 1 Executive Summary
Non-stop Scheduled Passenger Service at Fargo as of October Top 20 Domestic O&D Passenger Markets at Fargo Twelve Months Ended June 2006
 0 5000 10000 15000 20000 25000 30000 35000 40000 45000 50000 Airport Traffic Quarterly Non-stop Scheduled Passenger Service at Fargo as of October 2006 Top 20 Domestic O&D Passenger Markets at Fargo Twelve
MANGO MARKET DEVELOPMENT INDEX REPORT
 MANGO MARKET DEVELOPMENT INDEX REPORT 2015-2016 UNDERSTANDING THE MARKET INDEX The Mango Market Development Index is designed to measure and compare mango sales volume relative to population by region
Access Across America: Transit 2014
 Access Across America: Transit 2014 Final Report CTS 14-11 Prepared by: Andrew Owen David Levinson Accessibility Observatory Department of Civil, Environmental, and Geo- Engineering University of Minnesota
Per capita carbon emissions from transportation and residential energy use, 2005
 Per capita carbon emissions from transportation and residential energy use, 2005 Metropolitan Area Carbon Footprint Honolulu, HI 1 1.356 Los Angeles-Long Beach-Santa Ana, CA 2 1.413 Portland-Vancouver-Beaverton,
INDIANA INTERSTATE AND INTRASTATE LOCAL REDUCED CITY-PAIR FARES
 The following section contains city-pair fares that are lower than walkup mileage-based fares. Although shown in only one direction, the fares in this section apply in both directions, unless otherwise
STATE OF UTAH "BEST VALUE" COOPERATIVE CONTRACT CONTRACT NUMBER: AR2270 November 14, 2016
 Item: Contracted Airline Fares Purchasing Agent: Chad Hinds Phone #: (801) 538-1287 Email: chinds@utah.gov Vendor: 112932A Internet Homepage: Delta Air Lines, Inc. 1030 Delta Blvd. Atlanta, GA 30354 www.statetravel.utah.gov
Census Affects Children in Poverty by Professors Donald Hernandez and Nancy Denton State University of New York, Albany
 Phone: (301) 457-9900 4700 Silver Hill Road, Suite 1250-3, Suitland, MD 20746 Fax: (301) 457-9901 Census Affects in Poverty by Professors Donald Hernandez and Nancy Denton State University of New York,
ILLINOIS INTERSTATE AND INTRASTATE LOCAL REDUCED CITY-PAIR FARES
 The following section contains city-pair fares that are lower than walkup mileage-based fares. Although shown in only one direction, the fares in this section apply in both directions, unless otherwise
Metropolitan Votes and the 2012 U.S. Election: Population, GDP, Patents and Creative Class
 politan Votes and the 2012 U.S. Election: Population, GDP, Patents and Creative Class Author: Shawn Gilligan, Shawn.Gilligan@rotman.utoronto.ca Zara Matheson, Zara.Matheson@rotman.utoronto.ca Kevin Stolarick,
MARKETBEAT U.S. Office
 MARKETBEAT U.S. Office Q4 2018 U.S. OFFICE Employment Indicators Market Indicators (Overall) Office: Net Absorption/Asking Rent 4Q TRAILING AVERAGE Office: Overall Vacancy Q4 17 Q4 18 Total Nonfarm Employment
Mango Market Development Index
 Mango Market Development Index 2016-2017 Understanding the Market Index The Mango Market Development Index is designed to measure and compare mango volume sold at retail relative to population by region
MARKETBEAT U.S. Office
 MARKETBEAT U.S. Office Q3 2018 U.S. OFFICE Employment Indicators Market Indicators (Overall) Office: Net Absorption/Asking Rent 4Q TRAILING AVERAGE Office: Overall Vacancy Q3 17 Q3 18 Total Nonfarm Employment
Charleston, WV 18 Juneau, AK Peoria, IL Jefferson City,
 2004 Ranking Diocese Catholics Diocesan Seminarians 2004 Ratio (Catholics / Seminarians) 2003 Ranking 1 Lincoln, NE 89431 35 2555 2 2 Yakima, WA 68561 20 3428 5 3 Savannah, GA 75987 22 3454 13 4 Cheyenne,
CONNECTICUT INTERSTATE AND INTRASTATE LOCAL REDUCED CITY-PAIR FARES
 PASSENGER TARIFF AND SALES MANUAL CONNECTICUT INTERSTATE AND INTRASTATE LOCAL REDUCED CITY-PAIR S The following section contains city-pair fares that are lower than walkup mileage-based fares. Although
Monthly Employment Watch: Milwaukee and the Nation's Largest Cities
 Monthly Employment Watch: Milwaukee and the Nation's Largest Cities A monthly report on employment trends in the nation s largest cities Prepared by: The University of Wisconsin-Milwaukee Center for Economic
MARKETBEAT U.S. Office
 MARKETBEAT U.S. Office Q2 2017 U.S. OFFICE Employment Indicators Q2 16 Q2 17 Total Nonfarm Employment 143.9M 146.2M Office-using Employment 30.1M 31.8M Unemployment 4.9% 4.4% Source: BLS Market Indicators
MARKETBEAT U.S. Office
 MARKETBEAT U.S. Office Q3 2017 U.S. OFFICE Employment Indicators Net Absorption/Rent 4-QTR TRAILING AVERAGE Q3 16 Q3 17 Total Nonfarm Employment 144.7M 146.6M Office-using Employment 31.3M 31.9M Unemployment
TOP 100. Transit Bus Fleets Agency 35 ft. Over Artic and 35 ft. Total +/- under 0 3, ,426 82
 L.A. Metro-No. 3 1 1 MTA New York City Transit New York City 2 2 New Jersey Transit Corp. Newark, N.J. 3 3 Metro Los Angeles 4 5 Toronto Transit Commission Toronto 5 10 Chicago Transit Authority Chicago
TOP 100 Bus Fleets Agency 35 ft. and Over Artic under 35 ft. Total. 18 < metro magazine SEPTEMBER/OCTOBER 2018 metro-magazine.
 1 1 MTA New York City Transit/MTA Bus Co. 0 4,860 951 5,811 New York City 2 3 New Jersey Transit Corp. 418 2,879 85 3,382 Newark, N.J. 3 2 Los Angeles County Metropolitan Transportation Authority 50 1,882
MARKETBEAT U.S. Industrial Snapshot Q4 2015
 MARKETBEAT U.S. Industrial Snapshot Q4 2015 U.S. INDUSTRIAL Employment Indicators Q4 14 Q4 15 Total Nonfarm Employment 140.2M 143.0M Industrial Employment 23.4M 23.6M Unemployment 5.7% 5.0% Market Indicators
Agency 35 ft. Over Artic. Trolley 2012 Total and 35 ft. under. 1 1 MTA New York City Transit 0 3, ,344 New York City
 Capital Metro-No. 40 Courtesy Capital Metro 1 1 MTA New York City Transit 0 3,704 640 0 4,344 New York City 2 3 New Jersey Transit Corp. 47 2,263 85 0 2,395 Newark, N.J. 3 2 Metro 50 1,956 378 0 2,384
MARKETBEAT U.S. Office
 MARKETBEAT U.S. Office Q1 2017 U.S. OFFICE Employment Indicators Q1 16 Q1 17 Total Nonfarm Employment 143.4M 145.7M Offi ce-using Employment 30.9M 31.7M Unemployment 4.9% 4.6% Source: BLS Market Indicators
Greater Orlando Aviation Authority Orlando International Airport Destinations by Airline December 2017
 Aer Lingus Dublin, Ireland 3 3 0 0 Aeromexico Mexico City, Mexico 19 4 19 4 0 Air Canada Halifax, Nova Scotia 2 2 Montreal/Dorval, Quebec 12 1 Ottawa, Ontario 5 3 1 Toronto, Ontario 20 1 Vancouver, British
Social Media In Your New & Improved Phoenix Sky Harbor
 Social Media In Your New & Improved Phoenix Sky Harbor AZ Chapter of HSMAI September 19, 2013 It always begins & ends with: skyharbor.com Began Facebook page in October 2010 More than 27,000 people Like
MARKETBEAT U.S. Office
 MARKETBEAT U.S. Office Q4 2017 U.S. OFFICE Employment Indicators Q4 16 Q4 17 Total Nonfarm Employment 145.2M 147.2M Office-using Employment 31.5M 32.1M Unemployment 4.7% 4.1% Source: BLS Market Indicators
Appendix D: Aggregation Error for New England Metro Areas and for Places
 Appendix D: for New England Metro Areas and for Places D-1 Appendix D: s Figure D-1: New England Metro Areas - Summary of Tract s (2000) Metro ID (msapma99) Metro Area Name Census NCDB 1120 Boston, MA-NH
2015 Region 1 Conference in Manchester, NH Attendance by States/Provinces
 Rgion 1 Confrnc Yar Attndanc 2017 448 2016 490 2015 457 2014 527 2013 308 2017 Rgion 1 Vrona, NY 2016 Rgion 1 Portland, ME 2015 Rgion 1 Manchstr, NH 2014 Rgion 1 Manchstr, NH CT 25 CT 41 CT 50 CT 59 CT
MARKETBEAT U.S. Office
 MARKETBEAT U.S. Office Q4 2016 U.S. OFFICE Employment Indicators Market Indicators (Overall) Q4 15 Q4 16 Vacancy Rate 13.5% 13.2% Net Absorption 20.5M 6.9M Under Construction 94.5M 100.2M Weighted Asking
PUBLIC TRANSPORTATION INTRODUCTION
 PUBLIC TRANSPORTATION INTRODUCTION 1 OUTLINE Current Status and Recent Trends Significant Influences A Critical Assessment Arguments Supporting Public Transport Future Influences Ingredients for Future
Monthly Employment Watch: Milwaukee and the Nation's Largest Cities
 Monthly Employment Watch: Milwaukee and the Nation's Largest Cities A monthly report on employment trends in the nation s largest cities Prepared by: The University of Wisconsin-Milwaukee Center for Economic
2012 Airfares CA Out-of-State City Pairs -
 2012 Airfares Out-of-State City Pairs - Contracted rates are from July 1, 2012 through June 30, 2013. Please note all fares are designated as () and ( ) in airline computer reservation systems. fares are
(See Note 1) Solar Energy Factor (SEF D ) Solar Fraction (SF D ) Estimated Energy Savings SYSTEM DETAILS
 Solar Energy Factor (SEF D ) Solar Fraction (SF D ) Estimated Energy Savings SYSTEM DETAILS") OG-300 ICC-SRCC TM CERTIFIED SOLAR SYSTEM # SYSTEM INFORMATION Pumped Internal Backup: Gas Tank Collector Type: Glazed Flat Plate Solar Tank Volume: 379 liter (100 gal) Collector Heat Transfer Fluid: GRAS
OG-300 ICC-SRCC TM CERTIFIED SOLAR SYSTEM # SYSTEM INFORMATION Pumped Internal Backup: Gas Tank Collector Type: Glazed Flat Plate Solar Tank Volume: 379 liter (100 gal) Collector Heat Transfer Fluid: GRAS
The FMR history file contains the following fields, all for 2-bedroom FMRs. It is in EXCEL format for easy use with database or spreadsheet programs.
 The FMR history file contains the following fields, all for 2-bedroom FMRs. It is in EXCEL format for easy use with database or spreadsheet programs. GENERAL NOTES 1. There are no Fiscal Year 1984 FMRs
United States Office 2Q 2016
 MARKETBEAT United States Office 2Q 2016 U.S. OFFICE Employment Indicators Market Indicators Net Absorption/Rent 4Q TRAILING AVERAGE Overall Vacancy 2Q 15 2Q 16 Total Nonfarm Employment 141.5M 143.9M Offi
MARKETBEAT U.S. Industrial
 MARKETBEAT U.S. Industrial Q2 2018 U.S. INDUSTRIAL Employment Indicators Q2 17 Q2 18 Total Nonfarm Employment 146.3M 148.7M Industrial Employment 31.6M 32.5M Unemployment 4.3% 3.9% Source: BLS Market Indicators
MARKETBEAT U.S. Industrial
 MARKETBEAT U.S. Industrial Q3 2018 U.S. INDUSTRIAL Employment Indicators Q3 17 Q3 18 Total Nonfarm Employment 146.9M 149.3M Industrial Employment 31.5M 32.3M Unemployment 4.4% 3.9% Source: BLS Market Indicators
NORTH AMERICA CBD PARKING RATE SURVEY HIGHLIGHTS
 COLLIERS INTERNATIONAL l 2007 NORTH AMERICA CBD PARKING RATE SURVEY HIGHLIGHTS Parking Rates Creep Still Higher Colliers 7th annual North America Parking Rate Survey indicates the cost to park continues
U.S. Office Snapshot Q1 2016
 MARKETBEAT U.S. Office Snapshot Q1 2016 U.S. OFFICE Employment Indicators Q1 15 Q1 16 Total Nonfarm Employment 140.8M 143.5M Offi ce-using Employment 30.2M 31.0M Unemployment 5.6% 4.9% Source: BLS Market
2016 Air Service Updates
 Air Service Update May 2016 2016 Air Service Updates February 2016 Pittsburgh new destination, 2x weekly April 2016 Los Angeles new departure, 1x daily Atlanta new departure, 1x daily Jacksonville new
The 156 Arts & Economic Prosperity III Study Regions
 Full-Time Resident Local NATIONAL ESTIMATES OF ECONOMIC IMPACT $63,053,399,000 $103,145,088,000 $166,198,487,000 5,695,361 $104,234,116,000 $7,936,383,000 $9,140,633,000 AK City of Homer A 5,364 $1,248,208
Item 185 Storage-In-Transit First Ea. Add'l. Service
 Service Day Day 4 Birmingham, AL 19.62 0.68 2 8 Dothan, AL 15.08 0.48 2 12 Huntsville, AL 15.55 0.50 2 16 Mobile, AL 16.23 0.68 3 20 Montgomery, AL 16.23 0.68 3 22 State of Alaska 14.76 0.55 4 24 Flagstaff,
Service Service Area Name
 Atlas Van Lines, Inc. Origin and Destination s Effective: 05/15/2018 Area Name 4 Birmingham, AL 6.99 8 Dothan, AL 4.80 12 Huntsville, AL 7.37 16 Mobile, AL 4.80 20 Montgomery, AL 7.37 22 State of Alaska
MARKETBEAT U.S. Industrial
 MARKETBEAT U.S. Industrial Q2 2017 U.S. INDUSTRIAL Employment Indicators Q2 16 Q2 17 Total Nonfarm Employment 143.9M 146.2M Industrial Employment 25.2M 25.6M Unemployment 4.9% 4.4% Source: BLS Market Indicators
2016 Air Service Updates
 Air Service Update September 2016 2016 Air Service Updates February 2016 Pittsburgh new destination, 2x weekly April 2016 Los Angeles new departure, 1x daily Atlanta new departure, 1x daily Jacksonville
International Convention Badges
 Images may not be the actual size. (Reduced the image sizes to save white space in the catalog) Images provided by Lion Verle Malik Created 07/24/2015. 1923 1924 1925 7th Annual Convention June 26-29,
ALN Apartment Data, Inc. (Continued on next page)
") AK - Anchorage 93.0% 90.9% -210-2.2% $1,035 $1,018-1.7% 93.0% 90.9% -210-2.2% $1,035 $1,018-1.7% AK - Misc. AK 90.3% 86.8% -350-3.8% $1,218 $1,245 2.3% 90.3% 86.8% -350-3.8% $1,218 $1,245 2.3% Alaska Average
AK - Anchorage 93.0% 90.9% -210-2.2% $1,035 $1,018-1.7% 93.0% 90.9% -210-2.2% $1,035 $1,018-1.7% AK - Misc. AK 90.3% 86.8% -350-3.8% $1,218 $1,245 2.3% 90.3% 86.8% -350-3.8% $1,218 $1,245 2.3% Alaska Average
Office Markets Beginning to Show Signs of Bottoming Out
 OFFiCE north america HIGHLIGHTS Office Markets Beginning to Show Signs of Bottoming Out MarKet indicators Relative to prior period VaCanCY net absorption ConstrUCtion Q2 Q3 * ross J. Moore Chief Economist
OB-GYN Workload & Potential Shortages: The Coming U.S. Women s Health Crisis
 OB-GYN Workload & Potential Shortages: The Coming U.S. Women s Health Crisis JULY 2017 Introduction Obstetricians and Gynecologists (OB-GYNs) are a critical part of the health care provider community.
Appendix A TRIP Urban Roads Report 2018
 Appendix A TRIP Urban Roads Report 2018 Pavement Conditions and Extra Vehicle Operating Costs for Urban Areas with Population of 500K or More Akron OH 49% 12% 14% 25% $837 Albany Schenectady Troy NY 15%
Park-Related Total* Expenditure per Resident, by City
 Park-Related Total* per Resident, by City FY 2008 City Population Total Park per Resident Washington, D.C. 591,833 $153,324,830 $259 Seattle 598,541 $150,672,543 $252 Scottsdale 235,371 $50,429,049 $214
World Class Airport For A World Class City
 World Class Airport For A World Class City Air Service Update October 2017 2017 Air Service Updates February 2017 Cleveland new destination, 2x weekly Raleigh-Durham new destination, 2x weekly March 2017
World Class Airport For A World Class City
 World Class Airport For A World Class City Air Service Update December 2018 2018 Air Service Updates February 2018 Delta Air Lines Seattle new departure, seasonal, 2x weekly Delta Air Lines Boston new
World Class Airport For A World Class City
 World Class Airport For A World Class City Air Service Update April 2018 2018 Air Service Updates February 2018 Seattle new departure, seasonal, 2x weekly Boston new departure, seasonal, 2x weekly March
MARKETBEAT U.S. Industrial
 MARKETBEAT U.S. Industrial Q4 2018 U.S. INDUSTRIAL Employment Indicators Market Indicators Net Absorption/Rent NNN 4-QTR TRAILING AVERAGE Overall Vacancy Q4 17 Q4 18 Total Nonfarm Employment 147.4M 149.9M
UNITED STATES OF AMERICA NORTH AMERICA TOP 10 DAILY PARKING RATES Parking Rates Median (US$) Chicago, IL.
 Chicago, IL.") C O L L I E R S I N T E R N A T I O N A L N O R T H A M E R I C A Parking Rates C B D P A R K I N G R A T E S U R V E Y 2 0 0 9 GLOBAL COMPARISON TOP 25 MONTHLY UNRESERVED PARKING RATES MEDIAN (US$) London
C O L L I E R S I N T E R N A T I O N A L N O R T H A M E R I C A Parking Rates C B D P A R K I N G R A T E S U R V E Y 2 0 0 9 GLOBAL COMPARISON TOP 25 MONTHLY UNRESERVED PARKING RATES MEDIAN (US$) London
Oct-17 Oct-18 bps %CHG Oct-17 Oct-18 %CHG Oct-17 Oct-18 bps %CHG Oct-17 Oct-18 %CHG
 AK - Anchorage 92.6% 89.9% -270-2.9% $1,023 $1,011-1.2% 92.6% 89.9% -270-2.9% $1,023 $1,011-1.2% AK - Misc. AK 89.9% 85.8% -410-4.6% $1,227 $1,230 0.2% 89.9% 85.8% -410-4.6% $1,227 $1,230 0.2% Alaska Average
World Class Airport For A World Class City
 World Class Airport For A World Class City Air Service Update April 2017 2017 Air Service Updates February 2017 Cleveland new destination, 2x weekly Raleigh-Durham new destination, 2x weekly March 2017
MTL MOUNT LAUREL NJ 5,841 5, , ,890 5,804 2,069 NEW NEWARK NJ 32,490 29,227 3,168 12, ,675 32,558 12,583 NOL
 2010 ABQ ALBUQUERQUE NM 1,657 1,560 75 604 23 21 1 2 1,680 1,657 606 AGA AGANA GUAM 672 650 55 304 91 44 16 34 763 765 338 ALB ALBANY NY 2,018 1,809 123 774 16 4-8 2,034 1,936 782 ANC ANCHORAGE AK 956
Initial Locations of 2020 Area Census Offices
 1 of 6 Anchorage* AK At Large Birmingham* AL 007 Huntsville AL 005 Mobile AL 001 Fayetteville AR 003 Little Rock AR 002 Flagstaff AZ 001 Window Rock AZ 001 Maricopa (Central)* AZ 006 Maricopa (South) AZ
MARKETBEAT U.S. Industrial
 MARKETBEAT U.S. Industrial Q4 2017 U.S. INDUSTRIAL Employment Indicators Q4 16 Q4 17 Total Nonfarm Employment 145.2M 147.2M Industrial Employment 25.4M 25.9M Unemployment 4.7% 4.1% Source: BLS Market Indicators
University of Denver
 Glenn R. Mueller, Ph.D. Professor University of Denver Franklin L. Burns School of Real Estate & Construction Management & Real Estate Investment Strategist glenn.mueller@du.edu Supply The new supply of
2016 Air Service Updates
 Air Service Update June 2016 2016 Air Service Updates February 2016 Pittsburgh new destination, 2x weekly April 2016 Los Angeles new departure, 1x daily Atlanta new departure, 1x daily Jacksonville new
U.S. Metropolitan Area Exports, 2015
 U.S. Metropolitan Area Exports, 2015 Jeffrey Hall Office of Trade and Economic Analysis Industry and Analysis Department of Commerce International Trade Administration September 2016 U.S. Metro Exports:
Beta Radiation in the United States Following the Fukushima Disaster. by Bobby1
 Beta Radiation in the United States Following the Fukushima Disaster by Bobby1 This is a statistical study of beta radiation in the United States following the Fukushima nuclear disaster. Its purpose is
Florida's Scheduled Commercial Service Airports
 Florida's Scheduled Commercial Service Airports Volume 154 May 2016 - Domestic Airlines Serving Florida Carried 170,726 Onboard Passengers Per Day for, up 7.7% over the previous 12 months. Highlights in
MARKETBEAT U.S. Industrial
 MARKETBEAT U.S. Industrial Q3 2016 U.S. INDUSTRIAL Employment Indicators Market Indicators Net Absorption/Rent NNN 4-QTR TRAILING AVERAGE Overall Vacancy Q3 15 Q3 16 Total Nonfarm Employment 142.2M 144.6M
Southern Innkeepers 104 th Annual Meeting Lodging Overview. Jan D. Freitag Senior Vice President
 Southern Innkeepers 104 th Annual Meeting Lodging Overview Jan D. Freitag Senior Vice President 1 Agenda Total US Review Scales Segmentation Markets Pipeline Southern Innkeepers Hotels Performance 2012
Passengers Boarded At The Top 50 U. S. Airports ( Updated April 2
 (Ranked By Passenger Enplanements in 2006) Airport Table 1-41: Passengers Boarded at the Top 50 U.S. Airportsa Atlanta, GA (Hartsfield-Jackson Atlanta International) Chicago, IL (Chicago O'Hare International)
United States Industrial 2Q 2016
 MARKETBEAT United States Industrial 2Q 2016 U.S. INDUSTRIAL Employment Indicators 2Q 15 2Q 16 Total Nonfarm Employment 141.5M 143.9M Industrial Employment 24.8M 25.2M Unemployment 5.4% 4.9% Source: BLS
MARKETBEAT U.S. Industrial
 MARKETBEAT U.S. Industrial Q1 2017 U.S. INDUSTRIAL Employment Indicators Q1 16 Q1 17 Total Nonfarm Employment 143.4M 145.7M Industrial Employment 25.3M 25.6M Unemployment 4.9% 4.6% 12-Month Forecast Economy
Monthly Employment Watch: Milwaukee and the Nation's Largest Cities
 Monthly Employment Watch: Milwaukee and the Nation's Largest Cities A monthly report on employment trends in the nation s largest cities Prepared by: The University of Wisconsin-Milwaukee Center for Economic
SAMPLE SAMPLE. Metro Housing Starts Forecast Chartbook October
 2.5 Metro Housing Starts Forecast Chartbook 2016-2018 October 2016 2.0 1.5 0.5 1990 1994 1998 2002 2006 2010 2014 2018 www.housingeconomics.com Table of Contents (Metro Housing Starts Forecasts and Economic
A CORPORATE OR MEDICAL USER OPPORTUNITY WELL-LOCATED OFF THE PA TURNPIKE AM Drive. Quakertown, PA INVESTMENT SUMMARY. Page 1
 A CORPORATE OR MEDICAL USER OPPORTUNITY WELL-LOCATED OFF THE PA TURNPIKE 1900 AM Drive Quakertown, PA INVESTMENT SUMMARY Page 1 EXECUTIVE SUMMARY On behalf of ownership, Avison Young is pleased to offer
ECON 166 Lecture 2. J. M. Pogodzinski
 ECON 166 Lecture 2 J. M. Pogodzinski Broad Themes in the Course Measurement Theory Policy 8/27/2014 J. M. Pogodzinski 2 Measurement What is urban? What is the record of urban growth? What is distinct about
BLACK KNIGHT HPI REPORT
 CONTENTS 1 OVERVIEW 2 NATIONAL OVERVIEW 3 LARGEST STATES AND METROS 4 FEBRUARY S BIGGEST MOVERS 5 20 LARGEST STATES 6 40 LARGEST METROS 7 ADDITIONAL INFORMATION OVERVIEW Each month, the Data & Analytics
1Q 2014 Greater Atlanta HBA Builder Developer Lender Council meeting Information presented by. Atlanta Job Growth
 1Q 2014 Greater Atlanta HBA Builder Developer Lender Council meeting 5-21-2014 Information presented by Eugene James, Regional Director ejames@metrostudy.com 404-510-1080 connect on LinkedIn Atlanta Job
Impact of Hurricane Irma on US Metropolitan Areas
 Impact of Hurricane Irma on US Metropolitan Areas Puerto Ricans in mainland Prepared for: Jorge Restrepo, CEO 2017 EurekaFacts LLC September 29, 2017 Climate refugees from Puerto Rico in US metropolitan
2016 Air Service Updates
 2016 Air Service Updates February 2016 Pittsburgh new destination, 2x weekly April 2016 Los Angeles new departure, 1x daily Atlanta new departure, 1x daily Jacksonville new destination, 2x weekly Philadelphia
2016 Training Schedule
 2016 Training Schedule NCCCO Certifications NCCCO Mobile Crane Operator (CCOP-MC) The Preparatory Program will prepare experienced operators for their NCCCO Written & Practical exams on Lattice Boom and/or
RANKING OF THE 100 MOST POPULOUS U.S. CITIES 12/7/ /31/2016
 OVERVIEW OF THE DATA The following information is based on incoming communication to the National Human Trafficking Hotline via phone, email, and online tip report from December 7, 2007 December 31, 2016
Monthly Employment Watch: Milwaukee and the Nation's Largest Cities
 Monthly Employment Watch: Milwaukee and the Nation's Largest Cities A monthly report on employment trends in the nation s largest cities Prepared by: The University of Wisconsin-Milwaukee Center for Economic
Monthly Employment Watch: Milwaukee and the Nation's Largest Cities
 Monthly Employment Watch: Milwaukee and the Nation's Largest Cities A monthly report on employment trends in the nation s largest cities Prepared by: The University of Wisconsin-Milwaukee Center for Economic
Greater Orlando Aviation Authority Orlando International Airport Airlines by Destination April 2017
 s by Destination Aguadilla, PR JetBlue 7 Akron/Canton, OH Southwest 1 4 Spirit 7 7 Albany, NY JetBlue 7 Southwest 20 1 1 Albuquerque, NM Southwest 1 1 Aruba, Netherlands Antilles Southwest 7 Atlanta, GA
Greater Orlando Aviation Authority Orlando International Airport Airlines by Destination December 2017
 s by Destination Aguadilla, PR JetBlue 7 2 Akron/Canton, OH Southwest 1 Spirit 6 1 Albany, NY JetBlue 7 Southwest 14 1 Aruba, Netherlands Antilles Southwest 7 Atlanta, GA Delta 112 1 3 Frontier s 7 Southwest
NICHOLAS BROWN Vice President, Development (516)
") CONSTRUCTION CONTACTS SOUTHERN NORTHERN D-ATLANTIC LEE JOHNSON (704) 362-6149 lbjohnson@kimcorealty.com NICHOLAS BROWN (516) 869-7266 nbrown@kimcorealty.com PAT CHRISTIE (516) 869-7130 pchristie@kimcorealty.com
CONSTRUCTION CONTACTS SOUTHERN NORTHERN D-ATLANTIC LEE JOHNSON (704) 362-6149 lbjohnson@kimcorealty.com NICHOLAS BROWN (516) 869-7266 nbrown@kimcorealty.com PAT CHRISTIE (516) 869-7130 pchristie@kimcorealty.com
PAMA Energy Study II Webinar
 PAMA Energy Study II Webinar 1 The Professional Awning Manufacturers Association (PAMA) is the trade association committed to supporting the awning industry in the United States. Membership is open to
Greater Orlando Aviation Authority - Orlando International Airport Destinations by Airline November 2018
 Aer Lingus Dublin, Ireland 4 -- 1 4 0 1 Aeromexico Mexico City, Mexico 14 -- -1 14 0-1 Air Canada Halifax, Nova Scotia 1 1 1 Montreal/Dorval, Quebec 12-2 -- Ottawa, Ontario 1-1 -1 Toronto, Ontario 21 --