Feasibility Study for the Improvement of the National Route 2 and Route 7 Final Report CHAPTER 8 EXISTING TRAFFIC CONDITIONS
|
|
|
- Grant Washington
- 5 years ago
- Views:
Transcription
1 CHAPTER 8 EXISTING TRAFFIC CONDITIONS
2 8 EXISTING TRAFFIC CONDITIONS Various traffic surveys have been carried out in order to analyze existing traffic condition in the study area. Traffic survey location map is shown in Figure Legend OD and Roadside Count Roadside Count Intersection Traffic Count Axle Load Survey Travel Speed Survey Route Figure Traffic Survey Location Map 8.1 Roadside Traffic Count Survey Result of Roadside Traffic Count Existing traffic volume was counted at 8 locations in total and they were classified into two types; at 5 locations (same as the Roadside Origin-Destination survey locations) over a 12 hour period from 6:00 a.m. to 6:00 p.m. on a weekday, and at 3 independent locations over a 12 hour period on a weekday. Heavy Vehicle Ratio at each survey point is shown in Table Table hours Heavy Vehicle Ratio of Roadside Count Location No. of Heavy Heavy Vehicle Location Name Number Vehicles Ratio 1 San Lorenzo Capiatá Section 6, % 2 Capiatá Itauguá Section 4, % 3 Ypacarai Caacupe Section 3, % 4 Eusebio Ayala Itacurubi Section 2, % 5 Caacupé Piribebuy Detour Section 1, % 6 San Jose Cnel. Oviedo Section 2, % 7 Cnel. Oviedo Caaguazú Section 1, % 8 Villarrica Cnel. Oviedo Section % 8-1

3 8.2 Roadside OD Survey Present OD Volume A roadside Origin-Destination (OD) survey was conducted by interviewing drivers at 5 locations over a 12 hour period from 6:00 a.m. to 6:00 p.m. on a weekday. The number of samples checked is tabulated in Table Vehicle movements by vehicle type obtained from the results of OD survey are illustrated under Desired Lines in Figure Figure Desired Lines Present Traffic Generation and Attraction by Vehicle Type The present traffic generation/attraction volume by traffic zone, which was developed both by the OD survey results, roadside traffic count results, the review of Estudio del Plan Maestro del Transporte Nacional (1992; JICA) (hereinafter referred to as ETNA study) and The Feasibility Study on Arterial Road Development project in the Central Eastern Area in The Republic of Paraguay (1997; JICA) (hereinafter referred to as PARAGUARI-VILLARRICA study), is tabulated in Table
4 Table Sample Number of Roadside Origin-Destination Survey Loc. Dir Survey Coche Bus Truck Total 1 de Asuncion Count 8,724 1,230 2,032 11,986 OD sample Ratio % a Asuncion Count 9,128 1,317 1,679 12,124 OD sample Ratio % 2 de Asuncion Count 4, ,336 6,974 OD sample ,125 Ratio % a Asuncion Count 4, ,289 6,809 OD sample ,146 Ratio % de Asuncion Count 2, ,174 3,986 OD sample Ratio % a Asuncion Count 2, ,640 OD sample Ratio % 4 de Asuncion Count 1, ,008 2,997 OD sample Ratio % a Asuncion Count 1, ,861 OD sample Ratio % de Asuncion Count 1, ,102 OD sample Ratio % a Asuncion Count 1, ,918 OD sample Ratio % 6 de Asuncion Count 1, ,363 OD sample Ratio % a Asuncion Count 1, ,312 OD sample Ratio % de Cnel. Oviedo Count OD sample Ratio % a Cnel. Oviedo Count OD sample Ratio % de Asuncion Count ,685 OD sample Ratio % Count ,682 OD sample a Asuncion Ratio %
5 Zone No. Table Daily Traffic Generation and Attraction in 1999 Zone Name P. Car Bus Truck Total Generation Attraction Generation Attraction Generation Attraction Generation Attraction 1. PARAGUARI ESCOBAR SAPUCAI ACAHAY CARAPEGUA YAGUARON PIRAYU CABALLERO YBYTIMI TEBICUARY MI LA COLMENA YBYCUI VILLARRICA YATAITY MBOCAYATY NUMI SAN SALVADOR ITURBE BORJA ITAPE CORONEL MARTINEZ FELIX PEREZ CARDOZO CAACUPE 1,148 1, ,101 2, EUSEBIO AYALA PIRIBEBUY ITACURUBI DE LA CORDILLERA VALENZUELA CORONEL OVIEDO , ,858 1, NUEVA LONDRES SAN JOSE DE LOS ARROYOS ASUNCION 6,478 6,715 1,498 1,388 2,061 1,384 10,037 9, CONCEPCION ,704 1,448 1,925 1, SAN PEDRO ,521 2,233 1,860 2, CORDILLERA OESTE , CORDILLERA ESTE , GUAIRA CAAGUAZU OESTE CAAGUAZU ESTE ,168 1, ITAPUA CAAZAPA ESTE ITAPUA ,776 2,492 3,059 2, MISIONES 5,874 5, ,750 1,976 7, PARAGUARI SUR ALTO PARANA ,642 1, CENTRAL NORTE 2,303 2, ,561 2,816 3,949 5, CENTRAL SUR ,435 1, NEEMBUCU AMAMBAY 2,303 2, ,561 2,816 3,949 5, CANINDEYU ,435 1, CHACO
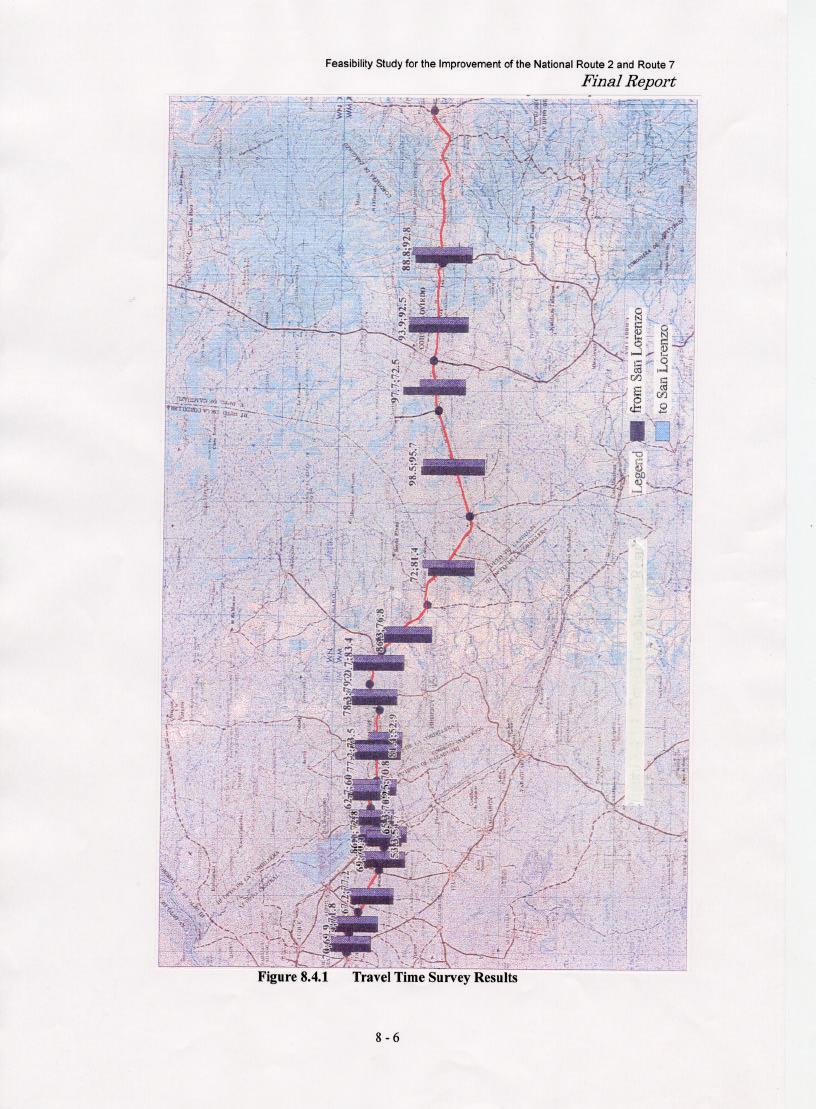
6 8.3 Intersection Traffic Count Survey Result of Intersection Traffic Count Survey Existing intersection traffic volume was counted at 8 major intersections over a 12 hour period from 6:00 a.m. to 6:00 p.m. on a weekday. Heavy Vehicle Ratio at each survey intersection is shown in Table Table hours Heavy Vehicle Ratio of Intersection Count Intersection Number Intersection Name No. of Heavy Vehicles Heavy Vehicle Ratio 1 San Lorenzo - Intersection of Roads 1 and 2 4, % 2 Capiata Detour to Aregua 5, % 3 Ypacarai Detour to San Bernardino 2, % 4 Caacupe Detour to Piribebuy 2, % 5 Eusebio Ayala City entry 1, % 6 Itacurubi Detour to Valenzuela 1, % 7 Cnel. Oviedo Rotonda of Road 7 2, % 8 Caaguazu Intersection of the Road to Yhú 2, % 8.4 Travel Time Survey Result of Travel Time Survey Travel speed was examined by registering trip distance and travel time at major intersections along the target route between San Lorenzo and Caaguazu on national roads 2 and 7. One surveyor recorded the distance, by using the trip meter in his vehicle, and the time, by using his watch. This survey was carried out 3 times in each direction. The travel time survey results are shown in Figure
7
8 8.5 Axle Load The purposes of the Axle Load survey are to obtain data to calculate Equivalent Single Axle Load (ESAL) factors used in the design of flexible pavements. The AASHTO method was applied to calculate the ESAL factors Procedure Procedure to determine the axle load distribution pattern is shown in Figure Based on the axle load data, axle load distribution pattern by type of axle ( Bus and Trucks ) was established, then the axle load distribution pattern for all types of truck was developed on percentage shares of empty and loaded trucks as well as truck types. This chapter discussed axle load distribution pattern as shown in Figure Load meter Survey Bus Truck Axle Load Distribution Pattern By Type of Axle Single Axle Tandem Axle Equivalent Single Loads Pavement Analysis Pavement Design Figure Procedure to Determine Axle Load Axle Load Distribution Pattern by Type of Axles As shown in Table 8.5.1, the following four(4) types of axle load distribution pattern by type of axle were developed. Trucks ( Loaded / Empty ) Single axle load distribution pattern for 2-axle load Single axle distribution pattern for trucks with 3 more axles Tandem axle load distribution pattern 8-7
9 Vehicle type Trucks Table Axle Load Distribution Pattern by Type of Axle Axle Composition Axle Load Distribution Pattern by Type of Axle 2-Axle Truck 2 Single Axle single axle load distribution 3-Axle Truck 4-Axle truck 5-Axle truck Buses All type 1 Single Axle 1 Tandem Axle 2 Single Axles 1 Tandem Axle 1 Single Axle 2 Tandem Axles Pattern for 2-axle truck ( 2 single-axle loads combined ) Single axle load distribution Pattern for Truck with 3 or more axles ( All single axle loads of 3, 4 & 5 axle truck combined ) Tandem axle load distribution Pattern ( All tandem axle load of 3,4 and 5 axle trucks combined ) Single axle load distribution pattern Survey Results The information collected in the survey forms was tabulated by vehicle type and the weight for each axle was inputted. The axles were then grouped according to the recommended AASHTO weight groupings and the total number of axles in each group was calculated. The average weight of the group was also calculated. Using the AASHTO Traffic Equivalency Factor tables, the prorated factor was obtained for each group. Then the 18kips ESAL was calculated for each group and the ESAL factor for each vehicle type was established. Table shows truck factors. Survey Station Direction Table Axle Truck Axle Load Equivalency Factors Tuck Factor 3 Axle Trailer Truck All Trucks (54%) (21%) (25%) (51%) Km (60%) (10%) (30%) (49%) (48%) (28%) (24%) (47%) Km (41%) (12%) (47%) (53%) 8-8
10 8.6 Observation on Factors Affecting Traffic Flow Present Traffic Condition on Target Route Demand forecasting process is based on 24 hour annual average traffic. Then 12 hour traffic volume is required to convert 24 hour annual average traffic volume. In this study, the 12 hour traffic volume was converted by permanent traffic count point data of M.O.P.C-O.P.I.T and survey data of Paraguarí-Villarrica study. These data are shown in Table 8.6.1, Figure and Figure hour annual traffic volume on target route is shown in Figure Table h/12h Traffic Volume Ratio on National Road 2 at San Jose Item P. Car Bus Truck Total Both 24h Volume 2, ,042 5,005 12h Volume 1, ,066 3,061 24h/12h Ratio Source by Paraguarí-Villarrica study h/12h Ratio P. Car Bus Truck Total Vehicle Type by "The Feasibilityu Study on Arterial Road Development Project in the Central Eastern Area in the Republic of Paraguay (1996; JICA) Figure h/12h Traffic Volume Ratio on National Road 2 at San Jose 8-9

11 Manthly Traffic Volume Fluctuation in 1998 by O.P.I.T. Ypacarai RUTA 2 Manthly Traffic Volume Ratio in 1998 by O.P.I.T. Ypacarai RUTA 2 20, Daily Traffic Volume All Vehicle / day 15,000 10,000 5,000 Daily Traffic Volume Annual Average Traffic Volume : Enero98 Marzo98 Mayo98 Julio98 Setiembre98 Noviembre98 Enero98 Marzo98 Mayo98 Julio98 Setiembre98 Noviembre98 Febrero98 Abril98 Junio98 Agost98 Octubre98 Diciembre98 Febrero98 Abril98 Junio98 Agost98 Octubre98 Diciembre98 Month Month Annual Average Traffic Volume 14,572 Annual Average Traffic Volume 14,572 Manthly Traffic Volume Fluctuation in 1998 by O.P.I.T. Oviedo RUTA 2 Manthly Traffic Volume Ratio in 1998 by O.P.I.T. Oviedo RUTA 2 20, Daily Traffic Volume All Vehicle / day 15,000 10,000 5,000 Daily Traffic Volume All Vehicle / day Enero98 Marzo98 Mayo98 Julio98 Setiembre98 Noviembre98 Enero98 Marzo98 Mayo98 Julio98 Setiembre98 Noviembre98 Febrero98 Abril98 Junio98 Agost98 Octubre98 Diciembre98 Febrero98 Abril98 Junio98 Agost98 Octubre98 Diciembre98 Month Month Annual Average Traffic Volume 6,291 Annual Average Traffic Volume 6,291 Manthly Traffic Volume Fluctuation in 1998 by O.P.I.T. Pastoreo RUTA 7 Manthly Traffic Volume Ratio in 1998 by O.P.I.T. Pastoreo RUTA 7 20, Daily Traffic Volume All Vehicle / day 15,000 10,000 5,000 Daily Traffic Volume All Vehicle / day Enero98 Marzo98 Mayo98 Julio98 Setiembre98 Noviembre98 Enero98 Marzo98 Mayo98 Julio98 Setiembre98 Noviembre98 Febrero98 Abril98 Junio98 Agost98 Octubre98 Diciembre98 Febrero98 Abril98 Junio98 Agost98 Octubre98 Diciembre98 Month Month Annual Average Traffic Volume 4,642 Annual Average Traffic Volume 4,642 Figure Annual Traffic Volume Fluctuation on Target Route Unit: Vehicle / 24 hours Figure hours Annual Average Traffic 8-10
12 8.6.2 Characteristics of Present Traffic Conditions on Target Route Existing traffic could be classified into three types; between San Lorenzo and Ypacarai, Ypacarai and Cnel. Oviedo, Cnel. Oviedo and Caaguazu. The characteristics were as follows. (1) San Lorenzo - Ypacarai The target route is basically an inter city route connecting the metropolitan area and Ciudad del Este. But the traffic in this section is not only inter-city traffic. It includes commuting traffic between CBD area and residential areas. The reason is as follows; 1) Traffic volume is higher than other sections. 2) Heavy vehicle volume is less than other sections. 3) High density residential area has moved from CBD towards San Lorenzo in the last few years. The daily volume of traffic in the built-up area of San Lorenzo is currently 38,000, and it decreases on the section between San Lorenzo and Ypacaraí, or 28,000. This difference mostly stems from commuter traffic generated and attracted by the built-up area of San Lorenzo. Although the traffic is mainly inter-city in character, in-in and in-out traffic of this zone account for 40% of the total. This zone contains highly urbanized areas, and further housing developments will lead to an increase in access traffic and access points along the national route. The peak hour of the inter-city traffic is around seven o clock in the morning, but the peak rate is actually rather small or 6.3%. The direction distribution during peak hours is 55/45, which means that the traffic flow is characterized as an urban type. On the other hand, however, the truck ratio is found to be high, or 30.1% for the daily average and 22.6% during peak hours. These characteristics show that the section can be classified as an inter-city trunk road. (2) Ypacaraí - Cnel. Oviedo The characteristics of this section are moderate between the San Lorenzo - Ypacarai section and the Cnel. Oviedo - Caaguazu section. The farther away from Asuncion, Ypacaraí Caacupé, Caacupé- Desvio a Piribebuy, Eusebio Ayala Itacurubí, Capiatá Itauguá, and San Jose Cnel. Oviedo, the lower the traffic volume becomes, from 23,000 to 8,000. To the contrary, the truck ratio increases from 35% to 51%. Peak traffic occurs between 2:00 to 4:00 p.m., and the peak rate ranges from 5.8% to 6.6%. The direction distribution during peak hours is 60/40 in San Jose and 58/42 in Capiatá, and they show a significant disparity. In other areas, however, it is 52/48, the difference is rather small. Ratios of nighttime traffic to 12-hour daytime of truck, bus, and auto are relatively high, or 0.91, 0.74, and 0.45, respectively. This implies that the road improvement plan needs to take into account safety during the night. 8-11
13 Those intersections in urbanized areas contain local traffic and thus show lower truck ratios, ranging from 37 to 50%, than the inter-city sections. However, the absolute number of trucks is still significant. Peak traffic occurs between 3:00 to 5:00pm, and the peak rate is 6.1 to 7.1%. Since inter-city traffic is usually long-distance, road improvements require considerations for long-distance freight transport. The cities along National Route 2 are developed mostly on roadside areas. There are many access roads to Route 2, and they have narrow road widths. The lateral clearance of road traffic is also small. In two-lane roads in CBDs, the traffic capacity at the service level of D is only 1,400PCU. With the existing traffic volume, the capacity is easily saturated, and thus it is necessary to take some measures to resolve this problem. Roads on rolling terrain do not have large cuts or embankment structures, and their vertical alignments simply follow natural terrain. Because of this, there are sections where topographic features negatively affect the traffic capacity of roads. Currently, this poses little problem, but in future when traffic volume increases, it will be necessary to increase the road capacity. (3) Cnel. Oviedo - Caaguazú The traffic in this section is mainly inter city traffic. The reason is as follows; 1) Traffic volume is lower than in other sections. 2) Heavy vehicle volume is higher than other sections. 3) Cargo vehicle volume ratio is higher in heavy vehicle traffic. In this section, the daily volume of traffic is between 3,000 to 6,000, many of which are long-distance trips. The composition of trucks is relatively high and accounts for 40.5 to 57.9%. Peak traffic occurs from 4:00 to 5:00 p.m., and the peak rate is rather low, ranging from 6.7% to 7.1%. The direction distribution during peak hours remains at a similar level throughout the section, or 52/48. Like the section between Ypacaraí and Cnel. Oviedo, the ratio of nighttime to daytime traffic is fairly significant, and thus it is necessary to take some measures to insure safety during nighttime as well. The right-of-way is reserved for about 100m in width even in urban areas. There are almost no factors that pose constraints to traffic capacity in this section, and it is not difficult to secure the capacity of handling 2,400 vehicles per day. However, the vertical alignment of the sections on rolling terrain has been designed without correcting the natural topography, and there are sections where steep slopes lower the road capacity. It is important, therefore, to prepare for an increase in future traffic volume and insure the safety of long-distance operations of heavy trucks. At intersections in the cities along Route 7, local traffic is added to inter-city traffic, and the volume reaches 1,100 to 1,500. This is over three times more than the volume on the 8-12
14 inter-city sections, and many urban places are congested on a daily basis. Peak hours in the cities are between 4:00 to 5:00 p.m., and the rate ranges from 5.9% to 6.3%. The truck ratio during the peak hours is as high as 31.8% to 38.7%. It is thus critical to improve those intersections by taking into account large vehicles, traffic accidents, and daily local traffic. 8.7 Level of Service by Road Section and Intersection Present Service Level on Target Route The level of service by road section is almost reasonable excluding some inner city area sections. This has been confirmed by the travel time survey results. The target route is almost able to pass traffic at more than 60 km/h. The speed is reduced only in some city area sections to 50 km/h and 60 km/h. The level of service at intersections are also not so bad. The main direction is of course along national roads 2 and 7, but cross traffic is quite low compared to the main direction volume. This has been confirmed by an intersection traffic count survey. 8-13
Implementation Status & Results Paraguay Road Maintenance (P082026)
") Public Disclosure Authorized Public Disclosure Authorized The World Bank Implementation Status & Results Paraguay Road Maintenance (P082026) Operation Name: Road Maintenance (P082026) Project Stage: Implementation
Public Disclosure Authorized Public Disclosure Authorized The World Bank Implementation Status & Results Paraguay Road Maintenance (P082026) Operation Name: Road Maintenance (P082026) Project Stage: Implementation
MEMORANDUM. Lynn Hayes LSA Associates, Inc.
 MEMORANDUM To: Lynn Hayes LSA Associates, Inc. Date: May 5, 217 From: Zawwar Saiyed, P.E., Senior Transportation Engineer Justin Tucker, Transportation Engineer I Linscott, Law & Greenspan, Engineers LLG
3.3 COST ESTIMATION OF THE MAIN PROJECTS. (1) Main projects. 1) Improvement of export corridor
 Main projects. 1) Improvement of export corridor") 3.3 COST ESTIMATION OF THE MAIN PROJECTS (1) Main projects 1) Improvement of export corridor The promotion of exports is indispensable for the development of the Paraguayan economy, and improvement of
3.3 COST ESTIMATION OF THE MAIN PROJECTS (1) Main projects 1) Improvement of export corridor The promotion of exports is indispensable for the development of the Paraguayan economy, and improvement of
Chromatic variation in populations of Xenodon merremi (Serpentes: Dipsadidae) in Paraguay
 in Paraguay") Acta Herpetologica 5(1): 107-112, 2010 Chromatic variation in populations of Xenodon merremi (Serpentes: Dipsadidae) in Paraguay Pier Cacciali Departamento de Paleontología, Facultad de Ciencias, Universidad
Acta Herpetologica 5(1): 107-112, 2010 Chromatic variation in populations of Xenodon merremi (Serpentes: Dipsadidae) in Paraguay Pier Cacciali Departamento de Paleontología, Facultad de Ciencias, Universidad
Infrastructure Plans of the New Direction for Paraguay
 Ministry of Public Works and Communications PARAGUAY Infrastructure Plans of the New Direction for Paraguay Term 2014-2018 May, 2014 1. Transportation Master Plan Transportation Master Plan Master Plan
#9 #10 Cuál es la fecha packet 2018.notebook. November 27, 2018
 1 2 3 4 5 Página 6 son The days of the week are What day is it today? What day is it tomorrow? Today is Tomorrow is (the) day today tomorrow (the) day (the) days (the) week el fin de semana weekend Monday
A. CONCLUSIONS OF THE FGEIS
 Chapter 11: Traffic and Parking A. CONCLUSIONS OF THE FGEIS The FGEIS found that the Approved Plan will generate a substantial volume of vehicular and pedestrian activity, including an estimated 1,300
Evaluation of High-Occupancy-Vehicle
 TRANSPORTATION RESEARCH RECORD 1446 Evaluation of High-Occupancy-Vehicle Lanes in Phoenix, Arizona MARK J. POPPE, DAVID J.P. HOOK, AND KEN M. HOWELL High-occupancy-vehicle (HOV) lanes were first introduced
2008 DEKALB COUNTY TRANSPORTATION PLAN (UPDATE)
") 2008 DEKALB COUNTY TRANSPORTATION PLAN (UPDATE) TABLE OF CONTENTS Introduction 1 Transportation Planning Activities 2 Identification of Problem Areas and Recommended Solutions 7 DeKalb County Projects
2008 DEKALB COUNTY TRANSPORTATION PLAN (UPDATE) TABLE OF CONTENTS Introduction 1 Transportation Planning Activities 2 Identification of Problem Areas and Recommended Solutions 7 DeKalb County Projects
CONGESTION MONITORING THE NEW ZEALAND EXPERIENCE. By Mike Curran, Manager Strategic Policy, Transit New Zealand
 CONGESTION MONITORING THE NEW ZEALAND EXPERIENCE 26 th Australasian Transport Research Forum Wellington New Zealand 1-3 October 2003 By, Manager Strategic Policy, Transit New Zealand Abstract New Zealand
According to FAA Advisory Circular 150/5060-5, Airport Capacity and Delay, the elements that affect airfield capacity include:
 4.1 INTRODUCTION The previous chapters have described the existing facilities and provided planning guidelines as well as a forecast of demand for aviation activity at North Perry Airport. The demand/capacity
Other Principle Arterials Minor Arterial Major Collector Minor Collector Local
 CHAPTER 10 TRANSPORTATION Introduction The system of public roads in East Pikeland Township is decidedly rural in character. Since the 1984, the road network has remained much the same, with the addition
PREFACE. Service frequency; Hours of service; Service coverage; Passenger loading; Reliability, and Transit vs. auto travel time.
 PREFACE The Florida Department of Transportation (FDOT) has embarked upon a statewide evaluation of transit system performance. The outcome of this evaluation is a benchmark of transit performance that
TRADE, SERVICES AND DEVELOPMENT
 UNCTAD Multi-year Expert Meeting on TRADE, SERVICES AND DEVELOPMENT Water and Sanitation, Energy and Food-related Logistics Services Geneva, 7-8 May 2018 Trade in Energy Services in Paraguay and Objective
The number of passengers using public transport increases by 2.4% in November, as compared with the same month of 2017
 14 January 2019 Passenger Transport Statistics (PT) November 2018. Provisional data The number of passengers using public transport increases by 2.4% in November, as compared with the same month of 2017
Birth Register and Statistics. A big challenge for the Pan American Health Organization (PAHO) Dr Fatima Marinho, HDM/HA Coordinator
 Dr Fatima Marinho, HDM/HA Coordinator") Birth Register and Statistics. A big challenge for the Pan American Health Organization (PAHO) Dr Fatima Marinho, HDM/HA Coordinator Congreso Mundial de Epidemiología. Porto Alegre, Brasil, September 21-25,
Birth Register and Statistics. A big challenge for the Pan American Health Organization (PAHO) Dr Fatima Marinho, HDM/HA Coordinator Congreso Mundial de Epidemiología. Porto Alegre, Brasil, September 21-25,
Section 106 Update Memo #1 Attachment D. Traffic Diversion & APE Expansion Methodology & Maps
 Section 106 Update Memo #1 Attachment D Traffic Diversion & APE Expansion Methodology & Maps I-65/I-70 North Split Interchange Reconstruction Project (Des. Nos. 1592385 & 1600808) Traffic Diversion and
A Basic Study on Trip Reservation Systems for Recreational Trips on Motorways
 A Basic Study on Trip Reservation Systems for Recreational Trips on Motorways Hirokazu AKAHANE(1) Masao KUWAHARA(2) (1) Chiba Institute of Technology, 2-17-1 Tsudanuma, Narashino-shi, Chiba 275, JAPAN
COCESNA S FLIGHT PLAN STATISTICS. Flight Plan
 COCESNA S FLIGHT PLAN STATISTICS Flight Plan FLIGHT PLAN IN CENTRAL AMERICA In different parts of the world the problem in the flight plans is a wellknown issue, Central America is not the exception, the
5 Rail demand in Western Sydney
 5 Rail demand in Western Sydney About this chapter To better understand where new or enhanced rail services are needed, this chapter presents an overview of the existing and future demand on the rail network
Watts St westbound thru
 Executive Summary At the request of the Hudson Square Business Improvement District, Sam Schwartz Engineering, DPC (Sam Schwartz) has completed a technical analysis of various congestion pricing and/or
PAHO Regional Perspective: Strengthening CR-VS in the Americas
 PAHO Regional Perspective: Strengthening CR-VS in the Americas Alejandro Giusti. Regional Advisor in Vital and Health Statistics s (PAHO) Strengthening Civil Registration World Bank, Washington, June 9,
Date: 11/6/15. Total Passengers
 Total San Diego Metropolitan Transit System POLICY 42 PERFORMANCE MONITORING REPORT Page 1 of 6 OBJECTIVE Develop a Customer-Focused and Competitive System The following measures of productivity and service
FHWA P/N Guidelines. Corridor Relationship. Highway 22 Segment 1 - US 169 to CSAH 2 Relevance / Documentation of Need
 Highway 22 Segment 1 - US 169 to CSAH 2 Vehicle Mobility Congestion Intersection Congestion Existing Conditions - Based on Highway Capacity Manual methodology, corridor level of service is currently LOS
Reporte Mensual de carga.
 Reporte Mensual de carga. ENE FEB MAR ABR MAY JUN JUL AGO SEP OCT NOV DIC TOTAL TEU S VACIO S 388 195 198 258 569 66 894 426 1,0 80 55 394 432 6,265 LLENO S 862 1,6 84 1,01 1 1,40 5 1,5 09 2,29 2 1,82
Analysis of Transit Fare Evasion in the Rose Quarter
 Analysis of Transit Fare Evasion in the Rose Quarter Shimon A. Israel James G. Strathman February 2002 Center for Urban Studies College of Urban and Public Affairs Portland State University Portland, OR
METROBUS SERVICE GUIDELINES
 METROBUS SERVICE GUIDELINES In the late 1990's when stabilization of bus service was accomplished between WMATA and the local jurisdictional bus systems, the need for service planning processes and procedures
WELLINGTON $422 MILLION $614 MILLION $83 MILLION 22% SPEND $1.9 BILLION
 WELLINGTON WELLINGTON $1.9 BILLION FORECAST TOTAL WELLINGTON INVESTMENT The Wellington region s transport challenges are dominated by the region s concentration of population in the metropolitan cities,
Caacupe-mí Port / Asunción. 1er. Puerto Privado desde 1980
 Caacupe-mí Port / Asunción Caacupe-mí Port / Pilar Caacupe-mí Logistic Park Division / Asunción Who we are Caacupe-mí is the first private port in Paraguay, founded in 1980, with 36 years of experience
Chapter 3. Burke & Company
 Chapter 3 Burke & Company 3. WRTA RIDERSHIP AND RIDERSHIP TRENDS 3.1 Service Overview The Worcester Regional Transit Authority (WRTA) provides transit service to over half a million people. The service
London Borough of Barnet Traffic & Development Design Team
 London Borough of Barnet Traffic & Development Design Team AERODROME ROAD PEDESTRIAN FACILITY AND BUS STOP INTRODUCTION FEASIBILITY REPORT Job Number: 60668 Doc Ref: S106/12-13/60668 Author: Manoj Kalair
Interstate 90 and Mercer Island Mobility Study APRIL Commissioned by. Prepared by
 Interstate 90 and Mercer Island Mobility Study APRIL 2017 Commissioned by Prepared by Interstate 90 and Mercer Island Mobility Study Commissioned by: Sound Transit Prepared by: April 2017 Contents Section
5.1 Traffic and Transportation
 5.1 When it opens in 2009, the Bellevue Nickel Improvement Project will increase the number of vehicles able to travel through the study area, improve travel speeds, and improve safety by reducing the
Below is an example of a well laid-out template of a route card used by the Sionnach Team which is a good format to begin with.
 Route Card A route card is used as a navigational aid to hill walkers by setting out a step by step plan for an intended hike. It is good practice to make out a route card before every hike you or your
7272 WISCONSIN AVENUE LOCAL AREA TRANSPORTATION REVIEW
 7272 LOCAL AREA TRANSPORTATION REVIEW AND TRANSPORTATION POLICY AREA REVIEW MONTGOMERY COUNTY, MARYLAND Submitted on behalf of Carr Properties Prepared by: Wells + Associates, Inc. Submission: July 1,
HOUSEHOLD TRAVEL SURVEY
 HOUSEHOLD TRAVEL SURVEY Household Travel Survey i TABLE OF CONTENTS Page 1.0 INTRODUCTION... 1 2.0 SUMMARY OF TRAVEL... 2 2.1 All-Day Travel Patterns... 2 2.1.1 Automobile Availability... 2 2.1.2 Trip
LUDWIG RD. SUBDIVISION PROJECT TRAFFIC IMPACT ANALYSIS
 LUDWIG RD. SUBDIVISION PROJECT TRAFFIC IMPACT ANALYSIS Prepared for Skip Coddington GSC Development, Inc PO Box 1623 Woodinville WA 9872 Prepared by 1141 NE 124 th St., #59 Kirkland, WA 9834 425.522.4118
EXISTING CONDITIONS A. INTRODUCTION. Route 107 Corridor Study Report
 II. EXISTING CONDITIONS A. INTRODUCTION The Route 107 study area extends from the south at Chestnut Street in Lynn approximately 3.7 miles to the north to Boston Street in Salem. The study area has three
Bus Corridor Service Options
 Bus Corridor Service Options Outline Corridor Objectives and Strategies Express Local Limited Stop Overlay on Local Service 1 Deadhead 1 Stacey Schwarcz, "Service Design for Heavy Demand Corridors: Limited-Stop
PURPOSE AND NEED (CONCURRENCE POINT 1) NEW CANADA ROAD PROJECT FROM STATE ROUTE 1 (U.S. HIGHWAY 70) TO U.S. INTERSTATE 40
 NEW CANADA ROAD PROJECT FROM STATE ROUTE 1 (U.S. HIGHWAY 70) TO U.S. INTERSTATE 40") PURPOSE AND NEED (CONCURRENCE POINT 1) NEW CANADA ROAD PROJECT FROM STATE ROUTE 1 (U.S. HIGHWAY 70) TO U.S. INTERSTATE 40 Project Description The primary purpose of this project is to improve the major
PURPOSE AND NEED (CONCURRENCE POINT 1) NEW CANADA ROAD PROJECT FROM STATE ROUTE 1 (U.S. HIGHWAY 70) TO U.S. INTERSTATE 40 Project Description The primary purpose of this project is to improve the major
JUNEAU RUNWAY INCURSION MITIGATION (RIM) PROGRAM JANUARY 25, 2017
 PROGRAM JANUARY 25, 2017") JUNEAU RUNWAY INCURSION MITIGATION (RIM) PROGRAM JANUARY 25, 2017 1 Agenda Program Description Runway Incursions Design and Geometry Deficiencies Runway 8/26 Operations Potential Mitigation Next Steps
JUNEAU RUNWAY INCURSION MITIGATION (RIM) PROGRAM JANUARY 25, 2017 1 Agenda Program Description Runway Incursions Design and Geometry Deficiencies Runway 8/26 Operations Potential Mitigation Next Steps
Att. A, AI 46, 11/9/17
 Total s San Diego Metropolitan Transit System POLICY 42 PERFORMANCE MONITORING REPORT Page 1 of 6 Date: 11/8/17 OBJECTIVE Develop a Customer-Focused and Competitive System The following measures of productivity
Corridor Analysis. Corridor Objectives and Strategies Express Local Limited Stop Overlay on Local Service 1 Deadhead
 Corridor Analysis Outline Corridor Objectives and Strategies Express Local Limited Stop Overlay on Local Service 1 Deadhead 1 Stacey Schwarcz, "Service Design for Heavy Demand Corridors: Limited-Stop Bus
Integrated Sustainability Assessment and Reporting Algarve (Portugal) 22nd October 2007
 22nd October 2007") Integrated Sustainability Assessment and Reporting Algarve (Portugal) 22 nd October 2007 INDEX INFORMATION ON CALVIÀ: IMBALANCES TOWARDS A SUSTAINABLE DEVELOPMENT TOURISM: ACTIONS SUSTAINABLE COMUNICATION
Integrated Sustainability Assessment and Reporting Algarve (Portugal) 22 nd October 2007 INDEX INFORMATION ON CALVIÀ: IMBALANCES TOWARDS A SUSTAINABLE DEVELOPMENT TOURISM: ACTIONS SUSTAINABLE COMUNICATION
Appendix 4.1 J. May 17, 2010 Memorandum from CTPS to the Inter Agency Coordinating Group
 Appendix 4.1 J May 17, 2010 Memorandum from CTPS to the Inter Agency Coordinating Group CTPS CENTRAL TRANSPORTATION PLANNING STAFF Staff to the Boston Region Metropolitan Planning Organization MEMORANDUM
SOLUZIONA S.A. Servicios Profesionales de UNIÓN FENOSA. Recognition of current status on the Access Roads to El Tesoro Project Report.
 SOLUZIONA S.A. Servicios Profesionales de UNIÓN FENOSA Recognition of current status on the Access Roads to El Tesoro Project Report. July 22nd, 2002 Part 1 Meeting with Luis Verdugo Repetto, S.A. Beginning
CHRISTCHURCH MOTORWAYS. Project Summary Statement February 2010
 CHRISTCHURCH MOTORWAYS Project Summary Statement February 2010 Table of Contents 1. Purpose of Document 2. Strategic Context 3. Benefits 4. Project Scope and Economics 5. Implementation Plan 1 ROADS OF
TRANSPORTATION ELEMENT
 Transportation TRANSPORTATION ELEMENT Data, Inventory, and Analysis Prepared by Contents 1.0 INTRODUCTION... 1 2.0 EXISTING CONDITIONS... 1 2.1 Roadways... 1 2.1.1 Jurisdiction... 1 2.1.2 Functional Classification...
HDR itrans Consulting Inc. 100 York Blvd., Suite 300 Richmond Hill, ON L4B 1J8 Tel: (905) Fax: (905)
 Fax: (905)") !" # $ !" # $ Consulting Inc. 100 York Blvd., Suite 300 Richmond Hill, ON L4B 1J8 Tel: (905) 882-4100 Fax: (905) 882-1557 www.itransconsulting.com November 2009 %&'('$&$ 1. West Brampton Road Network...
!" # $ !" # $ Consulting Inc. 100 York Blvd., Suite 300 Richmond Hill, ON L4B 1J8 Tel: (905) 882-4100 Fax: (905) 882-1557 www.itransconsulting.com November 2009 %&'('$&$ 1. West Brampton Road Network...
PLAN MAESTRO DE TRANSPORTE SOSTENIBLE EN GUATEMALA
 PLAN MAESTRO DE TRANSPORTE SOSTENIBLE EN GUATEMALA 18 de Octubre, Club Alemánd Dr. Niklas Sieber Transport Economist Regional Planner www.niklas-sieber.de Plan Maestro de Transporte 2 Agenda 1. Transport
Egnatia Odos Observatory. Egnatia Odos Observatory Monitoring of Egnatia Motorway s s Spatial Impacts
 Egnatia Odos Observatory Egnatia Odos Observatory Monitoring of Egnatia Motorway s s Spatial Impacts 1 Egnatia Odos Observatory 1. The unique Greek observatory of transport and spatial impacts 2. Scope
Washington Dulles International Airport (IAD) Aircraft Noise Contour Map Update
 Aircraft Noise Contour Map Update") Washington Dulles International Airport (IAD) Aircraft Noise Contour Map Update Ultimate ASV, Runway Use and Flight Tracks 4th Working Group Briefing 8/13/18 Meeting Purpose Discuss Public Workshop input
Washington Dulles International Airport (IAD) Aircraft Noise Contour Map Update Ultimate ASV, Runway Use and Flight Tracks 4th Working Group Briefing 8/13/18 Meeting Purpose Discuss Public Workshop input
SAMTRANS TITLE VI STANDARDS AND POLICIES
 SAMTRANS TITLE VI STANDARDS AND POLICIES Adopted March 13, 2013 Federal Title VI requirements of the Civil Rights Act of 1964 were recently updated by the Federal Transit Administration (FTA) and now require
Zika virus transmission: ECDC adaptions of WHO s Zika Virus Country Classification Scheme
 Zika virus transmission: ECDC adaptions of WHO s Zika Virus Country Classification Scheme Country Region Country classification category for Zika transmission n Samoa Angola Anguilla Antigua and Barbuda
6 Road infrastructure
 6 Road infrastructure 51 ƨƨsummary New Zealand does not score highly for its road infrastructure when compared to other developed nations. This may partly be due to geography and population size, which
Proceedings, 2012 International Snow Science Workshop, Anchorage, Alaska
 I-90 SNOQUALMIE PASS: OPERATING A HIGHWAY AVALANCHE PROGRAM DURING A MAJOR CONSTRUCTION PROJECT John Stimberis, Washington State Department of Transportation ABSTRACT: Snoqualmie Pass, WA (921m) receives
US 380 FEASIBILITY STUDY
 US 380 FEASIBILITY STUDY Denton County CSJ(s): 0135-10-061, 0135-10-062 Public Meeting(s): January 15 & 22, 2019 WELCOME US 380 Denton County Feasibility Study DALLAS DISTRICT PUBLIC MEETING January 15
Treasure Island Supplemental Information Report Addendum
 1 1 1 1 0 1 0 1 0 1 Treasure Island Supplemental Information Report Addendum Introduction Purpose The purpose of this Supplemental Information Report (SIR) Addendum is to determine if the current land
Regional summary - Wellington
 Regional summary Wellington Regional summary - Wellington This is a summary of data relevant to transportation in this region, viewed from a Land Transport NZ perspective. It s purpose is to inform the
1.2 Corridor History and Current Characteristics
 SECTION 1 Description and Background of Study Area 1.1 Introduction This preliminary engineering report was prepared for the Alaska Department of Transportation and Public Facilities (ADOT&PF). It is part
B. Congestion Trends. Congestion Trends
 B. Congestion Trends Congestion Trends There are two types of congestion that impact mobility: recurring and non-recurring congestion. Recurring congestion is related to segments of roadway that are over
Overall index Monthly variationl Accumulated variation Annual variation November
 14 December 2017 Consumer Price Index (CPI). Base 2016 November 2017 all index Monthly variationl Accumulated variation Annual variation November 0.5 1.1 1.7 Main results The annual variation of the CPI
Mount Pleasant (42, 43) and Connecticut Avenue (L1, L2) Lines Service Evaluation Study Open House Welcome! wmata.com/bus
 and Connecticut Avenue (L1, L2) Lines Service Evaluation Study Open House Welcome! wmata.com/bus") Mount Pleasant (42, 43) and Connecticut Avenue (L1, L2) Lines Service Evaluation Study Open House Welcome! Study Overview and Timeline Phase 1: Collect and Analyze Data Project Kickoff, September 2017
Mount Pleasant (42, 43) and Connecticut Avenue (L1, L2) Lines Service Evaluation Study Open House Welcome! Study Overview and Timeline Phase 1: Collect and Analyze Data Project Kickoff, September 2017
ROUTE 122 CORRIDOR STUDY ---- Bedford County and Bedford City, Virginia
 ROUTE 122 CORRIDOR STUDY ---- Bedford County and Bedford City, Virginia Developed by Region 2000 Regional Commission In cooperation with Bedford County, Virginia City of Bedford, Virginia Virginia Department
Daily Estimation of Passenger Flow in Large and Complicated Urban Railway Network. Shuichi Myojo. Railway Technical Research Institute, Tokyo, Japan
 Daily Estimation of Passenger Flow in Large and Complicated Urban Railway Network Shuichi Myojo Abstract Railway Technical Research Institute, Tokyo, Japan Railway passenger flow data including the on-board
Regulations to deter cut-through traffic - Heath Street V\fest, between Spadina Road and Avenue Road. Toronto and East York Community Council
 TORONTO STAFF REPORT ACTION REQUIRED Regulations to deter cut-through traffic - Heath Street V\fest, between Spadina Road and Avenue Road Dnte: February 16,2009 To: From: Toronto and East York Community
STAFF REPORT. Airport Land Use Plan Consistency Review: Old Town Village Mixed Use Project City of Goleta. MEETING DATE: June 18, 2015 AGENDA ITEM: 5M
 STAFF REPORT SUBJECT: Airport Land Use Plan Consistency Review: Old Town Village Mixed Use Project City of Goleta MEETING DATE: AGENDA ITEM: 5M STAFF CONTACT: Peter Imhof, Andrew Orfila RECOMMENDATION:
ARRIVAL CHARACTERISTICS OF PASSENGERS INTENDING TO USE PUBLIC TRANSPORT
 ARRIVAL CHARACTERISTICS OF PASSENGERS INTENDING TO USE PUBLIC TRANSPORT Tiffany Lester, Darren Walton Opus International Consultants, Central Laboratories, Lower Hutt, New Zealand ABSTRACT A public transport
Paraguay: Wind and Hail Storm
 Paraguay: Wind and Hail Storm DREF operation n MDRPY004 20 August 2008 The International Federation s Disaster Relief Emergency Fund (DREF) is a source of un-earmarked money created by the Federation in
Summary. Air transport movements. Passengers. Freight. Other Airports. Infrastructure. Definitions. Traffic Review 2016
 2016 TRAFFIC REVIEW Foreword The 2016 Traffic Review provides an extensive overview of Amsterdam Airport Schiphol s key traffic and transport figures. For information about previous years, please visit
Airport Obstruction Standards
 Airport Obstruction Standards Dr. Antonio Trani Department of Civil and Environmental Engineering Virginia Tech Outline of this Presentation Obstructions to navigation around airports Discussion of Federal
PARAGUAY & IGUAZU FALLS TOUR In-Depth Tour of Paraguay & the Iguazu Falls ITINERARY
 PARAGUAY & IGUAZU FALLS TOUR In-Depth Tour of Paraguay & the Iguazu Falls 11 DAYS / 10 NIGHTS Untouched nature, rough gauchos, the old and new, historical and modern: this is Paraguay, one of the leastvisited
November 11, 2009 BY . Planning and Growth Management Department 110 Laurier Avenue West, 4 th Floor Ottawa, Ontario K1P 1J1. Dear Mr.
 November 11, 2009 Planning and Growth Management Department 110 Laurier Avenue West, 4 th Floor Ottawa, Ontario K1P 1J1 BY E-MAIL Attention: Mr. Don Herweyer Dear Mr. Herweyer: Reference: Abbott-Fernbank
FINAL TERMINAL TRAFFIC MONITORING STUDY
 FINAL TERMINAL 91 216 TRAFFIC MONITORING STUDY Prepared for: Port of Seattle February 15, 217 Prepared by: 12131 113 th Avenue NE, Suite 23 Kirkland, WA 9834-712 Phone: 425-821-3665 www.transpogroup.com
Section 3-04 Cross Sectional Elements TABLE OF CONTENTS. INTRODUCTION...3 General...3 Exhibit 1-Cross-Sectional Elements...3
 Section 3-04 Cross Sectional Elements TABLE OF CONTENTS INTRODUCTION...3 General...3 Exhibit 1-Cross-Sectional Elements...3 CROSS-SECTIONAL ELEMENTS...3 Traveled Way...3 Shoulder...3 Surfacing Taper...3
Visitor Use Computer Simulation Modeling to Address Transportation Planning and User Capacity Management in Yosemite Valley, Yosemite National Park
 Visitor Use Computer Simulation Modeling to Address Transportation Planning and User Capacity Management in Yosemite Valley, Yosemite National Park Final Report Steve Lawson Brett Kiser Karen Hockett Nathan
Project Deliverable 4.1.3d Individual City Report - City of La Verne
 Pomona Valley ITS Project Project Deliverable 4.1.3d Individual City Report - City of La Verne Prepared by: April 19, 2002 099017000.1 Copyright 2002, Kimley-Horn and Associates, Inc TABLE OF CONTENTS
2017/2018 Q3 Performance Measures Report. Revised March 22, 2018 Average Daily Boardings Comparison Chart, Page 11 Q3 Boardings figures revised
 2017/2018 Q3 Performance Measures Report Revised March 22, 2018 Average Daily Boardings Comparison Chart, Page 11 Q3 Boardings figures revised Contents Ridership & Revenue... 1 Historical Revenue & Ridership...
Arlington County Board Meeting Project Briefing. October 20, 2015
 Arlington County Board Meeting Project Briefing October 20, 2015 Project Map 2 Project Context Only Interstate in the Country limited to HOV only traffic during rush hours Stoplight at the end of I-66
Measures to Vitalize the Commerce of the Central Business District
 International Journal of Emerging Engineering Research and Technology Volume 4, Issue 10, October 2016, PP 28-33 ISSN 2349-4395 (Print) & ISSN 2349-4409 (Online) Measures to Vitalize the Commerce of the
ASUNCION, CHACO & IGUAZU FALLS PARAGUAY TOUR Trace of the German Immigrants
 ASUNCION, CHACO & IGUAZU FALLS PARAGUAY TOUR Trace of the German Immigrants 11 DAYS / 10 NIGHTS Southern German dialects in the middle of a tropical rain forest? In Paraguay it's the norm: since the 19th
LIFE IN METROPOLITAN AREAS IN THE 21 ST CENTURY
 Les Ateliers Internationaux de Maîtrise d Oeuvre Urbaine de Cergy-Pontoise 36 th International workshop of Urban Planning and Design LIFE IN METROPOLITAN AREAS IN THE 21 ST CENTURY QUESTIONS ABOUT THE
Chapter 14. Design of Flexible Airport Pavements AC 150/5320-6D
 Chapter 14 Design of Flexible Airport Pavements AC 150/5320-6D AIRCRAFT CONSIDERATIONS. a. Load. maximum anticipated takeoff weight of the aircraft. The design procedure assumes 95 percent of the gross
New 55-Dogpatch Outreach Findings & Route Development
 Executive Summary Based on outreach conducted through Spring of 2018, the SFMTA identified a set of three alternative routes and service plans for a new 55-Dogpatch route. These alternatives respond to
Submission to Infrastructure Victoria s Draft 30-Year Infrastructure Strategy
 Submission to Infrastructure Victoria s Draft 30-Year Infrastructure Strategy 1. Introduction This submission is a response to Infrastructure Victoria s assessment of the need to construct a heavy rail
September. ECHO Quito team MONTHLY REPORT
 EUROPEAN COMMISSION HUMANITARIAN AID OFFICE (ECHO) Monthly report number 2012/09 Month Country September South America (except Colombia for HA) Date of submission 04/10/12 Author ECHO Quito team 1. SUMMARY
Central Coast Origin-Destination Survey
 Central Coast Origin-Destination Survey July 2016 Central Coast Origin-Destination Survey Prepared for: Santa Barbara County Association of Governments San Luis Obispo Council of Governments Ventura County
Assessment of Travel Trends
 I - 2 0 E A S T T R A N S I T I N I T I A T I V E Assessment of Travel Trends Prepared for: Metropolitan Atlanta Rapid Transit Authority Prepared by: AECOM/JJG Joint Venture Atlanta, GA October 2011 General
Dallas Executive Airport
 648 DECLARED DISTANCE OPTION 1a DISPLACE 31 THRESHOLD BY 97 Considers RSA Limiting Factor No runway extensions 13 31 TORA 6,451 6,451 TODA 6,451 6,451 ASDA 5,958 6,451 LDA 5,958 6,354 Runway 17-35 (3,8
North-South Bypass Tunnel Traffic and Transport
 Technical Paper Brisbane City Council January 2005 Prepared for Brisbane City Council Prepared by Maunsell Australia Pty Ltd 12 Cribb Street PO Box 1823 Milton QLD 4064 Australia ABN 20 093 846 925 Tel
Construction Staging Adelaide Street West
 REPORT FOR ACTION Construction Staging Adelaide Street West Date: October 6, 2016 To: Toronto and East York Community Council From: Acting Director, Transportation Services, Toronto and East York District
Washington St. & Ash Coulee Dr./43 rd Ave Intersection Study
 430 IACC Building Fargo, ND 58105 Tel 701-231-8058 Fax 701-231-1945 www.ugpti.org www.atacenter.org Washington St. & Ash Coulee Dr./43 rd Ave Intersection Study Final Report April 2007 Prepared for: City
Technical Paper 1 Traffic report
 Technical Paper 1 Traffic report 1 Contents List of Tables... 3 List of Figures... 4 Preface... 6 Terminology... 7 1 Executive summary... 8 1.1 1.2 1.3 1.4 1.5 1.6 Background to this report... 8 Traffic
CENTRAL OREGON REGIONAL TRANSIT MASTER PLAN
 Central Oregon Regional Transit Master Plan Volume II: Surveys and Market Research CENTRAL OREGON REGIONAL TRANSIT MASTER PLAN Volume IV: Service Plan Appendices A-B July 213 Nelson\Nygaard Consulting
MARSHALL Subdivision. Township of Springwater, County of Simcoe. Traffic Brief for: Ontario Inc. Type of Document: Final Report
 MARSHALL Subdivision Township of Springwater, County of Simcoe Traffic Brief for: 489469 Ontario Inc. Type of Document: Final Report Project Number: JDE 1521 Date Submitted: October 19 th, 2016 10 / 19
ROUTE 20 CORRIDOR STUDY ---- Orange County, Virginia
 ROUTE 20 CORRIDOR STUDY ---- Orange County, Virginia Prepared by PARSONS Fairfax, Virginia on behalf of the: Rappahannock-Rapidan Regional Commission in cooperation with Orange County, Virginia Virginia
Imagine the result. Bus Rapid Transit Feasibility Study. Laredo Urban Transportation Study. August 31 st, 2011
 Imagine the result Laredo Urban Transportation Study August 31 st, 2011 Bus Rapid Transit Feasibility Study Prepared for: Laredo Urban Transportation Study Prepared by: ARCADIS U.S., Inc. 2410 Paces Ferry
Public Transit Services on NH 120 Claremont - Lebanon
 Public Transit Services on NH 120 Claremont - Lebanon Overview of Preferred Alternative April 12, 2011 Presentation Overview Study Goals Quick Review Methodology and Approach Key Findings Results of Public