Inventory of Existing Conditions
|
|
|
- May Eaton
- 6 years ago
- Views:
Transcription
1 CHAPTER A. Inventory of Existing Conditions INTRODUCTION. The layout/configuration of the Snohomish County Airport (Paine Field) runway and taxiway system has evolved over many years. In the early 1940 s when the U.S. Army Air Corps leased the airport, the airfield consisted of a 5,000 east/west main runway (now Taxiway E ), and three 5,200 secondary runways (the NW/SE runway is now Runway 12/30, the NE/SW is now Taxiways A-6 and K-6, and the N/S is now Runway 16R/34L). As was common for World War II Air Corps airports, the runways at Paine Field provided a complex intersecting layout at different angles to take advantage of the most favorable wind direction and, thus, avoid crosswinds to the maximum extent possible. Operationally, modern aircraft designs are more tolerant of crosswinds ; and, therefore current design guidelines for the layout of an airport s runway system have been simplified as they evolved (i.e., modern airports most often exhibit a layout of runways with no more than one crosswind runway orientation). This can be noted at Paine Field today, with its current runway system that is structured around a set of N/S parallel runways [Runway 16R/34L (the main runway) and Runway 16L/34R (the secondary parallel runway)] and a NW/SE crosswind runway (Runway 12/30 1 ). One legacy feature of the airport s historic airfield layout that is still in existence is a complex intersection of taxiways and runways that form a nine (9) point star-pattern of pavements, composed of Runway 12/30, Taxiway A (the parallel taxiway serving Runway 16R/34L), Taxiways D-1, A-5 and A-6 (historically the NE/SW runway), Taxilane H, and the Outer Ramp taxilane. This star-pattern intersection has been identified by FAA s Runway Safety Action Team (RSAT) and Certification Inspectors as a high energy intersection hot spot (Hot Spot 1 Previously identified as Runway 11/29, the crosswind runway was re-designated in 2013 due to update of magnetic declination. A.1
2 #1) that has an increased potential for runway incursions. A second intersection hot spot (Hot Spot #2), which is located adjacent to the Runway 30 threshold, is caused by the expanse of apron area in this location. Due to complexity, the focus of this study will be on the Hot Spot #1 Intersection. It is recognized that the intersecting runway and taxiway pavements at these two hot spots are difficult to light, sign, and mark, which can cause confusion to pilots navigating these areas of the airfield. The purpose of this planning study is to identify potential reconfiguration recommendations for these intersection hot spots, with the goal of providing increased safety and operational enhancements. The planning process includes a close working liaison with Paine Field Airport Staff, the Federal Aviation Administration (FAA), and airport users to make certain that the plan truly accomplishes the specified airfield safety enhancement objectives while achieving the operational goals of the Airport. At the conclusion of this study, this planning process and recommendations are documented with an update of the Airport Layout Plan (ALP) drawing, including selected sheets from the ALP Drawing Set, and the preparation of a supplemental report. These deliverables will be reviewed by the various FAA lines-of-business, and recommendations will be made for the ultimate approval of the selected airfield pavement safety enhancement proposal. This initial Inventory of Existing Conditions chapter provides an update of the Airport s existing airfield facilities (i.e., runways and taxiways) and associated design guidelines, includes an airport operational analysis of the aircraft fleet mix with confirmation of the Design Aircraft for each runway and taxiway, and presents an update of the Airport s wind and weather analysis. The following Airfield Facility Requirements chapter presents a detailed analysis of the existing design standards for each runway/taxiway system, as well as a runway length analysis and runway visibility zone evaluation for Runway 12/30. As illustrated in the following figure, entitled AIRPORT LOCATION MAP the Airport is located approximately six (6) miles southwest of the Everett Central Business District and approximately A.2
3 Intersection Study Washington State Ferry POSSESSION SOUND Burlington Northern Railroad Colby Avenue EVERETT Island County Snohomish County 525 MUKILTEO Park Speedway Sp Mukilteo Mukilteo Boulevard aine Field Blvd 526 Seaway Boulevard Kasch Park 100 Street SW 5 Avenue W Upper Ridge Road West Casino Road Park Walter E. Hall Golf Course Glenwood Avenue Merrill Creek Parkway Hardeson Road Madison Street 99 Dogwood Road Evergreen Way Boeing Freeway Everett Mall Way Everett Golf & Country Club 5 Lowell Road Broadway Park 112 Street SW Park Harbour Point Golf Course Mukilteo City Limits Harbour Point Blvd Airport Road Gibson Road Center Road 4 Avenue W 128th Street SW Picnic Point County Park Picnic Point Road Beverly Park Road 99 Cascadian Way Park Meadowdale County Park 52 Avenue West 148 Street SW Shelby Road 35 Avenue W 525 Ash Way Meadow Road Mill Creek Golf Course MILL CREEK Park 168 Street SW LYNNWOOD 164 Street SW Figure A1 Airport Location Map 1 = 6,000 Source: Snohomish County Planning Department Mapping and United States Geological Survey (USGS) Quadrangle Sheets. Snohomish CountyAirport PaineField A.3
4 twenty-three (23) miles north of downtown Seattle. I-5 is located approximately two (2) miles southeast of the Airport and provides direct access to downtown Seattle. Airport Role and Facilities Operationally, Paine Field is unique as a general aviation reliever airport to Seattle Tacoma International Airport. The Airport accommodates over 658 based aircraft, ranging in size from small single-engine planes to large business jets, and includes manufacturing facilities for Boeing 747, 767, 777, and 787 aircraft. The Airport is also home to Aviation Technical Services (ATS), the largest third-party aircraft inspection and repair facility in North America, serving airlines such as Alaska, Delta, Southwest, and UPS, including business jets. Therefore, the airfield facilities at Paine Field accommodate an extremely wide variety of aircraft types that have very different operational and performance requirements. Airside Facilities Paine Field is operated with three (3) runways. The primary and secondary parallel runways are oriented in a general north-south direction, and supported by a system of parallel and connecting taxiways. The crosswind runway is oriented in a general northwest-southeast direction, and also has a parallel taxiway system and supporting taxiway connectors. Figure A2, entitled EXISTING AIRPORT LAYOUT, provides a graphic presentation of the existing airport facilities, with more detailed airport information being provided for reference on the 2007 Airport Layout Plan Drawing presented in Appendix One of this document. Additional airport information includes: Airport Reference Point: Latitude N and Longitude W FAA Site Number: A Airport Elevation: feet above mean sea level (AMSL) Acreage: 1250 acres Mean Normal Temperature of hottest month: 73 F (July). A.4
5 Runways & Taxiways Runway 16R/34L. Runway 16R/34L, the Airport s primary runway is 9,010 feet in length and 150 feet in width. The runway is constructed of asphalt that is grooved, and has gross weight bearing capacities of 100,000 pounds single wheel, 280,000 pounds dual wheel, 480,000 pounds dual tandem wheel, 840,000 pounds dual tridem wheel, and 830,000 pounds double dual tandem wheel main landing gear configuration, with a Pavement Condition Number (PCN) of 83/F/A/W/T. In addition, the runway offers eight (8) public-use instrument approach procedures (IAPs), with ceiling/visibility minimums ranging from 300 /¾-miles to 100 /1,600 RVR. The runway is equipped with High Intensity Runway Lights (HIRLs), in-pavement centerline lights, and four-light Precision Approach Path Indicators (PAPIs) on each runway end. Additionally, Runway 16R has a 2,400-foot Medium Intensity Approach Lighting System with Runway Alignment Indicator Lights (MALSR), while Runway 34L is equipped with a 1,400-foot Medium Intensity Approach Lighting System with Sequenced Flashers (MALSF). Runway 16R has precision instrument runway markings and provides right hand traffic patterns, while Runway 34L has non-precision instrument runway markings and specifies standard left hand traffic patterns, except at night when the small aircraft are directed to fly an east pattern on Runway 16R or 34L. Runway 16R/34L Taxiway System. Taxiway A is the primary parallel taxiway serving the east side of Runway 16R/34L. This taxiway, which is constructed of asphalt, is 75 feet in width and provided with fourteen (14) connector/exit taxiways that are designed to varying standards and dimensions 2. As noted previously, the intersection of two (2) of these taxiways (i.e., Taxiways A-5 and A-6 ), with Taxiway A and the west end of Runway 12/30 is the location of Hot Spot #1 Intersection that is the focus of this planning study. A brief summary description of the features associated with this taxiway system is presented in the following table. 2 A modification-to-standards for the centerline separation and width of Taxiway A to accommodate operations by the Boeing was approved by the FAA in January, A.5
6 Table A1 RUNWAY 16R/34L TAXIWAY SYSTEM Lighting/ Taxiway Type Location Width Condition Signage Taxiway A Parallel East Side 75 Excellent Yes/Yes Taxiway AA Connector/Exit East Side 100 Good Yes/Yes Taxiway A1 Connector/Exit East Side 125 Excellent Yes/Yes Taxiway A2 Connector/Exit East Side 50 Good Yes/Yes Taxiway A3 Connector/Exit East Side 140 Excellent Yes/Yes Taxiway A4 Connector/Exit East Side 50 Good Yes/Yes Taxiway A5 Connector/Exit East Side 75 Good Yes/Yes Taxiway A6 Connector/Exit East Side 125 Good Yes/Yes Taxiway A7 Connector/Exit East Side 120 Excellent Yes/Yes Taxiway A8 Connector/Exit East Side 75 Excellent Yes/Yes Taxiway A9 Connector/Exit East Side 135 Excellent Yes/Yes Taxiway A10 Connector/Exit East Side 135 Excellent Yes/Yes Taxiway K1 Connector/Exit West Side 75 Excellent Yes/Yes Taxiway K6 Connector/Exit West Side 75 Poor No/No Taxiway K7 Connector/Exit West Side 50 Excellent Yes/Yes Source: December 2007 Airport Layout Plan, Airport Staff, and WSDOT Airport Facilities and Services Report. Runway 16L/34R. Runway 16L/34R, the Airport s secondary parallel runway, is 3,004 feet in length and 75 feet in width. In 2013, the runway was reconstructed of asphalt and has a gross weight bearing capacities of 12,500 pounds for the single-wheel landing gear configuration. This runway provides only visual approach capabilities, but is equipped with Medium Intensity Runway Lights (MIRLs), as well as two-light PAPIs and Runway End Identifier Lights (REILs) on each runway end. Runway 16L/34R has basic visual runway markings, while Runway 34R provides right hand traffic patterns, while Runway 16L specifies standard left hand traffic patterns. Runway 16L/34R Taxiway System. There are two (2) parallel taxiways that serve Runway 16L/34R. Taxiway F, which serves the east side of the runway, is constructed of asphalt and is 40 feet in width, except the south 800 feet that is 35 feet wide. This taxiway is provided with A.6
7 four (4) connector/exit taxiways that are designed to varying standards and dimensions. Taxiway G, which serves the west side of the runway, is constructed of asphalt and is 40 feet in width. This taxiway is provided with five (5) connector/exit taxiways that are designed to varying standards and dimensions. A brief summary description of the features associated with this taxiway system is presented in the following table. Table A2 RUNWAY 16L/34R TAXIWAY SYSTEM Lighting/ Taxiway Type Location Width Condition Signage Taxiway F Parallel East Side 35 Fair Yes/No Taxiway F1 Connector/Exit East Side 70 Excellent Yes/Yes Taxiway F2 Connector/Exit East Side 40 Excellent Yes/Yes Taxiway F3 Connector/Exit East Side 40 Excellent Yes/Yes Taxiway F5 Connector/Exit East Side 55 Excellent Yes/Yes Taxiway G Parallel West Side 35 Fair Yes/Yes Taxiway G1 Connector/Exit West Side 40 Excellent Yes/Yes Taxiway G2 Connector/Exit West Side 35 Excellent Yes/Yes Taxiway G3 Connector/Exit West Side 40 Excellent Yes/Yes Taxiway G4 Connector/Exit West Side 35 Excellent Yes/Yes Taxiway G5 Connector/Exit West Side 35 Excellent Yes/Yes Source: December 2007 Airport Layout Plan, Airport Staff, and WSDOT Airport Facilities and Services Report. A.7

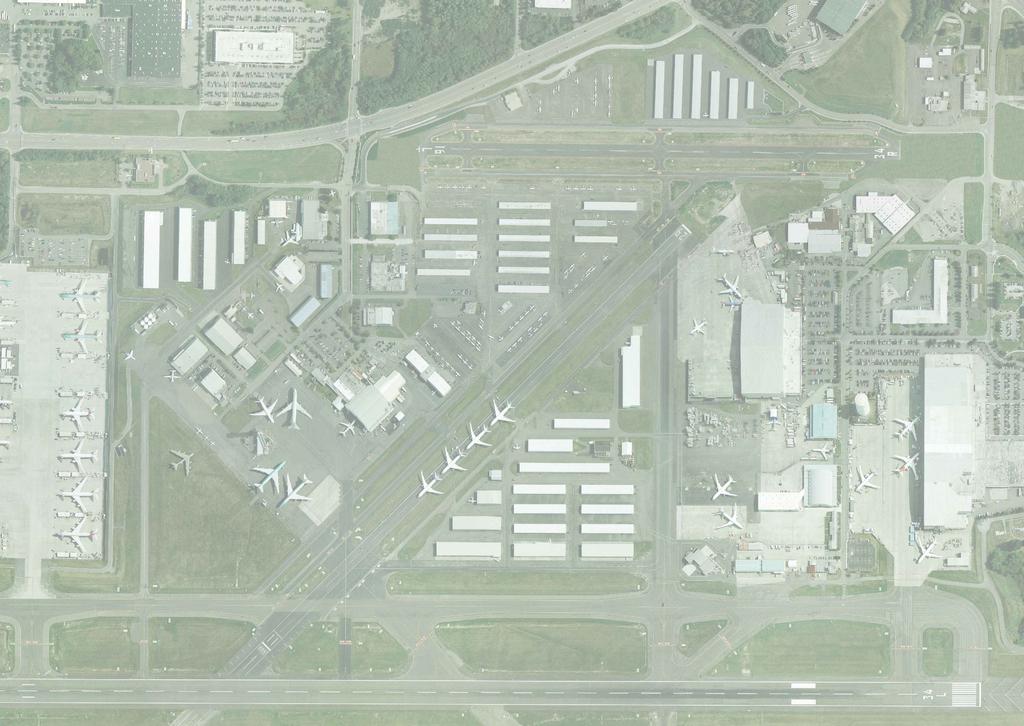
8 Intersection Study Figure A2 Existing Airport Layout Source: Previously Prepared Airport Layout Plan, Barnard Dunkelberg & Company, August 2007 and Revised March PaineField Snohomish CountyAirport A.8 Existing Visual Approach Runway Protection Zone Runway 16R/34L 150 x 9,010 Existing Visual Approach Runway Protection Zone Existing Visual Approach Runway Protection Zone Boeing Freeway (526) B C D H F E Mukilteo Speedway (525) Airport Road Existing Airport Boundary BOMARC Business Park 100th Street SW The Boeing Company Existing Airport Boundary Paine Field Boulevard Existing Precision Approach Runway Protection Zone Runway 16L/34R 75 x 3,000 Runway 12/30 75 x 4,504 Existing Non-Precision Approach Runway Protection Zone Existing Runway Protection Zone The Boeing Company East Ramp North Ramp Existing Terminal Building Central Ramp Back Ramp West Ramp Inner Ramp Outer Ramp South Ramp Ramp A A A A-A A-1 A-2 A-3 A-4 A-5 A-6 A-7 A-8 A-9 K-6 G Beverly Park Road Commando Road K-7 A-10 Bernie Webber Drive 1 = 1,500 Roadway Woodton Baker Corp ERC ARFF Hilton Garden Inn FOF ARTS
9 Runway 12/30. Runway 12/30, the Airport s crosswind runway, is 4,504 feet in length and 75 feet in width. In addition, the west end of the runway (the Runway 12 end) has an existing displaced landing threshold of 799 feet. The runway is constructed of asphalt and has a gross weight bearing capacities of 15,000 pounds for single-wheel and 30,000 pounds for dual-wheel main landing gear configuration. This runway provides only visual approach capabilities, but is equipped with MIRLs and two-light Visual Approach Slope Indicators (VASIs) on each runway end. Runway 12/30 has basic runway markings, while both Runway 12 and Runway 30 provide standard left hand traffic patterns. Runway 12/30 Taxiway System. There are three (3) parallel taxiways that serve Runway 12/30. Taxiway C, which serves the north side of the runway from Taxiway A to Taxiway D-3, is constructed of asphalt and is 35 feet in width. Taxiway D, which also serves the north side of the runway, is constructed of asphalt and is 35 feet in width. This taxiway is provided with five (5) connector/exit taxiways that are designed to varying standards and dimensions. Taxiway W, which serves the south side of the runway, is constructed of asphalt and is 25 feet in width. This taxiway is provided with one exit taxiway. The western end of Taxiway W intersects with Taxilane H at the location of Hot Spot #1. The eastern end of Taxiway W intersects with Taxiway E at the location of Hot Spot #2. A brief summary description of the features associated with this taxiway system is presented in the following table. A.9
10 Table A3 RUNWAY 12/30 TAXIWAY SYSTEM Lighting/ Taxiway Type Location Width Condition Signage Taxiway C Parallel North Side 40 Good 1 Yes/Yes Taxiway D Parallel North Side 40 Good 1 Yes/Yes Taxiway D1 Connector/Exit North Side 75 Good Yes/Yes Taxiway D2 Connector/Exit North Side 50 Good Yes/Yes Taxiway D3 Connector/Exit North Side 40 Good Yes/Yes Taxiway D4 Connector/Exit North Side 35 Good Yes/Yes Taxiway D5 Connector/Exit North Side 185 Good Yes/Yes Taxiway W Parallel South Side 25 Good Yes/Yes Taxiway W3 Connector/Exit South Side 40 Good Yes/Yes Taxiway E Connector/Exit South Side 75 Good No/Yes Taxilane H Connector/Exit South Side 75 Poor No/Yes Taxiway A-5 Connector/Exit South Side 75 Good Yes/Yes Taxiway A-6 Connector/Exit South Side 75 Good Yes/Yes Outer Ramp Taxilane Connector/Exit North Side 75 Fair Yes/Yes Source: December 2007 Airport Layout Plan, Airport Staff, and WSDOT Airport Facilities and Services Report. 1 Rehab needed between Taxiways D2 and D3 and between D4 and D5. As noted previously, the focus of this planning effort will be on Hot Spot #1- the intersection of runway and taxiway pavements, composed of Runway 12/30, Taxiway A (the parallel taxiway serving Runway 16R/34L), and Taxiways A-6 and K-6 (historically the NE/SW runway), but also include safety enhancements for Hot Spot #2 the intersection of runway and taxiway pavements, composed of Runway 12/30, Taxiway E and Taxiway D-5. A detailed view of this complex intersection of pavements is presented on the following illustration, entitled EXISTING RUNWAY/TAXIWAY INTERSECTION DETAIL. Additional information on these High Alert Hot Spot intersections is presented in the Paine Field High Alert Areas Runway Safety Information brochure and the FAA s current Runway Safety Hot Spots List, which are included for reference in Appendix Two of this document. A.10

11
12 Airport Design Guidelines The planning and development of airports is heavily predicated on complying with the FAA design standards of Advisory Circular (AC) 150/ A, Airport Design. Because the FAA is responsible for overall safety of civil aviation, their design standards are largely safety driven. However, the FAA has other mandates related to efficiency and other goals that are also reflected in their standards and policy decisions, and thus the design standards incorporated into this focused planning effort are not fixed and will continue to evolve. Therefore, the purpose of this section is to summarize the primary planning concepts contained in the AC that will be analyzed in subsequent sections. Design Aircraft FAA design standards apply a coding system that relates the physical and operating characteristics of aircraft to the geometric design and safety setback distances of the airside facility being planned. The design aircraft is the most demanding aircraft operating or forecast to operate at that facility on a regular basis. FAA guidance defines a substantial use threshold on federally funded projects for the design aircraft to have at least 500 annual itinerant operations by a specific aircraft model or composite of several different aircraft to determine the representative Runway Design Code. For example demanding aircraft characteristics used for facility planning include the following: aircraft approach speed aircraft wingspan aircraft tail height aircraft main gear width aircraft cockpit to main gear length aircraft weight aircraft takeoff and/or landing distances A.12
13 Airside facilities predicated on the selection of a design aircraft include: runways, taxiways, taxilanes, aprons, etc. Runway Design Code (RDC) The RDC is defined by a three-component code signifying the design standards that applies to a specific runway. The first component, depicted by a letter (A-E) is the Aircraft Approach Category (AAC) and relates to aircraft approach speed of the design aircraft. The second component, Airplane Design Group (ADG), depicted by a Roman numeral (I-VI) relates to the most restrictive wingspan/tail height of the design aircraft. The third component relates to the runway s visibility minimums as expressed in Runway Visual Range (RVR) equipment measurements. RVR-derived values represent the approximate visibility expressed in feet of forward visibility that have statute mile equivalents (e.g., 2400 RVR = ½-mile). The FAA s specified RDC classifications are summarized in the following table, entitled RUNWAY DESIGN CODE SYSTEM. Table A4 RUNWAY DESIGN CODE SYSTEM Aircraft Approach Category (AAC) Category A B C D E Approach Speed Approach Speed less than 91 knots Approach speed 91 knots or more but less than 121 knots Approach speed 121 knots or more but less than 141 knots Approach speed 141 knots or more but less than 166 knots Approach speed 166 knots or more Airplane Design Group (ADG) Group # Tail height (ft) Wingspan (ft) I < 20 < 49 II 20 - < < 79 III 30 - < < 118 IV 45 - < < 171 V 60 - < < 214 IV 66 - < < 262 A.13
14 Approach Visibility Minimums RVR (ft) 1 Flight Visibility Category (statue mile) 4000 Lower than 1 mile but not lower than ¾ mile (APV ¾ but< 1 mile 2400 Lower than ¾ mile but not lower than ½ mile (CAT-I PA) 1600 Lower than ½ mile but not lower than ¼ mile (CAT-II PA) 1200 Lower than ¼ mile (CAT-III PA) 1. RVR- Runway Visual Range. The approximate visibility (in feet) as measured by the RVR light transmission/reception equipment or equivalent weather observer report. Taxiway Design Group (TDG) Separation between runways, taxiways, taxilanes, and objects is related to the airplane physical characteristics as defined by the ADG: wingspan and tail height. The TDG is based upon the dimensions of the aircraft undercarriage to determine taxiway width and pavement fillet to be provided at taxiway intersections. Fillet pavement is required to accommodate the inner wheel of the airplane as it turns from one taxiway to the next using cockpit over centerline steering (plus a safety margin). There are seven (1-7) TDG classifications that represent a function of main gear width and wheel base (distance from nose gear to main gear), with TDG-7 requiring the widest amount of pavement. These classifications are detailed in the following figure, entitled TAXIWAY DESIGN GROUP DESIGNATION. A.14

15 Figure A4 Taxiway Design Group Designation Source: FAA Advisory Circular 150/ A, Airport Design (September 2012) Design Aircraft Confirmation The first step in airside facility planning is the selection of a design aircraft that should be assigned to a specific runway/taxiway pavement design. As noted previously, the RDC is classified by three parameters: the Aircraft Approach Category (AAC), the Airplane Design Group (ADG), and the runway s visibility minimums. Airports with more than one runway, such as Paine Field, may have one RDC applied to one runway and a separate RDC applied to another. In addition, the design guidelines associated with airplane physical characteristics, as defined by the ADG, are now further characterized by TDG, which is utilized to specify taxiway widths and pavement fillet designs. This is particularly important in the design evaluation of connector/access taxiways that serve individual areas on an airport (e.g., taxiways that serve large aircraft vs. small aircraft exclusively would have very different ADG and TDG requirements). A.15
16 Aircraft Operational Analysis To assist in the design aircraft confirmation for each runway at Paine Field, an operational analysis of the current aircraft fleet was prepared using baseline and forecast operations data from the September, 2012 Paine Field Environmental Assessment (2012 EA), entitled Amendment to the Operations Specifications for Air Carrier Operations, Amendment to a FAR Part 139 Certificate, Modification of the Terminal Building. The following table, entitled EXISTING & FUTURE AIRCRAFT FLEET MIX, , presents the existing and projected airport operations that were quantified by aircraft type and general category, as well as by AAC, ADG, and TDG. This data, which was originally compiled for the noise analysis element in the 2012 EA, also reflects the decline in overall operations that have occurred at the Airport in recent years. When compared with current projected TAF total operations at Paine Field for 2013 at 114,894, the projected 2013 operations in the 2012 EA at 117,035 are within 1.86% of the TAF total and determined to be appropriate for analysis in this planning study. Table A5 EXISTING & FUTURE AIRCRAFT FLEET MIX, Aircraft AAC ADG TDG Operations by Year SE Prop 119,696 89,751 91, SE (Fixed Prop) A I 1 95,282 71,550 72, SE (Vari. Prop) A I 1 24,099 17,999 18,466 Cessna 206 B I ME Prop 13,990 10,509 10,544 Beechcraft Barron 58 B I 1 9,874 7,445 7,445 Cessna 441 Conquest B II 1 2,790 2,050 2,085 Beech 1900 B II DHC6 Twin Otter A II 2 1, DHC8 Dash 8 B III A.16
17 Large Jet 3,191 5,693 5,693 Boeing 707 C V Boeing 727 C III Boeing 727 C III Boeing C III Boeing C III Boeing C III Boeing C III Boeing D III Boeing C III Boeing C III Boeing 747 D V Boeing D V Boeing 757PW C IV Boeing 757RR C IV Boeing D IV Boeing D IV Boeing D IV Boeing LR C V Boeing ER D V Airbus C V DC9-50 C III Fokker 100 C III Commercial Passenger Service 0 4,588 8,340 CRJ-900 ER C III DHC8 Dash 8-Q400 B III 3 0 4,336 7,227 MD83 C III ,040 Cessna Citation V B II Corporate Jet 4,949 3,703 3,703 Citation 650 B II Citation 650 CL600 C II Cessna Citation B I 2 1, Citation X C II Falcon 20 B II Gulfstream II D II Gulfstream IV D II Gulfstream V D III Lear 25 C I Lear 35 D I ,040 Beechjet 400 C I A.17
18 Military (Fixed Wing) 314 1,448 1,448 General Heli (MIL & Civilian) 1,580 1,343 1,343 General 1,580 1,343 1,343 Total 143, , ,129 Source: Appendix D Noise Analysis/Paine Field Environmental Assessment, September, 2012 and Mead & Hunt, Inc. 1 The Boeing was approved for use as a substitution aircraft for the Boeing in the modeling of noise contours for the EA. Therefore, the Boeing operation counts also include operations conducted by the Boeing and the Boeing Large Cargo Freighter (aka Dreamlifter). 2 The Airbus 330 was approved for use as a substitution aircraft for the Boeing 787 Dreamliner in the modeling of noise contours for the EA. Therefore, the Airbus 330 operation counts are actually conducted by the Boeing 787 Dreamliner. As can be noted from the table above, the most demanding aircraft in terms of airplane physical characteristics (ADG and TDG) that were identified to regularly operate at the Airport were the Boeing and the Boeing ; however, the Boeing operational counts also include operations by the Boeing and the Boeing Large Cargo Freighter (aka Dreamlifter). Combined, these three aircraft generated over 1,300 annual operations in 2008, with operations projected to exceed 2,000 annually during the 5 and 10-year planning period. It should also be noted that the existing Paine Field Airport Layout Plan (ALP) identifies the Boeing as the Design Aircraft for the primary runway (i.e., Runway 16R/34L), but in January 2010, the FAA approved a modification-to-standards for the taxiway centerline separation and width of Taxiway A to accommodate operations by the Boeing aircraft, which is classified in ADG-VI. In addition, the following table, entitled OPERATION TOTALS BY ACC D, ADG-V, and TDG 6 AIRCRAFT ( ), combines the annual aircraft operations at Paine Field into the three design components: Aircraft Approach Category (ACC), Airplane Design Group (ADG), and Taxiway Design Group (TDG). This operations data provides further support that Paine Field is correctly designated as a AAC D, ADG V, and TDG 6 airport. A.18
19 Table A6 OPERATIONS TOTALS BY ACC D, ADG V, AND TDG 6 AIRCRAFT ( ) Operations Design Component AAC D 3,506 4,413 4,741 ADG V & VI 1 1,609 3,015 3,015 TDG 6 1,603 3,007 3,007 Total 6,718 10,435 10,763 Source: Appendix D Noise Analysis/Paine Field Environmental Assessment, September, 2012 and Mead & Hunt, Inc. 1 The ADG VI operations are represented by the Boeing aircraft for which the Airport received a MOS and the Large Cargo Freighter (aka Dreamlifter). Design Aircraft Selection Based upon the operations data presented in the previous section, a combination of the Boeing and the Boeing have been identified as the composite design aircraft for Runway 16R/34L, while the Beechcraft Baron 58 was selected as the design aircraft for Runway 16L/34R and Runway 12/30. Subsequent to preparation of the Intersection Study reconfiguration alternatives and selection of the conceptual development plan, the design aircraft for Runway 12/30 was updated to the Cessna 206. In addition, the Airport s existing noise abatement procedures allow itinerant arrivals on Runway 30 and itinerant departures on Runway 12 of aircraft over 250 horsepower. The design aircraft specifications for each of these facilities are summarized in the following table, entitled DESIGN AIRCRAFT CHARACTERISTICS. A.19
20 Table A7 DESIGN AIRCRAFT CHARACTERISTICS Design Characteristics Runway 16R/34L Runway 16L/34R & Runway 12/30 1 Design Aircraft Boeing /Boeing ER Beechcraft Baron 58 Airplane Approach Category (AAC) D B Airplane Design Group (ADG) V I (Small Aircraft Only) Taxiway Design Group (TDG) 6 1 Approach Speed (NM/HR) 157/ Wingspan (FT) 212.9/ Tail Height (FT) 64.0/ Length (FT) 232.0/ Cockpit to Main Gear Length (FT) 91.5/ (est.) Wheel Base (FT) 84.0/ (est.) Main Gear Width (outer edge- FT) 41.3/ (est.) Gear Configuration 2D/2D2/3D S Maximum Takeoff Weight (LBS) 875,000/766,800 6,200 Source: Appendix 1 AC 150/ A and aircraft manufacturer websites. Bold text identifies the most critical design aircraft features. 1 The design aircraft for Runway 12/30 was updated to the Cessna 206 during the preparation of Airport Layout Plan. Figure A5 Runway 16R/34L Design Aircraft Comparison A.20
21 Figure A6 Runway 16L/34R Design Aircraft Figure A7 Runway 12/30 Design Aircraft Wind & Weather Analysis Surface wind conditions have a direct effect on airport functionality. Runways that are not oriented to take the fullest advantage of prevailing winds will restrict the capacity of the airport to varying degrees. When landing and taking off, aircraft are able to operate on a runway properly and safely as long as the wind velocity perpendicular to the direction of flight (defined as a crosswind) is not excessive. The wind coverage analysis translates the crosswind velocity and A.21

22 direction into a crosswind component. Smaller aircraft are more easily affected by crosswinds than larger aircraft, so therefore, they have a smaller crosswind component. The determination of the appropriate crosswind component is dependent upon the RDC, which as described in the previous section, is D-V for Runway 16R/34L and B-I/Small Aircraft Only for Runways 16L/34R and 12/30. According to AC 150/ , Airport Design, the maximum crosswind component used for ARCs A-I and B-I is 10.5-knot, a 13-knot maximum crosswind component is used for ARCs A-II and B-II, a 16-knot maximum crosswind component is used for RDCs A-III, B-III, C-I through D-III, and D-I through D-III, and for RDCs A-IV, B-IV, C-IV through C-VI, and D-IV through D-VI, a 20-knot maximum crosswind component is used. All Weather Wind Conditions Accurate and timely wind velocity and directional data during all weather conditions were obtained from the National Oceanic and Atmospheric Administration (NOAA) National Climatic Data Center (NCDC), which compiled the data from the Automated Surface Observing System (ASOS) located on the Airport. Using this data, an all weather wind rose was constructed and is presented in the following illustration entitled ALL WEATHER WIND ROSE. Figure A8 ALL WEATHER WIND ROSE Source: National Oceanic and Atmospheric Administration, National Climatic Data Center. Station 72793, Paine Field, Snohomish County/Everett, Washington (Period of Record: ). The desirable wind coverage for an airport is 95%, which means that the runway system should be oriented so that the maximum crosswind component is not exceed more than 5% of the time A.22
23 annually. Based on the all weather wind analysis for Paine Field, the existing runway system provides approximately % wind coverage for the 20-knot crosswind component, % wind coverage for the 16-knot crosswind component, 99.96% for the 13-knot crosswind component, and 99.84% for the 10.5-knot crosswind component. In addition, the parallel runways (i.e., Runways 16R/34L & 16L/34R), without consideration of the crosswind runway, satisfy the 95% wind coverage requirement even for the 10.5-knot crosswind component at the Airport at 98.43%. The following table, entitled ALL WEATHER WIND COVERAGE ANALYSIS, quantifies the wind coverage provided by the individual runways and the combined runway ends during all weather conditions at the Airport. Table A8 ALL WEATHER WIND COVERAGE ANALYSIS 1 Runway 10.5-Knot 13-Knot 16-Knot 20-Knot Runways 16R/34L & 16L/34R 98.43% 99.50% 99.96% % Runway 16R & 16L 84.36% 85.39% 85.84% 85.87% Runway 34L & 34R 67.33% 67.55% 67.72% 67.73% Runway 12/ % Runway % Runway % Combined 99.84% Source: Mead & Hunt, Inc. analysis using the FAA software available on the FAA Airport Surveying-GIS Program website. 1 Wind data acquired from the National Oceanic and Atmospheric Administration, National Climatic Data Center. Station 72793, Paine Field, Snohomish County/Everett, Washington (Period of Record: ). It is important to note that a five-knot tailwind component was used for the individual runway end analysis. It should also be noted that the determination of the FAA funding eligibility requirements of the crosswind runway are derived from the all weather wind coverage data presented above. Because Runways 16R/34L & 16L/34R alone satisfy the 95% wind coverage requirement for the Airport, the crosswind runway (i.e., Runway 12/30) is not eligible for FAA Airport Improvement Program (AIP) project funding participation; however, this runway has received some AIP funding on past projects. A.23
 currently is equipped with eight (8) public-use IAPs, one of which provides visibility and ceiling minimums as low as")
24 IFR Weather Wind Conditions As stated previously, the Airport (i.e., Runway 16R/34L) currently is equipped with eight (8) public-use IAPs, one of which provides visibility and ceiling minimums as low as 1,600 feet RVR and 100 feet above ground level (AGL) to Runway 16R. In an effort to examine how these procedures impact the utilization of Paine Field s runway system, an Instrument Flight Rules (IFR) wind rose has been constructed and is presented in the following illustration entitled IFR WIND ROSE. Again, wind data from the ASOS has been used for the construction of the wind rose and wind coverage analysis. The following table, entitled IFR WEATHER WIND COVERAGE ANALYSIS, presents the wind coverage analysis provided during IFR meteorological conditions (i.e., weather conditions having a ceiling less than 1,000 feet, but equal to or greater than 200 feet and/or visibility is less than three miles, but equal to or greater than ½-mile). The table quantifies the wind coverage provided by the individual runway ends and the combined runway system. Figure A9 IFR WIND ROSE Source: National Oceanic and Atmospheric Administration, National Climatic Data Center. Station 72793, Paine Field, Snohomish County/Everett, Washington (Period of Record: ). From this analysis, it can be concluded that Runway 16R provides the best single runway end wind coverage for all crosswind components during IFR weather conditions. Runways 16L/34R and 12/30 offer only visual approaches and thus provide no IFR operational capability. A.24
25 Table A9 IFR ) WEATHER WIND COVERAGE ANALYSIS Runway 10.5-Knot 13-Knot 16-Knot 20-Knot Runways 16R/34L & 16L/34R 98.56% 99.58% 99.96% % Runway 16R & 16L 88.72% 89.70% 90.07% 90.11% Runway 34L & 34R 54.21% 54.39% 54.50% 54.50% Runway 12/ Runway Runway Combined 98.56% 99.58% 99.96% % Source: Mead & Hunt, Inc. analysis using the FAA software available on the FAA Airport Surveying-GIS Program website. Wind data acquired from the National Oceanic and Atmospheric Administration, National Climatic Data Center. Station 72793, Paine Field, Snohomish County/Everett, Washington (Period of Record: ). 1 Ceiling less than 1,000 feet, but equal to or greater than 200 feet and/or visibility less than three miles, but equal to or greater than ½-mile. It is important to note that a five-knot tailwind component was used for the individual runway end analysis. Ceiling and Visibility FAA AC 150/5060-5, Airport Capacity and Delay, describes three categories of ceiling and visibility minimums for use in both capacity and delay calculations. Visual Flight Rules (VFR) conditions occur whenever ceiling levels are at least 1,000 feet AGL and visibility minimums are at least three statute miles. IFR conditions occur whenever reported ceilings are at least 500 feet AGL, but less than 1,000 feet AGL and/or visibility minimums are at least one statute mile, but less than three statute miles. Poor Visibility and Ceiling (PVC) conditions exist whenever reported ceilings are less than 500 feet AGL and/or the visibility minimums are less than one statute mile. However, meteorological data obtained for Paine Field from the NCDC for this study, have been categorized in terms that are specific to weather conditions under which Paine Field operates. Table A10 presents the percentage of time these specific conditions occur. A.25
26 Table A10 METEOROLOGICAL CONDITIONS Ceiling and Visibility Conditions VFR (ceiling equal to or greater than 1,000 feet AGL and visibility equal to or greater than 3 statute miles) VFR minimums to existing Runway 16R CAT II ILS (Special) approach minimums: Ceiling less than 1,000 feet AGL and/or visibility minimums less than three statute miles, but ceiling equal to or greater than 100 feet AGL and visibility minimums equal to or greater than 1,600 feet RVR. VFR minimums to existing Runway 16R CAT I ILS or GPS (RNAV) approach minimums: Ceiling less than 1,000 feet AGL and/or visibility minimums less than three statute miles, but ceiling equal to or greater than 200 feet AGL and visibility minimums equal to or greater than ½-statute mile.. VFR minimums to existing Runway 34L GPS (RNAV) approach minimums: Ceiling less than 1,000 feet AGL and/or visibility minimums less than three statute miles, but ceiling equal to or greater than 300 feet AGL and visibility minimums equal to or greater than ¾-statute mile. Percent of Time 88.9% 9.8% 8.7% 7.6% Source: Mead & Hunt, Inc. analysis. Wind data acquired from the National Oceanic and Atmospheric Administration, National Climatic Data Center. Station 72793, Paine Field, Snohomish County/Everett, Washington (Period of Record: ). This analysis indicates that the IAPs offered by Runway 16R/34L significantly increase the percent of time annually that the Airport is open/accessible to aircraft, as well as influences the distribution of aircraft operations to the various runway and taxiway facilities. Runway/Taxiway Utilization Analysis A detailed understanding of how the existing airfield pavements are utilized at Paine Field is required before safety enhancement recommendations can be identified to improve the layout of the existing Runway 12/30, Taxiways A, Taxilane H, Taxiway A-5, Taxiway A-6 /Outer Ramp taxilane, Taxiway D-1, and the intersection hot spots. The use configuration of the runway system is defined by the number, location, and orientation of the active runway(s) and relates to the distribution and frequency of aircraft operations to A.26
27 those facilities. In general, aircraft operate into the wind for both takeoffs and landings. As the local wind direction changes, aircraft operations will shift to the runway end that favors the new wind direction. At Paine Field, the prevailing winds in the region during VFR and IFR weather conditions, the design capabilities of the existing runways (both physical features and instrument approach capabilities), and the local Air Traffic Control (ATC) procedures (which include voluntary noise abatement procedures and ATCT hours of operation), all combine to dictate the utilization of the existing runway/taxiway configuration. Runway Use The runway use percentages presented in the following table, entitled Table 5, titled RUNWAY UTILIZATION PERCENTAGES were generated from data presented in the September, 2012 Appendix D Noise Analysis/Paine Field Environmental Assessment. This data, which is based upon estimates from Airport Staff that were reviewed by the FAA Airport Traffic Control Tower personnel, presents the percentage of time annually that each runway is used for departures (i.e., takeoffs) and arrivals (i.e., landings) separately during the daytime and nighttime hours. The data shows that the Airport is in south flow (departing to the south and arriving from the north) about 53.2% of the time and north flow (departing to the north and arriving from the south) about 44.2% of the time. In addition, the primary runway, Runway 16R/34L is used approximately 61% of the time, which compares to 37% for Runway 16L/34R, and 2% for Runway 12/30. It should also be noted that Runways 16L/34R and 12/30 are closed to operations when the Air Traffic Control Tower (ATCT) is closed. A.27
28 Table A11 RUNWAY UTILIZATION PERCENTAGES Runway Arrival (Daytime) Arrival (Nighttime) RUNWAY USE Departure (Daytime) Departure (Nighttime) Runway 16R/34L 56.5% 99.1% 56.5% 99.1% Runway 16R 31.0% 57.5% 31.0% 51.5% Runway 34L 25.5% 41.6% 25.5% 47.6% Runway 16L/34R 40.7% 0.0% 40.7% 0.0% Runway 16L 22.1% 0.0% 22.1% 0.0% Runway 34R 18.6% 0.0% 18.6% 0.0% Runway 12/30 2.5% 0.0% 2.5% 0.0% Runway % 0.0% 0.8% 0.0% Runway % 0.0% 1.7% 0.0% Source: Appendix D Noise Analysis/Paine Field Environmental Assessment, September, This overall runway use information can be further broken down by the runway used by each aircraft operation. Therefore, runway use can be aircraft-type specific, with different aircraft having different runway design requirements based upon aircraft size, performance, maneuverability, and time of day of the operation. This more detailed breakdown of runway use by category of aircraft is presented in the following two tables, entitled RUNWAY UTILIZATION BY CATEGORY OF AIRCRAFT, DAYTIME and RUNWAY UTILIZATION BY CATEGORY OF AIRCRAFT, NIGHTTIME. As can be noted, the larger commercial and military jets use Runway 16R/34L exclusively. General aviation aircraft including small single-, twin-engine, and turbo propeller aircraft use both parallel runways (i.e., Runway 16R/34L and Runway 16L/34R) and the crosswind runway (Runway 12/30). Runways 12/30 and 16L/34R are only used by small, propeller aircraft. A.28
29 Table A12 RUNWAY UTILIZATION BY AIRCRAFT CATEGORY (DAYTIME) RUNWAY 16R/34L RUNWAY 16L/34R RUNWAY 12/30 Aircraft Class RW 16R RW 34L RW 16L RW 34R RW 12 RW 30 ARRIVALS Air Carrier 55% 45% Air Taxi - Jet 55% 45% Business Jet 55% 45% Air Taxi - Prop 44% 36% 11% 9% Single Engine Prop 28% 23% 25% 21% 1% 2% Twin Engine Prop 44% 36% 11% 9% Turboprop 44% 36% 11% 9% Military 55% 45% DEPARTURES Air Carrier 55% 45% Air Taxi - Jet 55% 45% Business Jet 55% 45% Air Taxi - Prop 44% 36% 11% 9% Single Engine Prop 28% 23% 25% 21% 1% 2% Twin Engine Prop 44% 36% 11% 9% Turboprop 44% 36% 11% 9% Military 55% 45% Source: Appendix D Noise Analysis/Paine Field Environmental Assessment, September, A.29
30 Table A13 RUNWAY UTILIZATION BY AIRCRAFT CATEGORY (NIGHTTIME) RUNWAY 16R/34L RUNWAY 16L/34R RUNWAY 12/30 Aircraft Class RW 16R RW 34L RW 16L RW 34R RW 12 RW 30 ARRIVALS Air Carrier 75% 25% Air Taxi - Jet 75% 25% Business Jet 75% 25% Air Taxi - Prop 75% 25% Single Engine Prop 55% 45% Twin Engine Prop 55% 45% Turboprop 55% 45% Military 75% 25% DEPARTURES Air Carrier 35% 65% Air Taxi - Jet 35% 65% Business Jet 35% 65% Air Taxi - Prop 55% 45% Single Engine Prop 55% 45% Twin Engine Prop 55% 45% Turboprop 55% 45% Military 35% 65% Source: Appendix D Noise Analysis/Paine Field Environmental Assessment, September, 2012 and Mead & Hunt, Inc. A.30
31 Taxiway Use For the purposes of this study, additional analysis of how the aircraft utilize the supporting taxiway system for each runway is also needed to identify potential runway/taxiway hot spot improvements located at the intersection of Runway 12/30, Taxiway A, and Taxiways A-5 and A-6. To assist in this evaluation, the following three tables have been prepared, which assign specific aircraft types to the use of individual taxiways associated with each runway facility. The existing/future design requirements of these taxiways will be incorporated into the development of alternatives to increase safety and provide operational enhancements to the complex runway/taxiway intersection. Table A14 RUNWAY 16R/34L TAXIWAY UTILIZATION BY AIRCRAFT CATEGORY Aircraft Class A AA A1 RUNWAY 16R/34L TAXIWAY SYSTEM A2 A3 Air Carrier Yes Yes Yes No Yes No No Yes Yes Yes Yes Yes Air Taxi - Jet Yes Yes Yes No Yes No No Yes Yes Yes Yes Yes Business Jet Yes Yes Yes No Yes Yes No Yes Yes Yes Yes Yes Air Taxi - Prop Yes Yes Yes No Yes Yes No Yes Yes Yes Yes Yes Single Engine Prop Yes Yes Yes Yes Yes Yes No Yes Yes Yes Yes Yes Twin Engine Prop Yes Yes Yes Yes Yes Yes No Yes Yes Yes Yes Yes Turboprop Yes Yes Yes No Yes Yes No Yes Yes Yes Yes Yes Military Yes Yes Yes No Yes No No Yes Yes Yes Yes Yes Source: Paine Field Airport Staff & Mead & Hunt, Inc. Analysis. A4 A5 A6 A7 A8 A9 A10 A.31
32 Table A15 RUNWAY 16L/34R TAXIWAY UTILIZATION BY AIRCRAFT CATEGORY Aircraft Class G G1 G2 RUNWAY 16L/34R TAXIWAY SYSTEM G4 G5 G6 F F1 F2 F4 F6 --- Air Carrier No No No No No No No No No No No --- Air Taxi - Jet No No No No No No No No No No No --- Business Jet No No No No No No No No No No No --- Air Taxi - Prop No No No No No No No No No No No --- Single Engine Prop Yes Yes Yes Yes Yes Yes Yes Yes Yes Yes Yes --- Twin Engine Prop Yes Yes Yes Yes Yes Yes Yes Yes Yes Yes Yes --- Turboprop No No No No No No No No No No No --- Military No No No No No No No No No No No --- Source: Paine Field Airport Staff & Mead & Hunt, Inc. Analysis. Table A16 RUNWAY 12/30 TAXIWAY UTILIZATION BY AIRCRAFT CATEGORY Aircraft Class D D1/ A5 D2 RUNWAY 12/30 TAXIWAY SYSTEM D3 D4 Air Carrier Yes 1 Yes Yes No No No No Yes No Yes No No Air Taxi - Jet No Yes Yes No No No No Yes No Yes No No Business Jet No Yes Yes No No No No Yes No Yes No Yes Air Taxi - Prop Yes Yes No Yes Yes Yes Yes Yes No Yes Yes Yes Single Engine Prop Yes Yes Yes Yes Yes Yes Yes Yes Yes Yes Yes Yes Twin Engine Prop Yes Yes Yes Yes Yes Yes Yes Yes Yes Yes Yes Yes Turboprop Yes Yes Yes Yes Yes Yes Yes Yes No Yes No Yes Military No Yes No No No No No No No No No No Source: Paine Field Airport Staff & Mead & Hunt, Inc. Analysis. 1 Between Taxiway A and D-2 D5 W A6 W3 E C TL H A.32
33 Summary The information gathered for the preparation of this INVENTORY OF EXISTING CONDITIONS chapter will be reviewed and confirmed for accuracy by Paine Field Airport Staff, FAA Air Traffic Control Tower personnel, and Project Stakeholder Representatives to be used as baseline data in the preparation of the following FACILITY REQUIREMENTS chapter. Information from both the INVENTORY OF EXISTING CONDITIONS and the FACILITY REQUIREMENTS chapters will be used to develop and select the airfield intersection reconfiguration alternative that accomplishes the specified airfield safety enhancement objectives of the Sponsor and FAA while meeting the development needs of the Airport. A.33
1.1.3 Taxiways. Figure 1-15: Taxiway Data. DRAFT Inventory TYPICAL PAVEMENT CROSS-SECTION LIGHTING TYPE LENGTH (FEET) WIDTH (FEET) LIGHTING CONDITION
 WIDTH (FEET) LIGHTING CONDITION") 1.1.3 Taxiways EWN has an extensive network of taxiways and taxilanes connecting the terminal, air cargo, and general aviation areas with the runways as listed in Figure 1-15. A 50-foot wide parallel taxiway
1.1.3 Taxiways EWN has an extensive network of taxiways and taxilanes connecting the terminal, air cargo, and general aviation areas with the runways as listed in Figure 1-15. A 50-foot wide parallel taxiway
Facility Requirements
 4. This chapter presents the airside and landside facility requirements necessary to accommodate existing and forecasted demand at Erie International Airport (ERI or the Airport) in accordance with Federal
According to FAA Advisory Circular 150/5060-5, Airport Capacity and Delay, the elements that affect airfield capacity include:
 4.1 INTRODUCTION The previous chapters have described the existing facilities and provided planning guidelines as well as a forecast of demand for aviation activity at North Perry Airport. The demand/capacity
Study Committee Meeting. September 2015
 W ki P T / Working Paper Two/ Study Committee Meeting September 2015 Agenda Introductions and Opening Comments Project Overview, Process, and Schedule Review Materials from Working Paper Two Comments,
FACILITY REQUIREMENTS SUMMARY OF KEY ISSUES OVERVIEW
 FACILITY REQUIREMENTS SUMMARY OF KEY ISSUES OVERVIEW This summary is intended to provide a brief overview of the key issues associated with conformance to FAA standards at Methow Valley State Airport.
Source: Chippewa Valley Regional Airport ASOS, Period of Record
 Chapter 1 Inventory Runway wind coverage is the percentage of time a runway can be used without exceeding allowable crosswind velocities. Allowable crosswind velocities vary depending on aircraft size
DRAFT MASTER PLAN UPDATE
 DRAFT MASTER PLAN UPDATE CHAPTER VI: AIRPORT LAYOUT PLAN NARRATIVE DRAFT REPORT APRIL 2017 PREPARED BY: Table of Contents WESTCHESTER COUNTY AIRPORT 6 AIRPORT LAYOUT PLAN NARRATIVE REPORT... 6-1 6.1 AGIS
Executive Summary. MASTER PLAN UPDATE Fort Collins-Loveland Municipal Airport
 Executive Summary MASTER PLAN UPDATE Fort Collins-Loveland Municipal Airport As a general aviation and commercial service airport, Fort Collins- Loveland Municipal Airport serves as an important niche
CHAPTER 1 INTRODUCTION AND BACKGROUND
 CHAPTER 1 INTRODUCTION AND BACKGROUND An Environmental Assessment (EA) evaluates the effects of a proposed Federal action on the surrounding environment and is prepared in compliance with the National
CHAPTER D Capacity Analysis and Facility Requirements INTRODUCTION
 CHAPTER D Capacity Analysis and Facility Requirements INTRODUCTION The capacity of an airfield is primarily a function of the major aircraft operating surfaces that compose the facility and the configuration
Tallahassee International Airport Master Plan. Technical Advisory Committee Meeting #2 October 19, 2016
 Tallahassee International Airport Master Plan Technical Advisory Committee Meeting #2 October 19, 2016 Agenda Welcome / Introductions Master Plan Process and Project Status Forecast of Aviation Demand
Public Information Meeting. September 2015
 W ki P O & T / Working Papers One & Two/ Public Information Meeting September 2015 Agenda Introductions and Opening Comments Project Overview, Process, and Schedule Review Materials from Working Papers
Purpose and Need for the Proposed Project
 Purpose and Need for the Proposed Project Introduction Snohomish County Airport/Paine Field (PAE) is located in Snohomish County, Washington, approximately 20 miles north of Seattle. Figure A1 depicts
STUDY WORK GROUP MEETING No. 3. November 29, 2016
 STUDY WORK GROUP MEETING No. 3 November 29, 2016 Agenda Welcome and introductions Update project schedule Brief overview of previous SWG meeting Update on aviation forecasts Introduction to airfield demand/capacity
The purpose of this Demand/Capacity. The airfield configuration for SPG. Methods for determining airport AIRPORT DEMAND CAPACITY. Runway Configuration
 Chapter 4 Page 65 AIRPORT DEMAND CAPACITY The purpose of this Demand/Capacity Analysis is to examine the capability of the Albert Whitted Airport (SPG) to meet the needs of its users. In doing so, this
CHAPTER 1 BACKGROUND AND PROPOSED ACTION
 CHAPTER 1 BACKGROUND AND PROPOSED ACTION 1.0 INTRODUCTION An Environmental Assessment (EA) evaluates the effects of a proposed Federal action on the surrounding environment and is prepared in compliance
CHAPTER 5 - FACILITY REQUIREMENTS
 CHAPTER 5 - FACILITY REQUIREMENTS This chapter identifies the requirements for airfield and landside facilities to accommodate the forecast demand level. Facility requirements have been developed for the
3.1 Facility Requirements Overview Airfield Facility Requirements... 1
 Table of Contents 3.1 Overview... 1 3.2 Airfield... 1 Airspace Capacity...1 Airside Capacity... 2 Aircraft Mix Index... 3 Arrivals Percentage... 4 Touch-and-Go Percentage... 4 Taxiway Access Factors...
Chapter 5 Facility Requirements
 Chapter 5 Facility Requirements 50 INTRODUCTION This chapter describes the airside and landside facility requirements necessary to accommodate existing and forecasted demand in accordance with Federal
CATCODE ] CATCODE
![CATCODE ] CATCODE](/thumbs/82/85644630.jpg "CATCODE ] CATCODE") Runways. FAC: 1111 CATCODE: 111111 OPR: AFCEC/COS OCR: AF/A3O-A 1.1. Description. The runway is the paved surface provided for normal aircraft landings and take offs. Runways are classified as either Class
Runways. FAC: 1111 CATCODE: 111111 OPR: AFCEC/COS OCR: AF/A3O-A 1.1. Description. The runway is the paved surface provided for normal aircraft landings and take offs. Runways are classified as either Class
Runway Length Analysis Prescott Municipal Airport
 APPENDIX 2 Runway Length Analysis Prescott Municipal Airport May 11, 2009 Version 2 (draft) Table of Contents Introduction... 1-1 Section 1 Purpose & Need... 1-2 Section 2 Design Standards...1-3 Section
CHAPTER 3 ALTERNATIVES CONSIDERED
 CHAPTER 3 ALTERNATIVES CONSIDERED 3.0 ALTERNATIVES The 2010 Stevensville Airport Master Plan contained five (5) airside development options designed to meet projected demands. Each of the options from
Capacity Analysis and Facility Requirements
 Capacity Analysis and Facility Requirements Introduction The capacity analysis for Paine Field is composed of two distinct elements: the ability of airport facilities to accommodate existing and projected
Chippewa-Eau Claire Metropolitan Planning Area Long Range Transportation Plan
 1.2.7 2010 Eau Claire County Comprehensive Plan According to Eau Claire County s most recent comprehensive plan, the County will limit land use development adjacent to EAU in order to preserve the ability
C > Capacity Analysis and Facility Requirements
 Buchanan Field Buchanan Field Airport Master Planning Program C. CAPACITY ANALYSIS & FACILITY REQUIREMENTS C > Capacity Analysis and Facility Requirements INTRODUCTION. The capacity of an airfield is primarily
CEE Quick Overview of Aircraft Classifications. January 2018
 CEE 5614 Quick Overview of Aircraft Classifications Dr. Antonio A. Trani Professor Civil and Environmental Engineering January 2018 1 Material Presented The aircraft and its impact operations in the NAS
PROPOSED HORIZONTAL LAYOUT FILLET DESIGN FOR ENTRANCE/EXIT TAXIWAYS
 PROPOSED HORIZONTAL LAYOUT FILLET DESIGN FOR ENTRANCE/EXIT TAXIWAYS INTRODUCTION The Zelienople Airport Authority (ZAA) has commenced engineering activities for the rehabilitation of Runway 17-35 to a
Lopez Island Airport Master Plan Update. Public Meeting June 15, 2017
 Lopez Island Airport Master Plan Update Public Meeting June 15, 2017 Master Plan Update Team Reid Middleton/Everett, WA Shannon Kinsella, Project Manager Melania Haagsma, Project Engineer Mead & Hunt/Tulsa,
Table of Contents. Overview Objectives Key Issues Process...1-3
 Table of Contents Chapter One Introduction Overview...1-1 Objectives...1-1 Key Issues...1-2 Process...1-3 Chapter Two Inventory of Existing Conditions Airport Setting...2-1 Locale...2-1 Airport Surroundings...2-5
Airport Master Plan for. Brown Field Municipal Airport PAC Meeting #3
 Airport Master Plan for Brown Field Municipal Airport PAC Meeting #3 Public Meeting #1 > 8/24/17 from 5:30 to 8:00 pm > 41 attendees signed-in > Comments: > EAA area > Environmental constraints > Focus
Key Purpose & Need Issues
 Key Purpose & Need Issues Efficiently meet demand through the 2025 planning horizon 864,000+ annual operations 180-200 operations during peak daytime hours Balance peak hour arrival/departure capability
1) Rescind the MOD (must meet the standard); 2) Issue a new MOD which reaffirms the intent of the previous MOD; 3) Issue a new MOD with revisions.
 Rescind the MOD (must meet the standard); 2) Issue a new MOD which reaffirms the intent of the previous MOD; 3) Issue a new MOD with revisions.") ALBUQUERQUE INTERNATIONAL SUNPORT AIRCRAFT HOLD LINE LOCATION ANALYSIS WHITE PAPER JUNE 24, 2016 HOLD LINE LOCATION ISSUE The location of many of the taxiway hold lines at the Sunport do not meet current
ALBUQUERQUE INTERNATIONAL SUNPORT AIRCRAFT HOLD LINE LOCATION ANALYSIS WHITE PAPER JUNE 24, 2016 HOLD LINE LOCATION ISSUE The location of many of the taxiway hold lines at the Sunport do not meet current
1 DRAFT. General Aviation Terminal Services Aircraft Hangars Aircraft Parking Aprons Airport Support Facilities
 To properly plan for improvements at Dallas Executive Airport, it is necessary to translate forecast aviation demand into the specific types and quantities of facilities that can adequately serve the demand.
Hartford-Brainard Airport Potential Runway Closure White Paper
 Hartford-Brainard Airport Potential Runway 11-29 Closure White Paper June 2012 In recent years there has been discussion regarding the necessity of Runway 11-29 to the Hartford- Brainard Airport (HFD)
CEE 5614 and CEE Aircraft Classifications. Spring 2013
 CEE 5614 and CEE 4674 Aircraft Classifications Dr. Antonio A. Trani Professor Civil and Environmental Engineering Spring 2013 1 Material Presented The aircraft and the airport Aircraft classifications
Appendix B Ultimate Airport Capacity and Delay Simulation Modeling Analysis
 Appendix B ULTIMATE AIRPORT CAPACITY & DELAY SIMULATION MODELING ANALYSIS B TABLE OF CONTENTS EXHIBITS TABLES B.1 Introduction... 1 B.2 Simulation Modeling Assumption and Methodology... 4 B.2.1 Runway
Addendum - Airport Development Alternatives (Chapter 6)
") Bowers Field Addendum - Airport Development Alternatives (Chapter 6) This addendum to the Airport Development Alternatives chapter includes the preferred airside development alternative and the preliminary
Bowers Field Addendum - Airport Development Alternatives (Chapter 6) This addendum to the Airport Development Alternatives chapter includes the preferred airside development alternative and the preliminary
4.0 AIRFIELD CAPACITY & FACILITY REQUIREMENTS
 4.0 AIRFIELD CAPACITY & FACILITY REQUIREMENTS A key step in the Airport Master Plan (AMP) process is determining future requirements for airport facilities that will allow for airside and landside development
APPENDIX H 2022 BASELINE NOISE EXPOSURE CONTOUR
 APPENDIX H 2022 BASELINE NOISE EXPOSURE CONTOUR This appendix sets forth the detailed input data that was used to prepare noise exposure contours for 2022 Baseline conditions. H.1 DATA SOURCES AND ASSUMPTIONS
The offers operators increased capacity while taking advantage of existing airport infrastructure. aero quarterly qtr_03 10
 The 747 8 offers operators increased capacity while taking advantage of existing airport infrastructure. 14 aero quarterly qtr_03 10 Operating the 747 8 at Existing Airports Today s major airports are
Prepared By: Mead & Hunt, Inc Port Lansing Road Lansing, MI 48906
 Master Plan The preparation of this document was financed in part through a planning grant from the Federal Aviation Administration (FAA) as provided under Section 505 of the Airport and Airway Improvement
Planning Horizon Activity Levels Airfield Capacity and Delay Airport Physical Planning Criteria Airfield and Landside Facility Requirements
 Proper airport planning requires the translation of forecast aviation demand into the specific types and quantities of facilities that can adequately serve the identified demand. This chapter will analyze
Table of Contents Facility Requirements Overview Airport Capacity and Delay Analysis... 1
 Table of Contents Table of Contents... 2 3.1 Overview... 1 3.2 Airport Capacity and Delay Analysis... 1 Airspace Capacity... 1 Aircraft Mix Index... 3 Arrivals Percentage... 3 Touch-and-Go Percentage...
CHAPTER 4 DEMAND/CAPACITY ANALYSIS
 CHAPTER DEMAND/CAPACITY ANALYSIS INTRODUCTION The demand/capacity analysis examines the capability of the airfield system at Blue Grass Airport (LEX) to address existing levels of activity as well as determine
TECHNICAL REPORT #7 Palm Beach International Airport Airport Layout Plan
 TECHNICAL REPORT #7 Palm Beach International Airport Airport Layout Plan Technical Report #7 Palm Beach International Airport Layout Plan Palm Beach International Airport Prepared for Palm Beach County
CHAPTER 3. Airside Facilities
 CHAPTER 3 Airside Facilities 3.0 AIRSIDE OVERVIEW This chapter focuses on airside facilities at Spokane International Airport (GEG or the Airport ). Airside facilities include runways, taxiways, support
AIRFIELD CAPACITY AND FACILITY REQUIREMENTS
 CHAPTER FOUR: AIRFIELD CAPACITY AND FACILITY REQUIREMENTS 4.1 INTRODUCTION A key step in the Airport Master Plan Update (AMPU) process is determining future requirements for airport facilities that will
Draft Concept Alternatives Analysis for the Inaugural Airport Program September 2005
 Draft Concept Alternatives Analysis for the Inaugural Airport Program September 2005 Section 1 - Introduction This report describes the development and analysis of concept alternatives that would accommodate
FACILITY REQUIREMENTS CHAPTER
 FACILITY REQUIREMENTS CHAPTER Introduction This chapter presents requirements for airside, landside, terminal, and support facilities to meet aviation demand at RNO over the next 20 years. Facilities are
Chapter 3 FACILITY REQUIREMENTS
 Chapter 3 FACILITY REQUIREMENTS Chapter Three Facility Requirements To properly plan for the future of Ryan Airfield, it is necessary to translate forecast aviation demand into the specific types and quantities
Concepts, Alternatives and Development Plan
 Concepts, Alternatives and Development Plan Introduction The purpose of this chapter is to present the Development Plan for Paine Field, in terms of both its concept and reasoning. This chapter provides
Airport Master Plan for Montgomery-Gibbs Executive Airport PAC Meeting #3
 Airport Master Plan for Montgomery-Gibbs Executive Airport PAC Meeting #3 Agenda > Introductions > Public Meetings Overview > Working Paper 3 - Facility Requirements > Working Paper 4 - Environmental Baseline
CHAPTER 3 FACILITY REQUIREMENTS
 CHAPTER 3 FACILITY REQUIREMENTS 3.1 INTRODUCTION To properly plan for the future requirements of Newport News/Williamsburg International Airport, it is necessary to translate the forecasts of aviation
DRAFT FINAL REPORT AIRPORT MASTER PLAN. Rifle Garfield County Airport Revised May 15, 2014
 DRAFT FINAL REPORT AIRPORT MASTER PLAN Rifle Garfield County Airport Revised May 15, 2014 As required by Paragraph 425.B(4) of FAA Order 5100.38C, Airport Improvement Program (AIP) Handbook: The preparation
FACILITY REQUIREMENTS
 FACILITY REQUIREMENTS In order to ensure that Bradley International Airport (BDL) is capable of supporting the expected increase in passenger traffic, care must be taken to ensure that the recommendations
Chapter 3. Demand/Capacity & Facility Requirements
 Chapter 3. Demand/Capacity & Facility Requirements Chapter 3. DEMAND/CAPACITY & FACILITY REQUIREMENTS This chapter provides an assessment of future airport development requirements based upon the forecasts
Appendix 6.1: Hazard Worksheet
 Appendix 6.1: Appendix 6.1: Ref. Condition, real or potential; that can cause injury, illness, etc. This is a prerequisite for an Airfield Hazards 1. Taxiway Geometry Direct access to runway from ramp
FORT LAUDERDALE-HOLLYWOOD INTERNATIONAL AIRPORT ENVIRONMENTAL IMPACT STATEMENT DRAFT
 D.3 RUNWAY LENGTH ANALYSIS Appendix D Purpose and Need THIS PAGE INTENTIONALLY LEFT BLANK Appendix D Purpose and Need APPENDIX D.3 AIRFIELD GEOMETRIC REQUIREMENTS This information provided in this appendix
PORT OF PORTLAND. Chapter Four AVIATION FACILITY REQUIREMENTS
 PORT OF PORTLAND Chapter Four AVIATION FACILITY REQUIREMENTS CHAPTER FOUR PORT OF PORTLAND AVIATION FACILITY REQUIREMENTS In this chapter, existing components of the airport are evaluated to identify the
Washington Dulles International Airport (IAD) Aircraft Noise Contour Map Update. Ultimate Operations 5th Working Group Briefing 9/25/18
 Aircraft Noise Contour Map Update. Ultimate Operations 5th Working Group Briefing 9/25/18") Washington Dulles International Airport (IAD) Aircraft Noise Contour Map Update Ultimate Operations 5th Working Group Briefing 9/25/18 Meeting Purpose Discuss methodology of Ultimate build scenario operations
Washington Dulles International Airport (IAD) Aircraft Noise Contour Map Update Ultimate Operations 5th Working Group Briefing 9/25/18 Meeting Purpose Discuss methodology of Ultimate build scenario operations
APPENDIX X: RUNWAY LENGTH ANALYSIS
 APPENDIX X: RUNWAY LENGTH ANALYSIS Purpose For this Airport Master Plan study, the FAA has requested a runway length analysis to be completed to current FAA AC 150/5325-4B, Runway Length Requirements for
Las Vegas McCarran International Airport. Capacity Enhancement Plan
 Las Vegas McCarran International Airport Capacity Enhancement Plan Las Vegas McCarran International Airport Capacity Enhancement Plan September 1994 Prepared jointly by the U.S. Department of Transportation,
AIRPORT FACILITY REQUIREMENTS
 4.1 INTRODUCTION Chapter 4 AIRPORT FACILITY REQUIREMENTS The major elements of the Airport, which were described in Chapter 3, Existing Airport Facilities must be analyzed individually and balanced in
AIRPORT LAYOUT PLAN FOR FRIEDMAN MEMORIAL REPLACEMENT AIRPORT - SITE 12 FRIEDMAN MEMORIAL AIRPORT AUTHORITY INDEX OF SHEETS SHEET TITLE
 GOODING MUNICIPAL SOURCE: JeppView 3.6.3.1 (Printed May 19, 2010) MAGIC VALLEY REGIONAL BURLEY MUNICIPAL LOCATION MAP NTS - SITE 12 AIRPORT LAYOUT PLAN FOR FRIEDMAN MEMORIAL REPLACEMENT AIRPORT - SITE
Appendix C AIRPORT LAYOUT PLANS
 Appendix C AIRPORT LAYOUT PLANS Appendix C AIRPORT LAYOUT PLANS Airport Master Plan Santa Barbara Airport As part of this Airport Master Plan, the Federal Aviation Administration (FAA) requires the development
Airport Master Plan. Brookings Regional Airport. Runway Runway 17-35
 Runway 17-35 Airport Master Plan Runway 12-30 Brookings Regional Airport Table of Contents Table of Contents Chapter 1: Master Plan Goals... 1-1 1.1. Introduction... 1 1.2. Objective 1 Identify improvements
Airport Layout Plan Narrative Report
 Airport Layout Plan Narrative Report Yuba County Airport Olivehurst, California Prepared for County of Yuba Prepared by Mead & Hunt, Inc. March 23, 2017 YUBA COUNTY AIRPORT AIRPORT LAYOUT PLAN NARRATIVE
AERONAUTICAL SURVEYS & INSTRUMENT FLIGHT PROCEDURES
 AERONAUTICAL SURVEYS & INSTRUMENT FLIGHT PROCEDURES Current as of November 2012 ALASKA AVIATION SYSTEM PLAN UPDATE Prepared for: State of Alaska Department of Transportation & Public Facilities Division
Capacity Analysis & Facility Requirements
 CHAPTER C Capacity Analysis & Facility Requirements 1. Introduction This chapter considers the ability of facilities at Friedman Memorial Airport (SUN) to accommodate existing and projected activity. Current
Draft Concept Alternatives Analysis for the Inaugural Airport Program September 2005
 Draft Concept Alternatives Analysis for the Inaugural Airport Program September 2005 Section 3 - Refinement of the Ultimate Airfield Concept Using the Base Concept identified in Section 2, IDOT re-examined
Yolo County Airport. ALP Narrative Report. April Prepared by Mead & Hunt, Inc. for the County of Yolo, California
 Yolo County Airport ALP Narrative Report April 2016 Prepared by Mead & Hunt, Inc. for the County of Yolo, California Yolo County Airport ALP Narrative Report Prepared for the County of Yolo Mindi Nunes,
MASTER PLAN UPDATE WORKING PAPER NO. 3. Demand/Capacity Analysis and Facility Requirements. March 18, 2013
 MASTER PLAN UPDATE WORKING PAPER NO. 3 Demand/Capacity Analysis and Facility Requirements March 18, 2013 Contents 4 Demand/Capacity Analysis and Facility Requirements... 4 1 4.1 Summary of Aviation Demand
Chapter 5 Facility Requirements
 Chapter 5 Facility Requirements 5.0 INTRODUCTION The Facility Requirements chapter of this Sustainable Master Plan Update describes airside and landside facilities, which are needed to accommodate existing
Draft Concept Alternatives Analysis for the Inaugural Airport Program September 2005
 Section 10 Preferred Inaugural Airport Concept 10.0 Introduction The Preferred Inaugural Airport Concept for SSA was developed by adding the preferred support/ancillary facilities selected in Section 9
Reliever Airports: NOISE ABATEMENT PLAN Flying Cloud Airport (FCM)
") Reliever Airports: NOISE ABATEMENT PLAN Flying Cloud Airport (FCM) INTRODUCTION The Noise Abatement Plan (FCM Plan) for the Flying Cloud Airport has been prepared in recognition of the need to make the
Reliever Airports: NOISE ABATEMENT PLAN Flying Cloud Airport (FCM) INTRODUCTION The Noise Abatement Plan (FCM Plan) for the Flying Cloud Airport has been prepared in recognition of the need to make the
Chapter 4 Facility Requirements
 Chapter 4 Facility Requirements Introduction This chapter evaluates the existing airport facilities and identifies improvements needed to effectively meet the forecasted demand levels discussed in the
6.C.1 AIRPORT NOISE. Noise Analysis and Land Use Impact Assessment FORT LAUDERDALE-HOLLYWOOD INTERNATIONAL AIRPORT ENVIRONMENTAL IMPACT STATEMENT
 6.C.1 AIRPORT NOISE The existing land uses are described in Chapter Five, Affected Environment. The methodologies used to develop the Geographic Information System (GIS) land use database, the estimated
Dallas Executive Airport Town Hall Meeting April 3, 2014
 Dallas Executive Airport Town Hall Meeting April 3, 2014 Background 1,040 acre general aviation facility owned and operated by the City of Dallas 150 based aircraft including business jets and helicopters,
Technical Advisory Committee Meeting February 29, 2016
 Technical Advisory Committee Meeting February 29, 2016 Meeting Agenda Introduction Recap of Planning Process Project Status Goals and Objectives Forecasts of Aviation Demand Overview of Facility Requirements
OVERVIEW BASIC DESIGN FACTORS. Demand Determinants
 3 Airfield Airfield Design Design OVERVIEW The basic configuration of the runway and taxiway system at Hanford Municipal Airport has changed moderately since the airport was constructed in 1950. These
TABLE OF CONTENTS. Washington Aviation System Plan Update July 2017 i
 TABLE OF CONTENTS Chapter 1 Overview... 1-1 1.1 Background... 1-1 1.2 Overview of 2015 WASP... 1-1 1.2.1 Aviation System Performance... 1-2 1.3 Prior WSDOT Aviation Planning Studies... 1-3 1.3.1 2009 Long-Term
Aircraft Classifications. Dr. Antonio Trani and Julio Roa Department of Civil and Environmental Engineering.
 Aircraft Classifications Dr. Antonio Trani and Julio Roa Department of Civil and Environmental Engineering. January 2018 1 Material Presented The aircraft and the airport Aircraft classifications Aircraft
Alternatives. Introduction. Range of Alternatives
 Alternatives Introduction Federal environmental regulations concerning the environmental review process require that all reasonable alternatives, which might accomplish the objectives of a proposed project,
Chapter 4: Facility Requirements
 Chapter 4: Facility Requirements 1 Rapid City Regional Airport Master Plan Update Chapter 4 Facility Requirements Introduction This chapter of the Airport Master Plan analyzes the existing and anticipated
Facility Requirements
 C H A P T E R T H R E E Facility Requirements 3.0 OVERVIEW Airport planning for facility requirements is based upon addressing any existing issues and accommodating the probable demand that may occur over
4.0 FACILITY REQUIREMENTS
 4.0 FACILITY REQUIREMENTS The facility requirements assesses both the aviation and non-aviation components of the New Smyrna Beach Municipal Airport (EVB) including the runways and taxiways, aircraft storage
Chapter III - Demand/Capacity and Facility Requirements
 Chapter III - Demand/Capacity and Facility Requirements The facility requirements identified in this chapter are summarized on Exhibit III.1. The future requirements serve to determine which airport facilities
Preliminary Findings of Proposed Alternative
 Preliminary Findings of Proposed Alternative The attached drawing provides a schematic layout of the proposed alternative that will be discussed on July 27, 2010. A full report will follow and should be
Technical Memorandum. Synopsis. Steve Carrillo, PE. Bryan Oscarson/Carmen Au Lindgren, PE. April 3, 2018 (Revised)
") Appendix D Orange County/John Wayne Airport (JWA) General Aviation Improvement Program (GAIP) Based Aircraft Parking Capacity Analysis and General Aviation Constrained Forecasts Technical Memorandum To:
Appendix D Orange County/John Wayne Airport (JWA) General Aviation Improvement Program (GAIP) Based Aircraft Parking Capacity Analysis and General Aviation Constrained Forecasts Technical Memorandum To:
Merritt Island Airport
 TABLE OF CONTENTS CHAPTER 1 INTRODUCTION... 1-1 INTRODUCTION AND PROJECT OVERVIEW... 1-1 General Guidelines... 1-1 Prior Planning Documentation... 1-2 Key Issues... 1-2 Goals and Objectives... 1-2 Regulatory
AIRSIDE CAPACITY AND FACILITY REQUIREMENTS
 AIRSIDE CAPACITY AND FACILITY REQUIREMENTS This Section investigates the capacity of the airport, its ability to meet current demand, and the facilities required to meet forecasted needs as established
Chapter 1 Introduction and Project Overview
 Chapter 1 Introduction and Project Overview Kittitas County in cooperation with the Federal Aviation Administration (FAA) is updating the Airport Master Plan for Bowers Field Airport (FAA airport identifier
Appendix D Project Newsletters. Tacoma Narrows Airport. Master Plan Update
 Appendix D Project Newsletters Tacoma Narrows Airport Master Plan Update This appendix contains the newsletters distributed throughout the project. These newsletters provided updates and information on
APPENDIX D MSP Airfield Simulation Analysis
 APPENDIX D MSP Airfield Simulation Analysis This page is left intentionally blank. MSP Airfield Simulation Analysis Technical Report Prepared by: HNTB November 2011 2020 Improvements Environmental Assessment/
Agenda: SASP SAC Meeting 3
 Agenda: SASP SAC Meeting 3 Date: 04/12/18 Public Involvement Plan Update Defining the System Recommended Classifications Discussion Break Review current system Outreach what we heard Proposed changes Classification
6.1 INTRODUCTION 6.2 AIRSIDE ALTERNATIVES NORTH PERRY AIRPORT MASTER PLAN UPDATE RUNWAY LENGTH REQUIREMENTS SECTION 6: ALTERNATIVES ANALYSIS
 6.1 INTRODUCTION In the previous chapter, facility needs for the 20-year planning horizon were identified. The next step in the planning process is to identify and evaluate the various ways certain facilities
Chapter Six ALP Drawings. Tacoma Narrows Airport. Master Plan Update
 Chapter Six ALP Drawings Master Plan Update The master planning process for the (Airport) has evolved through efforts in the previous chapters to analyze future aviation demand, establish airside and landside
Lake Tahoe Airport Master Plan Public Meeting March 16, 2015
 Lake Tahoe Airport Master Plan Public Meeting March 16, 2015 What is an Airport Master Plan? a comprehensive study of an airport [that] usually describes the short, medium, and long term development plans
CHAPTER FOUR AIRPORT ALTERNATIVES
 4.0 INTRODUCTION CHAPTER FOUR The goal of the master planning process is to provide the City of New Smyrna Beach with an assessment of the adequacy and capabilities of the Airport as well as to identify
Lake Tahoe Airport Master Plan
 Lake Tahoe Airport Master Plan City Council Briefing October 20, 2015 What is an Airport Master Plan? a comprehensive study of an airport [that] usually describes the short, medium, and long term development