Chapter III - Demand/Capacity and Facility Requirements
|
|
|
- Derek Sanders
- 5 years ago
- Views:
Transcription
1 Chapter III - Demand/Capacity and Facility Requirements The facility requirements identified in this chapter are summarized on Exhibit III.1. The future requirements serve to determine which airport facilities will become inadequate to meet demand at what demand level, and what the shortfall will be by This information will be the basis of the next step in the planning process: the definition and evaluation of development alternatives, which is presented in Chapter IV. The calculated shortfall in facilities provides a glimpse of the degree of facility expansion needed in 20 years, as well as the improvements needed before then. While certain facilities will be needed, at what demand level they actually are implemented is a matter of airport policy. In the case of a runway extension for example, the calculated need increases over time with growth, but that does not mean very small extensions are needed every year. Providing a facility before it is needed is not financially prudent and would not likely receive environmental approval. Providing a facility late, however, causes unnecessary congestion and delay, inconveniencing both passengers and airport neighbors. Late development of facilities is also more expensive and time consuming, tying up airport funds that could be used for other capital projects (including community/environmental mitigation). Facility requirements were calculated for existing conditions (year 2000) and the forecast years of 2005, 2010, 2015, and 2020 using the draft forecasts that were completed in the fall of The timing of the need for the identified improvements is driven by the projections of future aviation activity or trigger points, not years. As a result, trigger points are more important than the actual years. Table III.1 summarizes the trigger points that will lead to the need to expand the airport s facilities. It is important to note that as demand patterns, fleet mix, etc. change over time, the activity triggers may also change. However, this table provides order-of-magnitude planning criteria for the Rhode Island Airport Corporation (RIAC) to monitor actual conditions and activity levels at T. F. Green. Future actual conditions, in relationship to forecasts of aviation demand, should be periodically monitored. This plan should be revisited as needed to confirm the trigger points and timing of proposed facility needs. Facility improvements should not be initiated unless the actual demand justifies a particular project, it is environmentally approved, and proven to be financially feasible. The facility requirements analysis is presented for the major elements of land use at T. F. Green Airport: Airfield Facilities Terminal Area Facilities 1 The facility requirements analysis was needed to support the capacity constrained forecast analysis and was therefore initially completed based on the 2001 draft forecasts (completed prior to September 11, The final forecasts, which were adopted by the RIAC Board and accepted by FAA, resulted in similar 2020 projections and slightly lower projections for the interim years. Reference is made throughout the chapter to the shift in requirements based on the final forecasts. III-1
2 Surface Transportation Facilities Air Cargo Facilities General Aviation Facilities Support Facilities III.1 Airfield Facilities This section contains the demand/capacity analysis for the existing airfield facilities as well as future airfield requirements. For reference, the existing airfield is shown on Exhibit III.1-1. III.1.1 Airfield Capacity The purpose of this analysis is to determine the level of aircraft activity, as defined by hourly or annual aircraft operations, that can be accommodated by the existing airfield system at an acceptable level of delay. Methodology FAA Advisory Circular 150/5060-5, Airport Capacity and Delay, and the FAA s Airport Capacity Model were used to analyze the airfield requirements by computing hourly capacity, annual service volume, and average delays. Assumptions This section discusses the inputs required to run the model, which include existing and forecast demand, weather conditions, runway configuration, and the taxiway system. Existing and Forecast Demand The demand levels used to test the airfield system were derived from the draft forecasts of aviation demand. Calculations were made for the airfield at the existing 2000 level of demand, as well as for the 2005, 2010, 2015, and 2020 activity levels. Table III.1-1 shows the projected annual operations activity levels and the corresponding peak hour activity for each year. Table III.1-1 OPERATIONS FORECAST SUMMARY T. F. Green Airport Annual Operations 155, , , , ,130 Peak Hour Operations Note: Based on draft forecasts prepared prior to the 2002 final forecasts. III-2
3 Aircraft operational fleet mix is an important factor in determining an airport's operational capacity. For the purposes of calculating capacity, aircraft are categorized according to their approach speed and size. Operational capacity decreases as the diversity of approach speeds increases. This is because aircraft following each other, either on takeoff or landing, are spaced according to the difference in their air speeds. Also, aircraft create wake vortices 2 that require different spacing between aircraft depending on their size. The greater the difference in size and speed of the aircraft in the fleet, the greater the space required between aircraft and, as a result, the lower the operational capacity. The existing and forecast aircraft fleet mix was grouped into the three aircraft approach categories (Small, Large, and Heavy) as shown in Table III.1-2. In 2000, over 54 percent of aircraft were considered Small, 44 percent were Large, and two percent were Heavy. In 2020, 37 percent of the aircraft mix are forecast to be Small with 56 percent expected to be in the Large category. This represents a 12 percent increase in Large aircraft over the planning period. Small aircraft are expected to decrease by 17 percent from 2000 to Heavy aircraft represent two percent of the existing fleet in 2000 but are expected to increase to seven percent of the fleet by Table III.1-2 AIRCRAFT FLEET MIX BY AIRCRAFT CATEGORY T. F. Green Airport Annual Operations Existing Forecast Aircraft Approach Category Small 84,664 54% 82,460 47% 84,210 43% Large 68,515 44% 88,860 50% 103,180 53% Heavy 2,366 2% 5,750 3% 7,400 4% Total Operations 155, % 177, % 194, % Forecast Aircraft Approach Category Small 85,060 40% 84,900 37% Large 116,890 55% 128,760 56% Heavy 9,670 5% 15,470 7% Total Operations 211, % 229, % Notes: Small: less than 41,000 pounds Large: 41, ,000 pounds Heavy: 255,000 pounds and above Based on draft forecasts prepared prior to the 2002 final forecasts. 2 3 Phenomena resulting from the passage of an aircraft through the atmosphere. Based on 2001 draft forecasts. III-3
4 Weather Conditions Wind and weather conditions play a significant role in dictating the choice of runway operating plans and specifically influence the use of various Air Traffic Control (ATC) procedures in use at any one time. As such, historical weather data was analyzed to assess the nature, frequency, and duration of weather conditions that influence runway use and operating procedures at T. F. Green Airport. As discussed in Chapter I, Inventory, Section I.4, Meteorological Conditions, the ceiling and visibility minimums at T. F. Green are grouped into two categories: Visual Flight Rules (VFR) and Instrument Flight Rules (IFR). VFR is in effect when the cloud ceiling is greater than or equal to 1,000 feet and visibility is greater than or equal to three miles. IFR conditions prevail when the visibility or cloud ceiling falls below those minimums prescribed under VFR. Table I.4-2 in Chapter I, Inventory, presents the annual occurrence of each weather category at T. F. Green. VFR occurs approximately 86 percent of the time, while IFR occurs the remaining 14 percent of the time. The ATC rules in effect during IFR, including those governing aircraft separation, are more stringent than those under VFR. As a result, capacity is lower during IFR conditions. Runway Configuration As of April 2002, there are three runways at T. F. Green 4. Two of the runways are parallel, oriented in the 5-23 direction. 5 Runway 5R-23L is 7,166 feet long by 150 feet wide and is the primary runway for air carrier operations. Runway 5L-23R is 4,432 feet long by 75 feet wide and is used only by small general aviation aircraft during the daytime in good weather conditions. Due to the limited space at the terminal gate area, Runway 5L-23R is used for overnight air carrier aircraft parking. The runway is also used as a taxiway during low visibility conditions. The third runway is a crosswind runway oriented in the direction and measures 6,081 feet long by 150 feet wide. The airport's three runways are operated in different combinations (configurations) depending on wind and weather conditions and the type of demand (aircraft fleet mix, arrivals versus departures) being accommodated. Exhibit III.1-2 shows the runway operating configurations used at the airport. The runway configuration use percentages are based on eighteen years of hourly weather data and discussions with Air Traffic Control Tower (ATCT) personnel on July 25, The actual usage may vary from year to year. Pilot preference for a particular runway may also dictate runway use. In order to accurately portray the capacity at T. F. Green, full use of Runway 5L-23R was not assumed. Runway 5L-23R does provide some marginal level of additional capacity but it is not a full-use, air carrier runway. ATCT personnel confirmed that 4 5 Please note that one of the three runways, Runway 5L-23R, was converted to a taxiway following the completion of the analysis and draft documentation for the 2002 Master Plan Update. As a result, there are now two runways; 5-23 (formally 5R-23L) and The number designation of a runway corresponds to its general position on the compass. Therefore, a runway number of 5 corresponds to a compass position of 50 degrees, and a runway number of 23 indicates a 230-degree compass position. III-4
5 Runway 5L-23R provides one to two operations per hour in addition to the capacity provided by the other runways. This is equivalent to a three percent increase in overall capacity. In order to reflect this additional capacity in visual, daytime conditions, the resulting annual service volume and design hour VFR operations were adjusted accordingly. It is also important to note that Runway 16-34, the crosswind runway, does not provide much additional capacity. This is because the crosswind runway cannot be operated independently of the main runway (5R-23L) due to the intersection of the two runways. Arrivals and departures on Runway 5R-23L must take place in coordination with operations on Runway For example, when an aircraft is landing or departing on Runway 5R, arriving or departing aircraft on Runway must wait until the Runway 5R aircraft has passed the intersection of the runways. In addition, if a B-757 or larger aircraft is departing on Runway 5R, aircraft waiting to use Runway may have to wait even longer to protect against wake turbulence. As a result of this coordination, the capacity of the two runways together is not significantly higher than a single runway. The model takes this coordination into consideration. Taxiways For the purpose of airport capacity calculations, the model assumes there are sufficient full-length parallel taxiways and runway entrance/exit taxiways and no taxiway/runway crossing problems. This is not the case at T. F. Green where none of the three runways is currently served with a full parallel taxiway and there are insufficient runway exits along Runway 5R-23L. However, in order to be conservative in the demand/capacity analysis, the results of the model were not adjusted downward to reflect the inadequacies of the airfield configuration. (Downward adjustments to the existing capacity would exaggerate the need for runway improvements while in reality these shortcomings would be easily addressed without changes to the runways themselves. The need for taxiway improvements is discussed in Section III.1.3, Taxiway Requirements.) Airfield Demand/Capacity Analysis This section describes the results from the demand/capacity analysis. There are a number of different methodologies that can be used to assess when additional runway capacity is needed. These include an analysis of hourly runway capacity, annual service volumes, or aircraft delays. Each of these methodologies was employed by the FAA s Airport Capacity Model and is discussed in the sections that follow. Hourly Runway Capacity Peak hour airfield capacity is defined as the number of aircraft operations that can take place on the runway system in an hour with minimal capacity-related delay. Using the FAA's Airport Capacity Model, the maximum capacity was computed for VFR and IFR conditions. The results of the hourly capacity analyses are shown in Table III.1-3. T. F. Green's hourly VFR capacity is computed to be 79 operations per hour and the III-5
6 IFR capacity is 57 operations per hour under existing conditions. In 2000, peak hour demand was 52 operations, which is below the VFR and IFR capacity of the airfield. Based on the final forecasts, T. F. Green will exceed the IFR capacity of 57 peak hour operations by By 2020 peak hour demand will be nearing the VFR peak hour capacity of 79 operations. Annual Service Volume Annual service volume is used by the FAA as a quantifiable measure of an airport's operating capacity. The annual service volume is defined as the maximum level of annual aircraft operations that can take place at an airport (i.e. it does not consider levels of delay). Annual service volume can be used as a reference point for the general planning of capacity-related improvements. As actual annual operations approach the annual service volume of an airport, annual aircraft delays increase rapidly, with relatively small increases in the number of operations served. As a general rule, when demand at an airport reaches 60 percent of its capacity, delays become noticeable during portions of the day and new airfield facilities (i.e. runways) should be planned. When airport activity reaches 80 percent of operational capacity, new airfield facilities should be constructed. The annual service volume at T. F. Green was calculated to be 221,000 operations. As shown on Exhibit III.1-3, the 60 and 80 percent ratio were applied to T. F. Green s annual service volume to determine if new airfield facilities would be required. The annual service volume methodology indicates that the airport is currently operating at critical capacity levels (71 percent) and planning should commence immediately to provide new facilities. This methodology also indicates that when annual operations reach 177,000, the airport will be operating at 80 percent of its annual service volume and additional airfield capacity will be needed. Demand is projected to exceed 100 percent of the airfield s annual service volume by 2020, when annual operations are projected to reach 230,000. Aircraft Delays Annual aircraft delay (expressed in average minutes per aircraft operation) is an important measure of an airport's ability to accommodate projected aircraft operations. The actual delay at any given time depends on a number of conditions, such as fleet mix and runway use. There is no universally applied standard of acceptable delay in the airport industry. Various industry groups, aviation textbooks, and aviation scholars have attempted to define what is considered acceptable delay, however, these estimates vary and are constantly changing. The level of acceptable delay varies by airport, depending on a variety of factors including demand levels, peaking characteristics, and the type of service (hub versus non-hub; international versus domestic; commuter versus air carrier). III-6
7 The FAA considers an airport to be congested if the average delay per operation exceeds five minutes. 6 When delays approach these levels, they have local and network-wide implications. The American Association of Airport Executives (AAAE) states in its Accreditation Module, 7 " delay increases gradually with rising levels of traffic until the practical capacity of an airport is reached, at which point the average delay per aircraft operation is in the range of four to six minutes. If traffic demand increases beyond that level, delays increase at an exponential rate." The model estimates average delay in 2020 to be in the range of 3.6 to 5.7 minutes per operation. The upper level of delay applies to airports where air carrier operations dominate. The lower level applies to airports where general aviation operations dominate. At T. F. Green, air carrier operations dominate and the upper level of delay therefore applies in assessing the need for future runway improvements. Exhibit III.1-4 depicts the projected average delay per operation by year. Using the FAA and AAAE standards of congestion, the airport will require additional runway capacity when annual operations levels reach 212,000 to 230,000 (expected to occur towards the end of the planning period). Summary The results of the airfield demand/capacity analysis indicate that T. F. Green will reach critical capacity levels during the master planning horizon. Three methods were used to most accurately determine the need for and likely timing of airfield improvements. Using the first two methods (hourly capacity and annual service volume), the trigger points for additional airfield capacity would be reached early in the planning period. However, the third method, which consists of an evaluation of aircraft delays, shows that T. F. Green will not reach critical delays until after 2016 based on the final forecasts. Incorporating the results of the three methodologies yields a conclusion that additional airfield capacity will be needed when annual operations reach between 194,000 to 212,000. This is projected to occur sometime between 2011 and 2017, based on the final forecasts. It is possible that the airfield will be between 88 and 96 percent of capacity at that time. There are improvements that could be made in the meantime, including new technology and improvements to the taxiway system, that would provide a small measure of increased capacity. These improvements are discussed in Section III.1.3, Taxiway Requirements, and Section III.1.4, Technology Improvements. These improvements would not delay the need for additional runway capacity; in fact, the capacity analysis factored these improvements into the analysis Aviation Capacity Enhancement Plan, page 3-5 ( American Association of Airport Executives Accreditation Module, Airport Capacity and Delay, developed by Stephen M. Quilty, A.A.E., Bowling Green State University, Ohio, USA. III-7
8 III.1.2 Runway Length Requirements The purpose of a runway length analysis is to determine if the lengths of the existing runways are adequate, and to determine the needed length for the existing and any future runways. This analysis does not include the geometric design standards provided by the FAA including the Runways Safety Area (RSA) and Runway Protection Zone (RPZ). These two key standards are discussed in Section III.1.7, FAA Runway Design Standards. Runway length requirements were identified for several aircraft groups (air carrier, commuter, general aviation), in addition to landing and takeoff runway length requirements. It is important to note that these requirements do not imply that several different runways are needed to serve different aircraft groups. Rather, various runway length requirements were identified in order to provide as much information as possible for the alternatives analysis. A need for additional runway capacity has been identified, however, it is not yet known what the ultimate proposed configuration of the airfield will be. New or relocated runways of varying lengths in various locations and the extension of existing runways will be considered and evaluated in the alternatives analysis in Chapter IV. The runway length requirements were calculated using charts published in the aircraft manufacturers aircraft performance manuals. Requirements were calculated by taking into consideration the airport elevation and average temperature, runway conditions, and the performance characteristics and operating weight of each aircraft. The operating weight of an aircraft is dependent on the amount of fuel needed to reach the destination and the amount of payload (passengers, baggage, and cargo). Although this analysis utilized the individual aircraft manufacturers manuals, individual airlines will typically have their own runway length requirements. These requirements are sometimes more stringent than those presented in the aircraft design manuals and are based upon additional safety and insurance requirements. Existing Runway Lengths Runway 5R-23L is 7,166 feet long and is the primary arrival and departure runway for air carrier operations. Runway 5L-23R is 4,432 feet long and is used only by small general aviation aircraft during the daytime in good weather conditions (this runway serves as an aircraft parking area at night and as a taxiway during low visibility conditions). Runway is the crosswind runway and measures 6,081 feet long. Three of the runway ends operate with a displaced threshold. A displaced threshold represents a point on the runway other than the physical beginning of the runway and is marked for arriving aircraft. This limits the landing length available to arriving aircraft. The physical beginning of the runway is used by departing aircraft, which typically require more runway length than arriving aircraft. Displaced thresholds are used when there are obstructions that an arriving aircraft cannot clear when using the physical beginning of the runway. Runway 5L-23R operates with a displaced threshold of III-8
9 1,039 feet for Runway 5L and 903 feet for Runway 23R. Runway 16 has a 565-foot displaced threshold. As a result, Runway 5L arrivals have 3,393 feet of runway available, Runway 23R arrivals have 3,529 feet of landing length available, and Runway 16 arrivals have 5,516 feet. Takeoff Runway Length Requirements This section discusses the takeoff runway length requirements for the aircraft currently or projected to be in operation at T. F. Green over the planning horizon. Requirements were identified for air carrier, commuter, and general aviation aircraft. Air Carrier Requirements Air carrier takeoff length requirements were calculated by determining the weight of each aircraft, which is based on the amount of fuel needed to reach a particular destination, and the amount of payload (passengers, baggage, and cargo). For this analysis, it is assumed that the payload is maximized. Chapter II, Forecasts of Aviation Demand, Section II.2.2, Current and Recent T. F. Green Air Service, identified the top 15 T. F. Green Origin and Destination (O&D) markets 8 currently without nonstop air service, many of which are on the west coast. The forecasts predict new nonstop destinations at T. F. Green within the planning period; these 15 markets are likely choices for the expected new nonstop service. Exhibit III.1-5 depicts the existing and potential nonstop destinations from T. F. Green. It is not necessary to evaluate the runway length requirements for each identified market separately, particularly since it is not known which markets will eventually be served. In order to provide flexibility, two representative distances were selected for use in this analysis: 800 nautical miles and 2,300 nautical miles. The 800-nautical mile distance represents existing market requirements as over 90 percent of all current departures are within 800 nautical miles. A distance of 2,300 nautical miles would represent the potential west coast markets. Takeoff runway length requirements can be determined for a "standard day" (59 degrees Fahrenheit) or "hot day" (77 to 84 degrees Fahrenheit). Evaluating runway length requirements for a hot day results in longer takeoff lengths than for a standard day. This occurs because the relative density of the air decreases at high temperatures, thereby decreasing an aircraft's operational performance. During the months of June, July, August, and September, the average high temperatures at the airport ranged from 77 to 82 degrees Fahrenheit. These temperatures are within the hot day range described previously, so hot day performance data is representative and was used for this analysis. 8 Top 15 markets are based on Database 1B full year 2000 data. III-9
10 Exhibit III.1-6 shows the takeoff runway length requirements for air carrier aircraft with destinations of 800 nautical miles for hot day conditions. The majority of the aircraft serving markets within 800 nautical miles can be accommodated on Runway 5R-23L (7,166 feet long) with full payloads. Exceptions include the B , B , B , and the DC The B and the B are not currently in operation but are forecast to be in the next five to ten years. The B and the DC-9 operate today but represent a small portion of the existing fleet and either only fly to destinations that are closer than 800 nautical miles (including stopovers on the way to a west coast market) or operate with reduced payloads in order to use the existing runways. A 7,500-foot runway would be sufficient to serve existing markets within 800 nautical miles with 100 percent payloads for all aircraft except the B and the DC-9-51 which are expected to be phased out of operation by Exhibit III.1-7 depicts the takeoff runway length requirements for air carrier aircraft with destinations of 2,300 nautical miles under hot day conditions. The takeoff runway length requirements for west coast service range from just over 6,000 feet to 10,500 feet, depending on the type of aircraft. The runway length requirements for west coast service are broken out into two groups on this exhibit: those aircraft that require less than 9,000 feet and those that require more than 9,000 feet. For those aircraft that require more than 9,000 feet, standard day requirements are also shown. Also depicted on this exhibit is the percentage of the total 2020 fleet each aircraft represents. Twelve percent of the fleet require more than 9,000 feet of runway length under hot day conditions when serving west coast destinations. The B requires 10,000 feet of runway length under standard day conditions while all other aircraft require 9,200 feet or less under standard day conditions. It is not known at this time which aircraft would be flying to the west coast in the future so it would not be reasonable to plan for the maximum length required by any particular aircraft under the worst case conditions (hot day). As a result, further analysis was needed to determine the runway length needed for west coast service. The first step in this process consisted of evaluating the percentage of departures in each forecast year that would be able to serve west coast markets with various runway lengths. The second step consisted of evaluating the payload reductions that have to be accepted by the airlines with the shorter runway lengths. The results of this analysis are discussed in the paragraphs that follow. Table III.1-4 shows the percent of aircraft that will be able to serve west coast markets at varying runway lengths. 9 A 9,000-foot runway would allow 72 percent of the existing fleet and 56 percent of the 2020 fleet to serve the west coast market. A 10,000-foot runway would allow 100 percent of the 2000 fleet and 97 percent of the 2020 fleet to serve west coast markets. A 10,500-foot runway would allow all aircraft to serve the west coast at any temperature. 9 Calculations do not include aircraft (such as commuters) that are not capable of serving the west coast regardless of runway length. These percentages will not correspond to the percentages used in Exhibit III.1-7 which are based on the total fleet. III-10
11 Table III.1-4 PERCENT OF AIRCRAFT CAPABLE OF SERVING WEST COAST T. F. Green Airport Takeoff Length (feet) Year ,000 65% 51% 46% 41% 39% 9,000 72% 69% 62% 62% 56% 10, % 100% 99% 99% 97% 10, % 100% 100% 100% 100% Notes: Percentages based on aircraft capable of serving west coast regardless of runway length. (For example, turboprop aircraft are not included because they cannot fly such long distances.) Based on draft forecasts prepared prior to the 2002 final forecasts. There are three aircraft (B , B , and B ) that require over 9,000 feet of runway to reach west coast destinations. These aircraft require more than 9,000 feet of runway when operating at 100 percent of their available payload. In reality, flights are not always 100 percent full, therefore, the weight of the aircraft is reduced. As a result, the maximum allowable payload amounts for these three aircraft were calculated for different runway lengths of 9,000 feet and 9,500 feet (see Table III.1-5). It is important to note that these aircraft will only be subject to limited payloads at high temperatures. Table III.1-5 WORST CASE PAYLOAD PENALTIES FOR WEST COAST SERVICE T. F. Green Airport Takeoff Weights (pounds) Runway Maximum Loss in Percent of Length Aircraft Fuel Payload OEW Total Payload (pounds) Total Payload 9,500 feet B ,000 82, , ,000 6,000 93% B ,500 35,000 83, ,500 3,700 90% B ,700 43,200 91, ,200 3,800 92% 9,000 feet B ,000 76, , ,000 12,000 86% B ,500 34,000 83, ,500 4,700 88% B ,700 40,200 91, ,200 6,800 86% Source: Aircraft Characteristic Manuals, hot day requirements OEW = Operating Empty Weight. A 9,000-foot runway can accommodate 86 to 88 percent of available payloads on the three aircraft. A 9,500-foot runway can accommodate 90 to 93 percent of available payloads on the three aircraft. The typical industry level for the acceptable range of payload is above 85 percent. Many airlines prefer not to regularly operate aircraft below 90 percent of their available payloads. This range may vary by airline and frequency of III-11
12 service to a particular market. Based on this criterion, a 9,500-foot main departure runway is recommended; this length is considered reasonable for planning purposes. Crosswind runways are generally designed at approximately 80 percent of the identified primary departure runway length requirement 10. A crosswind runway length that is shorter that the primary runway is usually acceptable at most airports for two reasons. First, the added lift from increased head-on wind speeds under conditions where the crosswind runway is in use, somewhat reduces takeoff length requirements. In addition, at many airports, the occurrences of winds that require the use of the crosswind do not occur frequently enough to make runway length-caused operational restrictions an issue. Since a 9,500-foot runway is recommended for the primary air carrier departure runway at T. F. Green, 7,600 feet would be the recommended crosswind runway length (based on the 80 percent guideline) for planning purposes. At 7,600 feet, the crosswind runway would be capable of providing operational flexibility as a backup runway during maintenance, snow removal, or favorable wind conditions. In addition (according to the Part 150 Study), shifting more traffic to Runway would also result in noise benefits. Therefore, a 7,600-foot crosswind runway would not only meet FAA s rule-of-thumb for crosswind runways, but would also serve as an acceptable backup runway to serve existing destinations and would have noise benefits as well. Commuter Requirements Runway length requirements for regional jets and turboprop aircraft were determined using maximum takeoff weight and hot day conditions. Takeoff length requirements for specific distances were not calculated for commuter aircraft because these aircraft are not generally used for west coast service. As shown on Exhibit III.1-8, the regional jets require the most runway length (6,000 to 6,400 feet). (Although it should be noted that pilots and airlines often insist on 6,500 feet as the required length for regular use.) Turboprops require 4,100 to 5,100 feet of runway length. All commuter aircraft can be accommodated with a 6,400-foot runway. 10 When possible, crosswind runways are generally designed at approximately 80 percent of the identified primary departure runway length requirements; however, 80 percent is a general planning and design guideline recommended by the FAA, not a regulation or rule. If it is determined that lengthening the crosswind runway to 80 percent of the primary runway length requirement is not feasible or practical due to environmental impacts (i.e. wetlands/hydrological issues) and/or exorbitant costs (i.e. costs more than the benefit gained), etc., then a lesser length will be considered adequate. Again, this is a FAA rule-of-thumb planning/design guideline. III-12
13 General Aviation Requirements Little information exists relative to general aviation takeoff length requirements. A 4,500 to 5,000-foot runway length requirement is typical for many corporate general aviation aircraft. Therefore, 5,000 feet represents the requirement necessary to serve all general aviation aircraft at T. F. Green. Landing Runway Length Requirements Landing length requirements were also assessed for the design aircraft at T. F. Green. Exhibit III.1-9 depicts the runway lengths necessary with maximum aircraft landing weight and various flap settings for both wet and dry pavement conditions. All aircraft can be accommodated on the existing runways during dry and wet pavement conditions. The requires the most length (approximately 7,200 feet) under wet pavement conditions. As a result, 7,200 feet represents the runway landing length requirement for arriving aircraft at T. F. Green. Summary Runway length requirements were identified for several aircraft groups (air carrier, commuter, general aviation), in addition to landing and takeoff requirements. It is important to note that these requirements do not imply that several different runways are needed to serve different aircraft groups. Rather, various runway length requirements were identified in order to provide as much information as possible for the alternatives analysis. The runway length analysis found that the required lengths for any existing or future runways at T. F. Green should be: 5,000 feet to serve general aviation aircraft 6,400 feet to serve commuter aircraft 7,500 feet to serve all future aircraft to existing destinations 9,000 feet to serve all departures to medium-haul markets with 100 percent payload, as well as nonstop west coast markets with 86 to 88 percent payloads 9,500 feet to serve all departures to medium-haul markets with 100 percent payload, as well as nonstop west coast markets with 90 to 93 percent payloads 10,500 feet to accommodate 100 percent of the departing aircraft with 100 percent payload to existing and future markets from T. F. Green 7,200 feet to accommodate all arrival aircraft during dry and wet pavement conditions 7,600 feet for a crosswind runway to serve all aircraft under crosswind conditions III-13
14 III.1.3 Taxiway Requirements Taxiways are defined paved areas established to move aircraft from one part of the airport to another. This section evaluates the existing taxiway system and summarizes the taxiway requirements at T. F. Green. In order to identify needed taxiway improvements, the taxiway system was compared to FAA design criteria, and evaluated using a taxi flow analysis program and input from ATCT personnel. The taxi flow analysis consisted of evaluating the primary aircraft taxi flows for the main runway use configurations (see Exhibit III.1-10, Exhibit III.1-11, Exhibit III.1-12, Exhibit III.1-13 and Exhibit III.1-14) to identify areas of congestion. The results of the taxiway analysis are discussed in the following sections. Parallel Taxiways Neither air carrier runway at T. F. Green has a full-length parallel taxiway. Taxiways S and M run parallel to Runway 5R-23L but do not extend the full-length of the runway. Taxiway S extends approximately 1,600 feet along Runway 5R-23L at the south end. Taxiway M extends 2,615 feet along the north end of Runway 5R-23L. Likewise, Runway is partially served by Taxiways B and C. Taxiway C runs parallel to Runway from the Runway 34 end, for a distance of 4,780 feet. Taxiway B extends along Runway to the east and west of the intersection of Runway and Runway 5R-23L for a distance of 3,100 feet. Air carrier runways should be served with full-length parallel taxiways. A full-length parallel taxiway provides more opportunity for aircraft to queue for departure and allows more runway exits to be provided. Based on this standard, the airfield at T. F. Green is already deficient and as operations increase, the resulting delays will increase. This need has also been identified by the ATCT. In order to provide an airfield that meets industry standards it is recommended that all air carrier runways, including new air carrier runways constructed in the future, be provided with full-length parallel taxiways. The need for full-length parallel taxiways was a recommendation of the previous Master Plan and will become more and more critical as demand increases. The full-length taxiways should therefore be in place by Runway-taxiway centerline separations were also evaluated based on FAA design criteria. Design standards related to airport geometry are derived from the most demanding aircraft anticipated to use a particular runway. The largest aircraft regularly expected to use Runways 5R-23L and is a B-767. The B-767 is classified as Airport Reference Code (ARC) C-IV 11 by the FAA. 11 The ARC is a coding system used by the FAA to relate airport design criteria to the operational and physical characteristics of the airplanes intended to operate at the airport. The ARC has two components: aircraft approach speed and wingspan. ARC C-IV includes aircraft with approach speeds of 121 knots or more but less than 141 knots and wingspans of 118 feet or more but less than 171 feet. III-14
15 FAA separation standards for ARC C-IV aircraft require a minimum of 400 feet of lateral separation between the centerlines of a runway and taxiway. The Taxiway C centerline is located 300 feet from the centerline of Runway and does not meet ARC C-IV standards. Therefore, Taxiway "C" needs to be relocated 100 feet southeast in order to provide the required 400-foot separation between the runway and taxiway centerlines. This non-standard separation was identified in the previous Master Plan. Runway 5L-23R serves small aircraft exclusively. Therefore, 240 feet of lateral separation to Taxiway T is required. Taxiway T meets this standard with over 300 feet of centerline separation from Runway 5L-23R. Therefore, no adjustments are required for Taxiway T. Runway 5R-23L is the primary air carrier runway at T. F. Green. As such, it is subject to more stringent standards than the other runways. The centerlines of Taxiway S and Taxiway M are approximately 400 feet from the centerline of Runway 5R-23L. At these separations, both taxiways meet the ARC C-IV standard. However, the FAA recommends that the runway centerline to parallel taxiway centerline separation be at least 600 feet for Group IV, V, and VI aircraft in order to allow room for acute-angled exit taxiways. 12 Because Runway 5R-23L is the primary air carrier runway at T. F. Green, 600 feet of lateral separation to a parallel taxiway is recommended. In summary, this analysis recommends a full-length parallel taxiway for Runway 5R-23L with 600 feet of lateral separation from the Runway 5R-23L centerline by Taxiway C must be relocated 100 feet southeast in order to provide the required 400 feet of lateral separation to the Runway centerline. A fulllength taxiway for Runway is also recommended by Any new runways should be served by a full-length parallel taxiway with the appropriate separation. Runway Exits Entrance/exit taxiways, also referred to as runway exits, connect runways to parallel taxiways. These taxiways provide paths for aircraft to enter the runway for departure or leave the runway after landing. The type of runway exit and the location and number of exits depends on many factors including the location of parallel taxiways and the type of aircraft using the runway. The time it takes an aircraft to decelerate to a slow enough speed to exit the runway varies depending on the size and performance characteristics of the aircraft. If exits are not placed at the point(s) where the majority of aircraft using the runway reach their exit speed, the aircraft must continue down the runway at a relatively low rate of speed until it gets to an exit. Runways with an adequate number of and properly spaced runway exits allow capacity to be optimized by minimizing the runway occupancy times of arriving aircraft. 12 FAA Advisory Circular 150/ , Airport Design, Chapter 2, Paragraph 209. III-15
16 Generally, a greater number of runway exits are needed for a diverse fleet mix to allow all aircraft to exit the runway at their optimal speed. In addition, acute-angled exits provide lower runway occupancy times compared to 90-degree exits. This is because aircraft can exit the runway at higher speeds with acute-angled exits, thereby allowing the aircraft to exit the runway sooner. The main air carrier runway (5R-23L) does not have an adequate number of runway exits. An additional exit between Taxiways "C" and "D" would allow Runway 5R arrivals to exit the runway sooner than they do today. This exit could also be used by arrivals on Runway 23L that are capable of exiting the runway prior to Taxiway D. Currently, aircraft must stay on Runway 5R-23L longer than they need to, at reduced speeds, which increases their runway occupancy time and reduces capacity. The ATCT supports the proposed exit and feels it can help improve the efficiency of the runway system. This was also a recommendation of the prior Master Plan. In addition, none of the runways are served with acute-angled exits. Converting (and possibly relocating) some of the existing 90-degree exits would reduce runway occupancy times compared to existing conditions. In summary, a new exit is needed for Runway 5R-23L between Taxiways C and D. Acute-angled exits will be needed on the air carrier runways to improve runway capacity. (The capacity calculations in Section III.1.1 assumed these improvements would be made.) The specific location and type of runway exits will depend on the ultimate length of both existing extended runways and new runways. Exit location and type will also depend on the runway centerline to parallel taxiway centerline separations. This will be considered further in the analysis of alternatives in Chapter IV. Terminal Area Taxiways The terminal area is served by a single taxiway T and there is no push-back area for aircraft leaving the gate area. Air carrier airports the size of T. F. Green should have a dual taxiway system (or a single taxiway with a push-back area) in the terminal area. The current taxiway system near and around the terminal can cause aircraft delays. During peak periods this area does not have sufficient capacity to serve demand. Delays and congestion in the terminal area are partially due to the location of Runway 5L-23R. There is not sufficient space between Taxiway T and the terminal to create a push-back area that would not block Taxiway T and Taxiway T cannot be relocated due to the location of Runway 5L-23R. Aircraft pushing back from the terminal to Taxiway T cause taxiing aircraft to hold on this taxiway. As traffic increases in the future, the terminal area will become more and more congested and the need for an additional taxiway will be exacerbated. Another congestion area is the taxiway system to the north of the terminal. Currently, general aviation aircraft that arrive on Runway 5L-23R must travel on Taxiway T, and then on N and F, across Runway 16-34, to the Northeast and Northwest Ramp hangars. This configuration adds unnecessary taxi time and complexity for general III-16
17 aviation aircraft. Reconfiguring this intersection so that the general aviation aircraft can taxi directly north on Taxiway T across Runway would improve and simplify taxi flows in this area. The need for reconfiguration of this intersection was confirmed by the ATCT. In summary, a requirement has been identified for a dual taxiway system (or a single taxiway with a push-back area) in the terminal area. Also, the taxiway system to the north of the terminal should be reconfigured. Bypass Areas Bypass areas or runup pads are areas used to store aircraft prior to takeoff. They are placed adjacent to the ends of runways and are designed so one aircraft can bypass another when necessary. Bypass areas allow a trailing aircraft to bypass a leading aircraft if the takeoff clearance of the latter must be delayed for some reason or if it experiences a malfunction. In addition, bypass areas provide space for instrumentation and engine operation to be checked on piston-engine aircraft prior to takeoff. It is important for air carrier airports to have sufficiently sized bypass areas to accommodate existing and future aircraft. T. F. Green Airport currently has bypass areas capable of accommodating all aircraft smaller than a B-757 at the approach ends of Runways 5R, 5L, and 16. If there is a mechanical problem once a B-757 or larger aircraft reaches the runway end for takeoff, the aircraft must taxi on the runway in order to return to its gate. In addition, Runways 23R, 23L, and 34 do not have bypass areas. In the event that an aircraft is not ready to depart on these runways it must also taxi on the runway in order to return to the terminal area. These situations cause unnecessary delays because arriving or departing aircraft cannot use the runway surface until the taxiing aircraft is clear of the runway. Currently, the largest aircraft in operation at the airport is the B-757. The forecast expects however that B-767 aircraft will begin using T. F. Green by Therefore, bypass areas capable of accommodating B-767 aircraft are needed for Runways 5R, 23L, 16, and 34 by Any new runways in the future should also have B-767 capable bypass areas. ATCT personnel confirm this need and have also indicated a need to expand the bypass area for Runways 5L and add a bypass area for Runway 23R. However, the analysis in this chapter (Section III.1.5, Runway Incursions) has determined that this runway should be closed, negating any needed improvements. Summary The taxiway analysis identified the following taxiway needs: Provide full-length parallel taxiways for all air carrier runways, including new runways constructed in the future, with the necessary runway centerline to parallel taxiway centerline separations. III-17
18 Relocate Taxiway "C" to provide standard runway to taxiway separation of 400 feet. Provide additional runway exits and acute-angled exits. Provide dual taxiways in the terminal area. Reconfigure the intersections of Taxiways "T," "F," and "N." Provide B-767 capable bypass areas for all air carrier runways. III.1.4 Technology Improvements T. F. Green Airport has the ATC technology necessary for the function of the airport. However, there are additional technologies that could enhance safety and efficiency at the airport. The FAA recognizes the importance of these technologies and implements those it feels are appropriate for a particular ATCT. This master plan will not recommend specific technologies to be implemented by the FAA, but this section does review potential technologies for consideration by FAA. The 2000 Aviation Capacity Enhancement Plan provides detailed summaries of technologies that increase efficiency, capacity, and enhance overall airport safety. The sections that follow discuss technologies that may have a potential application at T. F. Green Airport. These technology improvements were discussed with ATCT staff to determine their potential effectiveness and need at T. F. Green. Communication Enhancements Communication enhancements improve routing and sequencing of traffic with greater efficiency and less interference than current communication systems. The key benefits to communication enhancements are safety, increased efficiency, and increased frequency capacity by reducing frequency congestion and verbal miscommunications. Examples of communication enhancements include: Controller to Pilot Data Link Communications (CPDLC) Next Generation Air/Ground Communications (NEXCOMM) Flight Information Service and Cockpit Information System These communication enhancements are part of a national initiative by the FAA. The ATCT staff indicated that all communication enhancements would increase efficiency and safety at T. F. Green. CPDLC in particular would reduce workload once made available. CPDLC is planned to replace sets of voice messages between the controller and pilot with displayed data messages in the cockpit, thus increasing airspace use and capacity. By 2003, CPDLC is planned to be available nationwide. III-18
19 Surveillance Enhancements Surveillance enhancements aid primarily in the movement of aircraft and other airport vehicles. The primary result of surveillance technologies is to improve safety. Examples of surveillance enhancements include: Airport Dependent Surveillance (ADS) Airport Surface Detection Equipment (ASDE-X) Currently, ASDE-X is being considered at T. F. Green. The ASDE-X provides surveillance of taxiing aircraft and service vehicles at airports by using high resolution ground mapping. It is designed for small hub airports to reduce and prevent runway incursions. 13 The ATCT provided a list of other runway incursion reducing tools being demonstrated at airports and facilities around the country. They include the following: Multilateration/Infrared Surveillance Sensor Fusion Magnetic Checkpoint (In-surface magnetic sensors) Ground Marker Vehicle Tracking via Global Positioning System (GPS)/Radio Frequency (RF) Data Link System Addressable Signs (SMART Boards) These runway incursion tools represent technologies that are capable of enhancing safety at the airport. The FAA has been increasingly focused on the need to reduce runway incursions at airports in the U.S. As a result, it will be important for RIAC and the FAA to investigate and implement applicable runway incursion reducing tools at T. F. Green. Capacity Enhancements Capacity enhancements aid primarily in the sequencing and spacing of arrival and departure streams at the airport. This allows closer spacing of aircraft and more direct routes than without new technology. The key benefits to capacity enhancements are increased safety, efficiency, and capacity. Examples of capacity enhancements include: GPS Wide Area Augmentation System (WAAS) GPS Local Area Augmentation System (LAAS) 13 The FAA defines a runway incursion as any occurrence at an airport involving an aircraft, vehicle, person, or object on the ground that creates a collision hazard or results in loss of separation with an aircraft taking off, intending to takeoff, landing, or intending to land. III-19
20 Precision Runway Monitor (PRM) With the integration of GPS/WAAS/LAAS across the National Airspace System (NAS), on-board equipment will be simplified and reduced. These enhancements also will allow for more accurate tracking of aircraft, both on the ground and in the airspace, leading to increased capacity and better efficiency than currently exists. A differential GPS LAAS/WAAS could serve airports within a 30-mile radius. The PRM is an improved radar technology that may increase capacity by enabling independent arrival streams and reducing the separation needed between two parallel runways. However, these types of capacity enhancing technologies are not applicable at T. F. Green because Runway 5L-23R is used only as a general aviation visual daytime runway. Operating dual simultaneous independent approaches at the airport is not currently possible and PRM would not provide any benefits. However, if the preferred alternative includes two full-use parallel runways, PRM may be useful in improving the capacity of such a system. Summary The technology enhancements described in the above sections could enhance safety and efficiency at the airport. The communication enhancements are part of a national initiative by the FAA and would increase both safety and efficiency when available. As there is increased focus on reducing runway incursions at airports in the U.S., it will be important for RIAC and the FAA to investigate and implement applicable runway incursion reducing tools as they become available. However, none of the technology enhancements or technologies identified would defer the need for runway and taxiway improvements. (The need for runway and taxiway improvements is discussed in Sections III.1.1, Airfield Capacity, and III.1.3, Taxiway Requirements.) III.1.5 Runway Incursions In order to enhance existing airport safety measures, the FAA has instituted the national Runway Incursion Action Team (RIAT) that visited T. F. Green in Through a collaborative effort between the FAA and airport management, RIAT recommended a number of airfield improvements to enhance airfield safety. The following actions are the major recommendations issued by RIAT: Eliminate the non-essential runway crossings on the airport. Convert Runway 5L-23R to a taxiway and remove overnight parking on this surface. (Runway 5L-23R is only used by general aviation aircraft under visual conditions and therefore does not provide significant capacity to the runway system. According to ATCT personnel, this runway provides approximately three percent additional capacity.) III-20
21 Deicing areas need to be explored to accommodate the increased traffic at T. F. Green. Presently during deicing conditions, aircraft push back from the gate to deice, blocking Taxiway "T." Develop an alternative to eliminate the traffic from the Northeast and Northwest ramps crossing Runway 16 in order to access the Taxiway "F" runup area. In order to reduce the potential for runway incursions, it will be necessary for RIAC to consider the actions identified by RIAT. In addition, Section III.1.4, Technology Improvements, identified a need to pursue technology that can improve safety by reducing the potential for runway incursions. III.1.6 Instrumentation and Lighting Instrumentation, lighting, and other navigational aids assist pilots in maneuvering their aircraft safely and efficiently under various weather conditions. The following sections review the existing approach/instrumentation aids and lighting systems at T. F. Green and identify future requirements. Approach and Instrumentation Runway instrumentation permits landings in IFR conditions. IFR occurs when the ceiling is less than 1,000 feet or the visibility is less than three miles. IFR weather conditions occur 14 percent of the time at T. F. Green. There are three IFR instrumentation categories (CAT I, II, and III) with different ceiling and visibility minimums. CAT III is further subdivided into three classes (a, b, and c). The category of IFR is important because runways may or may not be able to accommodate aircraft landings under various conditions, depending on the type of instrumentation available. The annual occurrence for each category is shown in Table III.1-6. CAT I occurs the majority of the time (12.85 percent) during IFR. CAT II and III combined occur less than two percent of the time. The instrumentation available at T. F. Green was previously described in Chapter I, Inventory, Section 1.5.1, Airfield Facilities. Runway 5R is equipped with a CAT II Instrument Landing System (ILS). Runways 23L and 34 can accommodate approaches under CAT I. An authorized CAT III ILS approach was approved for Runway 5R in In general, the instrumentation available at T. F. Green is adequate. The new CAT III ILS for Runway 5R will ensure that at least one runway is usable in all weather conditions. It is typical at air carrier airports for the secondary approach runway(s) to have a minimum of CAT I capability to provide redundant capacity during snow removal and other runway closure conditions. Runway 34 has a CAT I ILS and provides this redundant capacity. If a new runway is added at T. F. Green, CAT I capability would be required for that runway, at a minimum. III-21
22 Table III.1-6 ANNUAL OCCURRENCE OF WEATHER CATEGORIES T. F. Green Airport Category Ceiling (in feet) Visibility (in miles) Annual Occurrence CAT I > = 200 & <1,000 > = 1/2 & < % CAT II > = 100 & <200 > =1/4 & <1/2 1.03% CAT IIIa <100 > = 700 feet & <1/4 0.18% CAT IIIb <100 > = 150 feet & <700 feet 0.12% CAT IIIc <100 <150 feet 0.06% Total 14.24% Source: EarthInfo, Inc. from the National Climatic Data Center (NCDC) database, National Weather Service (NWS) hourly surface aviation observations, (excluding 1989 and 1994 due to bad data). In addition, the FAA and RIAC are currently considering options to relocate the VORTAC located in the center of the airfield. Airport staff have also noted that the Runway 34 localizer is scheduled for upgrade and replacement in the summer of Lighting The lighting available at T. F. Green was previously described in Chapter I, Inventory, Section 1.5.1, Airfield Facilities. All runways except Runways 5L-23R and 16 are equipped with an approach light system. Runway 5R is equipped with a CAT II, Approach Light System with Sequenced Flashing Lights (ALSF-II). Runways 23L and 34 are outfitted with Medium-Intensity Approach Light System with Runway Alignment Indicator Lights (MALSR). All runways have high intensity runway edge lights. The existing lighting system is considered adequate and minimal enhancements will be needed. Airport staff identified the need to replace the existing Runway approach light system due to its age. III.1.7 FAA Runway Design Standards The FAA provides airport geometric design standards and recommendations in order to ensure the safety, economy, efficiency, and longevity of an airport. The FAA publishes these standards and recommendations in Advisory Circular 150/ Two key standards include the Runway Safety Area (RSA) and the Runway Protection Zone (RPZ). The RSA is a "defined surface surrounding a runway prepared or suitable for reducing the risk of damage to airplanes in the event of an undershoot, overshoot, or other excursion from the runway." RSAs enhance the safety of airports and provide pilots with a suitable surface area that will minimize the potential for aircraft damage. Furthermore, RSAs provide greater ground accessibility for firefighting and rescue equipment during such incidents. The size of the RSA is dependent on the type and III-22
23 size of aircraft using each runway. The FAA requires an RSA of 1,000 feet beyond the runway end and a width of 500 feet for the aircraft using Runways 5R-23L and The RSA for Runway 5L-23R (which is used by small aircraft in visual conditions) must measure 300 feet beyond the ends of the runway and be 150 feet wide. An RPZ is a trapezoidal area on the ground centered off the end of the runway along the centerline. Its purpose is to enhance the protection of people and property on the ground. This is achieved through airport owner control over the RPZs. Such control includes clearing the RPZ areas (and maintaining them clear) of incompatible objects and activities. Control is preferably exercised through the acquisition of sufficient property interest in the RPZ. The RPZ dimensions for a particular runway end are a function of the type of aircraft and approach visibility minimums associated with that runway end. Exhibit III.1-15 shows the FAA runway design standards for each runway. Currently only Runway 5L-23R provides standard safety areas from the runway ends. The other runway ends have objects such as roads, trees, streams, lighting systems, and instrumentation in them or do not meet standard grading requirements for RSAs. RIAC owns the majority of land under the Runway 23L, 34, 5L, 23R RPZs but a significant portion of the Runway 5R and Runway 16 RPZs are not airport-owned. RIAC should plan to provide standard safety areas and an effort should be made to obtain positive control over RPZs for all runways at T. F. Green in order to enhance airport/aircraft safety in the future. The need to provide standard RSAs was a recommendation of the previous Master Plan and is a high priority of the FAA. III.1.8 Obstructions As discussed in Chapter I, Inventory, Section I.5.1, Airfield Facilities, the analysis of obstructions is based on criteria defined in Federal Aviation Regulation (FAR) Part 77, Objects Affecting Navigable Airspace. Part 77 establishes several imaginary surfaces in relation to an airport and to each runway end. There have been four studies prepared since 1992 that studied obstructions at T. F. Green. Obstructions at the airport will be further analyzed as part of the development of the Airport Layout Plan (ALP). III.1.9 Aircraft Overnight Parking Areas This section reviews the Remain Overnight (RON) areas at T. F. Green and identifies requirements for future facilities. As shown on Exhibit III.1-16, there are five aircraft RON parking areas on the airport. These areas are described in detail in Chapter I, Inventory, Section I.5.1, Airfield Facilities. Runway 5L-23R is used for RON parking and can accommodate six B-727s and three B-757s. The other RON areas can accommodate a B and two B-757s. An additional RON area exists which serves military aircraft. III-23
24 It is difficult to develop future requirements for RON areas because individual airline decisions will determine this requirement. These decisions will be made based on changes in airline markets and schedules. The difficulty is compounded by the reality that terminal facilities should not be designed around RON apron requirements. However, it is a reasonable assumption that the level of RON activity will likely increase proportionally with gate requirements. Therefore, all available apron and gate areas should be organized efficiently to maximize RON areas in order to maximize RIAC s ability to accommodate the airlines. It is important to note that Section III.1.5, Runway Incursions, recommended that Runway 5L-23R be converted to a taxiway and that overnight parking be removed from this surface for safety reasons. If this occurs, the existing RON capability will be reduced and replacement capacity must be found. III.1.10 Pavement Conditions Pavement conditions at T. F. Green were previously discussed in Chapter I, Inventory, Section 1.5.1, Airfield Facilities. According to the 1994 Field Investigation, Pavement Evaluation and Classification report, Runways 5L-23R and 5R-23L had Pavement Condition Index (PCI) values that ranged from good to excellent. Runway was last resurfaced with an asphalt overlay in 1978 and is approaching the end of its useful life. The runway surface now has a number of pavement distresses. Chapter II, Forecasts of Aviation Demand, Section II.5.2, Reduce Facilities, identified that Runway needs to be reconstructed within the next three years. 14 Taxiway, apron, and other airfield pavement ratings ranged widely. All the taxiways except for Taxiways "B" and "C" rated good or higher. All the apron and ramp areas except for two sections of the Northeast and Northwest ramps had pavement ratings of good or higher. Many sections of the airport perimeter road were evaluated as part of the other ramp and apron areas. Airport staff have noted that sections of the perimeter road are currently unpaved and fencing is inadequate for security purposes. Also, the perimeter road penetrates the Runway 34 RSA and the glide slope critical area for Runway 5R. The FAA has indicated that a fully paved perimeter road for T. F. Green is a high priority. In summary, RIAC should continue to monitor Runway pavement conditions for further distresses as the runway approaches the end of its useful life. Taxiways "B" and "C" and the distressed sections of the Northeast and Northwest ramps should be monitored over the planning period in order to evaluate the need to repave or resurface these and other pavement surfaces. Finally, a fully paved all-weather perimeter road with appropriate fencing is recommended. A priority should be given to position the road outside all safety and critical areas. This will be discussed further in Chapter IV, Alternatives. 14 August 8, 2001, Pavement Evaluation for Runway III-24
25 III.1.11 Summary of Airfield Requirements The airfield requirements analysis identified the following airfield development needs: Runway Requirements: Close Runway 5L-23R Provide an additional runway between 2011 and 2017 Runway length requirements: 9,500 feet of runway to serve all air carrier departures to west coast markets at reasonable payloads; 7,500 feet to serve air carrier aircraft to existing destinations; 6,400 feet to serve commuter aircraft; 5,000 feet for general aviation aircraft; 7,200 feet needed to serve all arriving aircraft Provide a 7,600-foot crosswind runway Provide CAT I instrumentation on secondary arrival runway(s) to provide redundant capacity during snow removal and other runway closure conditions Provide standard RSAs Provide positive control (ownership or easements) of RPZs for all runways to the extent possible Taxiway Improvements: Provide full-length parallel taxiways for all air carrier runways, including new runways constructed in the future, with the necessary runway centerline to taxiway centerline separation Relocate Taxiway "C" to provide standard runway to taxiway separation of 400 feet Provide additional runway exits and acute-angled exits Convert Runway 5L-23R to a taxiway and remove overnight parking on this surface Reconfigure the intersections of Taxiways T, F, and N Provide B-767 capable bypass areas for all air carrier runways Explore deicing areas Eliminate traffic between Northeast and Northwest ramps and the Taxiway F runup area Technology Improvements: The FAA should continue to study safety and capacity enhancing technologies for potential application at T. F. Green III-25
26 Remain Overnight (RON) Improvements: Provide replacement RON capacity for positions lost due to the closure of Runway 5L-23R Maximize available areas capable of being used as RON Pavement Requirements: Runway requires reconstruction within the next three years A fully paved all-weather road with appropriate fencing should be provided Pavement conditions should be monitored over the planning period in order to evaluate the need to repave or resurface distressed surfaces III.2 Terminal Area Facilities The term terminal area facilities encompasses the aircraft gates along with the terminal and concourse buildings. Exhibit III.2-1 depicts the existing terminal area at T. F. Green. Terminal area facility requirements for an airport are a function of the characteristics of that airport. These characteristics include the level of passenger and aircraft activity, the number and type of airlines serving the airport, the operating requirements of the airlines, and local factors such as the number of connecting passengers. The capacity of each element of a terminal facility can vary depending on the acceptable level of crowding and processing time. A passenger traveling on business may be less tolerant of congestion or delay than a passenger traveling for pleasure. In many cases, the degree of acceptability itself may also vary depending on the configuration of the terminal space and the level of amenities provided. Thus, the capacity of a terminal can vary significantly. Considering T. F. Green Airport s role in the region as a convenient alternative to Boston Logan, the preservation of passenger convenience is an important criterion. III.2.1 Aircraft Gates In order to standardize the definition of "gate" and to provide a consistent means for evaluating apron utilization, the Narrow Body Equivalent Gate (NBEG) index is used. This index converts the gate requirements of diverse aircraft, from small commuters to new large aircraft, so they are equivalent to the apron capacity of a typical narrowbody aircraft gate. The amount of space each aircraft requires is based on maximum wingspan. Aircraft are classified according to FAA Taxiway Design Groups as shown in Table III.2-1. Group IIIa has been added to account for the Boeing 757 which has a wider wingspan than Group III but is smaller than a typical Group IV aircraft. III-26
27 Table III.2-1 NARROW BODY EQUIVALENT GATE (NBEG) INDEX T. F. Green Airport Maximum NBEG FAA Aircraft Design Group Wingspan Typical Aircraft Index I. Small Commuter 49' Metro, Cessna 0.4 II. Medium Commuter 79' SF340, CRJ, ERJ 0.7 III. Narrowbody/Large Commuter 118' A319, A320, B737, MD IIIa. B ' B IV. Widebody 171' B767, MD-11, DC V. Jumbo 214' A330, A340, B747, B VI. New Large Aircraft (NLA) 262' A Existing Gate Facilities T. F. Green s aircraft gates were grouped by relative aircraft size as shown in Table III.2-2. The aircraft size groupings were based on the maximum aircraft permitted to park at each gate. The existing facilities are capable of accommodating six B-757 gates, 11 narrowbody gates, two regional jet gates, two turboprop gates, and one gate utilized by Cape Air, which operates Cessna aircraft. There are a total of seven commuter gates and 15 air carrier gates, for a total of 22 gates and 20.2 NBEG. The commuter carriers and Cape Air operate multiple aircraft positions from one location, however, each location was counted as one gate. Table III GATE CONFIGURATION AND UTILIZATION T. F. Green Airport 2000 NBEG NBEG Percentage of Aircraft Group Gates Index Calculation Total Gates Cape Air Cessna % Turboprop % Regional Jet % Narrowbody % B % Widebody % Jumbo % Total Gates % III-27
28 Gate Requirements There are various methodologies available to determine future gate requirements. Three of these methods were chosen and applied at T. F. Green in order to create a range of gate requirements: Annual Departures per Gate Method Annual Enplaned (Departing) Passengers per Gate Method Percent Increase in Annual Operations Method A fourth approach, the peak month average day (PMAD) Departures Per Gate Method, was then used to identify gate requirements by aircraft type for each forecast year. The results from the first three approaches were used to benchmark this methodology. Annual Departures Per Gate Method Table III.2-3 shows the first method which applies the existing ratio of annual departures per gate to 2020 annual air carrier and commuter departures. The existing ratio is 2,204 annual departures per gate. This approach assumes that the current usage and utilization of the gates will remain constant over the planning period. This method results in a requirement for 37 gates in Table III.2-3 ANNUAL DEPARTURES PER GATE METHOD 2020 GATE REQUIREMENT T. F. Green Airport 2020 Annual Passenger Departures Resulting Gate Requirement Ops./ Gate 79,400 2, Note: Requirements were calculated based on the draft forecasts and were not updated to reflect the final forecasts. Annual Enplaned Passengers Per Gate Method Table III.2-4 shows the second method which takes the existing ratio of annual enplaned passengers per gate of 123,430 and applies it to 2020 forecast annual enplaned passengers. This method assumes that the current usage and utilization of the gates is acceptable and will remain constant over the planning period. This method results in a requirement for 44 gates in III-28
29 Table III.2-4 ANNUAL ENPLANED PASSENGERS PER GATE METHOD T. F. Green Airport 2020 Enplaned Passengers 1 Enplanements/Gate Gates 2 5,411, , Annual passengers divided by two. Requirements were calculated based on the draft forecasts and were not updated to reflect the final forecasts. Percent Increase in Annual Operations Method Table III.2-5 depicts the gate requirements associated with the third method. This methodology assumes that the number of gates needed will increase at the same rate as the forecast increase in annual passenger operations through This method does not take into account changes in fleet mix, which could change gate usage. It assumes that the current usage and utilization of the gates will remain constant over the planning period. This method determined gate requirements for commuter and air carrier gates separately. Two gates (Gates 8 and 9) are counted as both commuter and air carrier gates based on actual usage. This results in seven commuter gates and 17 air carrier gates in 2000 (for a total of 24 gates). Commuter operations are forecast to increase by 30 percent from 2000 to 2020, which results in a requirement for 10 commuter gates in Air carrier operations are forecast to increase by 95 percent from 2000 to This results in a requirement for 34 air carrier gates in This methodology results in a total requirement for 44 gates by Table III.2-5 PERCENT INCREASE IN ANNUAL OPERATIONS METHOD T. F. Green Airport Operations Gate Requirements Percent Gate Type Increase Commuters 47,466 61, % Air Carrier 49,698 96, % Total Gates Note: Requirements were calculated based on the draft forecasts and were not updated to reflect the final forecasts. III-29
30 PMAD Departures Per Gate Method The three previous methodologies resulted in gate requirements ranging from 37 to 44 gates by These methodologies are based on annual activity levels and as such do not reflect the peaking characteristics that can be observed on a daily basis. In addition, due to the high level of gate sharing by different size aircraft (for example, a gate that can be used by B-757, B-737, and regional jet aircraft), it was difficult to apply these methodologies to determine specific gate requirements by aircraft size. As a result, a fourth approach was used that takes these factors into consideration. This approach is based on the ratio of scheduled PMAD departures per gate. For the 2000 base case, existing gates were categorized by the maximum allowable aircraft size at each gate. The number of PMAD departures for each aircraft group for existing conditions (year 2000) and the forecast years was derived from the draft forecast fleet mix. The average number of departures accommodated per gate for each aircraft group under existing conditions was then determined. This ratio was adjusted as needed to reflect projected changes in gate usage in the future and then applied to the forecast activity to determine future gate requirements. Table III.2-6 shows the gate requirements for each aircraft group under this preferred methodology. The departures per gate ratio varies widely by aircraft group due to the way the gates are currently used. First of all, many gates actually accommodate more than one departure at one time. For example, Cape Air uses a single marked gate position but parks multiple aircraft at the gate. Turboprops operate in a similar manner. As a result, these aircraft have high departures per gate ratios. Secondly, many of the gates at T. F. Green are used by a wide variety of different size aircraft. A B-757 gate may be used by B-757s, narrowbody aircraft such as B-737s, and regional jets. In addition, a gate that is large enough to accommodate a regional jet may also be used by turboprop aircraft. The departures per gate ratio reflects the number of departures that fall in each aircraft group, not the number of departures that actually use the gate. This methodology assumes that aircraft from each aircraft group will continue to utilize larger gates throughout the planning period. This is consistent with gate utilization observed at similar sized airports around the country. In 2000 there were three daily B-757 departures and six B-757 sized gates. This results in a ratio of 0.5 departures per gate. The B-757 gates are actually used more often than this ratio reflects but they are used by smaller aircraft. This ratio is expected to increase in the future as more B-757 departures occur at T. F. Green. Conversely, the departures per gate ratio for narrowbodies is 7.1, which is higher than typical industry standards. The narrowbody gates are actually used less frequently than this because many of the narrowbody aircraft use the B-757 gates. III-30
31 This analysis showed that the airport is currently out of gates (i.e. all gates are leased). Therefore, additional gates are needed as soon as possible. By 2020, daily departure activity is projected to reach 258 departures per day and a total of 40 gates will be needed. This is within the range identified by the previous methodologies. RIAC should continue to provide B-757 and B-767 capable gates that will be used primarily by smaller aircraft. This will provide RIAC with maximum flexibility in accommodating aircraft size. In addition, a requirement for one jumbo gate by 2020 was identified. This gate would likely be used by smaller aircraft such as the B-757 and B-767 but would give the airport the capability and flexibility to support larger aircraft such as the B-777. III.2.2 Passenger Terminal Facilities A detailed passenger terminal facility requirements program, which estimates the spatial requirements needed to accommodate passenger activity for the planning years, was developed prior to the attacks of September 11, This space program is contained in Appendix D, Terminal Space Program. The terminal space program requirements were organized into six general categories: airline functions, concessions space, Federal Inspection Services (FIS), secure public area, non-secure public area, and non-public area. More detailed requirements were also provided for individual areas within each of these categories. The ensuing changes in security regulations since September 11 have rendered some of the details of this space program obsolete. Security regulations are still evolving and it is not known at this time how much space will be needed for new explosive detection machines, the longer lines at the security checkpoints, or additional space in the holdrooms for passengers who now arrive at the airport much earlier than they did before September 11. The terminal space program can be updated at the appropriate time when more is known about the new security regulations and when it is time to design an expansion to the terminal. For the purposes of this long-term master plan, a projection of overall building size is sufficient to plan the future location of any new passenger terminal facilities a detailed breakout of space is not needed. One broad-level methodology used to calculate overall terminal building size was based on building area per gate. This methodology estimates future terminal building size based on the number of required gates and an industry standard of interior space per gate, which takes into account all of the functions in a terminal (airline space, security, holdrooms, etc.). The gate requirements developed in Section III.2.1, Aircraft Gates, can be used to estimate future building size based on this methodology. Generally, domestic airport passenger terminals average 20,000 square feet per gate. The 352,400-square foot existing passenger terminal at T. F. Green measures approximately 16,000 square feet per gate. It is likely that T. F. Green s ratio will increase to the industry standard as larger aircraft are used in the future. Table III.2-7 shows the calculation of total passenger terminal space needed for each planning horizon assuming the 20,000 square feet per gate planning factor. III-31
32 Table III.2-7 PASSENGER TERMINAL BUILDING REQUIREMENTS T. F. Green Airport Number of Gates Year 1 Sq. Ft./Gate Terminal Building Area (square feet) (Existing) 16, , , , , , , , , ,000 1 Requirements were calculated based on the draft forecasts and were not updated to reflect the final forecasts. Based on the building area per gate methodology, approximately 800,000 square feet of terminal space will be needed by This is similar to the projections of total passenger terminal size in the more detailed space program contained in Appendix D and is sufficient for planning purposes. Annual activity exceeding six million passengers will trigger the need for initial terminal expansion to approximately 500,000 square feet of building (projected to occur by 2005 based on the final forecasts). The 2005 requirement of 520,000 square feet will more likely occur two to three years later than indicated in the above table based on the final forecasts. The 2010 projection could shift one to two years and the 2015 requirement will likely occur one year later. The 2020 final forecasts were virtually unchanged from the original projections so the 2020 terminal requirement remains valid. III.3 Surface Transportation Facilities This section describes the demand/capacity relationship for the surface transportation facilities at T. F. Green. The purpose of this analysis is to determine the maximum level of activity, as defined by annual or hourly activity, which can be accommodated on the existing surface transportation facilities at a reasonable level of service (LOS). For the purpose of this analysis, the proposed Warwick Train Station is assumed to be in place by mid The following are the main airport surface transportation facilities analyzed in this section: Airport Access Roadways Terminal Area Roadways Curbfront Facilities Public Parking Facilities Employee Parking Facilities Rental Car Facilities III-32
33 III.3.1 Roadways As passenger volumes increase at T. F. Green, airport-related traffic volumes will increase accordingly on area roads, including limited access roads such as the Airport Connector. As indicated in Chapter I, Inventory, Section I.5.3, Landside Facilities, the Airport Connector provides the primary means of access from I-95 directly to the terminal area roadways. Local roads adjacent to the airport, such as Airport Road to the north, provide access to Governor Francis, Hoxie, Conimicut, and Warwick Neck neighborhoods in eastern Warwick. Access to these neighborhoods is constrained by the shoreline location to the east and south, and by the airport itself. Few alternate routes are available for residents of these eastern neighborhoods to access other parts of Warwick or I-95. The volume of projected passenger arrivals and departures is important in determining proposed traffic impacts to the airport s key arterial roadways and intersections, which provide direct access to and egress from T. F. Green Airport. These analyses also reflect future passenger enplanement projections and employee and public parking areas located on the airport property. Also considered in this analysis is the construction and implementation of the proposed Warwick Intermodal Station and its relative impacts to the surrounding roadway infrastructure. Based on the relationship of the projected enplaning and deplaning passengers to vehicular traffic access and egress, a traffic distribution methodology was developed for the airport roadway system. The primary result of the capacity analysis is the assignment of a LOS rank to traffic facilities under various traffic flow conditions. The concept of LOS is defined as a qualitative measure describing operational conditions within a traffic stream and how motorists perceive the conditions. A LOS definition provides an index for the quality of traffic flow, in terms of such factors as speed, travel time, freedom to maneuver, traffic interruptions, comfort, convenience, and safety. Six LOS rankings are defined for locations with and without traffic signals. Signalized and unsignalized locations have different thresholds of delay per vehicle based on the methodology outlined in the Highway Capacity Manual Letter designations are assigned to indicate operating conditions, LOS A indicating lower delays and LOS F indicating higher delays. In general, a ranking of LOS D or better is considered acceptable for an urbanized area. The following are descriptions of delays for LOS A to LOS F: LOS A indicates free flow traffic conditions with little or no delay for approaching traffic. LOS B indicates relatively low delay, but more vehicles reduce speed than in LOS A. LOS C indicates operations with higher delays. The number of vehicles stopping in this grade is significant, but still many cars pass through with no delay. III-33
34 LOS D describes operations with delay in the range where the influence of congestion becomes more noticeable. Many vehicles stop and individual cycle failures are noticeable. LOS E indicates operations with high delays. Individual cycle failures are a frequent occurrence. LOS F describes the worst operating conditions. High delay occurs with over-saturated conditions. Poor progression and long cycle lengths may also be a major contributing cause to such delays. Table III.3-1 indicates the LOS assignment for each grade, and the delay in seconds for signalized and unsignalized locations. Highway Capacity Analysis (HCS2000) software was used for the intersection capacity analysis. Traffic signal timing plans were collected from the Rhode Island Department of Transportation (RIDOT). These plans are used to time traffic signals in the field and are kept on record with RIDOT. The internal airport intersection at the short-term parking lot was timed in the field to measure signal timing and determine phasing due to the lack of a signal plan. Methodology A study area was defined for this analysis and is described in Chapter I, Inventory, Section I.5.3, Landside Facilities. Vehicle turning movement data and arterial counts for the individual intersections within the study area have been utilized to establish a traffic datum from which to work. This datum was used as a snapshot for daily traffic during peak times and is relative to arriving and departing flight information taken for the same time period. Table III.3-1 SUMMARY OF INTERSECTION LOS DETERMINATION CRITERIA T. F. Green Airport Average Stopped Delay (seconds per vehicle) Level Of Service (LOS) Signalized Intersection Unsignalized Intersection A <10 <10 B >10 - <20 >10 - <15 C >20 - <35.0 >15 - <25 D >35 - <55.0 >25 - <35.0 E >55 - <80 >35 - <50.0 F >80 >50 Source: Highway Capacity Manual 2000 III-34
35 Existing flight schedules were obtained from airline records for flights during the November 2000 study period. The flight schedules were used to obtain data on daily arrivals and departures, aircraft type, and number of total seats on each flight. A 90 percent aircraft occupancy was used to determine the number of passengers per flight. 15 Enplaning and deplaning passengers were then related to vehicles entering the airport arterial system via on-airport roadways and the off-site state highway system. The relationship of passengers to vehicles was determined to be 1.8 average passengers per vehicle (see Table A-9 in Appendix A, Survey Results). The flight schedule was overlaid onto the daily traffic turning movement counts for the arterial roadway system. An additional 30 to 60 minutes was allowed for arriving passengers and departing passengers to reflect the time the passengers would actually be using the roadways. A direct correlation was then made between flights and peak vehicular traffic times. During the p.m. peak period, peak flight times and peak vehicular traffic times occurred virtually at the same time. In the a.m. peak period, the times were slightly offset. The a.m. airport peak begins prior to typical non-airport peak traffic. The airport-generated traffic occurring at these times was then distributed onto the arterial roadway system based on the derived traffic distribution plan. This distribution was factored against employee traffic, passenger traffic, and taxi traffic based on the percentage breakdown by use. The derived trip generations were subtracted from the total traffic for each movement. An annual growth factor of 1.04 percent, based on RIDOT traffic planning for the city of Warwick, was then applied to the remaining traffic network, factoring out all airport-related traffic. Growth factors for airport traffic were derived based on the projected forecasts for each of the planning years. The two traffic components were then recombined for each of the study years to derive a new traffic count/movement at each of the subject intersections. Exceptions to this methodology were intersections where all turning movements are 100 percent airport traffic. In this instance peak enplanement times were used for peak vehicular movements and growth was solely enplanement based. Trip Distribution Airport traffic was distributed on the arterial road network around the airport based on existing arrival and departure patterns and traffic count data. The overwhelming majority of airport traffic arrives and departs via the Airport Connector. Other local traffic uses Post Road (U.S. Route 1) to reach the minor arterial network, which includes Airport Road, Jefferson Boulevard, and Coronado Road. Exhibit III.3-1 and Exhibit III.3-2 indicate arrival and departure travel patterns for the airport. 15 This is higher than the load factors used in the forecasting analysis in Chapter II. A 90 percent load factor was used to represent a conservative impact of the airport on local traffic. III-35
36 Airport Access Roadways Traffic operations for 2005, 2010, 2015, and 2020 indicate a consistent increase in traffic volume due to the projected growth at the airport and regional and local background development growth. This increase in traffic impacts vehicle operations at study area intersections. These operations are impacted during the p.m. peak, which coincides with and overlaps a portion of the peak airport traffic. The a.m. peak hour does not indicate an overlap, so impacts are minimal. Table III.3-2 presents LOS results for projected analysis years for signalized intersections. Table III.3-3 presents this information for unsignalized intersections. The LOS roadway analysis in these tables was based on the draft forecasts. The final forecasts project lower passenger volumes from 2005 to 2015 indicating that the need for roadway improvements could possibly be deferred a few years. In addition, there have been changes in the times passengers access the airport due to the increased security requirements since September 11. Passengers must now get to the airport much earlier than before, which can cause changes in the timing and location of roadway congestion. Increases in roadway traffic in the future will trigger the need for roadway improvements and should be monitored closely to determine when roadway improvements will be needed. Two intersections are currently operating at an unacceptable level of service (Jefferson Boulevard at Coronado Road and Jefferson Boulevard at the Airport Connector Off-Ramp eastbound left). The second intersection is unsignalized but a signal is planned as part of the Intermodal Station. As airport activity reaches the range of 6.1 to 6.7 million annual passengers, the Post Road at Coronado Road intersection will need improvements. As airport activity increases to eight million passengers annually, the intersections of Airport Road at Commerce Drive and Post Road at Airport Road will require improvements. Annual passenger levels exceeding nine million will trigger the need for improvements to the intersections of Airport Road at Hade Court and Post Road at the Airport Connector Off-Ramp. Two intersections along Coronado Road (at Post Road and Jefferson Boulevard) show high delays and LOS F conditions that indicate possible future gridlock conditions by the end of the planning period unless improvements are made. These intersections receive a majority of the traffic growth from the airport. As a result of the increased delay at the intersections, the arterial LOS along Coronado Road will be degraded in the future. This reduction in LOS is primarily caused by increased traffic on the section of Coronado Road that has reduced sight distance and minimum road width on a bridge over the rail line. These conditions will create more congestion on this two-lane roadway compared to existing conditions. III-36
37 Table III.3-2 EXISTING AND PROJECTED LEVEL OF SERVICE (LOS) SIGNALIZED INTERSECTIONS, AIRPORT AREA ACCESS ROADS T. F. Green Airport Signalized Intersections A.M. Peak Hour Existing Delay LOS Delay LOS Delay LOS Delay LOS Delay LOS Location Post Road at Airport 30.9 C 35.7 D 42.3 D 51.0 D Road 60.7 E Post Road at Coronado 17.1 B 18.6 B 20.6 C 24.2 C Road 41.2 D Post Road at Off Ramp 14.9 B 15.6 B 16.6 B 17.9 B 20.0 C Post Road at On Ramp 3.9 A 4.0 A 4.1 A 4.3 A 4.4 A Post Road at Donald 13.8 B 14.1 B 14.5 B 15.1 B Avenue 15.8 B Jefferson Blvd at 21.6 C 25.3 C 31.2 C 40.9 D Coronado Rd E Airport Road at Hade 41.4 D 46.9 D 53.8 D 61.8 E Court 69.9 E Airport Road at Commerce Drive 38.6 D 52.1 D 67.9 E 85.5 F F P.M. Peak Hour Location Post Road at Airport 41.1 D 47.9 D 56.9 E 68.4 E Road 82.7 F Post Road at Coronado 44.2 D 57.3 E 70.6 E 86.7 F Road F Post Road at Off Ramp 30.9 C 40.0 D 52.6 D 68.1 E 86.3 F Post Road at On Ramp 4.7 A 4.9 A 5.2 A 5.5 A 5.9 A Post Road at Donald 17.3 B 17.9 B 19.3 B 21.7 C Avenue 23.0 C Jefferson Blvd at 78.2 E 94.0 F F F Coronado Rd F Airport Road at Hade 16.8 B 19.9 B 25.8 C 35.6 D Court 48.3 D Airport Road at Commerce Drive 15.6 B 15.3 B 16.3 B 17.6 B 19.5 B Notes: Requirements were calculated based on the draft forecasts and were not updated to reflect the final forecasts. Delay is expressed in seconds per vehicle. III-37
38 Table III-3.3 EXISTING AND PROJECTED LEVEL OF SERVICE (LOS) UNSIGNALIZED INTERSECTIONS, AIRPORT AREA ACCESS ROADS T. F. Green Airport Signalized Intersections Location Jefferson Boulevard at Airport Connector On Ramp NB Left * Jefferson Boulevard at Airport Connector Off Ramp EB Left * Jefferson Boulevard at Airport Connector Off Ramp EB Right * Location Jefferson Boulevard at Airport Connector On Ramp NB Left * Jefferson Boulevard at Airport Connector Off Ramp EB Left * Jefferson Boulevard at Airport Connector Off Ramp EB Right * A.M. Peak Hour Existing Delay LOS Delay LOS Delay LOS Delay LOS Delay LOS 9.3 A 9.6 A 9.8 A 10.2 B 10.7 B 81.7 F F F F F 10.4 B 10.6 B 10.8 B 11.1 B 11.3 B P.M. Peak Hour 14.0 B 13.5 B 14.7 B 16.3 C 18.5 C 29.3 D 26.2 D 31.5 D 41.2 E 57.7 F 14.7 B 14.0 B 14.8 B 15.8 C 17.1 C * Signals proposed as mitigation for the Warwick Intermodal Station project at the Jefferson Boulevard/Airport Connector ramp intersections will improve the Level of Service (LOS) at these currently unsignalized intersections to the B range in projection years. Notes: Requirements were calculated based on the draft forecasts and were not updated to reflect the final forecasts. Delay is expressed in seconds per vehicle. Other locations with high delay and LOS F conditions by the end of the planning period are Post Road at Airport Road and Post Road at Airport Connector in the p.m. peak hour and Airport Road at Commerce Drive in the a.m. peak hour. Traffic along Airport Road is predominantly commuter traffic traveling to and from the eastern portion of Warwick. Very little airport traffic utilizes this road east of the old terminal building. Traffic on Post Road emanating from the airport egress at Coronado Road is expected to realize a slight elevation in LOS during peak hours due to the relocation of rental car operations to the proposed Warwick Intermodal Station. This relocation will eliminate III-38
39 shuttle bus trips to offsite rental car facilities via Post Road. This slight decrease in volume results in a one to two percent drop in overall Post Road traffic volume during p.m. peak hour arterial traffic. Terminal Area Roadways The major terminal area roadway is the Terminal Loop Road that extends from the Airport Connector terminus and encircles short-term parking. This roadway provides direct access to short-term parking and curbside access to the arrival level of the airport terminal. This road continues from the terminal and provides access to and egress from the three parking garages located to the north of the terminal. It then loops around, merging with the departure drop-off ramp and short-term lot egress back to the Airport Connector terminus intersection. The Terminal Loop Road provides direct access onto Post Road at Coronado Road along the northwest corner prior to the ramp/parking merge. LOS for the airport signalized intersection is presented in Table III-3.4. Many of the approach roadways to this intersection have dedicated right, left, or through lanes and limited storage areas, resulting in low LOS in the D to F range as passenger levels approach six million annually. The airport intersection is barely operating at an acceptable level of service now and will need improvements over the next several years as traffic increases to over six million passengers annually. Table III.3-4 EXISTING AND PROJECTED LEVEL OF SERVICE (LOS) SIGNALIZED INTERSECTION, TERMINAL AREA ROADWAYS (P.M. PEAK HOUR) T. F. Green Airport Signalized Intersection Existing Delay LOS Delay LOS Delay LOS Delay LOS Delay LOS Internal Intersection at Short-term Parking 50.5 D 55.7 E 96.3 F F F Notes: Requirements were calculated based on the draft forecasts and were not updated to reflect the final forecasts. Delay is expressed in seconds per vehicle. The airport entrance on Post Road at Donald Avenue provides access to the terminal via the Airport Connector. It links to the upper departure level, the long-term parking surface lot, and connects into the Terminal Loop Road and the Airport Connector terminus. As indicated in Table III.3-2, Post Road at Donald Avenue will operate at an acceptable LOS through The airport delivery entrance is located at the rear of the RIAC garage, with a signalized intersection on Airport Road. This roadway provides access and egress for fuel deliveries, rental car storage, and maintenance operations north of Airport Road at the Senator Street lot, and to other rental car locations on Post Road. This road is adjacent III-39
40 and parallel to the northwest corner of Runway This signal is actuated by traffic exiting Delivery Road and actually functions as a stop sign for right-turning traffic. The current traffic signal requires an upgrade to better handle exiting traffic from Delivery Drive. The loop detection on the Delivery Drive approach is inadequate to cover some right-turning traffic. III.3.2 Curbfront Facilities Detailed curbfront requirements were developed prior to the attacks of September 11, 2001 and can be found in Appendix E, Curbfront Requirements. This analysis determined that based on operating procedures in place in 2000 and 2001, additional curb capacity would be needed in the 20-year planning horizon. The analysis found that minor changes in the operating procedures of the curbfront would allow it to serve forecast demand. There have been many changes in the way the curbfront operates since September 11 that have actually improved the capacity of the curbfront. For example, vehicles are no longer permitted to stand at the curb if they are not actively loading or unloading (this is enforced by police officers). In addition, no more than three taxi cabs are permitted to queue at the curb, all others must wait in a holding area. Provided these procedures remain in place, the curbfront will be sufficient to serve forecast demand through However, because security regulations are still evolving, the curbfront capacity should be closely monitored to assess future needs. It is important to note that as the terminal building expands, additional curbfront areas will likely be provided which will improve the level of convenience for passengers. III.3.3 Public Parking Facilities There are two types of public parking facilities at T. F. Green: short-term and long-term parking. Short-term parking generally consists of vehicles parking for less than five hours. Long-term parking is for vehicles with day-long, overnight, or longer stays and is generally less expensive than short-term parking. It is important to note that parking demand is elastic. The demand for a particular lot can change substantially with changes in the price structure. RIAC may be able to manage some future parking capacity deficits by adjusting the price structure of their parking facilities. For purposes of this analysis, the pricing structure is assumed to remain the same as it is today. This does not imply that prices will not change in the future; rather, it assumes the relative cost of one facility to another and to off-airport competitors will remain constant. Typically in a parking facility requirement analysis, the existing demand for parking spaces is obtained from the operators of the parking facilities. Future demand is then projected by increasing the existing demand at the same rate as forecast enplanements. In this case, demand for the existing parking facilities could not be III-40
41 quantified because the parking concession operators at T. F. Green consider that information proprietary. As a result, future demand was estimated based on other methodologies. Existing Public Parking Facilities The existing public parking facilities are shown on Exhibit III.3-3. Long-term public parking is accommodated in a 4,700-space vehicle surface lot along the southern edge of the RIAC property, and in the 1,500-space Red Beam Garage, the 1,460-space RIAC garage, and the 750-space valet garage, located immediately west of the terminal building along the Terminal Loop Road. Short-term hourly parking is located within the 650-space surface lot located in the front of the terminal building within the Terminal Loop Road. Some of the spaces in the short-term lot are no longer available due to security regulations enacted after September The three largest rental car companies currently use 156 parking spaces in the first level of the RIAC garage for ready/return parking. It is assumed that all rental car functions will be relocated to the proposed Warwick Intermodal Facility by mid-2005, allowing long-term parking to expand into the first level of the garage. Employees currently use portions of the short- and long-term parking lots. RIAC sources estimate that employee parking occupies approximately 30 percent of the longterm lot (1,410 spaces). Senior airport administration staff currently park in 18 spaces within the RIAC garage. Considering the other uses in the long-term parking facilities, 6, of the 8,410 spaces are available for public parking. In summary, there were 650 short-term and 6,800 long-term public parking spaces available on-airport property in In addition to the on-airport parking facilities, there are also 3,850 parking spaces in off-airport, privately owned, public parking facilities. This results in 10,650 public parking spaces for use by T. F. Green passengers. RIAC has no control over the privately owned, off-airport facilities so these facilities were not included in this analysis. The exception to this is the Red Beam Garage, which is not owned by RIAC. This garage is immediately adjacent to airport property, functions as an airport garage, and is not likely to be redeveloped for other uses. Therefore, this garage was included in the analysis of public parking facilities No parking within 300 feet of the terminal building. The 6,800 spaces includes parking by airport administration staff, which represents a small portion of the demand in the garage. III-41
42 Short-term Parking The short-term parking demand/capacity relationship and resulting requirements are shown in Table III.3-5. Future short-term parking demand was derived by first estimating peak hour parking demand, which is assumed to be 10 percent of PMAD passengers. The peak hour parking demand was then multiplied by the percentage of passengers using personal vehicles (60 percent, as indicated in Table A-8 of Appendix A, Survey Results), by the short-term lot usage (27 percent, as indicated in Table A-11, in Appendix A, Parking Lot Distribution), divided by the average passengers per vehicle (1.8, as indicated in Table A-9 in Appendix A, Average Number of Air Passenger Per Personal/Company Rental Car). Peak hour demand for the short-term parking lot is expected to average less than 50 percent utilization throughout the planning period. Therefore, the short-term parking lot is sufficient to accommodate forecast demand through Even with the loss in spaces due to regulations enacted in response to the terrorist attacks of September 11, 2001, this lot is still projected to be sufficient through RIAC is currently developing restricted egress employee or trusted agent parking within the area of the short-term parking lot that falls within 300 feet of the terminal in order to make use of the lost spaces. Table III.3-5 SHORT-TERM PUBLIC PARKING REQUIREMENTS T. F. Green Airport Short-Term Public Parking (spaces) PMAD Peak Hour % Personal Short-term Pass./ Surplus/ Pass. Demand 1 Cars 2 Lot Usage 3 Vehicle 4 Demand Capacity (Deficit) Year 5 20,748 2,075 60% 27% ,760 2,476 60% 27% ,816 2,882 60% 27% ,508 3,551 60% 27% Peak hour parking demand is assumed to be 10 percent of PMAD passengers. Based on survey results see Appendix A, Table A-8. Based on survey results see Appendix A, Table A-11. Based on survey results see Appendix A, Table A-9. Requirements were calculated based on the draft forecasts and were not updated to reflect the final forecasts. III-42
43 Long-term Parking As discussed previously, there are a total of 8,410 parking spaces in the on-airport long-term parking facilities, of which 6,800 are available for long-term parking. Presently, 1,610 spaces in the long-term parking facilities are used for rental car and employee parking. 18 The first priority for RIAC with regard to auto parking is to provide convenient public parking spaces for airline passengers. Public parking is an important revenue source for the airport and the use of these facilities for passengers should be maximized. As demand for the long-term parking facilities increases, it will be necessary for RIAC to relocate the rental car and employee parking functions. There are already plans to relocate the rental car functions to the proposed Warwick Intermodal Facility. Employee parking needs will be discussed in Section III.3.4, Employee Parking Facilities. For purposes of this analysis, it is assumed that all parking spaces in the long-term parking facilities are available for passenger parking in the future. The exception to this is airport administration staff parking in the RIAC garage. This use is expected to continue in the future and represents a minor portion of the overall parking demand. Demand for all long-term parking facilities was combined and evaluated in aggregate. Some facilities may have lower or higher utilization rates than others but it was assumed that the use of all long-term parking facilities would be optimized before new lots or garages are constructed. Use of the facilities can be controlled through pricing. As stated previously, existing parking facility demand was not available. Therefore, for the purposes of establishing future demand levels, a ratio of parking spaces to demand levels was used. Future long-term parking demand was calculated based on a ratio of 2.5 spaces per 1,000 enplanements. This ratio is representative of other parking studies conducted at airports similar in size to T. F. Green. At some medium to small hubs, the total long-term parking spaces available tends to be closer to 3.5 spaces per 1,000 enplanements. Parking ratios are typically lower at larger hub airports due to greater utilization of alternative ground transportation modes compared to private cars (including bus, taxi, limousine, and future Amtrak and MBTA service to Providence and Boston). Often, Rhode Island passengers are dropped off and picked up at the airport by family or friends to avoid paying long-term parking fees, especially for leisure trips. With a small state, in which all areas are within 45 minutes of the airport, this trend is expected to continue. As enplanements grow at T. F. Green in the future, it would be expected that the ratio of total required spaces would decline over the planning period. T. F. Green Airport is a medium-hub airport that is growing into a large-hub airport. Considering recent and projected growth at T. F. Green and the habits of its passengers, a ratio of 2.5 spaces per 1,000 enplanements is appropriate for projecting future long-term parking demand. 18 Does not include airport administration parking in the RIAC garage. III-43
44 Table III.3-6 provides the long-term parking demand/capacity analysis. By 2005, all of the public parking spaces will be needed for passenger use and employee parking will be displaced from the long-term lot. By 2020, a total of 13,500 parking spaces will be required, resulting in a deficit of 5,090 spaces. These projections were calculated based on the draft forecasts. Based on the updated final forecasts, the 2005 requirements identified in the table will likely occur two to three years later. The 2010 projections could shift one to two years and the 2015 requirements could shift one year. The 2020 final forecasts were virtually unchanged from the original projections, so the 2020 long-term parking facility requirements are valid. The first major expansion of the long-term parking facilities will be needed once annual passenger enplanements exceed 3.5 million (projected to occur by based on the final forecasts). Table III.3-6 LONG-TERM PUBLIC PARKING REQUIREMENTS T. F. Green Airport Long-Term Public Parking (spaces) Annual Enplanements Demand 1 Capacity 2 Surplus/ (Deficit) Utilization Year 3 3,350,700 8,400 8, % ,998,800 10,000 8,410 (1,590) 119% ,653,900 11,600 8,410 (3,190) 138% ,411,400 13,500 8,410 (5,090) 161% Future long-term parking demand is based on a ratio of 2.5 parking spaces per 1,000 enplanements. Based on 4,700 spaces in the long-term lot, 1,500 spaces in the Red Beam Garage, 1,460 spaces in the RIAC garage, and 750 spaces in the valet garage. Requirements were calculated based on the draft forecasts and were not updated to reflect the final forecasts. III.3.4 Employee Parking Facilities There are currently no designated employee parking lots at T. F. Green Airport. Most employees park within the long-term surface lot (employees use approximately 1,410 parking spaces in this lot). Employees are transported to and from the terminal via airport shuttle busses, which are primarily used to transport passengers. The analysis presented in Section III.3.3, Public Parking Facilities, determined that all of the long-term parking facilities will be needed for passenger use by 2005 and will no longer be able to accommodate employee parking. This will thereby reduce the supply of available employee parking. It is a typical industry standard for employees to park in a dedicated remote lot, rather than in the public parking lots, which provide revenue for the airport. Based on RIAC data, there are approximately 1,400 employees working in the terminal at T. F. Green, including T. F. Green terminal staff, airline employees, and staff of private concessions and tenants. Not all employees park at the same time due to use III-44
45 of different shifts, vacations, etc. According to RIAC, approximately 75 percent of the employee workforce uses the parking facilities at the same time. This occurs between 7:00 a.m. and 4:00 p.m. on weekdays. In addition, employees from other facilities on the airport (such as the hangars on the Northeast and Northwest ramps) also park in the long-term lot. RIAC estimates that approximately 1,410 employees park in the longterm lot. Future employee demand levels were determined by applying the growth rate of forecast enplanements to the existing employee parking demand. The facility requirements for employee parking are shown in Table III.3-7. By 2020, a total of 2,800 employee parking spaces will be needed. Based on the updated final forecasts, the 2005 requirements will likely occur two to three years later. The 2010 projections could shift one to two years and the 2015 requirements could shift one year. The 2020 final forecasts were virtually unchanged from the original projections, so the 2020 employee parking facility requirements are valid. Once annual enplanement levels exceed six million (around 2005) employees will no longer be able to park in the long-term lot and a dedicated lot will be required for employee parking. Table III.3-7 EMPLOYEE PARKING REQUIREMENTS T. F. Green Airport 1 Employee Parking (spaces) Annual Enplanements % Increase in Enplanements Demand 1 Capacity 2 Surplus/ (Deficit) Year 3 2,715,469 N/A 1,410 1, ,350, % 1,750 0 (1,750) ,998, % 2,100 0 (2,100) ,653, % 2,400 0 (2,400) ,411, % 2,800 0 (2,800) 2020 RIAC estimates that 1,410 employees currently park in the long-term lot. 2 Approximately 30 percent of the long-term lot was available for employee parking in It is assumed that employees can no longer park in this lot after 2005 as it will be needed to accommodate passenger parking. 3 Requirements were calculated based on the draft forecasts and were not updated to reflect the final forecasts. Source: RIAC staff III.3.5 Rental Car Facilities The ease with which rental car customers may rent and return cars is an important factor in the air passenger s satisfaction with T. F. Green Airport. As indicated in Chapter I, Inventory, Section I.5.3, Landside Facilities, three rental car firms are located in the RIAC garage, adjacent to the terminal, while the remaining six are located off-airport in the vicinity of Post Road and Jefferson Boulevard. III-45
46 Rental car firms located in the RIAC garage are currently constrained. According to a detailed survey of rental car companies conducted by RIAC in September 2000, only 39 rental car storage spaces are available in the garage (most of the available spaces are used for ready/return). These firms have additional storage capacity off-site, requiring the movement of cars between the garage and the lots north and west of the airport, via Delivery Road and Airport Road. Table III.3-8 presents existing and future rental car needs as provided by the rental car companies. RIDOT and RIAC are proceeding with plans to relocate all nine rental car firms to the proposed Warwick Intermodal Station on Jefferson Boulevard. This garage will accommodate ready/return and Quick Turn Around (QTA) facilities for fueling and car washes. The garage is also planned to accommodate rental car/commuter rail parking. With connection via a proposed 1,700-foot automated people mover to the airport terminal, the station will function as a new front door to the airport for both rail passengers and rental car customers. The purpose of consolidation of all rental car activities is to provide the following benefits: Eliminate the need for shuttle service to off-airport locations Free up garage space in the RIAC garage for passenger parking Reduce on-airport and Post Road rental car traffic while providing access to the Airport Connector and I-95 via Jefferson Boulevard III.4 Air Cargo Facilities Air cargo encompasses two separate entities at T. F. Green that are defined by their means of transportation: integrated carrier cargo and belly cargo. Integrated cargo carriers provide air transportation as part of a single, seamless, door-to-door product that includes pickup, transportation and delivery, insurance, tracing, customs clearance, and other functions. United Parcel Service (UPS), Federal Express, and Airborne Express are the current integrated cargo carriers at T. F. Green. These carriers operate aircraft that carry only cargo. Belly cargo is a by-product of the passenger airlines that have room to carry cargo in the under-side baggage compartments of their scheduled flights. This type of cargo is typically handled by the airlines themselves, or by a third-party contractor, who may offer a variety of handling services including delivery. The United States Postal Service (USPS) is a primary user of belly cargo capacity. III-46
47 Table III.3-8 PROJECTED RENTAL CAR REQUIREMENTS T. F. Green Airport Rentals 565, , ,988 1,124,231 Average Day 1,548 1,839 2,184 3,080 Maximum Day 2,260 2,684 3,188 4,497 Ready/Return Spaces ,214 Storage Spaces 904 1,074 1,275 1,799 Total Spaces 1,514 1,798 2,136 3,013 Total Equivalent Spaces* 1,179 1,400 1,663 2,345 Nozzles Wash Bays Hertz Ready/Return Hertz Storage Hertz Total Equivalent* Avis Ready/Return Avis Storage Avis Total Equivalent* Budget Ready/Return Budget Storage Budget Total Equivalent* Alamo Ready/Return Alamo Storage Alamo Total Equivalent* National Ready/Return National Storage National Total Equivalent* Thrifty Ready/Return Thrifty Storage Thrifty Total Equivalent* Dollar Ready/Return Dollar Storage Dollar Total Equivalent* Enterprise Ready/Return Enterprise Storage Enterprise Total Equivalent* Small Company Ready/Return Small Company Storage Small Company Total Equivalent* * Ready and return spaces require approximately 350 square feet per space. Storage spaces require approximately 220 square feet per space. Therefore, one ready and return space is equivalent to 1.59 storage spaces. Total equivalent spaces are based on the ready and return spaces plus 62.86% of the storage spaces. Source: RIAC Rental Car Survey, September 2000 III-47
48 Future facility requirements for integrated cargo carriers and belly cargo have been determined for building facilities and landside facilities, as well as for the integrated cargo carriers airside facilities. These requirements are discussed in the sections that follow. III.4.1 Integrated Cargo Carrier Facilities As shown in Exhibit III.4-1, the facilities for the integrated cargo carriers (UPS, Federal Express, and Airborne Express) are located on the Northeast Ramp at T. F. Green and are comprised of one half of Hangar #2, airside apron space, and landside truck/auto parking areas. Several important factors regarding these carriers operations at T. F. Green include: Airborne Express leases its apron space from Northstar Aviation to accommodate a single cargo aircraft (typically a DC-9) as well as its associated Ground Support Equipment (GSE). This aircraft is typically parked on the ramp throughout the daytime. All cargo is off-loaded to trucks from the ramp and sent to nearby sort facilities in both Cranston and Coventry, Rhode Island for processing. This type of operation is typical of Airborne Express at other airports and they have not expressed any interest in establishing a permanent sort facility at T. F. Green. The only facility that Airborne Express currently maintains at T. F. Green is an office located in Hangar #2 for its aircraft maintenance staff. Like Airborne Express, UPS also leases its apron space from Northstar Aviation to accommodate a single cargo aircraft (typically a B-757) as well as its associated GSE. Its aircraft is also typically parked on the ramp throughout the daytime. All cargo is off-loaded to trucks from the ramp and sent for processing to a large sort facility that is located within Warwick and very close to T. F. Green. While UPS will establish sort facilities on an airport if there are appropriate economic benefits, it has not expressed any interest in establishing a permanent sort facility at T. F. Green. Similar to Airborne Express, the only facility that UPS currently maintains at the airport is an office located in Hangar #2 for its aircraft maintenance staff. Federal Express leases the northern half of Hangar #2 from RIAC as well as apron space from Northstar Aviation. Unlike the other carriers, Federal Express does not have any sort facilities nearby, and therefore must conduct a ramp sort of cargo before loading it on trucks bound for Hartford, Connecticut; Franklin, Massachusetts; Brockton, Massachusetts; and other out-of-state facilities for processing. The area in Hangar #2, leased from RIAC, is used to conduct this limited sorting of cargo, as well as for storage of equipment. Federal Express will establish sort facilities on an airport given appropriate economic benefits. They have expressed a desire to expand their existing limited sort operation to a full sort facility at T. F. Green. III-48
49 Federal Express typically utilizes a B aircraft at T. F. Green (with an additional B during peak demand periods, such as the winter holiday season), as well as three Cessna 208 Caravan feeder aircraft. All aircraft are parked on the ramp throughout the daytime. Federal Express has also indicated that they may ultimately replace one of the B-727s with an A300 if the demand warrants it. In addition to the airport s existing cargo facilities, RIAC is also exploring development opportunities for an airport-owned parcel, known locally as Aeroland. Located south of Runway 34 and abutting the ATCT, Aeroland is a acre site having direct landside access to Industrial Drive, as well as potential airfield access via a new taxiway stub to Taxiway C. The intent of developing this site is to effectively shift all of the existing integrated cargo carriers from the Northeast Ramp to Aeroland, including accommodating Federal Express desire to develop a full sort facility at T. F. Green. A private developer is working with RIAC to actively explore this possibility, however, the process is still in the early stages. Issues relating to wetlands, culverting a stream for the taxiway crossing, and ancillary issues related to abutting industrial development, including the closed Truk-A-Way landfill site, will all need to be addressed to establish the site s ultimate development viability as a cargo facility. The Aeroland development will be considered in Chapter IV, Alternatives. Below is a discussion of the building, airside, and landside facility requirements for the integrated carriers. Building Facilities While neither Airborne Express nor UPS is likely to pursue developing a cargo handling or sort operation at T. F. Green because of the close proximity of existing facilities, they will likely continue to maintain limited office space at T. F. Green. As a result, and due to Federal Express stated interest in establishing a full sort facility at T. F. Green, the development of the building space requirements were based primarily on those of Federal Express. As such, it has been noted through discussions with Federal Express that a minimum building size for a full sort facility to accommodate cargo loads at T. F. Green for 2000 would be 20,000 square feet, and that this would be sufficient for approximately 10 years, at which time a total of 30,000 square feet would be required. For purposes of this analysis, this information was used as input for the development of a tonnage per area ratio (TAR) for T. F. Green, defined in units of total annual tons of freight per square foot of cargo floor space. This ratio can then be compared to a derived maximum TAR value, which will typically range from 0.5 tons/square foot to 2.0 tons/square foot, with the latter being representative of a highly efficient automated sort operation. Achieving a higher value of TAR is dependent upon the degree of mechanization, the layout of the building, the type of cargo (international versus domestic; refrigerated, etc.) and on how the cargo is typically packaged for III-49
50 shipping (i.e. pallets, containers, etc.). The determination of a maximum TAR value for the T. F. Green facilities involved a comparison of recommended planning ratios and the existing operational environment, as well as from direct input from Federal Express. In 2000, the TAR for T. F. Green was However, this number reflects existing cargo operations only, and does not consider the spatial requirements for the development of a full sort facility operation. In order to account for this shift in the type of cargo operations being conducted by Federal Express, a maximum TAR value of 0.82 was utilized. This revised value accommodates both the increased spatial requirements of Federal Express, while accounting for the existing level of operations for the remaining two carriers. The maximum TAR values and the forecast air freight tonnage were used to derive the amount of building area required to accommodate future demand levels. These requirements were then compared to the existing building square footage to determine if a surplus or deficit will be experienced throughout the forecast period. Table III.4-1 shows that a total of 20,500 square feet of building would be required in 2000 for a sort operation for Federal Express. This results in a deficit of 1,100 feet. When freight volumes reach over 26,000 tons annually, this building size deficit will grow to 13,200 square feet (projected to occur in 2010 based on the final forecasts). Freight volumes in excess of 40,000 tons will result in a deficit of 29,800 square feet in building area and a total building requirement of 49,200 square feet (projected to occur in 2020 based on the final forecasts). Table III.4-1 INTEGRATED CARGO CARRIER FACILITY REQUIREMENTS T. F. Green Airport Existing Building Area Tons of Facility Maximum Required with Surplus/ Air Freight TAR Value 1 TAR Value 2 Max TAR Value (Deficit) Year (U.S. tons) (square feet) (square feet) 16, ,500 (1,100) , ,400 (6,000) , ,600 (13,200) , ,500 (21,100) , ,200 (29,800) Building Area Available: 19,400 square feet 1 2 Tons of freight divided by the available building area. Maximum TAR value based on industry standards and on discussions with integrated cargo carrier personnel. III-50
51 It is important to note that the existing building area is comprised of various sections of RIAC s Hangar #2 and is not appropriate for use as a sort facility. The proposed Aeroland development would be able to accommodate all of the projected building facility requirements for the integrated cargo carriers throughout the planning period. Airside Facilities The aircraft apron areas associated with the integrated cargo carriers were analyzed based on existing and future demand levels to assess the adequacy of the existing facilities to accommodate those demands. The number of PMAD all-cargo aircraft for each forecast year was used to determine the required apron areas. The cargo aircraft were broken down into two categories: air carrier and commuter. The air carrier aircraft category consists of the larger cargo aircraft, including the DC-9, B , B-757, and A300, while the commuter aircraft category is limited to the smaller, Cessna 208-B Caravan aircraft. For planning purposes, a total of 6,200 square yards was used as a standard area requirement for each air carrier aircraft, while 1,200 square yards was used for each commuter aircraft. These parking envelopes incorporate standard wingtip clearances and allow room for GSE, as well as room for a taxilane servicing the area. Table III.4-2 shows that there is cargo apron surplus in 2000 of approximately 6,000 square yards. However, as freight volumes increase to over 20,000 tons annually (projected to occur by 2005), additional apron space will be needed. By 2020, freight volumes are expected to exceed 40,000 tons annually and an additional 25,000 square yards of apron will be needed, resulting in a total apron area of 53,200 square yards (based on the final forecasts). The proposed Aeroland development would be able to accommodate this requirement throughout the planning period. Landside Facilities The truck/auto areas associated with the integrated cargo carriers facilities were analyzed on the basis of a ratio of truck/auto area to building area. Discussions with the personnel from all three carriers indicated that existing accommodations were marginally adequate for their current operations. Most concerns centered on the inefficient layout of the current space available. Layout issues aside, the current ratio of truck/auto area to building area of approximately 1.4 is considered adequate for determining future requirements. This ratio also coincides with the truck/auto requirements stipulated by Federal Express for the establishment of the 20,000-square foot sort facility described earlier. III-51
52 Table III.4-2 INTEGRATED CARGO CARRIER APRON REQUIREMENTS T. F. Green Airport PMAD Air PMAD Tons of Carrier 1 Commuter 2 Apron Area Surplus/ Air Freight Operations Operations Required 3 (Deficit) Year (U.S. tons) (square yards) (square yards) 16, ,200 6, , ,400 (200) , ,600 (6,400) , ,800 (12,600) , ,200 (25,000) Apron Area Available: 28,200 square yards Air carrier aircraft include B , B757, DC-9, and A300. Commuter aircraft include the Cessna 208 Caravan. Apron area required assumes 6,200 square yards for air carrier aircraft and 1,200 square yards for commuter aircraft. Square yards per aircraft includes standard wingtip clearances, allows room for GSE, and taxilane clearances. To determine the future truck/auto requirements, this existing building area to parking area ratio was multiplied by the projected building area requirements shown previously in Table III.4-2. Table III.4-3 displays the resulting truck/auto area requirements for the current and forecast years. Based on Federal Express interest in developing a full sort facility at T. F. Green, there is currently a deficit of 1,700 square feet of truck/auto parking area. By 2020, a total of 68,900 square feet will be needed, 41,900 square feet more than what is currently available. Based on the final forecasts, the proposed Aeroland development would be able to accommodate this requirement throughout the planning period. III.4.2 Belly Cargo Facilities As noted in Chapter II, Forecasts of Aviation Demand, Section II.3.4, Forecasts of Cargo Volumes, most passenger airlines accommodate air freight as a by-product to the primary activity of carrying passengers. This air freight is contained within the available belly space of an aircraft that would otherwise be left empty. The incremental costs of carrying belly cargo in a passenger aircraft are negligible, and include only ground handling expenses and a modest increase in fuel consumption. III-52
53 Table III.4-3 INTEGRATED CARGO CARRIER TRUCK/AUTO REQUIREMENTS T. F. Green Airport Projected Existing Parking Building Area Area to Building Area Surplus/ Requirement Area Ratio Required (Deficit) Year (square feet) (square feet) (square feet) 20, ,700 (1,700) , ,600 (8,600) , ,600 (18,600) , ,700 (29,700) , ,900 (41,900) Area Available: 27,000 square feet Source: RIAC and Federal Express. The amount of belly cargo at an airport is largely dependent on the available volume and weight lift provided by the aircraft that serve the airport. At high passenger load factors there is less lift to sell for cargo because the passengers luggage is occupying space that could be used for cargo. The exception to this is mail, which is often transported under contracts with the airlines, displacing other air cargo in favor of the contract commitment (i.e. mail has priority so it is not supply limited). As shown in Exhibit III.4-2, two facilities at T. F. Green process belly cargo. The first is an 18,000-square foot building located south of the terminal building that is also used for GSE maintenance. Approximately 6,700 square feet of the building and 480 square yards of airside apron is used for processing belly cargo. An additional 5,400 square feet landside is used for shipping/receiving operations. The second facility is the USPS facility, which is located adjacent to the GSE Maintenance/Belly Cargo building. This building is 2,100 square feet and has a 940-square yard apron area used for the storage of mail handling bins and shipping/receiving operations. Passenger Airlines Requirements Building requirements for the handling and processing of belly cargo (excluding mail) are based strictly on the forecast availability of belly cargo capacity, as detailed in Table II As total operations and average aircraft size increase in future years, the amount of belly cargo is expected to increase accordingly. Through 2010, the average amount of cargo that can be accommodated on the passenger aircraft is expected to increase marginally. Therefore, future belly cargo building requirements are expected to increase at the same rate as the overall growth in the belly cargo capacity through Belly cargo capacity will see significant increases beyond 2010 as B-767 or equivalent widebody aircraft are expected to begin operating at the airport. These aircraft will offer palletized capacity, offering substantial tariff and handling economies, and creating new demands on future facility requirements. At this point, in order to III-53
54 account for the greater cargo handling capacity, an additional 25 percent annual growth factor was incorporated. Beyond 2010, future requirements are expected to increase at the same rate as the overall growth in departures. As shown in Table III.4-4, the belly cargo facility is currently operating at about 70 percent of capacity. As such, it is projected that a surplus of space will exist until 2010, when the combination of higher annual growth rates in operations and the introduction of widebody aircraft with palletized cargo will start to have a significant impact. When belly capacity reaches over 4,000 tons annually there is projected to be a deficit of 4,500 square feet in belly cargo building space. As belly cargo capacity increases to 8,000 tons annually in 2020, there will be a requirement for an additional 17,900 square feet of building area. The 2000 truck/auto areas associated with the belly cargo facilities were analyzed on a ratio of truck/auto area to building area. Discussions with facility personnel indicated that existing accommodations were adequate for their facility. Therefore, the current ratio of truck/auto area to building area of approximately 1.4 is considered adequate for determining future requirements. However, it is also important to note that facility employees must park in one of T. F. Green s long-term parking lots, and not at the actual facility itself. Therefore employee parking has not been considered in this particular analysis, although it was considered in Section III.3.4, Employee Parking Facilities. Table III.4-4 BELLY CARGO BUILDING REQUIREMENTS T. F. Green Airport Belly Capacity Average Annual Compound Growth Rate Building Requirement 1 Surplus/ (Deficit) Year 2 (U.S. tons) (square feet) (square feet) 1,750-4,700 2, , % 5,500 1, , % 11,200 (4,500) , % 11,400 (4,700) , % 24,600 (17,900) Belly Cargo Area Available: 6,700 square feet) 1 2 The belly cargo building requirement is expected to increase at the same rate as belly cargo capacity. Area increased by 25 percent growth factor in 2010 to account for introduction of B-767 aircraft. Requirements were calculated based on the draft forecasts and were not updated to reflect the final forecasts. Source: RIAC, Quantum, and Delta Airlines. III-54
55 Table III.4-5 displays the resulting truck/auto area requirements for the current and forecast years. As shown, there will be a surplus of area until 2010, by which time there will be a deficit of 6,300 square feet. This deficit will ultimately increase to 25,100 square feet in 2020 when 34,500 square feet of truck/auto parking area will be required. The belly cargo facility requirements were calculated based on the draft forecasts. Based on the final forecasts, the timing of the suggested improvements in this chapter may be off by a few years. Belly cargo is a function of the available volume and weight "lift" provided by the aircraft that serve the airport over the planning period. Belly cargo capacity was adjusted due to the revisions in the passenger forecasts over the planning period. As a result, the 2005 requirement for belly capacity will likely occur one year later. The 2010 projections were virtually unchanged from the original projections, so the 2010 belly capacity requirement is valid. The draft forecasts predicted very minimal growth in belly cargo volumes from 2010 to 2015 whereas the final forecasts show more of an increase. Therefore, in 2015 there will likely be an increase in the requirement for belly cargo facilities. The 2020 requirements identified in this chapter could occur one year sooner than identified. Belly cargo capacity will trigger the need to expand the belly cargo facilities and should be closely monitored to determine when additional facilities are needed. Belly cargo volumes in excess of 4,000 tons will trigger the need to expand the belly cargo facility. Table III.4-5 BELLY CARGO TRUCK/AUTO REQUIREMENTS T. F. Green Airport Projected Existing Parking Building Area Area to Building Area Surplus/ Requirement Area Ratio Required 1 (Deficit) Year 2 (square feet) (square feet) (square feet) 4, ,600 2, ,500 1,4 7,700 1, , ,000 (6,300) , ,000 (6,600) , ,500 (25,100) Area Available: 9,400 square feet) 1 2 Does not include employee parking which is accommodated in the long-term parking facilities. Requirements were calculated based on the draft forecasts and were not updated to reflect the final forecasts. Source: RIAC, Quantum, and Delta Airlines. III-55
56 USPS Requirements 19 Air mail volume is a specific element of belly cargo and is a function of general postal volume trends. Like air cargo, it also depends on the available lift capacity on the air carriers aircraft, only to a lesser degree. Mail is often transported under contracts with the airlines, displacing other air cargo in favor of the contract commitment. It is important to note that the significant upgrade in lift capability generated by widebody service will not necessarily have as significant an impact on the air mail facility in that bulk lift capacity has historically only been a consideration at T. F. Green at the specific, limited times of the year of peak mail volumes. The current air mail facility (2,100 square feet) is currently undersized for sort operations and for the storage of bins. USPS representatives have indicated to RIAC that they will require a 14,000-square foot building, which will be sufficient throughout the planning period. The 2000 truck/auto areas associated with the air mail facility were also analyzed on a ratio of truck/auto area to building area following discussions with USPS personnel. It was determined that the existing parking and apron facilities (totaling 8,500 square feet) were adequate for the sizing of the facility. However, it was also noted that the current ratio of truck/auto area to building area of approximately 2.0 was considered high, due to the small size of the overall facility. With a 14,000-square foot building, this ratio is projected to decrease to 1.4. This ratio results in a requirement for 10,000 square feet of truck/auto area (a deficit of 1,500 square feet) to serve demand through As with the belly cargo facility, employees must park in one of T. F. Green s long-term parking lots, and not at the actual facility itself. Therefore, employee parking has not been considered in this particular analysis. III.5 General Aviation Facilities This section reviews the spatial requirements for general aviation building areas, aircraft parking, and auto parking facilities at T. F. Green. The FAA defines general aviation as encompassing all aviation activity except that of air carriers certified in accordance with FAR Parts 121, 123, 127, and 135, excluding military aircraft. Within this broad definition of general aviation, there are a number of sub-categories that further define general aviation aircraft and operations. Some of these categories include: corporate/executive users; business users; personal users; aerial application users; instructional users; charter users; industrial/special users; and rental users. The process for determining general aviation facility requirements is based upon the forecast demand for general aviation and the ability of the existing facilities to accommodate this demand. As noted in Chapter II, Forecasts of Aviation Demand, 19 At the time this chapter was written, the USPS was operating at T. F. Green Airport. Since that time, USPS has ceased operation and has no current plans to continue service. However, the discussion of USPS service is retained in this chapter in the event that USPS would initiate service again at T. F. Green Airport. III-56
57 Section II.3.5, Forecasts of Aircraft Operations Demand, it was assumed that local general aviation operations at T. F. Green would remain constant throughout the forecasting period, but that the airport would experience a continued moderate growth of itinerant corporate and business aircraft. Therefore, the forecast of general aviation operations for T. F. Green assumed a combined (local and itinerant) annual growth rate for general aviation operations of 0.8 percent. III.5.1 Existing General Aviation Facilities As noted in Chapter I, Inventory, Section I.5.4, Support Facilities, and shown on Exhibit III.5-1, the existing general aviation facilities at T. F. Green are spread out along the Northeast and Northwest ramps and are intermixed with airport operations and air cargo facilities. The general aviation facilities include two Fixed Base Operator (FBO) hangars, four corporate hangars, and three RIAC-owned general hangars, all of which are accessible only from Airport Road. Basic flying services such as fueling, aircraft storage, and general support services for both local and itinerant general aviation are provided by Northstar Aviation, one of the two FBOs with a hangar. The other FBO hangar is operated by Quality Aviation, which provides aircraft (primarily helicopter) maintenance and general avionics repair. Two additional FBOs, P T Aero Service Inc. and ADS Aviation Maintenance, Inc., operate out of Hangars #1 and #2 respectively. They also provide general aircraft maintenance services. Aircraft rental, charter, and flight instruction are provided by T. F. Green s remaining two FBOs, Horizon Aviation Inc. and Corporate Air Charter Inc., both of which operate out of Hangar #1. Two corporate hangars are operated by Fleet and CVS. The remaining two corporate hangars are operated by Textron. The RIAC-owned Hangars #1 and #2 provide general aeronautical office, service, and hangar storage rental spaces. They are utilized by a variety of operators, including the smaller FBOs, as noted above, and Federal Express, who leases half of the storage area of Hangar #2. Hangar #3 contains the RIAC aeronautics inspection offices, as well as the state of Rhode Island s helicopter and single-engine aircraft. Of special note is Hangar #1, which is the western-most hangar and is located near the threshold of Runway 16. This hangar has been determined to be a penetration of T. F. Green s FAR Part 77 imaginary surfaces, and, as such, has been slated to be eventually demolished. In addition, while the offices and smaller, ancillary hangar spaces in Hangar #1 are currently occupied by FBOs, the main hangar area (approximately 30,000 square feet) is presently vacant. In total, the general aviation facilities currently provide 139,500 square feet of building space at T. F. Green. However, it is assumed that this number will be reduced to approximately 86,300 square feet with the likely demolition of Hangar #1 by The aircraft parking area currently available for general aviation activity consists of approximately 21,100 square yards. It is important to note that this total area is divided into six, separate areas scattered across the Northeast and Northwest ramps and tends III-57
58 to be small or odd-shaped. As such, the overall layout of this total area is very inefficient in that much more area is required for taxilanes and parking spots than would otherwise be required in an efficient, consolidated layout of similar overall size. III.5.2 Building Area Requirements The calculation of the general aviation building area requirements is shown in Table III.5-1. The existing hangar demand was determined through interviews with RIAC, the corporate operators, and the FBOs. The general aviation hangar requirements were evaluated by determining the total number of based aircraft that will be stored in the hangar and assigning a corresponding square footage for each type of aircraft. The assumptions used in this analysis are shown below: As noted in Chapter II, Forecasts of Aviation Demand, Section II.3.5, Forecasts of Aircraft Operations Demand, the forecast of general aviation operations for T. F. Green assumed an overall annual growth rate for general aviation operations of a moderate 0.8 percent. Growth in hangar demand is assumed to parallel the growth in general aviation operations. Average parking areas per aircraft were determined based on a typical mix of general aviation aircraft. It is assumed that corporate jets require 2,450 square feet per aircraft, multi-engine aircraft require 1,550 square feet per aircraft, and single-engine pistons require 850 square feet per aircraft. Portions of the conventional hangars are also used for aircraft maintenance and servicing, as well as for office space. It is assumed that 20 percent of the total building space is occupied by these areas. Therefore, the hangar area requirements were adjusted to include this space in order to determine the total building requirement. General aviation building area requirements were calculated based on the above assumptions and the final forecasts. These calculations demonstrate that there is currently a demand for approximately 54,800 square feet of hangar space, resulting in a surplus of 84,700 square feet. This surplus will drop to 19,300 square feet with the demolition of Hangar #1 by There will continue to be a surplus of general aviation building area through An increase in the number of aircraft using the hangars beyond the 39 projected for 2020 could trigger a need for additional general aviation facilities. It is important to recognize that the building area requirements are gross square footages and cannot account for the inherent inefficiencies of separate hangar facilities. For example, a private hangar may be only half utilized by choice of its owner. While this space may be reflected as an overall surplus of space, it may not, in fact, be available for use by others. It is important to plan appropriate land use area for general aviation hangars should additional facilities be needed. III-58
59 III.5.3 Apron Area Requirements General aviation apron areas include areas required for access to, and parking of, both based and itinerant aircraft not stored in hangars. The general aviation apron area requirements for T. F. Green are shown in Table III.5-2. Similar to the hangar requirements, the general aviation apron area requirements were determined by establishing the total number of aircraft that will require apron space and assigning a corresponding square footage for each type of aircraft. The assumptions used in this analysis are shown below: The demand for general aviation apron area is based on PMAD general aviation operations as derived from Chapter II, Forecasts of Aviation Demand, Section II.3.5, Forecasts of Aircraft Operations Demand. Based on interviews with Northstar Aviation, and through calculations of existing PMAD parking demands, it was determined that 32 percent of the PMAD arrivals required apron area at any one time. The average parking areas per aircraft presented in the previous section were also used in this analysis. However, for planning purposes, these figures were multiplied by three to account for the area necessary for aircraft circulation and wing tip clearances. The aircraft parking areas are assumed to be consolidated and to be reasonably efficient in the future. The general aviation apron area requirements calculated based on the above assumptions showed that there is currently a demand for approximately 15,300 square yards at T. F. Green. This results in a current apron area surplus of 5,800 square yards. Based on the final forecasts, there will continue to be a surplus of apron space through An increase in daily general aviation activity beyond the levels forecast for 2020 (approximately 110 arrivals per day) could trigger a need for additional apron space for general aviation aircraft. As noted previously, the surpluses reflected in these calculations are based on the existing square footages of an extremely inefficient apron layout. As such, while the projected square footage requirements accurately reflect the overall future general aviation apron area demands, the projected surpluses may be misleading in that much of this surplus area is actually lost in the inherent inefficiency of the current layout. This fact is validated by Northstar Aviation who reports the existing aprons to be full during peak periods. III-59
60 III.5.4 Auto Parking Requirements Just as there are a variety of general aviation building and apron facilities at T. F. Green, there are also a variety of vehicular parking areas associated with these facilities. These parking areas currently total approximately 68,800 square feet in nine separate, distinct lots of varying size, design, and efficiency. For the purposes of this analysis, these various parking areas were broken down into two groups based on their current level of demand versus capacity. Through discussions with representatives of the various parking area users, parking area deficiencies were identified at both Hangar #2 and the Northstar Aviation hangar. Specifically, Hangar #2 is occupied by five separate users, four of which are commercial operations that generate parking demands that consistently exceed the lot capacity. Consequently, these parking demands invariably spill over to the neighboring Northstar Aviation facility, whose existing parking area is undersized for its own demand levels. These two facilities comprise the first group. Through discussions with Northstar Aviation, a planning ratio of 0.7 square feet of parking and access area for every square foot of building area was derived to account for the existing shortages in the Hangar #2 and Northstar Hangar areas. Table III.5-3 shows the resulting auto parking requirements for the forecast years. By applying the planning ratio, there is an existing deficit in auto parking area of approximately 12,800 square feet. This deficit will increase to 29,800 square feet by 2020, when there will be a demand for 55,400 square feet of total parking and access area for Hangar #2 and Northstar Aviation. Table III.5-3 HANGAR #2/NORTHSTAR AVIATION AUTO PARKING REQUIREMENTS T. F. Green Airport Projected Existing Parking Building Area Area to Building Area Surplus/ Requirement Area Ratio Required (Deficit) Year (square feet) (square feet) (square feet) 54, ,400 (12,800) , ,600 (17,000) , ,900 (21,300) , ,100 (25,500) , ,400 (29,800) Area Available: 27,000 square feet Source: RIAC and Federal Express. III-60
61 The second group defined for this parking analysis is comprised of the remaining general aviation facilities, who have all indicated that their existing parking facilities are adequate. However, of special note is Hangar #1, whose existing parking area is currently near capacity, but whose main hangar, as noted previously, is also currently empty. It is very likely that additional parking capacity would need to be considered for Hangar #1 if its existing vacant areas were to be either utilized as rental hangar space for aircraft, or occupied by a commercial operation similar to those in Hangar #2. Through discussions with representatives of these various facilities, a planning ratio of 0.45 square feet of parking and access area for every square foot of building area was derived from existing parking usage percentage estimates. Table III.5-4 shows the resulting auto parking requirements for the forecast years. Through applying the planning ratio, it can be determined that there is an existing surplus in auto parking area of approximately 18,500 square feet that will decrease to 7,600 square feet by 2020, when there will be a demand for 35,600 square feet of total parking and access area for these general aviation facilities. No additional parking areas are needed for these hangars through Table III.5-4 GENERAL AVIATION AUTO PARKING REQUIREMENTS T. F. Green Airport Projected Existing Parking Building Area Area to Building Area Surplus/ Requirement Area Ratio Required (Deficit) Year (square feet) (square feet) (square feet) 54, ,700 18, , ,400 15, , ,200 13, , ,900 10, , ,600 7, Area Available: 43,200 square feet Source: RIAC, Fleet, CVS, Textron, Horizon Aviation, and P T Aero Service, Inc. III.6 Support Facilities Support or ancillary facilities play a vital role in the operations and maintenance of T. F. Green Airport. The sizing, location, and phasing of any proposed improvements to these facilities must provide flexibility to accommodate the dynamic aviation industry. Short-term actions and recommendations should not preclude long-range planning options. The requirements contained herein provide general planning parameters and are based on the forecasts of aviation demand and the existing or anticipated conditions at T. F. Green. III-61
62 Support facilities, most of which are shown on Exhibit III.6-1, include the following: Air Traffic Control Tower (ATCT) Fuel Farm Ground Support Equipment (GSE) Maintenance Airfield Maintenance/Snow Removal Equipment (SRE) Facilities Northeast and Northwest Ramp Facilities Aircraft Rescue and Firefighting (ARFF) Flight Kitchens III.6.1 Air Traffic Control Tower (ATCT) The T. F. Green Airport ATCT is located south of Runway and east of Runway 5R-23L. The ATCT contains a tower cab, a Terminal Radar Approach Control Facility (TRACON), and various administration offices. Chapter I, Inventory, Section I.3.2, Air Traffic Control, describes the functions of the TRACON and the ATCT. The tower was built in It has a 20-year expected life span and will therefore likely need to be replaced around In addition, the ATCT is not in the most optimal location for air traffic controllers. ATCT personnel have indicated the following issues regarding the tower s current location: Restricted line of sight. Trees must be maintained at both the Runway 5R end and Taxiway "T." Controllers face the sun at sunset making it difficult to see ground movements. The ATCT is nearly a mile away from the terminal core making it difficult to see the difference between aircraft lights and terminal lights during sunset and nighttime operations. Commuter aircraft parking positions behind the concourse (Gates 1 and 1A) cannot be seen from current location. A new ATCT will be needed around 2010 as the existing tower reaches the end of its useful life. The FAA is ultimately responsible for determining whether/when a replacement tower is needed. The FAA funds the planning, design, and construction of any new ATCT facility. Therefore, since this is a separate FAA process, the Master Plan will not depict possible sites. However, once a site selection study is conducted by the FAA, the resulting proposed site will be depicted on the ALP. III.6.2 Fuel Farm Commercial aviation (air carrier, commuter, cargo, and charter) demand for Jet A and AVGAS 1000LL fuel is currently met by a central fuel farm, located north of the terminal III-62
63 building. The fuel farm is owned by the airport and operated exclusively by Northstar Aviation. Jet A Fuel Storage Requirements The fuel farm has a total Jet A storage capacity of 250,000 gallons in five above-ground, 50,000-gallon tanks that are located on a concrete pad surrounded by a dike for spill containment purposes. There is currently no space within this existing diked area for additional tanks to be placed. The primary users of Jet A fuel are the commercial passenger and cargo carriers. Northstar Aviation indicated that general aviation demand for Jet A fuel is minimal in relation to the overall scope of commercial demand. As a result, general aviation demand for Jet A was not considered as part of this analysis. Cape Air s projected operations were also not included for the purposes of establishing Jet A demand, since they expect to continue to operate with Cessna aircraft, which use AVGAS 100LL fuel. The following methodology was used to determine future facility requirements: Monthly fuel demand for Jet A was provided by Northstar Aviation for From this data, the peak month demand for 2000 (October: 4,109,000 gallons) was developed and then divided by 31 (the number of days in the month) to estimate the PMAD demand. An existing (year 2000) gallons per PMAD operation ratio was calculated for Jet A fuel. This ratio is 491 gallons per PMAD operation. The future ratio was inflated to take into account the following factors: - Continued replacement of turboprop commuter aircraft with regional jets, having greater fuel requirements and capacities - The use of larger aircraft, with larger fuel capacities, by the air carriers and cargo operators - Increases in flight stage lengths A three-day Jet A fuel reserve was established as a standard requirement by the air carriers to protect for any potential fuel supply disruptions. The ratios discussed above were applied to the PMAD commercial operations to establish the PMAD demand for Jet A fuel. The resulting PMAD demands for Jet A fuel were then multiplied by three to reflect the air carriers three-day fuel reserve requirement. The results of this analysis are shown in Table III.6-1. Based on PMAD fuel demand requirements, the existing fuel farm has a current deficit of approximately 141,500 gallons based on a three-day reserve; RIAC currently has slightly less than a III-63
64 two-day reserve. Future fuel storage requirements are expected to grow to 734,100 gallons by 2020 when PMAD operations are projected to reach 437. This results in a 484,100-gallon deficit in Table III.6-1 JET A COMMERCIAL FUEL STORAGE REQUIREMENTS T. F. Green Airport Gallons Storage PMAD Per PMAD PMAD Requirements Surplus/ Operations 1 Operations Demand 2 (3 Day Supply) (Deficit) Year 3 (gallons) (gallons) (gallons) (gallons) , ,500 (141,500) , ,000 (218,000) , ,300 (302,300) , ,400 (391,400) , ,100 (484,100) Jet A Storage Available: 250,000 gallons Excludes Cape Air, military and general aviation operations. October 2000 fuel demand was provided by Northstar Aviation. Requirements were calculated based on the draft forecasts and were not updated to reflect the final forecasts. Source: Northstar Aviation The fuel storage land area requirements were derived by developing a ratio characterizing existing gallons of storage to square feet of land occupied. The analysis includes all facilities associated with the fuel farm area. Table III.6-2 displays the land area requirements associated with the previously derived storage requirements. The gallons per square feet ratio in 2000 is approximately 6.2. This ratio was applied to the storage requirements in the forecast years to develop a land requirement for the fuel farm. Based on this analysis, there is currently a deficit in land area because T. F. Green does not meet the three-day storage requirement. As PMAD operations increase to 560, 118,400 square feet of land will be needed. This results in a deficit of 55,000 square feet in These requirements were calculated based on the draft forecasts. Based on the final forecasts, the 2005 identified requirements will more likely occur two to three years later. The 2010 projections will shift one to two years and the 2015 requirements will shift one year. The 2020 final forecasts were virtually unchanged from the original projections, so the 2020 support facility requirements are valid. Daily operations levels should be monitored closely to ascertain if expansion is required sooner or later than projected. III-64
65 Table III.6-2 FUEL STORAGE LAND REQUIREMENTS T. F. Green Airport Storage Requirement (3 Day Supply (gallons) Existing Gallons of Storage Per Square Feet of area (gallons) Area Required Square Feet Acres Surplus/(Deficit) Square Feet Acres Year 1 391, , , , (12,126) (0.3) , , (25,626) (0.6) , , (40,126) (0.9) , , (55,026) (1.3) Area Available: 63,374 square feet 1.5 acres 1 Requirements were calculated based on the draft forecasts and were not updated to reflect the final forecasts. Source: RIAC and Northstar Aviation AVGAS 100LL Fuel Storage Requirements While the previous analysis summarized the fuel storage requirements as they relate to commercial operators at T. F. Green, it did not consider Cape Air, who utilizes 100LL aviation fuel exclusively. In addition to the Jet A fuel storage capacity noted above, there is currently a single 10,000-gallon 100LL storage tank in the existing fuel farm to meet the AVGAS 100LL fuel demands of both commercial and general aviation operations at T. F. Green. Similar to Jet A, the methodology used to determine future facility requirements for 100LL fuel are as follows: Monthly commercial fuel demand for 100LL fuel was provided by Northstar Aviation for From this data, the peak month demand for 2000 (July: 16,000 gallons) was identified and then divided by 31 (the number of days in the month) to estimate the PMAD demand. An existing (2000) gallons per PMAD operation ratio was calculated for 100LL fuel. The current demand is 9.2 gallons per PMAD operation, and is expected to remain constant throughout the planning period. A three-day 100LL fuel reserve was established as a standard requirement by the air carrier to protect for any potential fuel supply disruptions. III-65
66 Northstar Aviation indicated that general aviation and military demand for 100LL fuel is typically equal to that of the overall commercial demand. These operations do not require the three-day fuel reserve. Table III.6-3 depicts the AVGAS 100LL fuel storage requirements. As shown, there will a surplus in AVGAS 100LL storage capacity throughout the planning horizon. Therefore, no additional AVGAS 100LL fuel storage will be required through However, Northstar Aviation also noted that beyond the issues of overall demand, a larger 100LL storage tank would be very useful from an operational standpoint. Since refueling tanker trucks typically deliver a standard load of 9,400 gallons, Northstar is forced to wait until the existing 10,000-gallon tank is nearly empty to have it refilled. This typically reduces the on-airport 100LL inventory below the three-day reserve requirement for commercial operators and raises the possibility that a disruption in the regional AVGAS 100LL distribution network could leave the airport without adequate reserves. Northstar has suggested that a 12,000- to 15,000-gallon tank would alleviate these operational issues. Table III LL FUEL STORAGE REQUIREMENTS T. F. Green Airport Commercial Commercial Gallons Commercial Storage Total PMAD Per PMAD PMAD Requirements Storage Surplus/ Operations 1 Operations Demand 2 (3 Day Supply) Requirements 3 (Deficit) Year 4 (gallons) (gallons) (gallons) (gallons) (gallons) ,545 2,060 7, ,655 2,205 7, ,765 2,355 7, ,880 2,505 7, ,015 2,685 7, Storage Available: 10,000 gallons Cape Air operations (Excludes military and general aviation) July 2000 fuel demand was provided by Northstar Aviation. Commercial 3-day storage requirement added to general aviation and military storage demand which is equal to commercial PMAD demand, per Northstar Aviation. Requirements were calculated based on the draft forecasts and were not updated to reflect the final forecasts. Source: Northstar Aviation III-66
67 Fuel Truck Access Fuel and space requirements are expected to nearly double over the planning period. As requirements increase, fuel truck traffic on Delivery Drive will increase, possibly resulting in a need to widen this road. Delivery Drive is located adjacent to the fuel farm and is used for the delivery of fuel to the facility as well as by airport staff to re-fuel trucks and service vehicles. III.6.3 Ground Support Equipment (GSE) Maintenance As discussed in Section III.4.2, Belly Cargo Facilities, a portion of the Belly Cargo/GSE Maintenance facility located south of the terminal building is used for GSE maintenance. Approximately 12,000 square feet of this building is used by the commercial service airlines for GSE maintenance. In addition, ADS Aviation Maintenance, Inc., located in Hangar #2, provides maintenance services for air carrier GSE. Requirements for ADS are discussed in Section III.6.5, Northeast and Northwest Ramp Facilities. This analysis also excludes GSE from Northstar Aviation and from the integrated cargo carriers, who either conduct their own GSE maintenance at their own facilities, or utilize ADS for those services. GSE maintenance requirements were determined based on the number of vehicles required. GSE maintenance growth is driven by three factors in varying degrees of impact. First, any new entrant air carrier to the airport will create instant demand for GSE maintenance by bringing in a new, complete GSE fleet in proportion to the number of gates and flights. Second, construction of additional gates usually requires additional GSE. Third, increased daily departures cause the GSE fleet to grow, in that additional tug and bag cart trains are needed as well as other GSE such as deicing trucks. Additionally, commuter departures are now contributing more to GSE fleet growth because of increased use of regional jet aircraft, which require GSE support similar to that of air carrier aircraft. These three factors were given consideration when developing the GSE maintenance facility requirements. Specifically, facility requirements incorporate growth factors for the existing GSE tenants as well as allowing space for new tenants in the facility. An 82 percent growth in gates from 22 to 40 during the planning period will create a significant need for additional GSE at T. F. Green. GSE requirements at airports with modest GSE fleets (like T. F. Green) generally mirror gate growth. Additional GSE fleet growth will come from the projected increase in daily departures for the air carriers and commuters. Daily departures for the air carriers are projected to grow by 96 percent from 2000 to 2020, and commuter carriers are expected to grow by an additional 30 percent. 20 Daily departure growth for medium-size airports such as 20 Based on the 2001 draft forecasts. III-67
68 T. F. Green typically creates GSE growth at a rate of about one half of the daily departure growth rate for air carriers and about one third of the growth rate for commuter departures. A single maintenance bay can typically service a fleet of eight to 12 motorized GSE units on a single-shift basis. A service bay is approximately 20 feet wide by 32 feet deep (640 square feet) allowing for building columns, etc. Support spaces for GSE maintenance typically require the area equal to the service bay area in a facility. Parts storage space should be added to the facility area separately at about 15 square feet per motorized GSE unit. Additionally, a 25 percent factor is added to the total square footage to account for natural inefficiencies that result from dividing the overall space among tenants. The resulting GSE Maintenance Building requirements are described in Table III.6-4. Based on this analysis, the existing facilities are currently at capacity and will be undersized by 4,300 square feet by Approximately 28,100 square feet of building area will be needed in 2020, resulting in a deficit for the existing facilities of 13,200 square feet. Table III.6-4 GSE MAINTENANCE BUILDING REQUIREMENTS T. F. Green Airport Cumulative Total Maintenance Building GSE Growth Motorized Requirements Surplus/(Deficit) Rate 1 GSE Units Bays 2 Square Feet 3 Bays Square Feet Year ,700 0 (800) % ,200 (2) (4,300) % ,100 (3) (6,200) % ,600 (5) (9,700) % ,100 (7) (13,200) Available: 9 bays 14,900 square feet Growth rate based on gate growth percentage, plus combined air carrier and commuter daily departure growth, multiplied by a diversity factor of.65. A single maintenance bay can typically service a fleet of 8-12 motorized GSE units on a single shift basis. Square footage requirements based on 1,280 square feet per bay for bay and support space, added to 15 square feet per GSE unit for storage, plus a 25 percent gross-up factor, which includes some inefficiency in dividing space among tenants. Requirements were calculated based on the draft forecasts and were not updated to reflect the final forecasts. Source: RIAC, Northstar Aviation, US Airways, and ADS Aviation Maintenance III-68
69 Area for GSE staging, off-season storage, and temporary storage must also be provided. Sheltered storage is preferred, especially in areas with harsh winter conditions like Rhode Island. Area for storage, if judiciously managed, should be sized for all off-season equipment storage and approximately 20 percent of the remaining fleet. The area should be planned as a parking lot or unheated shelter with very small clearances for long-term storage and more generous clearances for more transient uses such as GSE staging. Off-season GSE storage in airports such as T. F. Green usually includes space for deicing trucks and heaters only. Currently, T. F. Green has no sheltered areas dedicated to the storage of GSE equipment. All GSE, including off-season GSE, is parked outside in available spaces at the belly cargo building, at the fuel farm, or around the terminal gate areas. The existing and forecast GSE sheltered storage requirements are shown in Table III.6-5. There is currently a need for 9,800 square feet of sheltered GSE storage space, which is projected to increase to approximately 18,900 square feet by Based upon the above analyses and the final forecasts, there is a combined total need for 45,000 to 50,000 square feet of GSE Maintenance/Garage Storage by Table III.6-5 GSE SHELTERED STORAGE REQUIREMENTS T. F. Green Airport Cumulative Off-Season General Sheltered GSE Growth Motorized Storage Storage Surplus/ Rate 1 GSE Units GSE Units 2 Requirements 3 (Deficit) Year 4 (square feet) (square feet) ,800 (9,800) % ,300 (12,300) % ,500 (14,500) % ,000 (17,000) % ,900 (18,900) Sheltered Storage Area: 0 square feet Growth rate based on gate growth percentage, plus combined air carrier and commuter daily departure growth, multiplied by a diversity factor of percent of total motorized GSE, less off-season motorized GSE Square footage requirements based on 350 square feet per off-season GSE unit, added to 300 square feet per general GSE unit, plus a 10 percent gross-up factor for columns, etc. (Note: these calculations do not include areas for roads and landside parking, walks, landscaping, etc.) Requirements were calculated based on the draft forecasts and were not updated to reflect the final forecasts. Source: RIAC, Northstar Aviation, US Airways, and ADS Aviation Maintenance III-69
70 III.6.4 Airfield Maintenance/Snow Removal Equipment (SRE) Facilities Airfield Maintenance/SRE facilities facilitate the storage and maintenance of airport service vehicles (especially SRE) by providing a warm, sheltered environment for equipment repair and storage. These facilities also protect the airport s investment by shielding equipment and stored materials from moisture and contaminants. The Airfield Maintenance/SRE facilities at T. F. Green are located off-airport on a 5.5-acre site north of Airport Road and are comprised of four buildings. These buildings and their functions are described in Table III.6-6. In addition, RIAC Airfield Maintenance currently occupies the old city of Warwick Fire Station (8,770-square foot facility). They use the facility for storage of SRE equipment as well as for general storage of field materials. Table III.6-6 EXISTING AIRFIELD MAINTENANCE/SRE FACILITIES T. F. Green Airport Facility Building Area Facility Site (square feet) (square feet) Administration Building 4,100 - Offices Administrative Support Facilities Conference Room Personnel Sleeping Quarters Personnel Facilities Field Electrical Maintenance & Storage Records Storage Sand Storage Shed 1,100 - Equipment Storage Dome 13,900 - Large SRE & Field Equipment Storage Equipment Accessories Storage Snow Removal Materials Storage Maintenance Garage 4,900 - Vehicle Maintenance Facilities Maintenance Supplies & Storage Maintenance Offices Personnel Support Facilities Small Field Equipment Storage Total Maintenance Areas 24, ,600 Source: RIAC Airfield Operations & Facilities III-70
71 Given the projected increase in operations and the corresponding increase in pavement, additional facilities will be needed over the planning horizon for airfield maintenance and SRE storage. In addition, trade unions sometimes call for separate space for each trade, which can have an impact on the size of future facilities. Senior maintenance staff at T. F. Green were consulted to determine the efficiency and effectiveness of the existing facilities. They indicated that the existing facility is currently undersized in both the overall size of the site and in building area. It lacks appropriate office space, meeting space, personnel support space, sleeping quarters, maintenance space, vehicle storage space, airfield materials storage space, general storage space, etc. As a result, this facility has been under review by senior airport maintenance staff since 1999, at which time a facility needs assessment was conducted. The results of this facility assessment and subsequent coordination are summarized in Table III.6-7. Senior airfield maintenance staff have determined that a 74,375-square foot building would be sufficient to serve forecast demand at T. F. Green through Table III.6-7 AIRFIELD MAINTENANCE/SRE FACILITIES ASSESSMENT T. F. Green Airport Building Areas 1999 Assessment (square feet) Equipment Parking Area Large SRE (34 Units) 26,400 Aisle / Maneuvering Space 8,250 Sub-Total 34,650 Ancillary Support Areas Vehicle Maintenance / Support 8,600 Snow Removal Materials /Maintenance Materials Storage 3,500 Small Equipment Storage 10,000 Field Electrical Maintenance 2,000 Building Support Systems 1,150 Administrative Support 9,625 Center Aisle 3,750 Sub-Total 38,625 Sand Storage 1,100 Sub-Total 1,100 Total Maintenance/SRE Building Program 74,375 Existing Facility 24,000 Deficiency 50,375 Source: RIAC Airfield Operations & Facilities III-71
72 As noted above, the facility site is located across a busy, public road from the airport. This requires airfield personnel to wait to access the airfield pending crossing Airport Road at a traffic light. This is both inefficient and dangerous, in that this light has been the scene of numerous accidents and airport vehicles have been struck in the past. It is therefore highly desirable to have this facility located on the airfield itself. As activity levels at the airport increase over the planning period, an on-site location will become essential. Additionally, the existing 5.5-acre site is undersized for the current level and type of operations being conducted. The size of this particular site will also be a significant constraining factor to the development of a future facility in its sizing, configuration, expandability, efficiency, and ultimate usability. An eight to ten-acre site having direct access to the airfield would be preferable. III.6.5 Northeast and Northwest Ramp Facilities The Northeast and Northwest ramps are the locations for five tenants who were not included in the discussion of air cargo and general aviation needs which were discussed in Sections III.4 and III.5, respectively. These tenants and their future facility requirements are as follows: P T Aero Service, Inc., located in Hangar # 1, provides aircraft maintenance services primarily for general aviation aircraft. Additionally, they lease some general hangar space for based aircraft. They have approximately 6,500 square feet of administrative, maintenance, and hangar space as well as four tie-down locations immediately adjacent to their facility on the ramp. P T Aero Service indicated that they currently have adequate space for their maintenance operations. They project that it would take a 50 percent increase in maintenance operations to require an additional 2,500 square feet of hangar space. Any additional hangar space required for maintenance prior to that time could be acquired by reducing or eliminating their based aircraft hangar rentals. RIAC Airfield Maintenance currently occupies the old city of Warwick Fire Station (8,770-square foot facility). They use the facility for storage of SRE equipment as well as for general storage of field materials. Since the facility needs for this use and equipment have been incorporated into Section III.6.4, Airfield Maintenance/Snow Removal Equipment Facilities, the old fire station will not be needed for use by RIAC Airfield Maintenance in the future. The RIAC Airfield Operations Office currently occupies approximately 2,500 square feet on the first floor of the old T. F. Green terminal building on Airport Road. Senior RIAC operations staff have indicated that any future facility demands could be easily accommodated by fully occupying the remainder of the building s first floor and by potentially renovating the second floor for occupancy. Therefore, no additional space needs to be planned for this function. III-72
73 ADS Aviation Maintenance, Inc., located in Hangar #2, provides general aircraft maintenance services, as well as maintenance services for air carrier GSE. They currently have approximately 11,000 square feet of administrative, maintenance, storage, and hangar space. ADS has indicated that aircraft maintenance has been, and will likely remain, steady. Therefore, no additional space is needed for aircraft maintenance. GSE maintenance has grown significantly over recent years, providing support for eight of T. F. Green s air carriers. Since the GSE inventory for most T. F. Green air carriers is relatively small, it is not cost effective for the carriers to maintain GSE maintenance staff at the station. Many find it to be more efficient to contract ADS for these services. ADS currently has three GSE service bays sectioned off in their hangar for this purpose. While projected growth in GSE could indicate an increase in demand for space by ADS, the growth in GSE could also likely lead to a centralized GSE maintenance facility which has been accounted for in Section III.6.3. This would reduce the demand for ADS GSE services. Therefore, ADS projects no increase in their facility demands above current levels. The RIAC Aeronautics Inspections Office currently occupies all of Hangar #3 on Airport Road. The facility provides an administrative area, general storage, and hangar space for a helicopter and single-engine general aviation aircraft. RIAC Aeronautics Inspections staff have indicated that the current facility will meet their needs through III.6.6 Aircraft Rescue and Firefighting (ARFF) The primary responsibility of the ARFF department at T. F. Green is to provide emergency response services to all individuals, aircraft, and facilities on-airport property. Facilities The current ARFF station is located northeast of the intersection of Runway 34 and Runway 23L. It houses all airport firefighting equipment, emergency vehicles, as well as all personnel and administrative support facilities. The 12,070-square foot facility was built in 1990 to accommodate a maximum of 18 male firefighters and one supervisor. There are currently 24 firefighters on staff, as well as two supervisors and one administrative assistant. It has been recognized by senior ARFF officials and by RIAC that the existing facility is undersized for most of its current uses and lacks appropriate accommodations for female firefighters, larger ARFF vehicles, ARFF materials storage, and hose drying equipment. As such, in 2001 RIAC endorsed the expansion of the existing ARFF facility and appropriated funding for its design. The proposed sizing requirements for the expansion are described in Table III.6-8. Expanding the existing building to a 60,400-square foot facility would fulfill the spatial requirements for ARFF under existing Part 139 requirements through III-73
74 Table III.6-8 EXISTING ARFF FACILITY REQUIREMENTS T. F. Green Airport Existing Facilities Existing Building Area Building Area Requirements (square feet) (square feet) Personnel Facilities 5,300 8,700 Administrative Offices Operations Office Crew Kitchen Crew Dormitory Men s Locker Room/Bathroom Women s Locker Room/Bathroom Crew Training Room Crew Exercise / Weight Training Room Storage Room Building Support Areas Equipment Facilities 6,770 10,170 ARFF Vehicle Storage ARFF Materials Storage (foam/dry chemical) General Storage (6 bays) (8 bays) Total Building Area 12,070 18,870 Facility Site 38,870 60,400 Building Site Ramp / Maneuvering Area Personnel Parking Total Site Area 38,870 60,400 Source: RIAC ARFF III-74
75 Vehicles FAR Part 139, Certification and Operations: Land Airports Serving Certain Air Carriers, Subpart D Operations, outlines the facility requirements for ARFF services at a land airport serving air carriers having a seating capacity of more than 30 seats. Paragraph and of FAR Part 139 establishes a system of classifying an airport into one of five indexes, which are based on the longest air carrier aircraft with five or more average daily departures at the airport. Each of these indexes has a corresponding ARFF vehicle and equipment requirement to service that category of airport. A summary of the requirements by index is contained in Table III.6-9. Table III.6-9 FAR PART & ARFF EQUIPMENT REQUIREMENTS T. F. Green Airport Vehicles Extinguishing Agents 1 Airport Index Length of Aircraft (ft) 2 Light- Weight Self- Propelled Dry Chemicals Water 3 A 4 Under or B 90 to ,500 C 126 to ,000 D 160 to ,000 E Over ,000 The protein-based agents may be substituted for ARFF and the quantities of water shown increased by a factor of 1.5. Dry Chemicals in the ration of 12.7 pounds per gallon of water may be substituted for up to 30 percent of the water specified for ARFF. Length of largest aircraft providing an average of five scheduled departures per day. Water for protein foam production These requirements are part of the total for Indexes B through E pertaining to the lightweight vehicle. Source: FAR Part The longest aircraft group with at least five scheduled departures per day currently is Index C, which includes the B , the B-757, and the McDonnell Douglas MD-80 series. Based on the forecast fleet mix, T. F. Green will remain Index C throughout the planning period. A classification of Index C calls for the provision of one lightweight, quick response vehicle and at least two additional self-propelled fire extinguishing vehicles, with the total capacity of 500 pounds of dry chemicals and 3,000 gallons of water. As shown in Table III.6-10, T. F. Green currently exceeds the ARFF vehicle requirements and will continue to do so through III-75
76 Table III.6-10 ARFF VEHICULAR CAPACITIES FOR EXTINGUISHING AGENTS T. F. Green Airport 1 Vehicle Water (gallons) Halon (pounds) AFFF 1 (gallons) Dry Chemical (pounds) Discharge (gallons per minute) Rescue Rescue , Bumper 750 / 375 Turret Rescue , Bumper 1,000 Snozzle Rescue Rescue , Bumper Turret 600 / 1,200 Turret Rescue Bumper Rescue Rescue , Bumper 1,200 Turret Foam Trailer - - 1,000 - Medical Trailer Total All Stations Index C Requirements Aqueous film forming foam Source: T. F. Green ARFF staff Response Time 9, ,290 2,200 3, In addition to the vehicle and equipment requirements stipulated above, FAR Part 139 also identifies operational response time requirements under Paragraph (I) which states that: Within 3 minutes from the time of the alarm, at least one required airport rescue and firefighting vehicle shall reach the midpoint of the farthest runway serving air carrier aircraft from its assigned post, or reach any other specified point of comparable distance on the movement area which is available to air carriers, and begin application of foam, dry chemical or Halon III-76
77 The airport s ARFF facilities are currently in compliance with these FAR Part 139 requirements, based on the following assumptions: Use of the shortest travel route, which is to utilize the ARFF access drive to Runway 5R-23L and then travel southwest on the runway until the midpoint is reached Twenty-second response time from the sounding of the first alarm to the start of the vehicle Thirty seconds for a Class 2 ARFF vehicle to accelerate from a starting point to 50 miles per hour (as specified for Class 2 vehicles in AC 150/ B) Average running speed of 50 miles per hour on straight sections Average running speed of 30 miles per hour on curved sections Fifteen seconds for a Class 2 ARFF vehicle to decelerate from 50 miles per hour to a complete stop (as specified for Class 2 vehicles in AC 150/ B) Based on the above assumptions, the shortest route is approximately one half mile and takes approximately 70 seconds or 1.10 minutes. Therefore, the current response time is well within the three-minute response time criterion established under Part 139. This response time requirement must be revisited once the future layout of the airport is known. III.6.7 Flight Kitchens In-flight catering services are provided to air carriers and charters primarily by Galley Services Providence, Inc., which is located in the rear, ground floor section of the shopping plaza on the corner of Post and Airport Road. The services provided by Galley Services include the preparation of meals and snacks, the storage and handling of all meal and beverage supplies, including alcoholic beverages, and the transportation of these services to and from the aircraft. They have access to the airport through T. F. Green s old security fence onto Delivery Drive, whereupon they typically gain access to the field through the old terminal building gate off of Airport Road. Emery s Catering Service is the only other in-flight caterer operating at the airport. They provide catering services only for Delta Airlines. There are currently no flight kitchen/galley services located on airport property. However, flight kitchens are often times located on airport property. The following discussion presents the requirement for flight kitchen facilities in the event there is a need to provide these facilities on airport property. There are two planning factors used in establishing future facility requirements for meal services at an airport. The first factor is the meals per passenger ratio, which is the ratio of the number of meals served, as provided by Galley Services Providence, Inc. and Emery s Catering Service, applied to the total number of passenger enplanements in That ratio is then applied to the forecast for passenger enplanements to III-77
78 determine the total number of meals required for the forecast years. The current meals per passenger ratio is at a relatively low level of 0.14, due primarily to the combination of Southwest Airlines high percentage of enplanements at T. F. Green and their lack of meal services. This ratio is projected to remain consistent throughout the planning period due to both Southwest Airlines continued influence, and the overall trend of airlines serving fewer meals. This assumption was confirmed by Galley Services personnel. The second factor is the meals per total square feet ratio, which is determined by dividing the number of annual meals by the total square footage being utilized by the flight kitchens. Personnel at Galley Services estimate that they are nearly at 95 percent capacity, with most of their available space being utilized for bulk receiving and storage of supplies. They also note that they have had to make do and design their operation to fit in the limited space that they have available. In having to do so, they have unfortunately created cramped, inefficient working conditions. This fact is reflected in a current ratio of meals per total square foot of 28.5, a relatively high number. In order to help remedy these existing, cramped conditions, Galley Services suggested that this ratio be decreased to 22.0 by 2010 to reflect the increased spatial requirements of a larger food preparation operation and bring them more into line with industry standards. This ratio was applied to the total meals required to determine the total square footage required in the future. The future flight kitchen requirements are presented in Table III As noted, the total number of annual meals will roughly double by 2020 to 1.5 million meals, requiring approximately 68,900 square feet of total operational area. There currently exists a surplus of 1,400 square feet of flight kitchen operational space. An additional 8,600 square feet of flight kitchen building area will be required as annual passenger levels approach 6.7 million. By 2020, there will be a deficit of 41,500 square feet. It is anticipated that this requirement will be accommodated at off-airport locations. These requirements were calculated using the draft forecasts. Based on the final forecasts, the 2005 identified requirements will more likely occur two to three years later. The 2010 projections could shift one to two years and 2015 requirements could shift one year. The 2020 final forecasts were virtually unchanged from the original projections, so the 2020 support facility requirements are valid. III-78
79 Table III.6-11 IN-FLIGHT CATERING FACILITY REQUIREMENTS T. F. Green Airport Annual Meals Annual Number per Total Area Surplus/ Enplaned Meals per of Meals Square Required (Deficit) Passengers Passenger 1 Required Feet 2 Square Feet Square Feet Year 3 5,430, , ,000 1, ,701, , ,000 (8,600) ,997, ,119, ,900 (23,500) ,307, ,303, ,200 (31,800) ,822, ,515, ,900 (41,500) 2020 Approximate Area Currently Available: 4 27,400 square feet ratio is based on actual daily meals (provided by Galley Services Providence and Emery's Catering Services) divided by PMAD enplanements meals per square feet based on annual meals divided by current facility utilization. Future ratio based on discussions with Galley Services Providence. Requirements were calculated based on the draft forecasts and were not updated to reflect the final forecasts. Includes both Galley Services Providence and Emery's Catering Services. Source: Galley Services Providence and Emery's Catering Services III.7 Summary of Facility Requirements A summary of the facility requirements described in this chapter is shown in Exhibit III.7-1. Most of the airport s facilities will require expansion within the 20-year planning horizon. Additional runway capacity will be needed towards the middle to end of the planning horizon. A 9,500-foot runway will be needed to accommodate the future fleet mix and potential destinations at reasonable payloads. The passenger terminal will require expansion from the existing 22 gates and 352,000-square foot facility to 40 gates and an 800,000-square foot building. Major roadway improvements will be needed within the planning horizon. Only minor curbfront improvements will be needed provided that operating procedures are adjusted. Auto parking requirements are projected to increase by 50 percent over the planning period. The cargo, general aviation facilities, and other support facilities will all require improvements over the planning horizon. The land area required for these facilities is expected to nearly double over the planning period. III-79
80 The activity levels that trigger expansion are more important than the actual years that are identified in this chapter. In order to provide maximum flexibility for RIAC, Table III.7-1 summarizes the trigger points that will lead to the need to expand the airport s facilities. It is important to note that as demand patterns, fleet mix, etc. change over time, the activity triggers may also change. However, this table provides order of magnitude planning criteria for RIAC to monitor actual conditions and activity levels at T. F. Green. P:\pvd00\Master Plan\Documents\Response-Comments\ch III - fac req-rev7-7-04_for web.doc III-80
81 Facilities 20 Year Requirements Airfield: Provide additional runway capacity Primary departure runway: 9,500 feet Crosswind runway: 7,600 feet Passenger Terminal: Existing 2000: 22 gates; 352,000 square feet Forecast 2020: 40 gates; 800,000 square feet Roadways: Major roadway improvements will be needed over the planning period for both airport access and terminal area roadways. Curbfront Facilities: Only minor physical improvements needed (provided curb continues to operate as it does in 2002). Auto Parking: Short-term: Adequate over the planning period Long-term: Existing 2000: 8,410 spaces Forecast 2020: 13,500 spaces Employee Parking: Existing 2000: 1,410 spaces (currently utilizes long-term parking) Future 2020: 2,800 spaces (provide parking in a separate lot) Rental Car: Existing 2000: 1,120 spaces Future 2020: 2,345 spaces Air Cargo: Existing 2000: Approximately 7.3 acres Future 2020: Approximately 15.0 acres General Aviation: Building space is adequate to meet forecast demand. Additional auto parking will be needed over the planning period. Current layout of the Northeast and Northwest ramps is inefficient. Other Support Facilities: Land requirement for support facilities is expected to approximately double over the planning period (15.0 total acres needed). P:\pvd00\Master Plan\Dem-Cap-FacilityReq\[FacReq-Summary.xls]Req-Summary -exhibit III.1 Summary of Requirements Exhibit III.1
82
83 VFR2 Runway (5) VFR1 Runway (5, 34) VFR3 Runway (23) L 23R 5L 23R 5L 23R 5R 23L 5R 23L 5R 23L % 7.25% 32.27% VFR4 Runway (34) VFR5 Runway (16) IFR1 Runway (5) L 23R 5L 23R 5L 23R 5R 23L 5R 23L 5R 23L % 2.58% 9.32% IFR2 Runway (23) IFR3 Runway (34) IFR4 Runway (16) L 23R 5L 23R 5L 23R 5R 23L 5R 23L 5R 23L %.37%.61% Arrival Departure Occasional Use N Source: Air Traffic Control Tower Input; EarthInfo, Inc. from the National Climatic Data Center (NCDC) database, National Weather Service (NWS) hourly surface aviation observations, (excluding 1989 and 1994 due to bad data). Note: Runway 5L-23R is only used during visual, daytime conditions. Runway Operating Configurations Exhibit III.1-2 X:\PVD\rwy-op-config.cdr 10/25/02
84 110% 100% Demand/Capacity Ratio 90% 80% 70% 80 Percent of Capacity - Additional capacity should be in place. 60% 60 Percent of Capacity - Additional capacity should be planned for 50% 155,545 (2000) 177,000 (2005) 195,000 (2010) 212,000 (2015) 230,000 (2020) Annual Operations (Year) Note: Requirements were calculated based on the draft forecasts and were not updated to reflect the final forecasts. Source: Aircraft Characteristic Manuals P:\pvd00\Master Plan\Dem-Cap-FacilityReq\CAP_DEL\[Capacity.xls]D-C-Cha Demand/Capacity Exhibit III.1-3
85 8 7 Average Delay Per Aircraft (minutes) AAAE Standard - (four to six minutes of average delay per aircraft) FAA Standard - (five minutes of average delay per aircraft) ,545 (2000) 177,000 (2005) 195,000 (2010) 212,000 (2015) 230,000 (2020) Annual Operations (Year) Note: Requirements were calculated based on the draft forecasts and were not updated to reflect the final forecasts. Source: American Association of Airport Executives Accreditation Module, Airport Capacity and Delay, developed by Stephen M. Quilty, A.A.E., Bowling Green State University, Ohio, USA Aviation Capacity Enhancement Plan, page 3-5 ( Aircraft Characteristic Manuals P:\pvd00\Master Plan\Dem-Cap-FacilityReq\CAP_DEL\[Capacity.xls]Delay-Cha Average Delay Per Aircraft Exhibit III.1-4
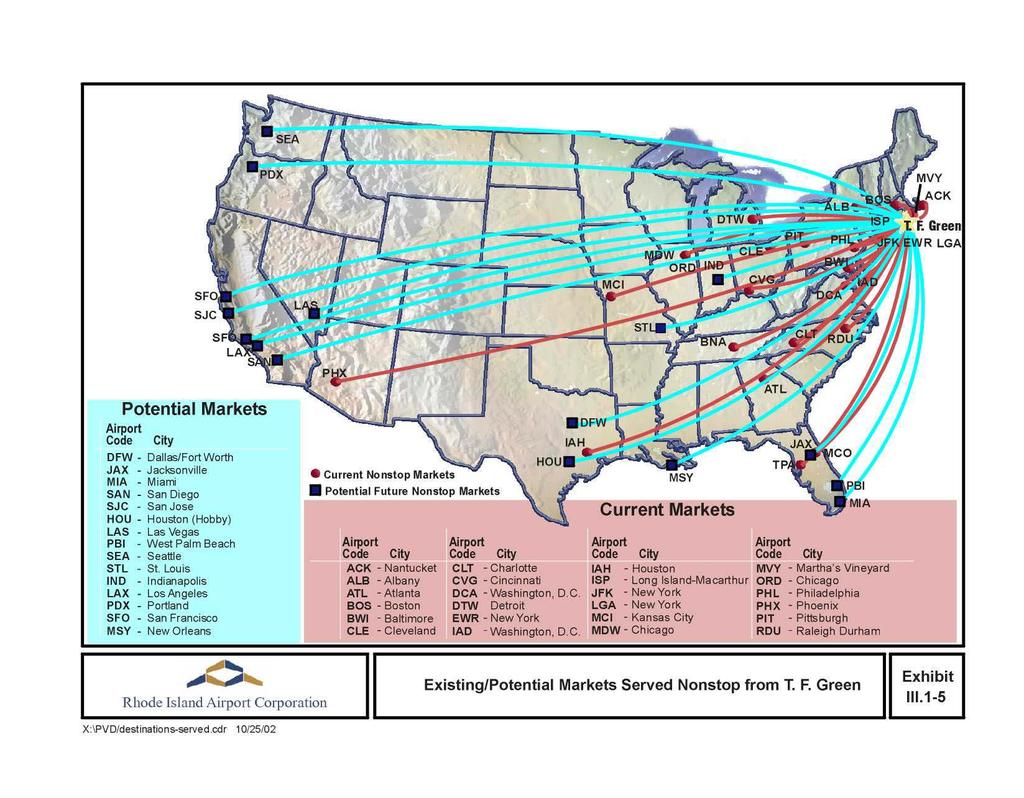
86
According to FAA Advisory Circular 150/5060-5, Airport Capacity and Delay, the elements that affect airfield capacity include:
 4.1 INTRODUCTION The previous chapters have described the existing facilities and provided planning guidelines as well as a forecast of demand for aviation activity at North Perry Airport. The demand/capacity
Appendix B Ultimate Airport Capacity and Delay Simulation Modeling Analysis
 Appendix B ULTIMATE AIRPORT CAPACITY & DELAY SIMULATION MODELING ANALYSIS B TABLE OF CONTENTS EXHIBITS TABLES B.1 Introduction... 1 B.2 Simulation Modeling Assumption and Methodology... 4 B.2.1 Runway
The purpose of this Demand/Capacity. The airfield configuration for SPG. Methods for determining airport AIRPORT DEMAND CAPACITY. Runway Configuration
 Chapter 4 Page 65 AIRPORT DEMAND CAPACITY The purpose of this Demand/Capacity Analysis is to examine the capability of the Albert Whitted Airport (SPG) to meet the needs of its users. In doing so, this
FORT LAUDERDALE-HOLLYWOOD INTERNATIONAL AIRPORT ENVIRONMENTAL IMPACT STATEMENT DRAFT
 D.3 RUNWAY LENGTH ANALYSIS Appendix D Purpose and Need THIS PAGE INTENTIONALLY LEFT BLANK Appendix D Purpose and Need APPENDIX D.3 AIRFIELD GEOMETRIC REQUIREMENTS This information provided in this appendix
Runway Length Analysis Prescott Municipal Airport
 APPENDIX 2 Runway Length Analysis Prescott Municipal Airport May 11, 2009 Version 2 (draft) Table of Contents Introduction... 1-1 Section 1 Purpose & Need... 1-2 Section 2 Design Standards...1-3 Section
Chapter 3. Demand/Capacity & Facility Requirements
 Chapter 3. Demand/Capacity & Facility Requirements Chapter 3. DEMAND/CAPACITY & FACILITY REQUIREMENTS This chapter provides an assessment of future airport development requirements based upon the forecasts
APPENDIX X: RUNWAY LENGTH ANALYSIS
 APPENDIX X: RUNWAY LENGTH ANALYSIS Purpose For this Airport Master Plan study, the FAA has requested a runway length analysis to be completed to current FAA AC 150/5325-4B, Runway Length Requirements for
Hartford-Brainard Airport Potential Runway Closure White Paper
 Hartford-Brainard Airport Potential Runway 11-29 Closure White Paper June 2012 In recent years there has been discussion regarding the necessity of Runway 11-29 to the Hartford- Brainard Airport (HFD)
CHAPTER 4 DEMAND/CAPACITY ANALYSIS
 CHAPTER DEMAND/CAPACITY ANALYSIS INTRODUCTION The demand/capacity analysis examines the capability of the airfield system at Blue Grass Airport (LEX) to address existing levels of activity as well as determine
Draft Concept Alternatives Analysis for the Inaugural Airport Program September 2005
 Draft Concept Alternatives Analysis for the Inaugural Airport Program September 2005 Section 3 - Refinement of the Ultimate Airfield Concept Using the Base Concept identified in Section 2, IDOT re-examined
CATCODE ] CATCODE
![CATCODE ] CATCODE](/thumbs/82/85644630.jpg "CATCODE ] CATCODE") Runways. FAC: 1111 CATCODE: 111111 OPR: AFCEC/COS OCR: AF/A3O-A 1.1. Description. The runway is the paved surface provided for normal aircraft landings and take offs. Runways are classified as either Class
Runways. FAC: 1111 CATCODE: 111111 OPR: AFCEC/COS OCR: AF/A3O-A 1.1. Description. The runway is the paved surface provided for normal aircraft landings and take offs. Runways are classified as either Class
FORECASTING FUTURE ACTIVITY
 EXECUTIVE SUMMARY The Eagle County Regional Airport (EGE) is known as a gateway into the heart of the Colorado Rocky Mountains, providing access to some of the nation s top ski resort towns (Vail, Beaver
Executive Summary. MASTER PLAN UPDATE Fort Collins-Loveland Municipal Airport
 Executive Summary MASTER PLAN UPDATE Fort Collins-Loveland Municipal Airport As a general aviation and commercial service airport, Fort Collins- Loveland Municipal Airport serves as an important niche
Washington Dulles International Airport (IAD) Aircraft Noise Contour Map Update
 Aircraft Noise Contour Map Update") Washington Dulles International Airport (IAD) Aircraft Noise Contour Map Update Ultimate ASV, Runway Use and Flight Tracks 4th Working Group Briefing 8/13/18 Meeting Purpose Discuss Public Workshop input
Washington Dulles International Airport (IAD) Aircraft Noise Contour Map Update Ultimate ASV, Runway Use and Flight Tracks 4th Working Group Briefing 8/13/18 Meeting Purpose Discuss Public Workshop input
1 DRAFT. General Aviation Terminal Services Aircraft Hangars Aircraft Parking Aprons Airport Support Facilities
 To properly plan for improvements at Dallas Executive Airport, it is necessary to translate forecast aviation demand into the specific types and quantities of facilities that can adequately serve the demand.
Chapter 5 Facility Requirements
 Chapter 5 Facility Requirements 50 INTRODUCTION This chapter describes the airside and landside facility requirements necessary to accommodate existing and forecasted demand in accordance with Federal
Facility Requirements
 C H A P T E R T H R E E Facility Requirements 3.0 OVERVIEW Airport planning for facility requirements is based upon addressing any existing issues and accommodating the probable demand that may occur over
1.1.3 Taxiways. Figure 1-15: Taxiway Data. DRAFT Inventory TYPICAL PAVEMENT CROSS-SECTION LIGHTING TYPE LENGTH (FEET) WIDTH (FEET) LIGHTING CONDITION
 WIDTH (FEET) LIGHTING CONDITION") 1.1.3 Taxiways EWN has an extensive network of taxiways and taxilanes connecting the terminal, air cargo, and general aviation areas with the runways as listed in Figure 1-15. A 50-foot wide parallel taxiway
1.1.3 Taxiways EWN has an extensive network of taxiways and taxilanes connecting the terminal, air cargo, and general aviation areas with the runways as listed in Figure 1-15. A 50-foot wide parallel taxiway
C > Capacity Analysis and Facility Requirements
 Buchanan Field Buchanan Field Airport Master Planning Program C. CAPACITY ANALYSIS & FACILITY REQUIREMENTS C > Capacity Analysis and Facility Requirements INTRODUCTION. The capacity of an airfield is primarily
FACILITY REQUIREMENTS SUMMARY OF KEY ISSUES OVERVIEW
 FACILITY REQUIREMENTS SUMMARY OF KEY ISSUES OVERVIEW This summary is intended to provide a brief overview of the key issues associated with conformance to FAA standards at Methow Valley State Airport.
RSAT RUNUP ANALYSIS 1. INTRODUCTION 2. METHODOLOGY
 RSAT RUNUP ANALYSIS 1. INTRODUCTION The FAA Runway Safety Action Team (RSAT) is a team of FAA staff that works with airports to address existing and potential runway safety problems and issues. The RSAT
Facility Requirements
 4. This chapter presents the airside and landside facility requirements necessary to accommodate existing and forecasted demand at Erie International Airport (ERI or the Airport) in accordance with Federal
Dallas Executive Airport
 648 DECLARED DISTANCE OPTION 1a DISPLACE 31 THRESHOLD BY 97 Considers RSA Limiting Factor No runway extensions 13 31 TORA 6,451 6,451 TODA 6,451 6,451 ASDA 5,958 6,451 LDA 5,958 6,354 Runway 17-35 (3,8
CHAPTER 3 FACILITY REQUIREMENTS
 CHAPTER 3 FACILITY REQUIREMENTS 3.1 INTRODUCTION To properly plan for the future requirements of Newport News/Williamsburg International Airport, it is necessary to translate the forecasts of aviation
Draft Concept Alternatives Analysis for the Inaugural Airport Program September 2005
 Draft Concept Alternatives Analysis for the Inaugural Airport Program September 2005 Section 1 - Introduction This report describes the development and analysis of concept alternatives that would accommodate
B GEORGIA INFRASTRUCTURE REPORT CARD AVIATION RECOMMENDATIONS DEFINITION OF THE ISSUE. Plan and Fund for the Future:
 2014 GEORGIA INFRASTRUCTURE REPORT CARD B + RECOMMENDATIONS Plan and Fund for the Future: While the system continues to enjoy excess capacity and increased accessibility it still needs continued focus
IDENTIFICATION AND EVALUATION OF ALTERNATIVES ST. PETERSBURG-CLEARWATER INTERNATIONAL AIRPORT
 IDENTIFICATION AND EVALUATION OF ALTERNATIVES ST. PETERSBURG-CLEARWATER INTERNATIONAL AIRPORT 7 7.1 GENERAL The primary objective of this chapter is to evaluate potential development alternatives and identify
Agenda: SASP SAC Meeting 3
 Agenda: SASP SAC Meeting 3 Date: 04/12/18 Public Involvement Plan Update Defining the System Recommended Classifications Discussion Break Review current system Outreach what we heard Proposed changes Classification
Las Vegas McCarran International Airport. Capacity Enhancement Plan
 Las Vegas McCarran International Airport Capacity Enhancement Plan Las Vegas McCarran International Airport Capacity Enhancement Plan September 1994 Prepared jointly by the U.S. Department of Transportation,
Key Purpose & Need Issues
 Key Purpose & Need Issues Efficiently meet demand through the 2025 planning horizon 864,000+ annual operations 180-200 operations during peak daytime hours Balance peak hour arrival/departure capability
SECTION 4 DEMAND/CAPACITY ANALYSIS AND FACILITY REQUIREMENTS
 SECTION 4 DEMAND/CAPACITY ANALYSIS AND FACILITY REQUIREMENTS This Section compares the projected demand and the existing capacity for the major elements of the Airport and establishes the facility requirements
Appendix 6.1: Hazard Worksheet
 Appendix 6.1: Appendix 6.1: Ref. Condition, real or potential; that can cause injury, illness, etc. This is a prerequisite for an Airfield Hazards 1. Taxiway Geometry Direct access to runway from ramp
JUNEAU RUNWAY INCURSION MITIGATION (RIM) PROGRAM JANUARY 25, 2017
 PROGRAM JANUARY 25, 2017") JUNEAU RUNWAY INCURSION MITIGATION (RIM) PROGRAM JANUARY 25, 2017 1 Agenda Program Description Runway Incursions Design and Geometry Deficiencies Runway 8/26 Operations Potential Mitigation Next Steps
JUNEAU RUNWAY INCURSION MITIGATION (RIM) PROGRAM JANUARY 25, 2017 1 Agenda Program Description Runway Incursions Design and Geometry Deficiencies Runway 8/26 Operations Potential Mitigation Next Steps
4. Demand/Capacity Assessment and Facility Requirements
 4. This chapter presents an evaluation of the existing airfield facilities, buildings, and other facilities at the Airport and an assessment of their potential use under the demand scenarios defined for
CHAPTER 5 - FACILITY REQUIREMENTS
 CHAPTER 5 - FACILITY REQUIREMENTS This chapter identifies the requirements for airfield and landside facilities to accommodate the forecast demand level. Facility requirements have been developed for the
DEVELOPMENT OF TOE MIDFIELD TERMINAL IROJECT CAPACITY ENHANCEMENT REPORT DEPARTMENT OF AVIATION TOM FOERSTER CHAIRMAN BARBARA HAFER COMMISSIONER
 PETE FLAHERTY COMMISSIONER TOM FOERSTER CHAIRMAN DEPARTMENT OF AVIATION BARBARA HAFER COMMISSIONER STEPHEN A. GEORGE DIRECTOR ROOM M 134, TERMINAL BUILDING GREATER PITTSBURGH INTERNATIONAL AIRPORT PITTSBURGH,
APPENDIX D MSP Airfield Simulation Analysis
 APPENDIX D MSP Airfield Simulation Analysis This page is left intentionally blank. MSP Airfield Simulation Analysis Technical Report Prepared by: HNTB November 2011 2020 Improvements Environmental Assessment/
MASTER PLAN CONCEPT 1 DRAFT
 The Airport Master Plan Update for Dallas Executive Airport has included the development of aviation demand forecasts, an assessment of future facility needs, and the evaluation of airport development
AIRSIDE CAPACITY AND FACILITY REQUIREMENTS
 AIRSIDE CAPACITY AND FACILITY REQUIREMENTS This Section investigates the capacity of the airport, its ability to meet current demand, and the facilities required to meet forecasted needs as established
Preliminary Findings of Proposed Alternative
 Preliminary Findings of Proposed Alternative The attached drawing provides a schematic layout of the proposed alternative that will be discussed on July 27, 2010. A full report will follow and should be
BNA Master Plan Update Community Advisory Committee Meeting No. 5
 A Six Sigma Organization BNA Master Plan Update Community Advisory Committee Meeting No. 5 September 19, 2012 Introductions MNAA Staff RW Armstrong Team Albersman & Armstrong, Ltd. Atkins North America,
STAFF REPORT. Airport Land Use Plan Consistency Review: Santa Barbara Airport Master Plan. MEETING DATE: November 19, 2015 AGENDA ITEM: 7D
 STAFF REPORT SUBJECT: Airport Land Use Plan Consistency Review: Santa Barbara Airport Master Plan MEETING DATE: AGENDA ITEM: 7D STAFF CONTACT: Peter Imhof, Andrew Orfila RECOMMENDATION: Adopt findings
CHAPTER FOUR AIRPORT ALTERNATIVES
 4.0 INTRODUCTION CHAPTER FOUR The goal of the master planning process is to provide the City of New Smyrna Beach with an assessment of the adequacy and capabilities of the Airport as well as to identify
Addendum - Airport Development Alternatives (Chapter 6)
") Bowers Field Addendum - Airport Development Alternatives (Chapter 6) This addendum to the Airport Development Alternatives chapter includes the preferred airside development alternative and the preliminary
Bowers Field Addendum - Airport Development Alternatives (Chapter 6) This addendum to the Airport Development Alternatives chapter includes the preferred airside development alternative and the preliminary
Westover Metropolitan Airport Master Plan Update
 Westover Metropolitan Airport Master Plan Update June 2008 INTRODUCTION Westover Metropolitan Airport (CEF) comprises the civilian portion of a joint-use facility located in Chicopee, Massachusetts. The
CHAPTER 3 ALTERNATIVES CONSIDERED
 CHAPTER 3 ALTERNATIVES CONSIDERED 3.0 ALTERNATIVES The 2010 Stevensville Airport Master Plan contained five (5) airside development options designed to meet projected demands. Each of the options from
Table of Contents. Overview Objectives Key Issues Process...1-3
 Table of Contents Chapter One Introduction Overview...1-1 Objectives...1-1 Key Issues...1-2 Process...1-3 Chapter Two Inventory of Existing Conditions Airport Setting...2-1 Locale...2-1 Airport Surroundings...2-5
3.1 Facility Requirements Overview Airfield Facility Requirements... 1
 Table of Contents 3.1 Overview... 1 3.2 Airfield... 1 Airspace Capacity...1 Airside Capacity... 2 Aircraft Mix Index... 3 Arrivals Percentage... 4 Touch-and-Go Percentage... 4 Taxiway Access Factors...
Appendix D Airfield Ongoing Projects Alternatives
 Appendix D Appendix D D.1 Introduction The set of alternatives for each of the airfield facilities was compared with respect to each other and the existing condition. 1 The screening and evaluation process
Lake Tahoe Airport Master Plan Public Meeting March 16, 2015
 Lake Tahoe Airport Master Plan Public Meeting March 16, 2015 What is an Airport Master Plan? a comprehensive study of an airport [that] usually describes the short, medium, and long term development plans
Capacity Analysis and Facility Requirements
 Capacity Analysis and Facility Requirements Introduction The capacity analysis for Paine Field is composed of two distinct elements: the ability of airport facilities to accommodate existing and projected
Airport Master Plan for Montgomery-Gibbs Executive Airport PAC Meeting #3
 Airport Master Plan for Montgomery-Gibbs Executive Airport PAC Meeting #3 Agenda > Introductions > Public Meetings Overview > Working Paper 3 - Facility Requirements > Working Paper 4 - Environmental Baseline
Planning Horizon Activity Levels Airfield Capacity and Delay Airport Physical Planning Criteria Airfield and Landside Facility Requirements
 Proper airport planning requires the translation of forecast aviation demand into the specific types and quantities of facilities that can adequately serve the identified demand. This chapter will analyze
CHAPTER 1 EXECUTIVE SUMMARY
 CHAPTER 1 EXECUTIVE SUMMARY 1 1 EXECUTIVE SUMMARY INTRODUCTION William R. Fairchild International Airport (CLM) is located approximately three miles west of the city of Port Angeles, Washington. The airport
The offers operators increased capacity while taking advantage of existing airport infrastructure. aero quarterly qtr_03 10
 The 747 8 offers operators increased capacity while taking advantage of existing airport infrastructure. 14 aero quarterly qtr_03 10 Operating the 747 8 at Existing Airports Today s major airports are
INTRODUCTION. General
 CHAPTER FOUR Airfield Demand/Capacity Analysis & Facility Requirements INTRODUCTION A key step in the master plan process is the determination of airport facility requirements to allow airside and landside
Chapter 5 Facility Requirements
 Chapter 5 Facility Requirements 5.0 INTRODUCTION The Facility Requirements chapter of this Sustainable Master Plan Update describes airside and landside facilities, which are needed to accommodate existing
Chapter 4.0 Alternatives Analysis
 Chapter 4.0 Alternatives Analysis Chapter 1 accumulated the baseline of existing airport data, Chapter 2 presented the outlook for the future in terms of operational activity, Chapter 3 defined the facilities
PORT OF PORTLAND. Chapter Four AVIATION FACILITY REQUIREMENTS
 PORT OF PORTLAND Chapter Four AVIATION FACILITY REQUIREMENTS CHAPTER FOUR PORT OF PORTLAND AVIATION FACILITY REQUIREMENTS In this chapter, existing components of the airport are evaluated to identify the
Raleigh-Durham International Airport Airport Capacity Enhancement Plan. August 1991
 ii Raleigh-Durham International Airport Airport Capacity Enhancement Plan August 1991 Prepared jointly by the U.S. Department of Transportation, Federal Aviation Administration, Raleigh-Durham Airport
1. Background and Proposed Action
 1. Background and Proposed Action This chapter describes Hillsboro Airport and the planning background for the proposed project. The Port of Portland (the Port) is the sponsor for the Hillsboro Airport
SIMMOD Simulation Airfield and Airspace Simulation Report. Oakland International Airport Master Plan Preparation Report. Revised: January 6, 2006
 Table of Contents SIMMOD Simulation Airfield and Airspace Simulation Report Oakland International Airport Master Plan Preparation Report Revised: January 6, 2006 Produced For: 1. Simmod PRO! Description...
Crosswind-based wake avoidance system approved by the FAA for operational use. Clark Lunsford (MITRE) & Dr. Edward Johnson May 15-16, 2013
 & Dr. Edward Johnson May 15-16, 2013") Crosswind-based wake avoidance system approved by the FAA for operational use Clark Lunsford (MITRE) & Dr. Edward Johnson May 15-16, 2013 Outline WTMD Concept Order signed authorizing WTMD operations WTMD
Crosswind-based wake avoidance system approved by the FAA for operational use Clark Lunsford (MITRE) & Dr. Edward Johnson May 15-16, 2013 Outline WTMD Concept Order signed authorizing WTMD operations WTMD
Airport Master Plan. Brookings Regional Airport. Runway Runway 17-35
 Runway 17-35 Airport Master Plan Runway 12-30 Brookings Regional Airport Table of Contents Table of Contents Chapter 1: Master Plan Goals... 1-1 1.1. Introduction... 1 1.2. Objective 1 Identify improvements
MASTER PLAN UPDATE WORKING PAPER NO. 3. Demand/Capacity Analysis and Facility Requirements. March 18, 2013
 MASTER PLAN UPDATE WORKING PAPER NO. 3 Demand/Capacity Analysis and Facility Requirements March 18, 2013 Contents 4 Demand/Capacity Analysis and Facility Requirements... 4 1 4.1 Summary of Aviation Demand
Tallahassee International Airport Master Plan. Technical Advisory Committee Meeting #2 October 19, 2016
 Tallahassee International Airport Master Plan Technical Advisory Committee Meeting #2 October 19, 2016 Agenda Welcome / Introductions Master Plan Process and Project Status Forecast of Aviation Demand
DRAFT MASTER PLAN UPDATE
 DRAFT MASTER PLAN UPDATE CHAPTER VI: AIRPORT LAYOUT PLAN NARRATIVE DRAFT REPORT APRIL 2017 PREPARED BY: Table of Contents WESTCHESTER COUNTY AIRPORT 6 AIRPORT LAYOUT PLAN NARRATIVE REPORT... 6-1 6.1 AGIS
Airport Master Plan for. Brown Field Municipal Airport PAC Meeting #3
 Airport Master Plan for Brown Field Municipal Airport PAC Meeting #3 Public Meeting #1 > 8/24/17 from 5:30 to 8:00 pm > 41 attendees signed-in > Comments: > EAA area > Environmental constraints > Focus
Chapter 4.0 Facility Requirements
 Chapter 4.0 Facility Requirements Having inventoried the existing infrastructure and forecasted demand, determining airport facility requirements is the next essential step in the airport master planning
Surveillance and Broadcast Services
 Surveillance and Broadcast Services Benefits Analysis Overview August 2007 Final Investment Decision Baseline January 3, 2012 Program Status: Investment Decisions September 9, 2005 initial investment decision:
CHAPTER 1 BACKGROUND AND PROPOSED ACTION
 CHAPTER 1 BACKGROUND AND PROPOSED ACTION 1.0 INTRODUCTION An Environmental Assessment (EA) evaluates the effects of a proposed Federal action on the surrounding environment and is prepared in compliance
JUNEAU RUNWAY INCURSION MITIGATION (RIM) PROGRAM. April 10 th 2017
 PROGRAM. April 10 th 2017") JUNEAU RUNWAY INCURSION MITIGATION (RIM) PROGRAM April 10 th 2017 1 Agenda Recap Potential Mitigation Response to Stakeholder Questions Next Steps 2 Recap 3 Background Master Plan considered the runway
JUNEAU RUNWAY INCURSION MITIGATION (RIM) PROGRAM April 10 th 2017 1 Agenda Recap Potential Mitigation Response to Stakeholder Questions Next Steps 2 Recap 3 Background Master Plan considered the runway
AIRFIELD CAPACITY AND FACILITY REQUIREMENTS
 CHAPTER FOUR: AIRFIELD CAPACITY AND FACILITY REQUIREMENTS 4.1 INTRODUCTION A key step in the Airport Master Plan Update (AMPU) process is determining future requirements for airport facilities that will
The demand/capacity analysis was performed utilizing Federal Aviation Administration (FAA) publications, including the following:
 publications, including the following:") Chapter Three To properly plan for the future of Monterey Regional Airport, it is necessary to examine the capacities of the key airport systems. This chapter uses the results of the forecasts prepared
Chapter Three To properly plan for the future of Monterey Regional Airport, it is necessary to examine the capacities of the key airport systems. This chapter uses the results of the forecasts prepared
Airfield Capacity Prof. Amedeo Odoni
 Airfield Capacity Prof. Amedeo Odoni Istanbul Technical University Air Transportation Management M.Sc. Program Air Transportation Systems and Infrastructure Module 10 May 27, 2015 Airfield Capacity Objective:
Lake Tahoe Airport Master Plan
 Lake Tahoe Airport Master Plan City Council Briefing October 20, 2015 What is an Airport Master Plan? a comprehensive study of an airport [that] usually describes the short, medium, and long term development
APPENDIX H 2022 BASELINE NOISE EXPOSURE CONTOUR
 APPENDIX H 2022 BASELINE NOISE EXPOSURE CONTOUR This appendix sets forth the detailed input data that was used to prepare noise exposure contours for 2022 Baseline conditions. H.1 DATA SOURCES AND ASSUMPTIONS
Dr. Antonio A. Trani Professor of Civil Engineering Virginia Polytechnic Institute and State University. Spring 2015 Blacksburg, Virginia
 CEE 4674 Airport Planning and Design Runway Length Calculations Addendum 1 Dr. Antonio A. Trani Professor of Civil Engineering Virginia Polytechnic Institute and State University Spring 2015 Blacksburg,
4.0 AIRFIELD CAPACITY & FACILITY REQUIREMENTS
 4.0 AIRFIELD CAPACITY & FACILITY REQUIREMENTS A key step in the Airport Master Plan (AMP) process is determining future requirements for airport facilities that will allow for airside and landside development
Draft Concept Alternatives Analysis for the Inaugural Airport Program September 2005
 Section 10 Preferred Inaugural Airport Concept 10.0 Introduction The Preferred Inaugural Airport Concept for SSA was developed by adding the preferred support/ancillary facilities selected in Section 9
DEPARTMENT: CIVIL ENGINEERING SEMESTER: III SUBJECT CODE / Name: CE2303/ Railway, Airport and Harbors Engineering 2 MARK QUESTIONS AND ANSWERS
 DEPARTMENT: CIVIL ENGINEERING SEMESTER: III SUBJECT CODE / Name: CE2303/ Railway, Airport and Harbors Engineering 2 MARK QUESTIONS AND ANSWERS 1.Define wind Coverage (AUC NOV/DEC 2010),(AUC NOV/DEC 2011)
AIRPORT WITH NO RUNWAYS IS A MALL
 RUNWAY EXTENSION INITIATIVE AT FT. LAUDERDALE HOLLYWOOD INTERNATIONAL AIRPORT ISMAEL IZZY BONILLA DEPUTY DIRECTOR BROWARD COUNTY AVIATION AUTHORITY AIRPORT WITH NO RUNWAYS IS A MALL Runway Business Case
CHAPTER 1: INTRODUCTION
 CHAPTER 1: INTRODUCTION Purpose and Scope The information presented in this report represents the study findings for the 2016 Ronan Airport Master Plan prepared for the City of Ronan and Lake County, the
Chapter 8.0 Implementation Plan
 Chapter 8.0 Implementation Plan 8.1 Introduction This chapter is the culmination of the analytical work accomplished in the previous chapters. The result is a prioritized list of the essential projects.
Table of Contents. List of Tables. Cincinnati/Northern Kentucky International Airport 2035 Master Plan Update
 Table of Contents 7.1. Airport Layout Plan (Existing Conditions)... 2 7.2. Airport Layout Plan (Future Conditions)... 3 7.3. Technical Data Sheet... 5 7.4. Commercial Terminal Area Drawing... 5 7.5. East
Quiet Climb. 26 AERO First-Quarter 2003 January
 Quiet Climb Boeing has developed the Quiet Climb System, an automated avionics feature for quiet procedures that involve thrust cutback after takeoff. By reducing and restoring thrust automatically, the
Dr. Antonio A. Trani Professor of Civil Engineering Virginia Polytechnic Institute and State University. January 27, 2009 Blacksburg, Virginia
 Dr. Antonio A. Trani Professor of Civil Engineering Virginia Polytechnic Institute and State University January 27, 2009 Blacksburg, Virginia 1 Runway Design Assumptions (FAA 150/5325-4b) Applicable to
Prepared By: Mead & Hunt, Inc Port Lansing Road Lansing, MI 48906
 Master Plan The preparation of this document was financed in part through a planning grant from the Federal Aviation Administration (FAA) as provided under Section 505 of the Airport and Airway Improvement
DEMAND/CAPACITY ANALYSIS St. Petersburg-Clearwater International Airport
 DEMAND/CAPACITY ANALYSIS St. Petersburg-Clearwater International Airport 5.1 GENERAL OVERVIEW The next step in the Master Plan process is analyzing the capacity of existing airport facilities against forecasted
FACILITY REQUIREMENTS
 FACILITY REQUIREMENTS In order to ensure that Bradley International Airport (BDL) is capable of supporting the expected increase in passenger traffic, care must be taken to ensure that the recommendations
1.0 Project Background Mission Statement and Goals Objectives of this Sustainable Master Plan
 TABLE OF CONTENTS CHAPTER 1 INTRODUCTION 10 Project Background 1-1 11 Mission Statement and Goals 1-1 12 Objectives of this Sustainable Master Plan 1-2 CHAPTER 2 INVENTORY 20 Airport Background 2-1 201
Source: Chippewa Valley Regional Airport ASOS, Period of Record
 Chapter 1 Inventory Runway wind coverage is the percentage of time a runway can be used without exceeding allowable crosswind velocities. Allowable crosswind velocities vary depending on aircraft size
TABLE OF CONTENTS. General Study Objectives Public Involvement Issues to Be Resolved
 TABLE OF CONTENTS Description Page Number LIST OF ACRONYMS... a CHAPTER ONE INTRODUCTION General... 1-1 Study Objectives... 1-1 Public Involvement... 1-2 Issues to Be Resolved... 1-2 CHAPTER TWO EXISTING
TECHNICAL REPORT #3 Palm Beach International Airport Demand/Capacity and Facility Requirements
 TECHNICAL REPORT #3 Palm Beach International Airport Demand/Capacity and Facility Requirements Technical Report #3 Palm Beach International Airport Demand/Capacity and Facility Requirements Palm Beach
STUDY WORK GROUP MEETING No. 3. November 29, 2016
 STUDY WORK GROUP MEETING No. 3 November 29, 2016 Agenda Welcome and introductions Update project schedule Brief overview of previous SWG meeting Update on aviation forecasts Introduction to airfield demand/capacity
Regional Jets ,360 A319/ , , , ,780
 Excel Tab Name: Seats (18 MAP) PASSENGER AIRLINE FLIGHT SCHEDULE CALCULATION RECORD Summary 17.2 MAP flight schedule* (with Southwest Airlines B737-800s changed to B737-700s) Number of Total Seats Avg.
BNA Master Plan Update Public Meeting No. 2
 A Six Sigma Organization BNA Master Plan Update Public Meeting No. 2 September 18, 2012 Agenda BNA Master Plan Update Consultants Status of the BNA Master Plan Update Workstation Boards Forecasts of Aviation
Transportation Engineering -II Dr. Rajat Rastogi Department of Civil Engineering Indian Institute of Technology - Roorkee
 Transportation Engineering -II Dr. Rajat Rastogi Department of Civil Engineering Indian Institute of Technology - Roorkee Lecture - 36 Aprons & Aircraft Parking Dear students, today s lecture we are going
Technical Memorandum. Synopsis. Steve Carrillo, PE. Bryan Oscarson/Carmen Au Lindgren, PE. April 3, 2018 (Revised)
") Appendix D Orange County/John Wayne Airport (JWA) General Aviation Improvement Program (GAIP) Based Aircraft Parking Capacity Analysis and General Aviation Constrained Forecasts Technical Memorandum To:
Appendix D Orange County/John Wayne Airport (JWA) General Aviation Improvement Program (GAIP) Based Aircraft Parking Capacity Analysis and General Aviation Constrained Forecasts Technical Memorandum To:
II. Purpose and Need. 2.1 Background
 II. 2.1 Background The Metropolitan Washington Airports Authority is preparing an Environmental Assessment of potential environmental impacts associated with proposed enhancements to the Runway 4-22 and