Las Vegas McCarran International Airport. Capacity Enhancement Plan
|
|
|
- Shannon Anthony
- 5 years ago
- Views:
Transcription


1 Las Vegas McCarran International Airport Capacity Enhancement Plan
2
3 Las Vegas McCarran International Airport Capacity Enhancement Plan September 1994 Prepared jointly by the U.S. Department of Transportation, Federal Aviation Administration, Clark County Department of Aviation, and the airlines and general aviation serving Las Vegas. (1)
4 TABLE OF CONTENTS (2)
5 Executive Summary... 4 Section 1 Introduction Background Las Vegas McCarran International Airport Las Vegas Airport Capacity Design Team Objectives Scope Methodology Section 2 Capacity Enhancement Alternatives Background Airfield Improvements Facilities and Equipment Improvements Operational Improvements Section 3 Summary of Technical Studies Overview Airfield Capacity Aircraft Delays Conclusions Appendix A Participants Appendix B Computer Models and Methodology Computer Models Methodology Appendix C Abbreviations Figure 1. Las Vegas McCarran International Airport... 6 Figure 2. Capacity Enhancement Alternatives and Annual Delay Savings... 7 Figure 3. Airport Capacity Curves Hourly Flow Rate Versus Average Delay... 8 Figure 4. Profile of Daily Demand Hourly Distribution... 8 Figure 5. Annual Delay Costs Capacity Enhancement Alternatives... 9 Figure 6. Average Delays Capacity Enhancement Alternatives... 9 Figure 7. Capacity Enhancement Alternatives Studied and Recommended Actions Figure 8. Airfield Weather Figure 9. Daily Traffic Demand Distribution by Aircraft Class Figure 10. Annual Traffic Demand Distribution Figure 11. Runway Configuration Percentage Use Figure 12. Existing Runway Configurations Figure 13. Future Runway Configurations Figure 14. Airfield Demand Levels Figure 15. Airport Capacity Curves Hourly Flow Rate Versus Average Delay Figure 16. Profile of Daily Demand Hourly Distribution Figure 17. Annual Delay Costs Capacity Enhancement Alternatives Figure 18. Average Delays Capacity Enhancement Alternatives (3)
6 EXECUTIVE SUMMARY (4)
7 Recognizing the problems posed by congestion and delay within the National Airspace System, the Federal Aviation Administration (FAA), airport operators, and aviation industry groups have initiated joint Airport Capacity Design Teams at various major air carrier airports throughout the U.S. Each Capacity Team identifies and evaluates alternative means to enhance existing airport and airspace capacity to handle future demand, decrease delays, and improve airport efficiency and works to develop a coordinated action plan for reducing airport delay. Over 35 Airport Capacity Design Teams have either completed their studies or have work in progress. The need for this program continues. In 1992, 23 airports each exceeded 20,000 hours of airline flight delays. If no improvements in capacity are made, the number of airports that could exceed 20,000 hours of annual aircraft delay is projected to grow from 23 to 32 by Las Vegas McCarran International Airport (LAS) is, according to FAA forecasts, one of the 32 airports that could exceed 20,000 hours of annual air carrier delay in 2003, if no improvements in capacity are made. Steady growth at LAS has made it one of the busiest airports in the country. Activity at the airport has increased from 4,830,000 passenger enplanements in 1983 to 10,110,634 in 1991, an increase of over 109 percent. In 1983, the airport handled 297,000 aircraft operations (takeoffs and landings), and, in 1991, 398,065 aircraft operations, an increase of 34 percent. An Airport Capacity Design Team for Las Vegas McCarran International Airport was formed in The LAS Capacity Team identified and assessed various actions that, if implemented, would increase LAS s capacity, improve operational efficiency, and reduce aircraft delays. The purpose of the process was to determine the technical merits of each alternative action and its impact on capacity. Additional studies will be needed to assess environmental, socioeconomic, or political issues associated with these actions. Selected alternatives identified by the Capacity Team were tested using computer models developed by the FAA to quantify the benefits provided. Different levels of activity were chosen to represent growth in aircraft operations in order to compare the merits of each action. These annual activity levels are referred to throughout the report as: Baseline 425,000 operations; Future 1 530,000 operations; and Future 2 628,000 operations. The FAA Technical Center calculated annual aircraft delays based on the results of computer simulations that utilized runway use, weather, and operating cost data generated during the Capacity Team study. At the Baseline activity level with the current runway use strategies, the majority of delays were incurred by general aviation and air taxi aircraft. Because of their low operating costs, this resulted in high delay times but low delay costs. Since forecasts predict significant changes in the aircraft fleet mix at future activity levels, operating costs were substantially higher at Future 1 and Future 2 than at Baseline. In addition, with the new runway use strategies developed for the proposed runway extensions, delays at Future 1 and Future 2 were distributed equally among all the aircraft in the fleet, and this further increased average aircraft operating costs at these activity levels. Figure 3 illustrates capacity and delay curves for LAS. To show operations under visual meteorological conditions (VMC), curves were developed with a south and west flow (Configuration 1 under VFR and Configuration 1A under VFR 2) for the existing airport and for the future airport with the extensions of Runway 1L/19R and Runways 7L/25R and 7R/25L in place. To show operations under instrument meteorological conditions (IMC), curves were developed with a west flow (Configuration 2 under IFR) for the existing airport and for the future airport with the extensions in place. Figure 3 shows that, for the existing airport, aircraft delays will begin to escalate rapidly under VFR as hourly demand exceeds 110 operations per hour. Figure 4 shows that, while hourly demand exceeds 110 operations per hour only during a single hour at Baseline demand levels, 110 operations per hour is exceeded during the bulk of the day at the demand levels forecast for Future 2. Under IFR, the capacity of the airport is significantly lower. Although IFR operations occur only 2 percent of the time in winter and less than 1 percent of the time in summer, the impact of the associated delays can be critical. Figure 5 shows how delay will continue to grow at a substantial rate as demand increases if there are no improvements made in airfield capacity, i.e., the Do Nothing scenario. Annual delay cost will increase from 110,390 hours or $58.26 million at the Baseline level of operations to 351,460 hours or $ million by Future 1 and 947,160 hours or $1, million by Future 2. It is important to notice that the ratio of delay to cost is not consistent between the demand levels. This is due to variations in operational strategy and fleet mixes between Baseline, Future 1, and Future 2. Figure 5 also indicates the capacity enhancement alternatives that provide the most significant delay-savings benefits. Figure 6 illustrates the average delay in minutes per aircraft operation for these alternatives. Under the Do Nothing alternative, if there are no improvements made in airfield capacity, the average delay per operation of 15.6 minutes at the Baseline level of activity will increase to 39.4 minutes per operation by Future 1 and 90.5 minutes per operation by Future 2. (5)
8 Figure 1. Las Vegas McCarran International Airport 1,000 ft. 25R 1 Existing Runway TAXIWAY BB 25L New Runway/Runway Extension Existing Taxiway/Apron New Taxiway/Apron Existing Buildings Air Cargo New Buildings Displaced Threshold 6 Control Tower 2 150' x 12,676' TAXIWAY B 13 Satellite One TAXIWAY A 150' x 8,900' A-3 A-3 Main Terminal 5 A ft. TAXIWAY C Charter International Terminal L 19R 75' x 5,001' TAXIWAY D C-4 150' x 9,776' A-4 5 C-6 TAXIWAY B 3 TAXIWAY E TAXIWAY C 7R 1,000 ft. 1L 1R 5,000 ft. 1 7L 4 5 (6)
9 Figure 2. Capacity Enhancement Alternatives and Annual Delay Savings Estimated Annual Delay Savings 1 (in hours and millions of 1992 dollars) Baseline Future 1 Future 2 Airfield Improvements (425,000) (530,000) (628,000) 1. Extend Runway 7L/25R to 14,400 ft. 60/$0.03 1,370/$2.1 35,130/$ Construct parallel Taxiway BB to end 2 of Runway 25R 3. Extend Runway 7R/25L to 10,600 ft. 4. Extend/upgrade Runway 1L/19R to 9,800 ft. 50,750/$ ,160/$ ,160/$ Taxiway improvements to support main 9,460/$ ,690/$ ,050/$81.5 terminal area and Runway 1L/19R extension 6. Construct Taxiway AC from Taxiway A 1,980/$2.3 3,480/$5.4 3,880/$6.4 at end of Runway 25R to Taxiway C at end of Runway 19L Facilities and Equipment Improvements 7. Install precision approach system 6,590/$8.5 8,330/$ ,640/$18.4 on Runway 19R or 19L 8. Install precision approach system 6,860/$8.8 10,110/$ ,050/$22.5 on Runway 1R or 1L Operational Improvements 9. Reduce in-trail separation from 3.0 nm to 2,750/$3.5 3,160/$5.2 3,850/$ nm for like classes of aircraft in IFR 10. Evaluate effect of simultaneous operations 330/$0.1 6,580/$ ,180/$40.4 on intersecting runways (SOIR) with tail winds on dry runways 11. Evaluate effect of operations on wet runways 50/$ /$1.6 2,020/$ Enhance reliever and GA airport system 12a. 30 percent of small/slow aircraft 16,520/$3.9 53,140/$ ,570/$ b. 60 percent of small/slow aircraft 21,160/$9.3 70,270/$ ,160/$ Evaluate impact of terminal expansion 960/$1.1 40,400/$ ,940/$204.7 (68 additional aircraft parking positions) 1. The delay savings benefits of these alternatives are not necessarily additive. 2. The delay savings benefits of Taxiway BB have been included as a part of the benefits of the terminal expansion program (see Alternative 13). No delay savings were estimated for this alternative. There is a description of this improvement in Section 2 Capacity Enhancement Alternatives (7)
10 Figure 3. Airport Capacity Curves Hourly Flow Rate Versus Average Delay Existing Airfield Future Airfield Config 1, VFR Config 1, VFR 50 Config 1a, VFR 2 50 Config 1a, VFR 2 Average Delay (min) Config 2, IFR Average Delay (min) Config 2, IFR Total Flow (a/c per hour) Total Flow (a/c per hour) Figure 4. Profile of Daily Demand Hourly Distribution Operations per Hour Baseline Arrivals Baseline Departures Baseline Total Future 2 Total :00 01:00 02:00 03:00 04:00 05:00 06:00 07:00 08:00 09:00 10:00 11:00 12:00 13:00 14:00 15:00 16:00 17:00 18:00 19:00 20:00 21:00 22:00 23:00 Time of Day (8)
11 Figure 5. Annual Delay Costs Capacity Enhancement Alternatives Annual Delay (000 hours) 1, Do Nothing Extend Rwy 7L/25R to 14,400 ft. Twy improvements to support main terminal area and Rwy 1L/19R extension Impact of terminal expansion Extend/Upgrade Rwy 1L/19R to 9,800 ft. 1, Annual Delay (000 hours) Annual Demand (thousands of operations) Figure 6. Average Delays Capacity Enhancement Alternatives Average Delay (minutes) Do Nothing Extend Rwy 7L/25R to 14,400 ft. Twy improvements to support main terminal area and Rwy 1L/19R extension Impact of terminal expansion Extend/Upgrade Rwy 1L/19R to 9,800 ft Average Delay (minutes) Annual Demand (thousands of operations) Major Recommendations Annual Delay Savings Future 1 Future 2 Alternatives Hours 1992 $ M Hours 1992 $ M Extend/upgrade Runway 1L/19R to 9,800 feet 157,160 $ ,160 $ Evaluate impact of terminal expansion 40,400 $ ,940 $ (68 additional aircraft parking positions) Taxiway improvements to support main 44,690 $ ,050 $81.46 terminal area and Runway 1L/19R extension Extend Runway 7L/25R to 14,400 feet 1,370 $ ,130 $63.42 (9)
12 SECTION 1 INTRODUCTION (10)
13 Background Recognizing the problems posed by congestion and delay within the National Airspace System, the Federal Aviation Administration (FAA) asked the aviation community to study the problem of airport congestion through the Industry Task Force on Airport Capacity Improvement and Delay Reduction chaired by the Airport Operators Council International. By 1984, aircraft delays recorded throughout the system highlighted the need for more centralized management and coordination of activities to relieve airport congestion. In response, the FAA established the Airport Capacity Program Office, now called the Office of System Capacity and Requirements (ASC). The goal of this office and its capacity enhancement program is to identify and evaluate initiatives that have the potential to increase capacity, so that current and projected levels of demand can be accommodated within the system with a minimum of delay and without compromising safety or the environment. In 1985, the FAA initiated a renewed program of Airport Capacity Design Teams at various major air carrier airports throughout the U.S. Each Capacity Team identifies and evaluates alternative means to enhance existing airport and airspace capacity to handle future demand and works to develop a coordinated action plan for reducing airport delay. Over 30 Airport Capacity Design Teams have either completed their studies or have work in progress. The need for this program continues. In 1992, 23 airports each exceeded 20,000 hours of airline flight delays. If no improvements in capacity are made, the number of airports that could exceed 20,000 hours of annual aircraft delay is projected to grow from 23 to 32 by The challenge for the air transportation industry in the nineties is to enhance existing airport and airspace capacity and to develop new facilities to handle future demand. As environmental, financial, and other constraints continue to restrict the development of new airport facilities in the U.S., an increased emphasis has been placed on the redevelopment and expansion of existing airport facilities. Las Vegas McCarran International Airport Las Vegas McCarran International Airport is one of the 32 airports that the FAA has forecast could exceed 20,000 hours of annual aircraft delay by 2003, if no improvements in capacity are made. In the past decade, McCarran International Airport (LAS) has been one of the nation s busiest airports. Enplanements at LAS rose from 4,830,000 in 1983 to 10,110,634 in 1991, an increase of over 109 percent. LAS s total aircraft operations (one takeoff or one landing equals one operation) reached 398,065 in 1991, an increase of 34 percent over the 297,000 aircraft operations the airport handled in McCarran International Airport is owned by Clark County, Nevada, and operated through the Clark County Department of Aviation. The airport is currently situated on about 2,800 acres and is at an elevation of 2,175 feet above mean sea level. The airfield has four asphalt-paved runways. Runway 7L/25R, which is oriented east-west, is 12,636 feet long and is used primarily by air carrier aircraft. The landing threshold of Runway 7L is displaced 1,667 feet to the east to provide the required obstacle clearance over an antenna west of the Airport. The instrument landing system (ILS) on Runway 25L is for Category I (CAT I) approaches. The 1.04 percent effective gradient of Runway 7L/25R is upward to the west. Runway 7R/25L is 8,900 feet long and is also used primarily by air carrier aircraft. Runway 7R/25L is parallel to and 1,000 feet south of Runway 7L/25R, when measured from centerline to centerline of the two runways. The ILS on Runway 25L is also for CAT I approaches. The 1.04 percent effective gradient of Runway 7R/25L is upward to the west. Runway 1R/19L, which is oriented northeast-southwest, is 9,776 feet long and is also used primarily by air carrier aircraft. The landing threshold of Runway 1R is displaced 500 feet to the northeast to provide obstacle clearance over the Union Pacific Railroad tracks. The landing threshold of Runway 19L is displaced 874 feet to the southwest to provide obstacle clearance over a nearby pole. The 0.99 percent effective gradient of Runway 1R/19L is upward to the southwest. (11)
14 Runway 1L/19R is 5,001 feet long and 75 feet wide and is used primarily by general aviation and commuter aircraft. Runway 1L/19R is parallel to and feet northwest of Runway 1R/19L. The 1.06 percent effective gradient of Runway 1L/19R is upward to the southwest. Each of the four runways has a parallel taxiway that extends the entire length of the runway. Runways 7R/25L and 1R/19L have angled exit taxiways to expedite aircraft exiting the runway after landing. Aircraft holding pads are located at the east end of Runways 7L/25R and 7R/ 25L, at the north end of and between Runways 1L/19R and 1R/19L, and southwest of the Main Terminal. Las Vegas Airport Capacity Design Team An Airport Capacity Design Team for McCarran International Airport was formed in The LAS Capacity Team identified and assessed various actions that, if implemented, would increase capacity, improve operational efficiency, and reduce aircraft delays. The purpose of the process was to determine the technical merits of each alternative action and its impact on capacity. Additional studies will be needed to assess environmental, socioeconomic, or political issues associated with these actions. This report has established benchmarks for development based upon traffic levels and not upon any definitive time schedule, since actual growth can vary year to year from projections. As a result, the report should retain its validity until the highest traffic level is attained regardless of the actual dates paralleling the development. A Baseline benchmark of 425,000 aircraft operations (takeoffs and landings) was established based on the annual traffic level for Two future traffic levels, Future 1 and Future 2, were established at 530,000 and 628,000 annual aircraft operations respectively, based on Capacity Team consensus of potential traffic growth at Las Vegas. If no improvements are made at LAS, annual delay levels and delay costs are expected to increase from an estimated 110,390 hours and $58.26 million at the Baseline activity level to 351,460 hours and $ million by the Future 1 demand level and 947,160 hours and $1, million by Future 2. The Capacity Team studied various proposals with the potential for increasing capacity and reducing delays at LAS. The improvements evaluated by the Capacity Team are delineated in Figure 2 and described in some detail in Section 2, Capacity Enhancement Alternatives. Objectives Scope The major goal of the Capacity Team was to identify and evaluate proposals to increase airport capacity, improve airport efficiency, and reduce aircraft delays. In achieving this objective, the Capacity Team: Assessed the current airport capacity. Examined the causes of delay associated with the airfield, the immediate airspace, and the apron and gate-area operations. Evaluated capacity and delay benefits of alternative air traffic control (ATC) procedures, navigational improvements, airfield development, and operational improvements. The Capacity Team limited its analyses to aircraft activity within the terminal area airspace and on the airfield. They considered the operational benefits of the proposed airfield improvements, but did not address environmental, socioeconomic, or political issues regarding airport development. These issues need to be addressed in future airport planning studies, and the data generated by the Capacity Team can be used in such studies. (12)
15 Methodology The Capacity Team, which included representatives from the FAA, the Clark County Aviation Department, the State of Nevada Department of Transportation, and various aviation industry groups (see Appendix A), met periodically for review and coordination. The Capacity Team members considered suggested capacity improvement alternatives proposed by the FAA s Office of System Capacity and Requirements, Technical Center, and Regional Aviation Capacity Program Manager, and by other members of the Team. Alternatives that were considered practicable were developed into experiments that could be tested by simulation modeling. The FAA Technical Center s Aviation Capacity Branch provided expertise in airport simulation modeling. The Capacity Team validated the data used as input for the simulation modeling and analysis and reviewed the interpretation of the simulation results. The data, assumptions, alternatives, and experiments were continually reevaluated, and modified where necessary, as the study progressed. A primary goal of the study was to develop a set of capacity-producing recommendations, complete with planning and implementation time horizons. Initial work consisted of gathering data and formulating assumptions required for the capacity and delay analysis and modeling. Where possible, assumptions were based on actual field observations at LAS. Proposed improvements were analyzed in relation to current and future demands with the help of FAA computer models, the Airport and Airspace Simulation Model (SIMMOD) and the Runway Delay Simulation Model (RDSIM). Appendix B briefly explains the models. The simulation models considered air traffic control procedures, airfield improvements, and traffic demands. Alternative airfield configurations were prepared from present and proposed airport layout plans. Various configurations were evaluated to assess the benefit of projected improvements. Air traffic control procedures and system improvements determined the aircraft separations to be used for the simulations under both VFR and IFR. Air traffic demand levels were derived from Official Airline Guide data, historical data, and Capacity Team and other forecasts. Aircraft volume, mix, and peaking characteristics were considered for each of the three different demand forecast levels (Baseline, Future 1, and Future 2). From this, annual delay estimates were determined based on implementing various improvements. These estimates took into account historic variations in runway configuration, weather, and demand. The annual delay estimates for each configuration were then compared to identify delay reductions resulting from the improvements. Following the evaluation, the Capacity Team developed a plan of recommended alternatives for consideration. (13)
16 SECTION 2 CAPACITY ENHANCEMENT ALTERNATIVES (14)
17 Background The capacity enhancement alternatives are categorized and discussed under the following headings: Airfield Improvements Facilities and Equipment Improvements Operational Improvements Figure 1 shows the current layout of the airport, plus the airfield improvements considered by the Capacity Team. Figure 2 lists the capacity enhancement alternatives evaluated by the Capacity Team and presents the estimated annual delay savings benefits for selected improvements. The annual delay savings are given for the activity levels Baseline, Future 1, and Future 2, which correspond to annual aircraft operations of 425,000, 530,000, and 628,000 respectively. The delay savings benefits of the improvements are not necessarily additive. Figure 7 presents the recommended action and suggested time frame for each capacity enhancement alternative considered by the Capacity Team. (15)
18 Figure 7. Capacity Enhancement Alternatives Studied and Recommended Actions Time Responsible Airfield Improvements Action Frame Agency 1. Extend Runway 7L/25R to 14,400 ft. Recommended Completed DOA 2. Construct parallel Taxiway BB Recommended Future 1 DOA to end of Runway 25R 3. Extend Runway 7R/25L to 10,600 ft. 4. Extend/upgrade Runway 1L/19R to 9,800 ft. Recommended DOA 5. Taxiways improvements to support main terminal Recommended DOA area and Runway 1L/19R extension 6. Construct Taxiway AC from Taxiway A at end of Not Recommended Future 1 DOA Runway 25R to Taxiway C at end of Runway 19L Facilities and Equipment Improvements 7. Install precision approach system Recommended Future 1 FAA on Runway 19R or 19L 8. Install precision approach system Recommended Future 1 FAA on Runway 1R or 1L Operational Improvements 9. Reduce in-trail separation from 3.0 nm to Recommended Future 1 DOA/FAA 2.5 nm for like classes of aircraft in IFR 10. Evaluate effect of simultaneous operations on Recommended Future 1 FAA intersecting runways (SOIR) with tail winds on dry runways 11. Evaluate effect of operations on wet runways Recommended Future 1 FAA 12. Enhance reliever and GA airport system Recommended Future 1 DOA/FAA 13. Evaluate impact of terminal expansion Recommended Future 1 All Agencies 3 (68 additional aircraft parking positions) 3. All Agencies = FAA, DOA, and the airlines. (16)
19 Airfield Improvements 1. Extend Runway 7L/25R to 14,400 feet. Runway 7L/25R, which intersects Runway 1R/19L, is the primary departure runway for the Airport. Air traffic control procedures for operations conducted on intersecting runways are, by necessity, more restrictive than for operations conducted on non-intersecting or parallel runways. This project, completed during the course of this study, extended Runway 7L/25R approximately 400 feet to the west and 1,400 feet to the east. The proximity of Eastern Avenue on the east and Las Vegas Boulevard on the west limited the ability to extend the runway beyond a certain length without incurring significantly greater expense to realign or depress these roadways. The extension of Runway 7L/25R to 14,400 feet increased the capability for nonstop international passenger or long-haul air cargo operations to international destinations overseas using fully loaded aircraft. The extension required the relocation of the ILS localizer antenna for Runway 25R. The antenna, originally located near the west end of the existing runway, was already programmed for upgrade and relocation. The new location is compatible with the runway extension. Estimated 1993 project cost was $14.0 million. Annual delay savings at the Baseline activity level will be 60 hours or $0.03 million; at Future 1, 1,370 hours or $2.07 million; and, at Future 2 activity levels, 35,130 hours or $63.42 million. 2. Construct parallel Taxiway BB to end of Runway 25R. An additional parallel taxiway, Taxiway BB, on the north side of Runway 7L/25R, north of Taxiway B, would allow two-way traffic for arriving and departing aircraft to taxi to and from the new terminal complex and the eastern extension of Runway 25R, thus improving the flow of ground traffic and reducing taxi interference and delays. The delay savings benefits of Taxiway BB have been included as a part of the benefits of the terminal expansion program (see Alternative 13). Estimated 1993 project cost is $1.75 million. 3. Extend Runway 7R/25L to 10,600 feet. This project would extend Runway 7R/25L approximately 1,600 feet to the west. The extension would allow most of the aircraft currently operating at the Airport to depart from the runway and thus would provide additional airfield flexibility as well as an increase in overall capacity. (17)
20 Runway 7R/25L is separated from Runway 7L/25R by 1,000 feet. The two parallel runways could support dual arrival and departure streams, but only under VFR. Under IFR, runways separated by less than 2,500 feet must be treated as a single runway. Estimated 1993 project cost is $3.2 million. 4. Extend/upgrade Runway 1L/19R to 9,800 feet. This project would extend the runway pavement length to 9,800 feet, approximately the same length as Runway 1R/19L. Extending, widening, and strengthening Runway 1L/19R to accommodate air carrier operations would provide an additional air carrier runway. Airport flexibility will be increased even though, due to runway safety area and object free area requirements, the actual runway lengths available for arrival and departure operations would not be equal to the full length of the pavement in either direction. A further extension Runway 1R/19L is restricted by the availability of land on the west side of the airfield and the proximity of Tropicana Avenue to the north and Las Vegas Boulevard to the southwest. The potential centerline-to-centerline separation of Runway 1L/ 19R from Runway 1R/19L is impacted by the need to provide adequate areas for fixed-base operators and general aviation facilities on the west side of the airfield. Prior to extending the runway, it will be necessary to relocate the Union Pacific Railroad tracks which pass through the southwest corner of the Airport property, however, estimated savings indicate that this project will be cost effective. Estimated 1993 project cost of alternatives 4 and 5 combined is $63.0 million. Annual delay savings at the Baseline activity level would be 50,750 hours or $5.22 million; at Future 1, 157,160 hours or $ million; and, at Future 2 activity levels, 385,160 hours or $ million. 5. Taxiways improvements to support main terminal area and Runway 1L/19R extension. The extension of Taxiway C, construction of Taxiway AA4, and upgrade of the Taxiway A3 area will enable the reorganization of aircraft movement for operation in an orderly fashion in and around the Main Terminal and Satellite One on the east side of the Airport. These improvements will be used primarily by scheduled air carrier, charter, and international operators. Theses improvements are also expected to facilitate movement of aircraft between the east and west sides of the airport. Extending Taxiway C from Exit C4 to Exit C6 would provide for a parallel taxiway along the entire length of the east side of Runway 1R/ 19L. This would improve the flow of ground traffic and reduce taxi interference and delays. The construction of exits and connectors, an extension of Taxiway E, and an apron edge taxilane parallel to Taxiway E would facilitate (18)
21 aircraft movement throughout the west side of the airport. This would support the continuing needs of general aviation and non-scheduled aircraft operations by providing for improved access to various apron areas for either parking or loading and unloading activities. The addition of exits and connectors on Runway 1L/19R would aid in reducing occupancy time for arrivals on the runway. By reducing arrival runway occupancy times, the airfield can be operated more efficiently when arrivals and departures are evenly mixed. Additionally, a reduction in runway occupancy times to an average of 50 seconds or less would facilitate reducing arrival-to-arrival in-trail separations on final approach to 2.5 nm for aircraft of similar class (see alternative 10), thereby providing an important additional capacity advantage. As a part of the construction of an upgraded Runway 1L/19R, a parallel taxiway and taxilane system should be built west of the new runway. Extending, widening, and strengthening Taxiway E would provide for a parallel taxiway the entire length of the runway. The current FAA requirement for runway-to-taxiway separation is 400 feet. Constructing an apron edge taxilane parallel to Taxiway E would allow for two-way traffic, thus improving the flow of ground traffic and reducing taxi interference and delays. Estimated 1993 project cost of alternatives 4 and 5 combined is $63.0 million. Annual delay savings at the Baseline activity level would be 9,460 hours or $11.01 million; at Future 1, 44,690 hours or $68.81 million; and, at Future 2 activity levels, 49,050 hours or $81.47 million. 6. Construct Taxiway AC from Taxiway A at end of Runway 25R to Taxiway C at end of Runway 19L. Constructing Taxiway AC from Taxiway A at the east end of Runway 7L/25R to Taxiway C at the north end of Runway 1R/19L would improve access to the new terminal complex, improve the flow of ground traffic, and reduce taxi interference and delays. Annual delay savings at the Baseline activity level would be 1,980 hours or $2.26 million; at Future 1, 3,480 hours or $5.39 million; and, at Future 2 activity levels, 3,880 hours or $6.40 million. (19)
22 Facilities and Equipment Improvements 7. Install precision approach system on Runway 19R or 19L. Instrument flight rules (IFR) that restrict operations occur about 2 percent of the time in winter and less than 1 percent of the time in summer, but the impact of the associated delays can be significant. Currently only Runways 25L and 25R are equipped with ILSs. Installing a precision approach system on Runway 19R or 19L would provide additional flexibility in the use of runways for precision approach, thereby helping to maintain capacity during instrument meteorological conditions (IMC). Under VFR, it is common to use converging runways for independent streams of arriving aircraft. Because of the reduced ceilings and visibility associated with operations under IFR, the FAA has established a procedure for conducting simultaneous instrument approaches to converging runways in IMC. This procedure uses non-overlapping Terminal Instrument Procedures (TERPS) obstacle-clearance surfaces as a means of separation for aircraft executing simultaneous missed approaches. It requires a 3 nm separation between the missed approach points on each approach. TERPS+3 (as this procedure is often called) is an independent approach procedure that requires no dependency between the two aircraft on converging approaches. Installing a precision approach system on Runway 19L would enable converging IFR approaches to Runways 19L and 25L. Annual delay savings at the Baseline activity level would be 6,590 hours or $8.48 million; at Future 1, 8,330 hours or $13.58 million; and, at Future 2 activity levels, 10,640 hours or $18.38 million. 8. Install precision approach system on Runway 1R or 1L. IFR that restrict operations occur about 2 percent of the time in winter and less than 1 percent of the time in summer, but the impact of the associated delays can be significant. Currently only Runways 25L and 25R are equipped with ILSs. Installing a precision approach system on Runway 1R or 1L would provide additional flexibility in the use of runways for precision approach, thereby helping to maintain capacity during IMC. Under VFR, it is common to use converging runways for independent streams of arriving aircraft. Because of the reduced ceilings and visibility associated with operations under IFR, the FAA has established a procedure for conducting simultaneous instrument approaches to converging runways in IMC. This procedure uses non-overlapping Terminal Instrument Procedures (TERPS) obstacle-clearance surfaces as a means of separation for aircraft executing simultaneous missed approaches. It requires a 3 nm separation between the missed approach points on each approach. TERPS+3 (as this procedure is often called) is an independent approach procedure that requires no dependency between the two aircraft on converging approaches. Installing a preci- (20)
23 sion approach system on Runway 1R would enable converging IFR approaches to Runways 1R and 25L. Annual delay savings at the Baseline activity level would be 6,860 hours or $8.83 million; at Future 1, 10,110 hours or $16.46 million; and, at Future 2 activity levels, 13,050 hours or $22.52 million. Operational Improvements 9. Reduce in-trail separation from 3.0 nm to 2.5 nm for like classes of aircraft in IFR. Reducing separation minimums to 2.5 nm for aircraft of similar class would increase arrival rates and runway capacity. Aircraft capable of takeoff weights of 300,000 pounds or more and the Boeing 757 may participate in the separation reduction as trailing aircraft only. Most of the delay savings occur at the highest demand levels under IFR. In order to use reduced final approach in-trail separations, it must be demonstrated that runway occupancy times for arrivals are consistently 50 seconds or less. Annual delay savings at the Baseline activity level would be 2,750 hours or $3.53 million; at Future 1, 3,160 hours or $5.20 million; and, at Future 2 activity levels, 3,850 hours or $6.73 million. 10. Evaluate effect of simultaneous operations on intersecting runways (SOIR) with tail winds on dry runways. Approved simultaneous operations on intersecting runways, which include simultaneous takeoffs and landings and/or simultaneous landings, are authorized when a landing aircraft is able to and instructed by the controller to hold short of the intersecting runway. Currently, SOIR are permitted only on dry runways when there is no tailwind. The runway length available on a hold-short runway is measured from the landing threshold to the intersecting runway edge along the landing runway edge closest to the intersecting runway or from the landing threshold to hold-short markings, lights, or signs when installed. Annual delay savings at the Baseline activity level would be 50 hours or $0.01 million; at Future 1, 730 hours or $1.59 million; and, at Future 2 activity levels, 2,020 hours or $4.48 million. 11. Evaluate effect of operations on wet runways. Operational experience has demonstrated that the stopping distances for turbojet aircraft are equivalent on well maintained and grooved runways in both wet and dry conditions. Demonstrations of simultaneous operations on intersecting wet runways conducted at Boston Logan, Greater Pittsburgh, and Chicago O Hare have shown the potential of standardizing these type operations. Procedural development is underway. (21)
24 Annual delay savings at the Baseline activity level would be 330 hours or $0.11 million; at Future 1, 6,580 hours or $14.40 million; and, at Future 2 activity levels, 18,180 hours or $40.35 million. 12. Enhance reliever and general aviation (GA) airport system. Reliever and GA airports can ease capacity constraints by attracting small/slow aircraft away from primary airports, especially where small/slow aircraft constitute a significant portion of operations. The segregation of aircraft operations by size and speed increases effective capacity because required time and distance separations are reduced between planes of similar size and speed. With 30 percent of LAS s small/slow aircraft operating out of reliever airports, there would be an annual delay savings at the Baseline activity level of 16,520 hours or $3.93 million; at Future 1, 53,140 hours or $79.24 million; and, at Future 2 activity levels, 133,570 hours or $ million. With 60 percent of LAS s small/slow aircraft operating out of reliever airports, there would be an annual delay savings at the Baseline activity level of 21,160 hours or $9.30 million; at Future 1, 70,270hours or $ million; and, at Future 2 activity levels, 258,160 hours or $ million. Every effort should be made to accommodate these aircraft at enhanced reliever airports with easy access to various locations within the metropolitan area. The reliever airports would need to provide services that are appropriate for the category of users at each airport. 13. Evaluate impact of terminal expansion (68 additional aircraft parking positions). The existing passenger terminal complex provides 60 aircraft parking positions and consists of three structures the Main Terminal, Satellite One, and the Charter International Terminal. The Main Terminal and Satellite One are joined by an automated transit system. Future passenger terminal complex improvements include: the addition of four aircraft parking positions between the Main Terminal building and Satellite One; expansion of the Main Terminal building to provide additional ticketing, parking, and baggage claim facilities; and the eventual addition of new Concourses D and E east of the existing terminal complex that would provide 64 aircraft parking positions. The construction of Concourses D and E will include both the taxiway system directly associated with them and the parallel Taxiway BB to Runway 7L/25R (see Alternative 2). The construction of Concourses D and E will require the construction of a new automated transit system. Annual delay savings at the Baseline activity level would be 960 hours or $1.13 million; at Future 1, 40,400 hours or $62.55 million; and, at Future 2 activity levels, 122,940 hours or $ million. (22)
25 (23)
26 SECTION 3 SUMMARY OF TECHNICAL STUDIES (24)
27 Overview The Las Vegas McCarran International Airport Capacity Team evaluated the efficiency of the existing airfield and the proposed future configurations. A brief description of the computer models and methodology used can be found in Appendix B. Certain standard inputs were used to reflect the operating environment at LAS. Details can be found in the data packages produced by the FAA Technical Center during the study. The potential benefits of various improvements were determined by examining airfield capacity, airfield demand, and average aircraft delays. Figure 8 shows current airfield weather conditions. Figure 9 provides the daily traffic demand distribution by aircraft class under VFR and IFR for the fleet operating at LAS for the three demand levels, and Figure 10 breaks down the annual traffic demand distribution for each demand level. Figure 11 delineates runway utilization under different conditions of airfield weather by providing percentage of use for various runway configurations. Figure 12 illustrates these runway configurations for the existing airfield, and Figure 13, for the future airfield with the extension and upgrade of Runway 1L/19R and the extensions of Runways 7L/25R and 7R/25L in place. The fleet mix at LAS has a weighted-average direct operating cost of $1,140 per hour, or $19 per minute at the baseline activity level; $1,560 per hour, or $26 per minute, at Future 1; and $1,680 per hour, or $28 per minute at Future 2. However, it is important to notice that the ratio of delay to cost is not consistent between the demand levels. This is due to variations in operational strategy and fleet mixes between Baseline, Future 1, and Future 2. These figures represent the costs for operating the aircraft and include such items as fuel, maintenance, and crew costs, but they do not consider lost passenger time, disruption to airline schedules, or any other intangible factors. Daily operations corresponding to an average day in the peak month were used for each of the forecast periods. The Airport and Airspace Simulation Model (SIMMOD) and the Runway Delay Simulation Model (RDSIM) were used to determine aircraft delays during peak periods. Delays were calculated for current and future conditions. Daily delays were annualized to measure the potential economic benefits of the proposed improvements. The annualized delays provided a basis for comparing the benefits of the proposed changes. The benefits associated with various runway use strategies were also identified. The cost of a particular improvement was measured against its annual delay savings. This comparison indicated which improvements would be the most effective. For expected increases in demand, a combination of improvements can be implemented to allow airfield capacity to increase while aircraft delays are minimized. Annual aircraft delays were calculated based on the results of SIMMOD and RDSIM computer simulations that utilized runway use, weather, and operating cost data generated during the Capacity Team study. At LAS, for the Baseline activity level with the current runway use strategies, the majority of delays were incurred by general aviation and air taxi aircraft. Because of their low operating costs, this resulted in high delay times but low delay costs at Baseline demand levels. Since forecasts predict significant changes in the aircraft fleet mix at future activity levels, operating costs were substantially higher at Future 1 and Future 2 than at Baseline. In addition, with the new runway use strategies developed for the proposed runway extensions, delays at Future 1 and Future 2 were distributed equally among all the aircraft in the fleet, and this further increased average aircraft operating costs at these activity levels. Figure 8. Airfield Weather Ceiling/Visibility Winter Summer VFR 5,000 feet and above/7 sm and above 93.0% 96.0% VFR 2 1,000 to 5,000 feet/3 to 7 sm 5.0% 3.5% IFR Below 1,000 feet/below 3 sm 2.0% 0.5% Total 100% 100% VFR Visual Flight Rules IFR Instrument Flight Rules sm statute miles (25)
28 Figure 9. Daily Traffic Demand Distribution by Aircraft Class Aircraft Class Class 4 Class 3 Class 2 Class 1 Aircraft Types Single-engine props 12,5000 lbs. or less Twin-engine props 12,500 lbs. or less Large aircraft 12,500 to 300,000 lbs. & small jets Heavy aircraft over 300,000 lbs. Baseline Future 1 Future 2 VFR IFR VFR IFR VFR IFR 25% 21% 9% 7% 6% 4% 20% 17% 10% 8% 9% 8% 50% 57% 74% 77% 76% 78% 5% 5% 7% 8% 9% 10% Note: Composite (weighted) distribution of winter and summer demands. Figure 10. Annual Traffic Demand Distribution Demand Air Carrier Air Taxi General Aviation Military Baseline 49% 25% 23% 3% Future 1 65% 23% 10% 2% Future 2 67% 23% 8% 2% Figure 11. Runway Configuration Percentage Use Configuration (see Figure 12) 1 S & W 1A S & W 2 W 3 S 4 S & E 5 E 6 N 7 NW 8 NE Total VFR Winter 76% 3% 0.5% 0.5% 4% 8% 1% 93% Summer 80% 3% 0.5% 0.5% 3% 8% 1% 96% VFR 2 Winter 5% 5% Summer 3.5% 3.5% IFR Winter 2% 2% Summer 0.5% 0.5% (26)
29 7L 7L 7L 7R 7R 7R 7L 7L 7L 7R 7R 7R 7L 7L 7L 7R 7R 7R 7L 7L 1L 1R 7R 7L 7L 1L 1R 1L 1R 7L 7L 7L 1L 1R 7R 7R 7R 7L 1L 1R 7R 7R 7L 1L 1R 1L 1R 7R 7R 7R 1L 1R 1L 1R Figure 12. Existing Runway Configurations 19R 19L (1) South/West A = 19R, 19L, 25L D = 7L, 19L, 25R 19R 19L (1a) South/West A = 19R, 19L, 25L D = 19L, 25R 19R 19L (2) West A = 25L D = 25R 1L 1L 1L 25R 1R 25L 1R 19R 19L (3) South A = 19R, 19L D = 19R, 19L 19R 19L (5) East A = 7R D = 7L 1L 1L 25R 1R 25L 25R 1R 25L 19R 19L (7) North/West A = 1R, 1L, 25L D = 1R, 1L 1L 25R 1R 25L 25L 25R 1R 19R 19L (4) South/East A = 7R, 19R D = 7L 1L 25R 1R 25L 19R 19L (6) North A = 1R, 1L D = 1R, 1L 19R 19L (8) North/East A = 1R, 1L D = 1R, 1L, 7R 1L 1L 25R 1R 25L 25R 1R 25L 25L 25R Figure 13. Future Runway Configurations 19L 19R (1) South/West #1 & #2 A = 19R, 19L, 25L D = 19R, 19L, 25R 19L 19R (1a) South/West A = 19R, 19L, 25L D = 19R, 19L, 25R 19L 19R (2) West A = 25L D = 25R 19L 19R (4) South/East A = 19R, 19L D = 7R, 7L 19L 19R (5) East A = 7R D = 7L 25L 25R 19L 19R (7) North/West A = 1R, 1L, 25L D = 1R, 1L 19L 19R (8) North/East A = 1R, 1L D = 1R, 1L, 7R 25L 25L 25R 25R 25L 25R 25L 25L 25L 25R 25R 25R 19L 19R (3) South #1 & #2 A = 19R, 19L D = 19R, 19L 25L 25R 19L 19R (6) North #1 & #2 A = 1R, 1L D = 1R, 1L 25L 25R (27)
30 Airfield Capacity The LAS Capacity Team defined airfield capacity to be the maximum number of aircraft operations (landings or takeoffs) that can take place in a given time. The following conditions were considered: Level of delay Airspace constraints Ceiling and visibility conditions Runway layout and use Aircraft mix Percent arrival demand Figure 14 illustrates the average-day, peak-month demand levels for LAS for each of the three annual activity levels used in the study, Baseline, Future 1, and Future 2, for both the winter and the summer schedules. Figure 15 illustrates capacity and delay curves for LAS. To show operations under visual meteorological conditions (VMC), curves were developed with a south and west flow (Configuration 1 under VFR and Configuration 1A under VFR 2) for the existing airport and for the future airport with the extensions of Runway 1L/19R and Runways 7L/25R and 7R/25L in place. To show operations under instrument meteorological conditions (IMC), curves were developed with a west flow (Configuration 2 under IFR) for the existing airport and for the future airport with the extensions in place. These curves are based on the assumption that arrival and departure demand are randomly distributed within the hour, with a 50/50 split of arrivals and departures. Other patterns of demand can alter the demand/delay relationship. The curves in Figure 15 illustrate the relationship between airfield capacity, stated in the number of operations per hour, and the average delay per aircraft as the number of aircraft operations per hour increases, the average delay per operation increases exponentially. Figure 16 illustrates the hourly profile of daily demand for the Baseline activity level for both the winter and the summer schedules. It also includes curves that depict the profile of daily operations for Future 2 activity levels. Comparing the information in Figures 15 and 16 shows that, for the existing airport configuration: Aircraft delays will begin to escalate rapidly under VFR as hourly demand exceeds 110 operations per hour. While hourly demand exceeds 110 operations per hour only during a single hour at Baseline demand levels, 110 operations per hour is exceeded during most of the day at the demand levels forecast for Future 2. Under IFR, the capacity of the airport is considerably lower. Although IFR operations occur only 2 percent of the time in winter and less than 1 percent of the time in summer, it is apparent that the impact of the associated delays can be significant. (28)
31 Figure 14. Airfield Demand Levels Annual Operations Operations Winter 24-Hour Day* Peak Hour Operations Summer 24-Hour Day* Peak Hour Baseline 425, ,000 1, ,000 1, Future 1 530, ,000 1, ,000 1, Future 2 628, ,000 1, ,000 1, * - Average Day, Peak Month 2,200 2,000 1,800 Baseline Future 1 Future 2 1,990 Daily Demand 1,600 1,400 1,200 1, ,130 1,410 1,670 1,350 1, Winter Summer Figure 15. Airport Capacity Curves Hourly Flow Rate Versus Average Delay Existing Airfield Future Airfield Config 1, VFR Config 1, VFR 50 Config 1a, VFR 2 50 Config 1a, VFR 2 Average Delay (min) Config 2, IFR Average Delay (min) Config 2, IFR Total Flow (a/c per hour) Total Flow (a/c per hour) (29)
32 Figure 16.Profile of Daily Demand Hourly Distribution Winter Operations per Hour Baseline Arrivals Baseline Departures Baseline Total Future 2 Total :00 01:00 02:00 03:00 04:00 05:00 06:00 07:00 08:00 09:00 10:00 11:00 12:00 13:00 14:00 15:00 16:00 17:00 18:00 19:00 20:00 21:00 22:00 23:00 Time of Day Operations per Hour Baseline Arrivals Baseline Departures Baseline Total Future 2 Total Summer :00 01:00 02:00 03:00 04:00 05:00 06:00 07:00 08:00 09:00 10:00 11:00 12:00 13:00 14:00 15:00 16:00 17:00 18:00 19:00 20:00 21:00 22:00 23:00 Time of Day (30)
33 Aircraft Delays Aircraft delay is defined as the time above the unimpeded travel time for an aircraft to move from its origin to its destination. Aircraft delay results from interference from other aircraft competing for the use of the same facilities. The major factors influencing aircraft delays are: Ceiling and visibility conditions Airfield and ATC system demand Airfield physical characteristics Air traffic control procedures Aircraft operational characteristics Average delay in minutes per operation was generated by the Airport and Airspace Simulation Model (SIMMOD). A description of this model is included in Appendix B. If no improvements are made in airport capacity, the average delay per operation of 12.9 minutes at the Baseline level of operations will increase to 30.4 minutes per operation by Future 1 and 71.4 minutes per operation by Future 2. Under this Do Nothing scenario (no improvements in capacity), the annual delay cost could increase as follows: Annual Delay Costs Demand Hours Millions of 1992 $ Baseline 110,390 $58.26 Future 1 351,460 $ Future 2 947,160 $1, Conclusions Figure 17 demonstrates the impact of delays at Las Vegas McCarran International Airport. The chart shows how delay will continue to grow at a substantial rate as demand increases if there are no improvements made in airfield capacity, i.e., the Do Nothing scenario. The graphs also show that the greatest savings in delay costs would be provided by: Extending/upgrading Runway 1L/19R to 9,800 feet. Evaluating impact of terminal expansion (68 additional aircraft parking positions). Taxiway improvements to support main terminal area and Runway 1L/19R extension. Extending Runway 7L/25R to 14,400 feet. Figure 18 illustrates the average delay in minutes per aircraft operation for these alternatives. Under the Do Nothing alternative, if there are no improvements made in airfield capacity, the average delay per operation of 15.6 minutes at the Baseline level of activity will increase to 39.8 minutes per operation by Future 1 and 90.5 minutes per operation by Future 2. Major Recommendations Annual Delay Savings Future 1 Future 2 Alternatives Hours 1992 $ M Hours 1992 $ M Extend/upgrade Runway 1L/19R to 9,800 feet 157,160 $ ,160 $ Evaluate impact of terminal expansion 40,400 $ ,940 $ (68 additional aircraft parking positions) Taxiway improvements to support main 44,690 $ ,050 $81.46 terminal area and Runway 1L/19R extension Extend Runway 7L/25R to 14,400 feet 1,370 $ ,130 $63.42 (31)
34 Figure 17. Annual Delay Costs Capacity Enhancement Alternatives 1,000 1, Do Nothing 900 Annual Delay (000 hours) Extend Rwy 7L/25R to 14,400 ft. Twy improvements to support main terminal area and Rwy 1L/19R extension Impact of terminal expansion Extend/Upgrade Rwy 1L/19R to 9,800 ft Annual Delay (000 hours) Annual Demand (thousands of operations) Figure 18. Average Delays Capacity Enhancement Alternatives Do Nothing 90 Average Delay (minutes) Extend Rwy 7L/25R to 14,400 ft. Twy improvements to support main terminal area and Rwy 1L/19R extension Impact of terminal expansion Extend/Upgrade Rwy 1L/19R to 9,800 ft Average Delay (minutes) Annual Demand (thousands of operations) (32)
35 (33)
36 APPENDIX A PARTICIPANTS (34)
37 Federal Aviation Administration Western-Pacific Region Peter T. Melia Joseph Rodriguez Headquarters Jim McMahon Everett Brown Technical Center John Vander Veer Babulal C. Shah Robert Holladay Airway Facilities Sector Richard Browder Las Vegas Airport Traffic Control Tower Eugene Stahl Mike Alcott Clark County Department of Aviation McCarran International Airport Robert N. Broadbent Russell Williams Tyson Ballard Jacob L. Snow Edwin L. Hoying Thomas S. Donaldson Kristina M. Storrs State of Nevada Department of Transportation Dennis Taylor Aviation Industry Groups America West Airlines Ken Carr United Airlines Phillip D. Hogg Air Transport Association Neil Bennett (35)
38 APPENDIX B COMPUTER MODELS AND METHODOLOGY (36)
39 Computer Models The Las Vegas Capacity Team studied the effects of various improvements proposed to reduce delay and enhance capacity. The options were evaluated considering the anticipated increase in demand. The analysis was performed using computer modeling techniques. A brief description of the model and the methodology employed follows. Runway Delay Simulation Model (RDSIM) RDSIM is a short version of the Airfield Delay Simulation Model (ADSIM). ADSIM is a fast-time, discrete event model that employs stochastic processes and Monte Carlo sampling techniques. It describes significant movements of aircraft on the airport and the effects of delay in the adjacent airspace. The model was validated in 1978 at Chicago O Hare International Airport against actual flow rates and delay data. RDSIM, on the other hand, simulates only the runways and runway exits. There are two versions of the model. The first version ignores the taxiway and gate complexes for a user-specified daily traffic demand and is used to calculate daily demand statistics. In this mode, the model replicates each experiment forty times, using Monte Carlo sampling techniques to introduce system variability, which occurs on a daily basis in actual airport operations. The results are averaged to produce output statistics. The second version also simulates the runway and runway exits only, but it creates its own demand using randomly assigned arrival and departure times. The demand created is based upon user-specified parameters. This form of the model is suitable for capacity analysis. For this study, RDSIM was calibrated against field data collected at LAS to ensure that the model was site specific. For a given demand, the model calculated the hourly flow rate and average delay per aircraft during the full period of airport operations. Using the same aircraft mix, simulation analysts simulated different demand levels for each run to generate demand versus delay relationships. Airport and Airspace Simulation Model (SIMMOD) SIMMOD is a fast-time, event-step model that simulates the real-world process by which aircraft fly through air traffic controlled en route and terminal airspace and arrive and depart at airports. SIMMOD traces the movement of individual aircraft as they travel through the gate, taxiway, runway, and airspace system and detects potential violations of separations and operation procedures. It simulates the air traffic control actions required to resolve potential conflicts to insure that aircraft operate within procedural rules. Aircraft travel time, delay, and traffic statistics are computed and provided as model outputs. The model was calibrated for this study against field data collected at LAS to ensure it was site specific. Inputs for the simulation model were also derived from empirical field data. The model repeated each experiment 10 times using Monte Carlo sampling techniques to introduce system variability. The results were then average to produce output statistics. Methodology Model simulations included present and future air traffic control procedures, various airfield improvements, and traffic demands for different times. To assess the benefits of proposed airfield improvements, different airfield configurations were derived from present and projected airport layouts. The projected implementation time for air traffic control procedures and system improvements determined the aircraft separations used for IFR and VFR weather simulations. For the delay analysis, agency specialists developed traffic demands based on the Official Airline Guide, historical data, and various forecasts. Aircraft volume, mix and peaking characteristics were developed for three demand periods, Baseline, Future 1, and Future 2. The estimated annual delays for the proposed improvement options were calculated from the experimental results. These estimates took into account the yearly variations in runway configurations, weather, and demand based on historical data. The potential delay reductions for each improvement were assessed by comparing the annual delay estimates with the Do Nothing case. (37)
40 APPENDIX C ABBREVIATIONS (38)
41 ADSIM ARTCC ASC ASDE ATC ATCT CAT FAA GA IFR ILS IMC LAS LBS MLS NM RDSIM SIMMOD SM SOIR TERPS VFR VHF VMC VOR Airfield Delay Simulation Model Air Route Traffic Control Center Office of System Capacity and Requirements, FAA Airport Surface Detection Equipment Air Traffic Control Airport Traffic Control Tower Category of instrument landing system Federal Aviation Administration General Aviation Instrument Flight Rules Instrument Landing System Instrument Meteorological Conditions McCarran International Airport, Las Vegas, Nevada Pounds Microwave Landing System Nautical Miles Runway Delay Simulation Model Airport and Airspace Simulation Model Statute Miles Simultaneous Operations on Intersecting Runways Terminal Instrument Procedures Visual Flight Rules Very High Frequency Visual Meteorological Conditions VHF Omnidirectional Range course information only (39)
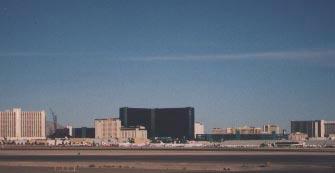
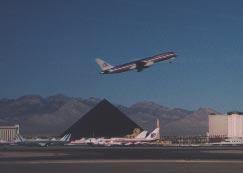
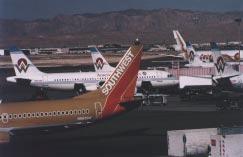
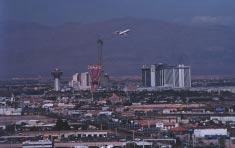
42 Credits: Editorial, design, and production support provided by JIL Systems, Inc. Photos supplied by: Las Vegas International Airport. Everett Brown, ASC-100. Printed on Recycled Paper (40)
43

44
Appendix B Ultimate Airport Capacity and Delay Simulation Modeling Analysis
 Appendix B ULTIMATE AIRPORT CAPACITY & DELAY SIMULATION MODELING ANALYSIS B TABLE OF CONTENTS EXHIBITS TABLES B.1 Introduction... 1 B.2 Simulation Modeling Assumption and Methodology... 4 B.2.1 Runway
Raleigh-Durham International Airport Airport Capacity Enhancement Plan. August 1991
 ii Raleigh-Durham International Airport Airport Capacity Enhancement Plan August 1991 Prepared jointly by the U.S. Department of Transportation, Federal Aviation Administration, Raleigh-Durham Airport
According to FAA Advisory Circular 150/5060-5, Airport Capacity and Delay, the elements that affect airfield capacity include:
 4.1 INTRODUCTION The previous chapters have described the existing facilities and provided planning guidelines as well as a forecast of demand for aviation activity at North Perry Airport. The demand/capacity
Indianapolis International Airport Capacity Enhancement Plan
 Indianapolis International Airport Capacity Enhancement Plan 2 Indianapolis International Airport Capacity Enhancement Plan Indianapolis International Airport Capacity Enhancement Plan May 1993 Prepared
The purpose of this Demand/Capacity. The airfield configuration for SPG. Methods for determining airport AIRPORT DEMAND CAPACITY. Runway Configuration
 Chapter 4 Page 65 AIRPORT DEMAND CAPACITY The purpose of this Demand/Capacity Analysis is to examine the capability of the Albert Whitted Airport (SPG) to meet the needs of its users. In doing so, this
Washington Dulles International Airport (IAD) Aircraft Noise Contour Map Update
 Aircraft Noise Contour Map Update") Washington Dulles International Airport (IAD) Aircraft Noise Contour Map Update Ultimate ASV, Runway Use and Flight Tracks 4th Working Group Briefing 8/13/18 Meeting Purpose Discuss Public Workshop input
Washington Dulles International Airport (IAD) Aircraft Noise Contour Map Update Ultimate ASV, Runway Use and Flight Tracks 4th Working Group Briefing 8/13/18 Meeting Purpose Discuss Public Workshop input
Runway Length Analysis Prescott Municipal Airport
 APPENDIX 2 Runway Length Analysis Prescott Municipal Airport May 11, 2009 Version 2 (draft) Table of Contents Introduction... 1-1 Section 1 Purpose & Need... 1-2 Section 2 Design Standards...1-3 Section
Tallahassee International Airport Master Plan. Technical Advisory Committee Meeting #2 October 19, 2016
 Tallahassee International Airport Master Plan Technical Advisory Committee Meeting #2 October 19, 2016 Agenda Welcome / Introductions Master Plan Process and Project Status Forecast of Aviation Demand
1.0 Project Background Mission Statement and Goals Objectives of this Sustainable Master Plan
 TABLE OF CONTENTS CHAPTER 1 INTRODUCTION 10 Project Background 1-1 11 Mission Statement and Goals 1-1 12 Objectives of this Sustainable Master Plan 1-2 CHAPTER 2 INVENTORY 20 Airport Background 2-1 201
FORT LAUDERDALE-HOLLYWOOD INTERNATIONAL AIRPORT ENVIRONMENTAL IMPACT STATEMENT DRAFT
 D.3 RUNWAY LENGTH ANALYSIS Appendix D Purpose and Need THIS PAGE INTENTIONALLY LEFT BLANK Appendix D Purpose and Need APPENDIX D.3 AIRFIELD GEOMETRIC REQUIREMENTS This information provided in this appendix
CHAPTER 4 DEMAND/CAPACITY ANALYSIS
 CHAPTER DEMAND/CAPACITY ANALYSIS INTRODUCTION The demand/capacity analysis examines the capability of the airfield system at Blue Grass Airport (LEX) to address existing levels of activity as well as determine
APPENDIX D MSP Airfield Simulation Analysis
 APPENDIX D MSP Airfield Simulation Analysis This page is left intentionally blank. MSP Airfield Simulation Analysis Technical Report Prepared by: HNTB November 2011 2020 Improvements Environmental Assessment/
Draft Concept Alternatives Analysis for the Inaugural Airport Program September 2005
 Draft Concept Alternatives Analysis for the Inaugural Airport Program September 2005 Section 3 - Refinement of the Ultimate Airfield Concept Using the Base Concept identified in Section 2, IDOT re-examined
STAFF REPORT. Airport Land Use Plan Consistency Review: Santa Barbara Airport Master Plan. MEETING DATE: November 19, 2015 AGENDA ITEM: 7D
 STAFF REPORT SUBJECT: Airport Land Use Plan Consistency Review: Santa Barbara Airport Master Plan MEETING DATE: AGENDA ITEM: 7D STAFF CONTACT: Peter Imhof, Andrew Orfila RECOMMENDATION: Adopt findings
Table of Contents. Overview Objectives Key Issues Process...1-3
 Table of Contents Chapter One Introduction Overview...1-1 Objectives...1-1 Key Issues...1-2 Process...1-3 Chapter Two Inventory of Existing Conditions Airport Setting...2-1 Locale...2-1 Airport Surroundings...2-5
Draft Concept Alternatives Analysis for the Inaugural Airport Program September 2005
 Draft Concept Alternatives Analysis for the Inaugural Airport Program September 2005 Section 1 - Introduction This report describes the development and analysis of concept alternatives that would accommodate
Airport Master Plan. Brookings Regional Airport. Runway Runway 17-35
 Runway 17-35 Airport Master Plan Runway 12-30 Brookings Regional Airport Table of Contents Table of Contents Chapter 1: Master Plan Goals... 1-1 1.1. Introduction... 1 1.2. Objective 1 Identify improvements
Executive Summary. MASTER PLAN UPDATE Fort Collins-Loveland Municipal Airport
 Executive Summary MASTER PLAN UPDATE Fort Collins-Loveland Municipal Airport As a general aviation and commercial service airport, Fort Collins- Loveland Municipal Airport serves as an important niche
Westover Metropolitan Airport Master Plan Update
 Westover Metropolitan Airport Master Plan Update June 2008 INTRODUCTION Westover Metropolitan Airport (CEF) comprises the civilian portion of a joint-use facility located in Chicopee, Massachusetts. The
Chapter 3. Demand/Capacity & Facility Requirements
 Chapter 3. Demand/Capacity & Facility Requirements Chapter 3. DEMAND/CAPACITY & FACILITY REQUIREMENTS This chapter provides an assessment of future airport development requirements based upon the forecasts
Hartford-Brainard Airport Potential Runway Closure White Paper
 Hartford-Brainard Airport Potential Runway 11-29 Closure White Paper June 2012 In recent years there has been discussion regarding the necessity of Runway 11-29 to the Hartford- Brainard Airport (HFD)
1.1.3 Taxiways. Figure 1-15: Taxiway Data. DRAFT Inventory TYPICAL PAVEMENT CROSS-SECTION LIGHTING TYPE LENGTH (FEET) WIDTH (FEET) LIGHTING CONDITION
 WIDTH (FEET) LIGHTING CONDITION") 1.1.3 Taxiways EWN has an extensive network of taxiways and taxilanes connecting the terminal, air cargo, and general aviation areas with the runways as listed in Figure 1-15. A 50-foot wide parallel taxiway
1.1.3 Taxiways EWN has an extensive network of taxiways and taxilanes connecting the terminal, air cargo, and general aviation areas with the runways as listed in Figure 1-15. A 50-foot wide parallel taxiway
TABLE OF CONTENTS. General Study Objectives Public Involvement Issues to Be Resolved
 TABLE OF CONTENTS Description Page Number LIST OF ACRONYMS... a CHAPTER ONE INTRODUCTION General... 1-1 Study Objectives... 1-1 Public Involvement... 1-2 Issues to Be Resolved... 1-2 CHAPTER TWO EXISTING
Chapter III - Demand/Capacity and Facility Requirements
 Chapter III - Demand/Capacity and Facility Requirements The facility requirements identified in this chapter are summarized on Exhibit III.1. The future requirements serve to determine which airport facilities
Prepared By: Mead & Hunt, Inc Port Lansing Road Lansing, MI 48906
 Master Plan The preparation of this document was financed in part through a planning grant from the Federal Aviation Administration (FAA) as provided under Section 505 of the Airport and Airway Improvement
FORECASTING FUTURE ACTIVITY
 EXECUTIVE SUMMARY The Eagle County Regional Airport (EGE) is known as a gateway into the heart of the Colorado Rocky Mountains, providing access to some of the nation s top ski resort towns (Vail, Beaver
Master Plan Update Technical Advisory Committee Meeting
 Nashville International Airport Master Plan Update Technical Advisory Committee Meeting February 14, 2019 Agenda Welcome and Introductions Aviation Activity Forecast Facility Requirements Alternatives
SIMMOD Simulation Airfield and Airspace Simulation Report. Oakland International Airport Master Plan Preparation Report. Revised: January 6, 2006
 Table of Contents SIMMOD Simulation Airfield and Airspace Simulation Report Oakland International Airport Master Plan Preparation Report Revised: January 6, 2006 Produced For: 1. Simmod PRO! Description...
CATCODE ] CATCODE
![CATCODE ] CATCODE](/thumbs/82/85644630.jpg "CATCODE ] CATCODE") Runways. FAC: 1111 CATCODE: 111111 OPR: AFCEC/COS OCR: AF/A3O-A 1.1. Description. The runway is the paved surface provided for normal aircraft landings and take offs. Runways are classified as either Class
Runways. FAC: 1111 CATCODE: 111111 OPR: AFCEC/COS OCR: AF/A3O-A 1.1. Description. The runway is the paved surface provided for normal aircraft landings and take offs. Runways are classified as either Class
1) Rescind the MOD (must meet the standard); 2) Issue a new MOD which reaffirms the intent of the previous MOD; 3) Issue a new MOD with revisions.
 Rescind the MOD (must meet the standard); 2) Issue a new MOD which reaffirms the intent of the previous MOD; 3) Issue a new MOD with revisions.") ALBUQUERQUE INTERNATIONAL SUNPORT AIRCRAFT HOLD LINE LOCATION ANALYSIS WHITE PAPER JUNE 24, 2016 HOLD LINE LOCATION ISSUE The location of many of the taxiway hold lines at the Sunport do not meet current
ALBUQUERQUE INTERNATIONAL SUNPORT AIRCRAFT HOLD LINE LOCATION ANALYSIS WHITE PAPER JUNE 24, 2016 HOLD LINE LOCATION ISSUE The location of many of the taxiway hold lines at the Sunport do not meet current
SECTION 4 DEMAND/CAPACITY ANALYSIS AND FACILITY REQUIREMENTS
 SECTION 4 DEMAND/CAPACITY ANALYSIS AND FACILITY REQUIREMENTS This Section compares the projected demand and the existing capacity for the major elements of the Airport and establishes the facility requirements
Appendix D Project Newsletters. Tacoma Narrows Airport. Master Plan Update
 Appendix D Project Newsletters Tacoma Narrows Airport Master Plan Update This appendix contains the newsletters distributed throughout the project. These newsletters provided updates and information on
Appendix C AIRPORT LAYOUT PLANS
 Appendix C AIRPORT LAYOUT PLANS Appendix C AIRPORT LAYOUT PLANS Airport Master Plan Santa Barbara Airport As part of this Airport Master Plan, the Federal Aviation Administration (FAA) requires the development
Chapter 5 Facility Requirements
 Chapter 5 Facility Requirements 5.0 INTRODUCTION The Facility Requirements chapter of this Sustainable Master Plan Update describes airside and landside facilities, which are needed to accommodate existing
C > Capacity Analysis and Facility Requirements
 Buchanan Field Buchanan Field Airport Master Planning Program C. CAPACITY ANALYSIS & FACILITY REQUIREMENTS C > Capacity Analysis and Facility Requirements INTRODUCTION. The capacity of an airfield is primarily
Milton. PeterPrinceAirportislocatedinSantaRosaCounty, approximatelythreemileseastofmilton.
 Milton GeneralAviationAirport PeterPrinceAirportislocatedinSantaRosaCounty, approximatelythreemileseastofmilton. Existing Facilities Peter Prince Airport is served by one runway, Runway 18/36, 3,700 feet
1. Background and Proposed Action
 1. Background and Proposed Action This chapter describes Hillsboro Airport and the planning background for the proposed project. The Port of Portland (the Port) is the sponsor for the Hillsboro Airport
4. Demand/Capacity Assessment and Facility Requirements
 4. This chapter presents an evaluation of the existing airfield facilities, buildings, and other facilities at the Airport and an assessment of their potential use under the demand scenarios defined for
LONG BEACH, CALIFORNIA
 LONG BEACH, CALIFORNIA 1 LONG BEACH, CALIFORNIA Airside Capacity Evaluation Techniques Matt Davis Assistant Director of Planning Hartsfield-Jackson Atlanta International Airport Matt.Davis@Atlanta-Airport.com
B GEORGIA INFRASTRUCTURE REPORT CARD AVIATION RECOMMENDATIONS DEFINITION OF THE ISSUE. Plan and Fund for the Future:
 2014 GEORGIA INFRASTRUCTURE REPORT CARD B + RECOMMENDATIONS Plan and Fund for the Future: While the system continues to enjoy excess capacity and increased accessibility it still needs continued focus
Chapter 5 Facility Requirements
 Chapter 5 Facility Requirements 50 INTRODUCTION This chapter describes the airside and landside facility requirements necessary to accommodate existing and forecasted demand in accordance with Federal
Capacity Analysis and Facility Requirements
 Capacity Analysis and Facility Requirements Introduction The capacity analysis for Paine Field is composed of two distinct elements: the ability of airport facilities to accommodate existing and projected
APPENDIX H 2022 BASELINE NOISE EXPOSURE CONTOUR
 APPENDIX H 2022 BASELINE NOISE EXPOSURE CONTOUR This appendix sets forth the detailed input data that was used to prepare noise exposure contours for 2022 Baseline conditions. H.1 DATA SOURCES AND ASSUMPTIONS
CHAPTER 3 ALTERNATIVES CONSIDERED
 CHAPTER 3 ALTERNATIVES CONSIDERED 3.0 ALTERNATIVES The 2010 Stevensville Airport Master Plan contained five (5) airside development options designed to meet projected demands. Each of the options from
Draft Concept Alternatives Analysis for the Inaugural Airport Program September 2005
 Section 10 Preferred Inaugural Airport Concept 10.0 Introduction The Preferred Inaugural Airport Concept for SSA was developed by adding the preferred support/ancillary facilities selected in Section 9
DEVELOPMENT OF TOE MIDFIELD TERMINAL IROJECT CAPACITY ENHANCEMENT REPORT DEPARTMENT OF AVIATION TOM FOERSTER CHAIRMAN BARBARA HAFER COMMISSIONER
 PETE FLAHERTY COMMISSIONER TOM FOERSTER CHAIRMAN DEPARTMENT OF AVIATION BARBARA HAFER COMMISSIONER STEPHEN A. GEORGE DIRECTOR ROOM M 134, TERMINAL BUILDING GREATER PITTSBURGH INTERNATIONAL AIRPORT PITTSBURGH,
Airport Master Plan Update June 15, 2017
 Airport Master Plan Update June 15, 2017 www.harveyfield.com The Master Plan is a 20-year plan to understand the needs of current and future users of the Airport. This is important to ensure that safe
JUNEAU RUNWAY INCURSION MITIGATION (RIM) PROGRAM JANUARY 25, 2017
 PROGRAM JANUARY 25, 2017") JUNEAU RUNWAY INCURSION MITIGATION (RIM) PROGRAM JANUARY 25, 2017 1 Agenda Program Description Runway Incursions Design and Geometry Deficiencies Runway 8/26 Operations Potential Mitigation Next Steps
JUNEAU RUNWAY INCURSION MITIGATION (RIM) PROGRAM JANUARY 25, 2017 1 Agenda Program Description Runway Incursions Design and Geometry Deficiencies Runway 8/26 Operations Potential Mitigation Next Steps
 Existing Conditions AIRPORT PROFILE Passenger Terminal Complex 57 air carrier gates 11,500 structured parking stalls Airfield Operations Area 9,000 North Runway 9L-27R 6,905 Crosswind Runway 13-31 5,276
Airport Master Plan Update June 15, 2017
 Airport Master Plan Update June 15, 2017 www.harveyfield.com The Master Plan is a 20-year plan to understand the needs of current and future users of the Airport. This is important to ensure that safe
Key Purpose & Need Issues
 Key Purpose & Need Issues Efficiently meet demand through the 2025 planning horizon 864,000+ annual operations 180-200 operations during peak daytime hours Balance peak hour arrival/departure capability
Merritt Island Airport
 TABLE OF CONTENTS CHAPTER 1 INTRODUCTION... 1-1 INTRODUCTION AND PROJECT OVERVIEW... 1-1 General Guidelines... 1-1 Prior Planning Documentation... 1-2 Key Issues... 1-2 Goals and Objectives... 1-2 Regulatory
Table of Contents. List of Tables. Cincinnati/Northern Kentucky International Airport 2035 Master Plan Update
 Table of Contents 7.1. Airport Layout Plan (Existing Conditions)... 2 7.2. Airport Layout Plan (Future Conditions)... 3 7.3. Technical Data Sheet... 5 7.4. Commercial Terminal Area Drawing... 5 7.5. East
APPENDIX X: RUNWAY LENGTH ANALYSIS
 APPENDIX X: RUNWAY LENGTH ANALYSIS Purpose For this Airport Master Plan study, the FAA has requested a runway length analysis to be completed to current FAA AC 150/5325-4B, Runway Length Requirements for
The offers operators increased capacity while taking advantage of existing airport infrastructure. aero quarterly qtr_03 10
 The 747 8 offers operators increased capacity while taking advantage of existing airport infrastructure. 14 aero quarterly qtr_03 10 Operating the 747 8 at Existing Airports Today s major airports are
CHAPTER 1: INTRODUCTION
 CHAPTER 1: INTRODUCTION Purpose and Scope The information presented in this report represents the study findings for the 2016 Ronan Airport Master Plan prepared for the City of Ronan and Lake County, the
Chapter 1 EXECUTIVE SUMMARY
 Chapter 1 EXECUTIVE SUMMARY Contents Page Aviation Growth Scenarios................................................ 3 Airport Capacity Alternatives.............................................. 4 Air Traffic
LFMN / Nice Côte-d Azur / NCE
 This page is intended to draw commercial and private pilots attention to the aeronautical context and main threats related to an aerodrome. They have been identified in a collaborative way by the main
3.1 Facility Requirements Overview Airfield Facility Requirements... 1
 Table of Contents 3.1 Overview... 1 3.2 Airfield... 1 Airspace Capacity...1 Airside Capacity... 2 Aircraft Mix Index... 3 Arrivals Percentage... 4 Touch-and-Go Percentage... 4 Taxiway Access Factors...
Working Paper #5 Facility Requirements
 Working Paper #5 March 2018 Table of Contents Contents 5....5-1 5.1. Airfield and Airspace Requirements...5-4 5.1.1. Airfield Capacity...5-4 5.1.2. Approach Capability...5-7 5.1.3. Airspace Protection...5-9
The presentation was approximately 25 minutes The presentation is part of Working Group Meeting 3
 This is the presentation for the third Master Plan Update Working Group Meeting being conducted for the Ted Stevens Anchorage International Airport Master Plan Update. It was given on Thursday March 7
Study Committee Meeting. September 2015
 W ki P T / Working Paper Two/ Study Committee Meeting September 2015 Agenda Introductions and Opening Comments Project Overview, Process, and Schedule Review Materials from Working Paper Two Comments,
ACTION TRANSMITTAL
 Transportation Advisory Board of the Metropolitan Council of the Twin Cities ACTION TRANSMITTAL 2018-16 DATE: February 9, 2018 TO: Transportation Advisory Board FROM: Technical Advisory Committee PREPARED
CHAPTER 1 EXECUTIVE SUMMARY
 CHAPTER 1 EXECUTIVE SUMMARY 1 1 EXECUTIVE SUMMARY INTRODUCTION William R. Fairchild International Airport (CLM) is located approximately three miles west of the city of Port Angeles, Washington. The airport
Forecast of Aviation Activity
 DETROIT METROPOLITAN WAYNE COUNTY AIRPORT FAR PART 150 NOISE COMPATIBILITY STUDY UPDATE CHAPTER B FORECAST OF AVIATION ACTIVITY Forecast of Aviation Activity Introduction This chapter summarizes past aviation
Facility Requirements
 4. This chapter presents the airside and landside facility requirements necessary to accommodate existing and forecasted demand at Erie International Airport (ERI or the Airport) in accordance with Federal
BNA Master Plan Update Community Advisory Committee Meeting No. 5
 A Six Sigma Organization BNA Master Plan Update Community Advisory Committee Meeting No. 5 September 19, 2012 Introductions MNAA Staff RW Armstrong Team Albersman & Armstrong, Ltd. Atkins North America,
Chapter 4.0 Alternatives Analysis
 Chapter 4.0 Alternatives Analysis Chapter 1 accumulated the baseline of existing airport data, Chapter 2 presented the outlook for the future in terms of operational activity, Chapter 3 defined the facilities
DEMAND/CAPACITY ANALYSIS St. Petersburg-Clearwater International Airport
 DEMAND/CAPACITY ANALYSIS St. Petersburg-Clearwater International Airport 5.1 GENERAL OVERVIEW The next step in the Master Plan process is analyzing the capacity of existing airport facilities against forecasted
TECHNICAL REPORT #3 Palm Beach International Airport Demand/Capacity and Facility Requirements
 TECHNICAL REPORT #3 Palm Beach International Airport Demand/Capacity and Facility Requirements Technical Report #3 Palm Beach International Airport Demand/Capacity and Facility Requirements Palm Beach
CHAPTER 1 INTRODUCTION AND BACKGROUND
 CHAPTER 1 INTRODUCTION AND BACKGROUND An Environmental Assessment (EA) evaluates the effects of a proposed Federal action on the surrounding environment and is prepared in compliance with the National
Chapter 4 AIRPORT DEVELOPMENT ALTERNATIVES
 Chapter 4 AIRPORT DEVELOPMENT ALTERNATIVES Chapter Four Airport Development Alternatives Prior to formulating a development program for Ryan Airfield, it is important to consider development potential
AIRPORT MASTER PLAN UPDATE
 AIRPORT MASTER PLAN UPDATE PENSACOLA INTERNATIONAL AIRPORT Technical Advisory Committee Meeting #2 June 20, 2017 Agenda» Introduction» Facility Requirements Airside Terminal Landside General Aviation Cargo
Airport Master Plan for Montgomery-Gibbs Executive Airport PAC Meeting #3
 Airport Master Plan for Montgomery-Gibbs Executive Airport PAC Meeting #3 Agenda > Introductions > Public Meetings Overview > Working Paper 3 - Facility Requirements > Working Paper 4 - Environmental Baseline
RSAT RUNUP ANALYSIS 1. INTRODUCTION 2. METHODOLOGY
 RSAT RUNUP ANALYSIS 1. INTRODUCTION The FAA Runway Safety Action Team (RSAT) is a team of FAA staff that works with airports to address existing and potential runway safety problems and issues. The RSAT
CHAPTER FOUR AIRPORT ALTERNATIVES
 4.0 INTRODUCTION CHAPTER FOUR The goal of the master planning process is to provide the City of New Smyrna Beach with an assessment of the adequacy and capabilities of the Airport as well as to identify
FACILITY REQUIREMENTS SUMMARY OF KEY ISSUES OVERVIEW
 FACILITY REQUIREMENTS SUMMARY OF KEY ISSUES OVERVIEW This summary is intended to provide a brief overview of the key issues associated with conformance to FAA standards at Methow Valley State Airport.
Savannah / Hilton Head International Airport Master Plan Update
 EXECUTIVE SUMMARY Savannah / Hilton Head International Airport Master Plan Update Prepared for: The Savannah Airport Commission Prepared by: URS Corporation In Association With: RS&H and Ruth and Associates,
BNA Master Plan Update Public Meeting No. 2
 A Six Sigma Organization BNA Master Plan Update Public Meeting No. 2 September 18, 2012 Agenda BNA Master Plan Update Consultants Status of the BNA Master Plan Update Workstation Boards Forecasts of Aviation
Regular Board Meeting August 4, 2015
 Regular Board Meeting August 4, 2015 1616 Airport Circle Hailey, ID 83333 208.788.4956 PUBLIC COMMENT FY 16 Rates & Charges FY 16 Budget Approval Rates & Charges will provide the Board the ability to operate
Agenda: SASP SAC Meeting 3
 Agenda: SASP SAC Meeting 3 Date: 04/12/18 Public Involvement Plan Update Defining the System Recommended Classifications Discussion Break Review current system Outreach what we heard Proposed changes Classification
USE OF RADAR IN THE APPROACH CONTROL SERVICE
 USE OF RADAR IN THE APPROACH CONTROL SERVICE 1. Introduction The indications presented on the ATS surveillance system named radar may be used to perform the aerodrome, approach and en-route control service:
1 DRAFT. General Aviation Terminal Services Aircraft Hangars Aircraft Parking Aprons Airport Support Facilities
 To properly plan for improvements at Dallas Executive Airport, it is necessary to translate forecast aviation demand into the specific types and quantities of facilities that can adequately serve the demand.
Airport Master Plan for. Brown Field Municipal Airport PAC Meeting #3
 Airport Master Plan for Brown Field Municipal Airport PAC Meeting #3 Public Meeting #1 > 8/24/17 from 5:30 to 8:00 pm > 41 attendees signed-in > Comments: > EAA area > Environmental constraints > Focus
MASTER PLAN UPDATE WORKING PAPER NO. 3. Demand/Capacity Analysis and Facility Requirements. March 18, 2013
 MASTER PLAN UPDATE WORKING PAPER NO. 3 Demand/Capacity Analysis and Facility Requirements March 18, 2013 Contents 4 Demand/Capacity Analysis and Facility Requirements... 4 1 4.1 Summary of Aviation Demand
Source: Chippewa Valley Regional Airport ASOS, Period of Record
 Chapter 1 Inventory Runway wind coverage is the percentage of time a runway can be used without exceeding allowable crosswind velocities. Allowable crosswind velocities vary depending on aircraft size
TABLE OF CONTENTS 1.0 INTRODUCTION...
 Advisory Circular Subject: Publication of the Level of Service with Respect to Departure Below RVR 2600 (½ Statute Mile) Issuing Office: Civil Aviation, Standards Document No.: AC 302-001 File Classification
Addendum - Airport Development Alternatives (Chapter 6)
") Bowers Field Addendum - Airport Development Alternatives (Chapter 6) This addendum to the Airport Development Alternatives chapter includes the preferred airside development alternative and the preliminary
Bowers Field Addendum - Airport Development Alternatives (Chapter 6) This addendum to the Airport Development Alternatives chapter includes the preferred airside development alternative and the preliminary
PUBLIC NOTICE. Table 1 Projects Proposed by Amendment
 PUBLIC NOTICE The Dallas Department of Aviation (the Department) intends to file an amendment application to increase the PFC amount of one previously approved project at Dallas Love Field Airport (the
Airport Obstruction Standards
 Airport Obstruction Standards Dr. Antonio Trani Department of Civil and Environmental Engineering Virginia Tech Outline of this Presentation Obstructions to navigation around airports Discussion of Federal
DRAFT. Airport Master Plan Update Sensitivity Analysis
 Dallas Love Field Sensitivity Analysis PREPARED FOR: The City of Dallas Department of Aviation PREPARED BY: RICONDO & ASSOCIATES, INC. August 201 Ricondo & Associates, Inc. (R&A) prepared this document
Appendix 6.1: Hazard Worksheet
 Appendix 6.1: Appendix 6.1: Ref. Condition, real or potential; that can cause injury, illness, etc. This is a prerequisite for an Airfield Hazards 1. Taxiway Geometry Direct access to runway from ramp
JUNEAU RUNWAY INCURSION MITIGATION (RIM) PROGRAM. April 10 th 2017
 PROGRAM. April 10 th 2017") JUNEAU RUNWAY INCURSION MITIGATION (RIM) PROGRAM April 10 th 2017 1 Agenda Recap Potential Mitigation Response to Stakeholder Questions Next Steps 2 Recap 3 Background Master Plan considered the runway
JUNEAU RUNWAY INCURSION MITIGATION (RIM) PROGRAM April 10 th 2017 1 Agenda Recap Potential Mitigation Response to Stakeholder Questions Next Steps 2 Recap 3 Background Master Plan considered the runway
CHAPTER 1 BACKGROUND AND PROPOSED ACTION
 CHAPTER 1 BACKGROUND AND PROPOSED ACTION 1.0 INTRODUCTION An Environmental Assessment (EA) evaluates the effects of a proposed Federal action on the surrounding environment and is prepared in compliance
DRAFT FINAL REPORT AIRPORT MASTER PLAN. Rifle Garfield County Airport Revised May 15, 2014
 DRAFT FINAL REPORT AIRPORT MASTER PLAN Rifle Garfield County Airport Revised May 15, 2014 As required by Paragraph 425.B(4) of FAA Order 5100.38C, Airport Improvement Program (AIP) Handbook: The preparation
SPADE-2 - Supporting Platform for Airport Decision-making and Efficiency Analysis Phase 2
 - Supporting Platform for Airport Decision-making and Efficiency Analysis Phase 2 2 nd User Group Meeting Overview of the Platform List of Use Cases UC1: Airport Capacity Management UC2: Match Capacity
CHAPTER 4: ALTERNATIVES
 MSP Long Term Comprehensive Plan Update Metropolitan Airports Commission 4.1 INTRODUCTION CHAPTER 4: ALTERNATIVES Several alternatives were developed and evaluated based on their capability to meet the
Dallas Executive Airport
 648 DECLARED DISTANCE OPTION 1a DISPLACE 31 THRESHOLD BY 97 Considers RSA Limiting Factor No runway extensions 13 31 TORA 6,451 6,451 TODA 6,451 6,451 ASDA 5,958 6,451 LDA 5,958 6,354 Runway 17-35 (3,8
Name of Customer Representative: Bruce DeCleene, AFS-400 Division Manager Phone Number:
 Phase I Submission Name of Program: Equivalent Lateral Spacing Operation (ELSO) Name of Program Leader: Dr. Ralf Mayer Phone Number: 703-983-2755 Email: rmayer@mitre.org Postage Address: The MITRE Corporation,
IDENTIFICATION AND EVALUATION OF ALTERNATIVES ST. PETERSBURG-CLEARWATER INTERNATIONAL AIRPORT
 IDENTIFICATION AND EVALUATION OF ALTERNATIVES ST. PETERSBURG-CLEARWATER INTERNATIONAL AIRPORT 7 7.1 GENERAL The primary objective of this chapter is to evaluate potential development alternatives and identify