SUPPLY AND DEMAND ANALYSIS
|
|
|
- Marsha Moody
- 6 years ago
- Views:
Transcription
1 SUPPLY AND DEMAND ANALYSIS The objectives of the supply and demand analysis are to: 1. Identify those hotels that constitute direct competition to the proposed hotel. 2. Estimate the occupancy levels, average room rates, and market mixes of the competitive hotels. 3. Project growth rates for each identifiable market segment. 4. Determine the existing relationship of supply to demand for the competitive hotels and to project these relationships for the first five years of operation. In addition, this section represents a review of both existing and proposed lodging facilities in the competitive market area. Charlotte Amalie, Saint Thomas, United States Virgin Islands Page E-1
2 Competitive Market Survey There are 13 hotels in greater Saint Thomas, Virgin Islands reporting their hotel data to Smith Travel Research. Interim Hospitality Consultants selected four upscale to luxury class resort hotels as an indication of Potential Market Demand for Saint Thomas all based on the excellent demand generator of this Caribbean island. Hotel Island Country Date Opened # of Rooms Room Rate May 2015 Primary Competition: Ritz-Carlton St. Thomas USVI $459-$549 Secret Harbor St. Thomas USVI $350-$725 Marriott St. Thomas USVI $439-$509 Westin St. John USVI $435-$629 Secondary Competition: Autograph Collection Scrub British VI $469-$669 Caneel Bay* St. John USVI N/A 166 $779-$1,279 Gallows Point* St. John USVI N/A 60 $345-$695 *Do not report to Smith Travel Research Hotels Under Construction, Announced or Rumored The Field Research for this project revealed the following hotels under construction, announced, or rumored within the Competitive Market Set that would compete with the proposed hotel. Under Construction A 250-room Margaritaville Resort by Wydham Hotels Vacation Time Share is under development on the east end of St. Thomas. Announced A 150-room Embassy Suites by Hilton Hotels has been announced at the Mahogany Run Golf Course on the north side of St. Thomas. Rumored A 50-room luxury hotel is rumored to be developed on Water Island in St. Thomas. Charlotte Amalie, Saint Thomas, United States Virgin Islands Page E-2
3
4
5
6
7 Smith Travel Research, Inc. Smith Travel Research, Inc. (STR) is an American company based in Hendersonville, Tennessee, that tracks supply and demand data for the hotel industry and provides market share analysis for all major hotel chains and brands in the United States, Canada, Mexico and the Caribbean. STR is associated with STR Global. RRC Associates. STR Analytics and HotelNewsNow.com. The hotel markets served are worldwide with more than 150 employees. Offices are located in: History Hendersonville (Nashville), Tennessee Rocky River (Cleveland), Ohio Boulder, Colorado STR was founded in 1985 by Randy and Carolyn Smith in Lancaster, Pennsylvania. The Smiths built the company with a focus on providing overall performance data and trends to the hotel industry. In the beginning, they developed a database with names, addresses and phone numbers of established hotel companies in the United States to create the Census Database. Randy Smith was contacted by Holiday Inn multiple times and urged to create a market share report. By 1988, the company launched the first Smith Travel Accommodations Report (STAR), a monthly report that includes data from hotels and measures each property's market share performance against a self-selected competitive set. STAR currently tracks nearly 40,000 properties. STR Family of Companies STR Global In 2008, STR combined its operations outside North America with Deloitte to form STR Global. STR continues serving the North American markets, while STR Global caters to a global audience. STR Global has its main office in London, with regional offices in Italy, Singapore, Tokyo, Jakarta, Sydney and Beijing. Charlotte Amalie, Saint Thomas, United States Virgin Islands Page E-7
8 HotelNewsNow.com STR launched HotelNewsNow.com in HotelNewsNow.com provides the global hotel industry with news coverage and hotel analysis that leverages its first access to data from the STR family of companies. This division comprises a multimedia website and collection of e-newsletters, including the Daily Update, Hotel Investment Barometer and Product Showcase. HotelNewsNow.com also hosts The Baird/STR Hotel Stock Index, a co-branded index created by Robert W. Baird & Co. and STR. The Index tracks the stock price movements associated with U.S. focused and domestically-based hotel companies. HotelNewsNow.com is based in Rocky River, Ohio. RRC Associates STR acquired RRC Associates in RRC is a consulting firm that provides market research, strategic analysis, community and land use planning services. RRC specializes in the collection and analysis of customer feedback via web, internet, mail or phone surveys. In addition, RRC operates the Boulder Focus Center, a qualitative research facility designed for state of the art research including surveys and focus groups. RRC Associates is based in Boulder, Colorado. STR Analytics STR Analytics utilizes the STR database and cross-references it with other data to provide objective trend-based analysis and empirical data about the lodging industry. STR Analytics is based in Boulder, Colorado. Trend Report One of the more requested reports by hotel developers, investors and the financial community of the Hotel Industry is the STR Trend Report. This is because it is pure uncorrupted data. Example: The night desk clerk at a hotel posts the room rate and appropriate taxes to each guest room folio. The total of the room revenue and number of occupied rooms is transmitted each day at 4:00 A.M. to the appropriate franchise corporate office, such as: Hilton Hotels to Memphis, Tennessee Holiday Inn to Atlanta Georgia, etc. Each morning the franchise company knows how many hotel rooms were rented (occupancy) and the total of room revenue of each of their hotels worldwide. Charlotte Amalie, Saint Thomas, United States Virgin Islands Page E-8
9 Every franchise hotel company, and many independent hotels, provide their room data to STR each day of the week, STR then produces Occupancy and Daily Average Rates data of various hotel segments and locations worldwide. Developers, consultants, financial executives and the general public can order a STR Trend Report of a specific set of hotels in specific locations. A report for the Competitive Market Set of Hotels ordered by Interim Hospitality Consultants follows. Glossary Terms used in the various Smith Travel Research reports of importance in this Study are defined as follows. Occ (Occupancy) Rooms sold divided by rooms available. Occupancy is always displayed as a percentage of rooms occupied. ADR (Average Daily Rate) Room revenue divided by rooms sold, displayed as the average rental rate for a single room. RevPAR (Revenue Per Available Room) Room revenue divided by rooms available. See Tab 10 of the STR Report for additional definitions. Charlotte Amalie, Saint Thomas, United States Virgin Islands Page E-9
10 Smith Travel Research Competitive Market Set The following hotels were combined to report their historical Occupancy and Average Daily Rate from January 2009 through March Hotel City Date Opened Number of Rooms Bluebeard`s Castle Resort Charlotte Amalie, STT Jan Bolongo Bay Beach Resort Charlotte Amalie, STT Jun The Green Iguana Hotel St Thomas, STT May Marriott Frenchman`s Reef & Morning Star Beach Resort Charlotte Amalie, STT Jun Ritz-Carlton St Thomas St Thomas, STT Jan Secret Harbour Beach Resort Charlotte Amalie, STT Jan Best Western Carib Beach Resort Charlotte Amalie, STT Jun Best Western Plus Emerald Beach Resort Charlotte Amalie, STT Jan The Buccaneer Christiansted, STC Jan Autograph Collection Scrub Island Resort Scrub Feb Westin St John Resort & Villas Great Cruz Bay, STJ Jan Caneel Bay Resort Cruz Bay, STJ Jan Renaissance St Croix Carambola Beach Resort & Spa Kingshill, STC Jan Total Rooms: 1,722 Source: Smith Travel Research, Hendersonville, Tennessee Note: Room counts in the Smith Travel Research Occupancy Data may vary from the room count reported by individual hotels due to usage of the rooms by the hotel management. Competitive Market Set Saint Thomas, Virgin Islands Month Occupancy ADR RevPAR Month Occupancy ADR RevPAR Jan Jan Feb Feb Mar Mar Apr Apr May May Jun Jun Jul Jul Aug Aug Sep Sep Oct Oct Nov Nov Dec Dec Source: Smith Travel Research, Hendersonville, Tennessee Charlotte Amalie, Saint Thomas, United States Virgin Islands Page E-10
11 Competitive Market Set Saint Thomas, Virgin Islands Month Occupancy ADR RevPAR Month Occupancy ADR RevPAR Jan Jan Feb Feb Mar Mar Apr Apr May May Jun Jun Jul Jul Aug Aug Sep Sep Oct Oct Nov Nov Dec Dec Source: Smith Travel Research, Hendersonville, Tennessee Competitive Market Set Saint Thomas, Virgin Islands Month Occupancy ADR RevPAR Month Occupancy ADR RevPAR Jan Jan Feb Feb Mar Mar Apr Apr May May Jun Jun Jul Jul Aug Aug Sep Sep Oct Oct Nov Nov Dec Dec Source: Smith Travel Research, Hendersonville, Tennessee Charlotte Amalie, Saint Thomas, United States Virgin Islands Page E-11
12 Standard Historical Trends Saint Thomas, Virgin Islands Competitive Market Set 2015* 2014 Month Occ ADR RevPAR Occ ADR RevPAR January February March st Qtr. Totals: Increase: 12.1% 5.2% 11.9% *January through March only Source: Smith Travel Research, Hendersonville, Tennessee Market Trend Saint Thomas, Virgin Islands Competitive Market Set Year Occupancy Average Daily Rate RevPAR A B Source: Smith Travel Research, Hendersonville, Tennessee A US Recession of was late in arriving. B Lower occupancy April-December due to tropical weather. Charlotte Amalie, Saint Thomas, United States Virgin Islands Page E-12
13
14
15
16 Trend Report Saint Thomas, United States Virgin Islands Market Set Year Occupancy ADR RevPAR Source: Smith Travel Research, Hendersonville, Tennessee
17 United Kingdom United States Blue Fin Building 735 East Main Street 110 Southwark Street Hendersonville London SE1 0TA TN Phone: +44 (0) Phone: +1 (615) Fax: +44 (0) Fax: +1 (615) Charlotte Amalie, STT Area Selected Properties January 2009 to March 2015 Currency: USD - US Dollar Table of Contents 1 Tab Data by Measure 2 Percent Change by Measure 3 Percent Change by Year 4 Twelve Month Moving Average 5 Twelve Month Moving Average with Percent Change 6 Day of Week Analysis 7 Raw Data 8 Classic 9 Response Report 10 Help 11 Terms and Conditions 12 Job Number: _SADIM Staff: SS Created: April 30, 2015
18 Tab 2 - Data by Measure Charlotte Amalie, STT Area Selected Properties Job Number: _SADIM Staff: SS Created: April 30, 2015 Occupancy (%) January February March April May June July August September October November December Total Year Mar YTD Avg ADR ($) January February March April May June July August September October November December Total Year Mar YTD Avg RevPAR ($) January February March April May June July August September October November December Total Year Mar YTD Avg Supply January February March April May June July August September October November December Total Year Mar YTD ,087 49,756 55,087 53,310 55,087 53,310 55,087 55,087 48,330 49,941 53,310 55, , , ,087 51,212 56,699 54,870 56,699 54,870 56,699 56,699 54,870 56,699 54,870 56, , , ,699 51,212 56,637 54,810 56,637 54,810 56,637 56,637 49,830 56,637 54,810 56, , , ,234 50,792 56,079 54,270 56,203 54,390 56,203 56,203 49,410 51,057 54,390 56, , , ,110 50,680 56,110 54,300 56,110 54,300 56,110 56,110 49,320 50,964 54,300 56, , , ,110 48,552 53,754 52,020 53,754 52,020 53,754 53,754 47,010 48,577 51,990 53, , , ,413 48,216 53, ,011 Avg 55,534 50,060 55,393 53,930 55,748 53,950 55,748 55,748 49,795 52,313 53,945 55, , ,987 Demand January February March April May June July August September October November December Total Year Mar YTD ,403 38,684 42,533 38,938 40,908 41,033 43,460 35,598 21,762 29,057 34,628 35, , , ,335 42,797 47,108 40,095 38,606 43,122 45,568 34,296 22,909 27,729 30,780 35, , , ,821 39,434 44,464 36,661 28,756 30,286 35,204 28,106 17,076 27,004 34,285 39, , , ,062 40,671 45,347 40,654 37,545 40,024 41,179 34,188 20,186 25,255 34,287 41, , , ,916 42,006 46,565 38,298 36,151 35,319 38,385 32,932 19,219 22,253 32,888 35, , , ,857 37,845 41,156 37,031 36,872 35,700 39,152 32,472 20,988 27,255 34,796 40, , , ,788 42,249 47, ,426 Avg 39,598 40,527 44,937 38,613 36,473 37,581 40,491 32,932 20,357 26,425 33,611 37, , ,062
19 Tab 2 - Data by Measure Charlotte Amalie, STT Area Selected Properties Job Number: _SADIM Staff: SS Created: April 30, ,810,098 15,203,249 15,780,219 12,318,649 9,992,118 9,244,244 9,304,460 6,706,316 3,381,106 4,848,340 8,401,163 13,667, ,657,362 43,793, ,649,859 16,119,083 18,952,829 12,928,019 9,622,478 10,307,405 10,143,075 6,731,299 3,350,751 4,596,343 7,593,565 14,887, ,882,624 49,721, ,134,585 15,696,173 16,821,404 11,106,117 7,750,012 7,782,266 8,396,825 6,036,989 2,949,272 4,947,243 8,186,994 16,360, ,168,156 46,652, ,835,501 16,450,012 18,513,935 13,569,933 9,926,067 10,068,098 10,092,149 7,531,549 3,562,288 4,629,552 8,607,536 15,447, ,234,388 49,799, ,393,702 17,254,638 19,384,267 12,017,530 9,685,276 9,424,861 9,768,059 7,133,667 3,464,020 4,031,716 8,483,329 14,288, ,329,168 52,032, ,537,323 15,997,825 16,823,876 12,193,518 9,796,617 9,390,048 10,029,336 6,880,896 3,587,666 5,161,655 9,326,639 16,911, ,636,772 48,359, ,542,497 18,843,987 20,539,311 55,925,795 Avg 14,843,366 16,509,281 18,116,549 12,355,627 9,462,095 9,369,487 9,622,317 6,836,786 3,382,517 4,702,475 8,433,204 15,260, ,818,078 49,469,196
20 Tab 3 - Percent Change from Previous Year - Detail by Measure Charlotte Amalie, STT Area Selected Properties Job Number: _SADIM Staff: SS Created: April 30, 2015 Occupancy January February March April May June July August September October November December Total Year Mar YTD Avg ADR January February March April May June July August September October November December Total Year Mar YTD Avg RevPAR January February March April May June July August September October November December Total Year Mar YTD Avg Supply January February March April May June July August September October November December Total Year Mar YTD Avg Demand January February March April May June July August September October November December Total Year Mar YTD Avg Revenue January February March April May June July August September October November December Total Year Mar YTD Avg STR s Trend Report is a publication of STR, Inc. and is intended solely for use by paid subscribers. Reproduction or distribution of the Trend Report, in whole or part, without written permission of STR is prohibited and subject to legal action. Site licenses are available. Ownership, distribution and use of the Trend Report and its contents are subject to the terms set forth in the contract you have entered into with STR. Source 2015 STR, Inc.
21 Tab 4 - Percent Change from Previous Year - Detail by Year Charlotte Amalie, STT Area Selected Properties Job Number: _SADIM Staff: SS Created: April 30, 2015 Jan 10 Feb 10 Mar 10 Apr 10 May 10 Jun 10 Jul 10 Aug 10 Sep 10 Oct 10 Nov 10 Dec 10 Total Year Mar YTD Occ ADR RevPAR Supply Demand Revenue Jan 11 Feb 11 Mar 11 Apr 11 May 11 Jun 11 Jul 11 Aug 11 Sep 11 Oct 11 Nov 11 Dec 11 Total Year Mar YTD Occ ADR RevPAR Supply Demand Revenue Jan 12 Feb 12 Mar 12 Apr 12 May 12 Jun 12 Jul 12 Aug 12 Sep 12 Oct 12 Nov 12 Dec 12 Total Year Mar YTD Occ ADR RevPAR Supply Demand Revenue Jan 13 Feb 13 Mar 13 Apr 13 May 13 Jun 13 Jul 13 Aug 13 Sep 13 Oct 13 Nov 13 Dec 13 Total Year Mar YTD Occ ADR RevPAR Supply Demand Revenue Jan 14 Feb 14 Mar 14 Apr 14 May 14 Jun 14 Jul 14 Aug 14 Sep 14 Oct 14 Nov 14 Dec 14 Total Year Mar YTD Occ ADR RevPAR Supply Demand Revenue Jan 15 Feb 15 Mar 15 Apr 15 May 15 Jun 15 Jul 15 Aug 15 Sep 15 Oct 15 Nov 15 Dec 15 Total Year Mar YTD Occ ADR RevPAR Supply Demand Revenue STR s Trend Report is a publication of STR, Inc. and is intended solely for use by paid subscribers. Reproduction or distribution of the Trend Report, in whole or part, without written permission of STR is prohibited and subject to legal action. Site licenses are available. Ownership, distribution and use of the Trend Report and its contents are subject to the terms set forth in the contract you have entered into with STR. Source 2015 STR, Inc.
22 Tab 5 - Twelve Month Moving Average Charlotte Amalie, STT Area Selected Properties Job Number: _SADIM Staff: SS Created: April 30, 2015 Occupancy (%) January February March April May June July August September October November December ADR ($) January February March April May June July August September October November December RevPAR ($) January February March April May June July August September October November December Supply January February March April May June July August September October November December , , , , , , , , , , , , , , , , , , , , , , , , , , , , , , , , , , , , , , , , , , , , , , , , , , , , , , , , , , , , , , ,613 Demand January February March April May June July August September October November December , , , , , , , , , , , , , , , , , , , , , , , , , , , , , , , , , , , , , , , , , , , , , , , , , , , , , , , , , , , , , , ,017 Revenue ($) January February March April May June July August September October November December ,497, ,412, ,585, ,194, ,825, ,888, ,727, ,752, ,721, ,469, ,662, ,882, ,367, ,944, ,813, ,991, ,118, ,593, ,847, ,152, ,751, ,102, ,695, ,168, ,869, ,622, ,315, ,779, ,955, ,241, ,936, ,431, ,044, ,726, ,146, ,234, ,792, ,597, ,467, ,915, ,674, ,031, ,707, ,309, ,210, ,613, ,488, ,329, ,472, ,215, ,655, ,831, ,942, ,908, ,169, ,916, ,040, ,170, ,013, ,636, ,641, ,488, ,203,543 High value is boxed. Low value is boxed and italicized. STR s Trend Report is a publication of STR, Inc. and is intended solely for use by paid subscribers. Reproduction or distribution of the Trend Report, in whole or part, without written permission of STR is prohibited and subject to legal action. Site licenses are available. Ownership, distribution and use of the Trend Report and its contents are subject to the terms set forth in the contract you have entered into with STR. Source 2015 STR, Inc.
23 Tab 6 - Twelve Month Moving Average with Percent Change Charlotte Amalie, STT Area Selected Properties Job Number: _SADIM Staff: SS Created: April 30, 2015 Date Occupancy ADR RevPar Supply Demand Revenue This Year % Chg This Year % Chg This Year % Chg This Year % Chg This Year % Chg This Year % Chg Jan , , ,497,123 Feb , , ,412,957 Mar , , ,585,567 Apr , , ,194,937 May , , ,825,297 Jun , , ,888,458 Jul , , ,727,073 Aug , , ,752,056 Sep , , ,721,701 Oct , , ,469,704 Nov , , ,662,106 Dec , , ,882, Jan , , ,367, Feb , , ,944, Mar , , ,813, Apr , , ,991, May , , ,118, Jun , , ,593, Jul , , ,847, Aug , , ,152, Sep , , ,751, Oct , , ,102, Nov , , ,695, Dec , , ,168, Jan , , ,869, Feb , , ,622, Mar , , ,315, Apr , , ,779, May , , ,955, Jun , , ,241, Jul , , ,936, Aug , , ,431, Sep , , ,044, Oct , , ,726, Nov , , ,146, Dec , , ,234, Jan , , ,792, Feb , , ,597, Mar , , ,467,
24 Tab 6 - Twelve Month Moving Average with Percent Change Charlotte Amalie, STT Area Selected Properties Job Number: _SADIM Staff: SS Created: April 30, 2015 Date Occupancy ADR RevPar Supply Demand Revenue This Year % Chg This Year % Chg This Year % Chg This Year % Chg This Year % Chg This Year % Chg Apr , , ,915, May , , ,674, Jun , , ,031, Jul , , ,707, Aug , , ,309, Sep , , ,210, Oct , , ,613, Nov , , ,488, Dec , , ,329, Jan , , ,472, Feb , , ,215, Mar , , ,655, Apr , , ,831, May , , ,942, Jun , , ,908, Jul , , ,169, Aug , , ,916, Sep , , ,040, Oct , , ,170, Nov , , ,013, Dec , , ,636, Jan , , ,641, Feb , , ,488, Mar , , ,203, STR s Trend Report is a publication of STR, Inc. and is intended solely for use by paid subscribers. Reproduction or distribution of the Trend Report, in whole or part, without written permission of STR is prohibited and subject to legal action. Site licenses are available. Ownership, distribution and use of the Trend Report and its contents are subject to the terms set forth in the contract you have entered into with STR. Source 2015 STR, Inc.
25 Tab 7 - Day of Week Analysis Charlotte Amalie, STT Area Selected Properties Job Number: _SADIM Staff: SS Created: April 30, 2015 Occupancy (%) Three Year Occupancy (%) Sun Mon Tue Wed Thu Fri Sat Total Month Sun Mon Tue Wed Thu Fri Sat Total Year Apr Apr 12 - Mar May Apr 13 - Mar Jun Apr 14 - Mar Jul Total 3 Yr Aug Sep Oct Nov Dec Jan Feb Mar Total Year ADR Three Year ADR Sun Mon Tue Wed Thu Fri Sat Total Month Sun Mon Tue Wed Thu Fri Sat Total Year Apr Apr 12 - Mar May Apr 13 - Mar Jun Apr 14 - Mar Jul Total 3 Yr Aug Sep Oct Nov Dec Jan Feb Mar Total Year RevPAR Three Year RevPAR Sun Mon Tue Wed Thu Fri Sat Total Month Sun Mon Tue Wed Thu Fri Sat Total Year Apr Apr 12 - Mar May Apr 13 - Mar Jun Apr 14 - Mar Jul Total 3 Yr Aug Sep Oct Nov Dec Jan Feb Mar Total Year STR s Trend Report is a publication of STR, Inc. and is intended solely for use by paid subscribers. Reproduction or distribution of the Trend Report, in whole or part, without written permission of STR is prohibited and subject to legal action. Site licenses are available. Ownership, distribution and use of the Trend Report and its contents are subject to the terms set forth in the contract you have entered into with STR. Source 2015 STR, Inc.
26 Tab 8 - Raw Data Charlotte Amalie, STT Area Selected Properties Job Number: _SADIM Staff: SS Created: April 30, 2015 Date Occupancy ADR RevPar Supply Demand Revenue Census & Sample % Exchange Rate This This This % Rooms STAR Year % Chg Year % Chg Year % Chg This Year % Chg This Year % Chg This Year % Chg Census Props Census Rooms Participants Per USD Jan ,087 35,403 12,810, , Feb ,756 38,684 15,203, , Mar ,087 42,533 15,780, , Apr ,310 38,938 12,318, , May ,087 40,908 9,992, , Jun ,310 41,033 9,244, , Jul ,087 43,460 9,304, , Aug ,087 35,598 6,706, , Sep ,330 21,762 3,381, , Oct ,941 29,057 4,848, , Nov ,310 34,628 8,401, , Dec ,087 35,611 13,667, , Jan , , ,649, , Feb , , ,119, , Mar , , ,952, , Apr , , ,928, , May , , ,622, , Jun , , ,307, , Jul , , ,143, , Aug , , ,731, , Sep , , ,350, , Oct , , ,596, , Nov , , ,593, , Dec , , ,887, , Jan , , ,134, , Feb , , ,696, , Mar , , ,821, , Apr , , ,106, , May , , ,750, , Jun , , ,782, , Jul , , ,396, , Aug , , ,036, , Sep , , ,949, , Oct , , ,947, , Nov , , ,186, , Dec , , ,360, , Jan , , ,835, , Feb , , ,450, , Mar , , ,513, , Apr , , ,569, , May , , ,926, , Jun , , ,068, , Jul , , ,092, , Aug , , ,531, , Sep , , ,562, , Oct , , ,629, , Nov , , ,607, , Dec , , ,447, , Jan , , ,393, ,
27 Tab 8 - Raw Data Charlotte Amalie, STT Area Selected Properties Job Number: _SADIM Staff: SS Created: April 30, 2015 Date Occupancy ADR RevPar Supply Demand Revenue Census & Sample % Exchange Rate This This This % Rooms STAR Year % Chg Year % Chg Year % Chg This Year % Chg This Year % Chg This Year % Chg Census Props Census Rooms Participants Per USD Feb , , ,254, , Mar , , ,384, , Apr , , ,017, , May , , ,685, , Jun , , ,424, , Jul , , ,768, , Aug , , ,133, , Sep , , ,464, , Oct , , ,031, , Nov , , ,483, , Dec , , ,288, , Jan , , ,537, , Feb , , ,997, , Mar , , ,823, , Apr , , ,193, , May , , ,796, , Jun , , ,390, , Jul , , ,029, , Aug , , ,880, , Sep , , ,587, , Oct , , ,161, , Nov , , ,326, , Dec , , ,911, , Jan , , ,542, , Feb , , ,843, , Mar , , ,539, , STR s Trend Report is a publication of STR, Inc. and is intended solely for use by paid subscribers. Reproduction or distribution of the Trend Report, in whole or part, without written permission of STR is prohibited and subject to legal action. Site licenses are available. Ownership, distribution and use of the Trend Report and its contents are subject to the terms set forth in the contract you have entered into with STR. Source 2015 STR, Inc.
28 Tab 9 - Classic Charlotte Amalie, STT Area Selected Properties Job Number: _SADIM Staff: SS Created: April 30, 2015 Date Occupancy ADR RevPar Supply Demand Revenue Census & Sample % % Rooms STAR This Year % Chg This Year % Chg This Year % Chg This Year % Chg This Year % Chg This Year % Chg Census Props Census Rooms Participants Jan ,087 35,403 12,810, , Feb ,756 38,684 15,203, , Mar ,087 42,533 15,780, , Apr ,310 38,938 12,318, , May ,087 40,908 9,992, , Jun ,310 41,033 9,244, , Jul ,087 43,460 9,304, , Aug ,087 35,598 6,706, , Sep ,330 21,762 3,381, , Oct ,941 29,057 4,848, , Nov ,310 34,628 8,401, , Dec ,087 35,611 13,667, , Mar YTD , ,620 43,793,566 Total , , ,657,362 Jan , , ,649, , Feb , , ,119, , Mar , , ,952, , Apr , , ,928, , May , , ,622, , Jun , , ,307, , Jul , , ,143, , Aug , , ,731, , Sep , , ,350, , Oct , , ,596, , Nov , , ,593, , Dec , , ,887, , Mar YTD , , ,721, Total , , ,882, Jan , , ,134, , Feb , , ,696, , Mar , , ,821, , Apr , , ,106, , May , , ,750, , Jun , , ,782, , Jul , , ,396, , Aug , , ,036, , Sep , , ,949, , Oct , , ,947, , Nov , , ,186, , Dec , , ,360, , Mar YTD , , ,652, Total , , ,168, Jan , , ,835, , Feb , , ,450, , Mar , , ,513, , Apr , , ,569, ,
29 Tab 9 - Classic Charlotte Amalie, STT Area Selected Properties Job Number: _SADIM Staff: SS Created: April 30, 2015 Date Occupancy ADR RevPar Supply Demand Revenue Census & Sample % % Rooms STAR This Year % Chg This Year % Chg This Year % Chg This Year % Chg This Year % Chg This Year % Chg Census Props Census Rooms Participants May , , ,926, , Jun , , ,068, , Jul , , ,092, , Aug , , ,531, , Sep , , ,562, , Oct , , ,629, , Nov , , ,607, , Dec , , ,447, , Mar YTD , , ,799, Total , , ,234, Jan , , ,393, , Feb , , ,254, , Mar , , ,384, , Apr , , ,017, , May , , ,685, , Jun , , ,424, , Jul , , ,768, , Aug , , ,133, , Sep , , ,464, , Oct , , ,031, , Nov , , ,483, , Dec , , ,288, , Mar YTD , , ,032, Total , , ,329, Jan , , ,537, , Feb , , ,997, , Mar , , ,823, , Apr , , ,193, , May , , ,796, , Jun , , ,390, , Jul , , ,029, , Aug , , ,880, , Sep , , ,587, , Oct , , ,161, , Nov , , ,326, , Dec , , ,911, , Mar YTD , , ,359, Total , , ,636, Jan , , ,542, , Feb , , ,843, , Mar , , ,539, , Mar YTD , , ,925,
30 Tab 9 - Classic Charlotte Amalie, STT Area Selected Properties Job Number: _SADIM Staff: SS Created: April 30, 2015 Date Occupancy ADR RevPar Supply Demand Revenue Census & Sample % % Rooms STAR This Year % Chg This Year % Chg This Year % Chg This Year % Chg This Year % Chg This Year % Chg Census Props Census Rooms Participants STR s Trend Report is a publication of STR, Inc. and is intended solely for use by paid subscribers. Reproduction or distribution of the Trend Report, in whole or part, without written permission of STR is prohibited and subject to legal action. Site licenses are available. Ownership, distribution and use of the Trend Report and its contents are subject to the terms set forth in the contract you have entered into with STR. Source 2015 STR, Inc.
31 Tab 10 - Response Report Charlotte Amalie, STT Area Selected Properties Job Number: _SADIM Staff: SS Created: April 30, STR Code Name of Establishment City & State Postal Code Country Class Open Date Rooms Chg in Rms J F M A M J J A S O N D J F M A M J J A S O N D J F M A M J J A S O N D Bluebeard`s Castle Resort Charlotte Amalie, STT US Virgin Islands Upscale Class Jan Bolongo Bay Beach Resort Charlotte Amalie, STT US Virgin Islands Upper Upscale Class Jun Y The Green Iguana Hotel St Thomas, STT US Virgin Islands Upscale Class May Marriott Frenchman`s Reef & Morning Star Beach Resort Charlotte Amalie, STT US Virgin Islands Upper Upscale Class Jun Y Ritz-Carlton St Thomas St Thomas, STT US Virgin Islands Luxury Class Jan Secret Harbour Beach Resort Charlotte Amalie, STT US Virgin Islands Luxury Class Jan Best Western Carib Beach Resort Charlotte Amalie, STT US Virgin Islands Midscale Class Jun Best Western Plus Emerald Beach Resort Charlotte Amalie, STT US Virgin Islands Upper Midscale Class Jan The Buccaneer Christiansted, STC US Virgin Islands Luxury Class Jan Y Autograph Collection Scrub Island Resort Scrub, British Virgin Islands Upper Upscale Class Feb Y Westin St John Resort & Villas Great Cruz Bay, STJ US Virgin Islands Upper Upscale Class Jan Y Caneel Bay Resort Cruz Bay, STJ US Virgin Islands Luxury Class Jan Renaissance St Croix Carambola Beach Resort & Spa Kingshill, STC US Virgin Islands Upper Upscale Class Jan Y Total Properties: Monthly data received by STR / STR Global - Monthly and daily data received by STR / STR Global Blank - No data received by STR / STR Global Y - (Chg in Rms) Property has experienced a room addition or drop during the time period of the report. STR s Trend Report is a publication of STR, Inc. and is intended solely for use by paid subscribers. Reproduction or distribution of the Trend Report, in whole or part, without written permission of STR is prohibited and subject to legal action. Site licenses are available. Ownership, distribution and use of the Trend Report and its contents are subject to the terms set forth in the contract you have entered into with STR. Source 2015 STR, Inc.
32

33
34 Demand Analysis The management of the various competitive hotels revealed that room-night demand within the competitive supply is currently generated by two major market segments: commercial segment, 10.0%, and leisure travelers, 90.0%, on an annual basis. Commercial Guest Demand Commercial travelers, who are10.0% of the market, generally have strong demand for rooms from mid-january to mid-june, and again from mid-september to mid-december. The summer time of mid-june to mid-september has moderate demand, with the mid- December to mid-january period very low. In the more commercially-oriented properties, the weekday market is strongest. This is due to the strength of the commercial market during Monday through Thursday. When extended-stay amenities are added to the guest rooms, the annual guest occupancy increases, as various companies cut travel costs of their personnel. The commercial room demand in the area is increasing, and hotels are changing their guestroom mix and adding facilities and amenities to cater to this business. Commercial travelers are comprised of corporate business, military and sales personnel. However, government employees are also included in this group. The government business is primarily that of the Territory of the Virgin Islands with a contribution by national government interests. Projected Growth Rates Commercial Room Night Demand Year Weekday Weekend Annual 2018, % 0 1% % 0 1% Source: Interim Hospitality Consultants Leisure Demand Leisure travelers represent 90.0% of demand for lodging accommodations in the competitive market area. This segment is made up of vacationing families, followed by individual senior citizens. The average length of stay was 6.8 days according to information supplied by interviews with local hotels. The following are the projected growth rates for leisure room-night demand for the years 2018 to Charlotte Amalie, Saint Thomas, United States Virgin Islands Page E-35
35 Projected Growth Rates Leisure Room Night Demand Year Weekday Weekend Annual 2018, % 1% 1% % 1% 1% Source: Interim Hospitality Consultants, Proposed Hotel Base Year As of the date of this Study, June 2015, it is understood that the property will open in 2017 at the earliest. Therefore, the first full base year of the hotel will be Year Leisure 90.0% Base Year and Projected Market Demand, Available Rooms and Occupancy Commercial 10.0% Total Guestroom Nights Occupied 100% Annual Available Rooms-A Market Set Occupancy-B ,703 18, , , % ,127 19, , , % ,030 19, , , % ,976 19, , , % ,400 19, , , % Source: Interim Hospitality Consultants Annual Available Rooms Marriott Hotel 478 Ritz Carlton 180 Subject: Curio Hotel by Hilton 80 Subtotal: 658 Total Rooms: 738 Projected Annual Growth Rate Commercial Room Demand 1.0% 1.0% Leisure Room Demand 1.0% 1.0% Annual Total Projected Growth Rate 2.0% 2.0% Charlotte Amalie, Saint Thomas, United States Virgin Islands Page E-36
36
37
38
39
40
41
42
43
44
45
46
47
48
49
50
51
52
53
54 Summary The 13 hotels of Greater St. Thomas reporting their hotel data to Smith Travel Research exemplify upscale growth and stability. The hotels are: Hotel City, Island Number of Rooms Luxury Caneel Bay Resort Cruz Bay, USVI 166 Ritz-Carlton St Thomas St. Thomas, USVI 180 Secret Harbour Beach Resort Charlotte Amalie, USVI 70 The Buccaneer Christiansted, USVI 138 Upper Upscale Autograph Collection Scrub Island Resort Scrub, BVI 59 Bolongo Bay Beach Resort Charlotte Amalie, USVI 74 Marriott Frenchman`s Reef & Morning Star Beach Resort Charlotte Amalie, USVI 468 Renaissance St Croix Carambola Beach Resort & Spa Kingshills, USVI 151 Westin St John Resort & Villas St. John, USVI 96 Upscale Bluebeard`s Castle Resort Charlotte Amalie, USVI 170 The Green Iguana Hotel St. Thomas, USVI 9 Upper Midscale Best Western Plus Emerald Beach Resort Charlotte Amalie, USVI 90 Midscale Best Western Carib Beach Resort Charlotte Amalie, USVI 51 Source: Smith Travel Research, Hendersonville, Tennessee Market Trend Saint Thomas, Virgin Islands Competitive Market Set Year Occupancy Average Daily Rate RevPAR A B Source: Smith Travel Research, Hendersonville, Tennessee A US Recession of was late in arriving. B Lower occupancy April-December due to tropical weather For the past six years, the Hotel Occupancy of Greater St. Thomas, USVI has averaged a very stable rate of 66.1%. The Average Daily Rate has kept pace with inflation at Charlotte Amalie, Saint Thomas, United States Virgin Islands Page E-55
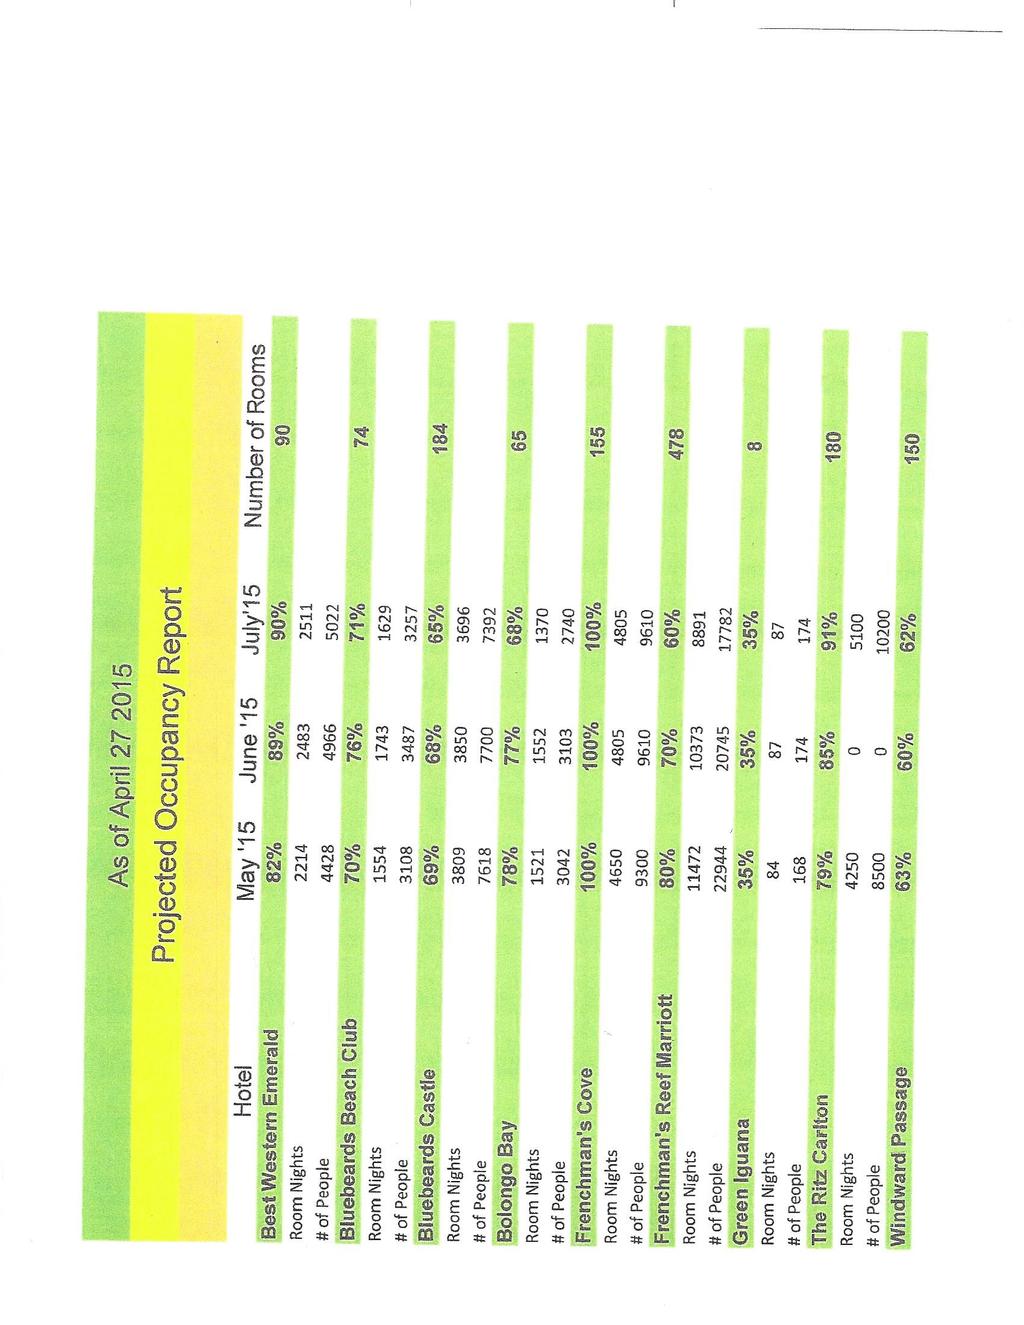
55 2.0%, to reach a 2014 Average Daily Rate of $ Standard Historical Trends Saint Thomas, Virgin Islands Competitive Market Set 2015* 2014* Month Occ ADR RevPAR Occ ADR RevPAR January February March st Qtr. Totals: Increase: 12.1% 5.2% 11.9% *January through March only Source: Smith Travel Research, Hendersonville, Tennessee It was reported that the Ritz Carlton enjoyed a 95.0+% Occupancy the First Quarter of 2015 and that the Marriott Hotel was just full every day. Projected Occupancy The Field Research for this Feasibility Study was fortunate to obtain a copy of the Projected Hotel Occupancy of May-July 2015 for the hotels of St. Thomas, USVI. The data was provided by the United States Virgin Islands Hotel and Tourism Association. Selected Hotel Projections for May-July 2015 Hotel Island Rooms May June July Ritz Carlton St. Thomas % 85.0% 91.0% Marriott, Frenchman s Cove St. Thomas % 100.0% 100.0% Marriott, Frenchman s Reef St. Thomas % 70.0% 60.0% Westin St. John % 89.0% 95.0% Caneel Bay St. John % 75.0% 71.0% Total: 86.4% 83.8% 83.4% Source: USVI Hotel Tourism Association The complete report follows on the next page. Charlotte Amalie, Saint Thomas, United States Virgin Islands Page E-56
56

57
Billings Area COC. For the Month of April 2017 Date Created: May 17, 2017
 United Kingdom United States Blue Fin Building 735 East Main Street 110 Southwark Street Hendersonville London SE1 0TA TN 37075 Phone: +44 (0)20 7922 1930 Phone: +1 (615) 824 8664 Fax: +44 (0)20 7922 1931
Billings Area COC. For the Month of December 2010 Date Created: Jan 18, 2011
 1 United Kingdom United States Blue Fin Building 735 East Main Street 110 Southwark Street Hendersonville London SE1 0TA TN 37075 Phone: +44 (0)20 7922 1930 Phone: +1 (615) 824 8664 Fax: +44 (0)20 7922
The European Hotel Market
 The European Hotel Market Boutique and Lifestyle Hotel Summit 2017 Sophie Colvin Business Development scolvin@str.com 2016 STR, Inc. All Rights Reserved. Any reprint, use or republication of all or a part
Recovery Now! ANZPHIC 2010 Sydney - July 8, Hotel Performance Back On Track
 Recovery Now! Hotel Performance Back On Track ANZPHIC 2010 Sydney - July 8, 2010. STR Global Ltd is the exclusive owner of all rights in this presentation and its content. Reproduction of all or a portion
Measures & Projections October 31, GoToBermuda.com
 Measures & Projections October 31, 2015 GoToBermuda.com October Total Vacation Visitor Arrivals Vacation Arrivals Oct-14 Oct-15 2015 Air Vacation 9,203 10,344 1,141 12.40 126,842 127,044 202 0.16 Cruise
DOWNTOWN, CHARLOTTE AMALIE
 TOTAL VISITOR ARRIVALS TO THE USVI : DECEMBER YEAR TO DATE DECEMBER TOTAL VISITOR ARRIVALS 2,85, 2,8, 2,814,257 2,75, 2,7, 2,65, 2,6, 2,642,118 2,71,542 2,648,5 2,55, 212 213 214 215 Visitor arrivals ended
Chattanooga & Hamilton Co. Tourism Trends & Economic Outlook
 Chattanooga & Hamilton Co. Tourism Trends & Economic Outlook How Tourism Works for Chattanooga, TN January 21, 2010 Presentation by: Steve Morse, Ph.D. Director & Economist, Tourism Institute University
Industry. OH&LA Hospitality It s not all BLACK & WHITE. Duane Vinson Vice President
 State of the Industry OH&LA Hospitality 2010 It s not all BLACK & WHITE Duane Vinson Vice President For a copy of this presentation go to www.hotelnewsnow.com Click on Industry Presentation Supply Growth
Visit Loudoun 2016 Lodging Market Research
 2016 Lodging Market Research Prepared for: Loudoun County Lodging Market Research & Analysis Study Conducted: November December 2016 Final Report Submitted: December 2016 2016 Lodging Market Analysis Summary
Lodging Industry Overview. 14 December Bobby Bowers Smith Travel Research / STR Global
 Lodging Industry Overview 14 December 2011 Bobby Bowers Smith Travel Research / STR Global Global / U.S. Overview Key U.S. Markets Construction Pipeline Forecast Takeaways Today s Agenda RevPar Growth
Accommodation Market update
 STR Global Ltd is the exclusive owner of all rights to hotel related data in this presentation and its content. Reproduction of all or a portion of this presentation for any purpose without prior approval
Visit Phoenix Market Update January Eric Kerr Director of Research & Business Analysis
 Visit Phoenix Market Update January 2019 Eric Kerr Director of Research & Business Analysis Visitation totals 2012-2017 & Spending trends Hotel Market Overview YTD - November Chain scales, Submarkets,
GoToBermuda.com. Q4 Arrivals and Statistics at December 31 st 2015
 Q4 Arrivals and Statistics at December 31 st 1 Q4 Total Vacation Visitor Arrivals Q4 Arrivals Air - Vacation 23,770 23,125-2.7% -645 141,509 139,820-1.2% -1,689 Cruise 39,118 48,344 23.6% 9,226 355,880
Panama City Beach CVB Travel Market Preliminary Report. Prepared for: Panama City Beach Convention & Visitors Bureau
 Panama City Beach CVB 2017 Travel Market Preliminary Report Prepared for: Panama City Beach Convention & Visitors Bureau Presented by: Berkeley Young, President Young Strategies, Inc. Larry D. Gustke,
STR: Asia Pacific Hotel Update Yesterday, Today & Tomorrow
 STR: Asia Pacific Hotel Update Yesterday, Today & Tomorrow ITB Asia, 25 October 2017 Fenady Uriarte Business Development Manager, Southeast Asia furiarte@str.com, apinfo@str.com 2017 STR, Inc. All Rights
Hotel Association of North Texas. Karrie Keen Director, Destination and Trend Operations
 Hotel Association of North Texas Karrie Keen Director, Destination and Trend Operations To view this presentation, go to HotelNewsNow.com and click on Industry Analysis then Hotel data presentations. Agenda
PREFERRED HOTELS & RESORTS
 PREFERRED HOTELS & RESORTS SUMMARY Using data provided by STR Analytics, HVS evaluated the performance of the 72 hotels affiliated with (PHR) in North America. The study focused on the performance of the
Featured Explorer Collection Hotels & Resorts Quick Reference Point Chart For reservations with occupancy from 1 January March 2018
 For reservations with occupancy from 1 January 2017-31 March 2018 Beijing Marriott Hotel City Wall 1 Jan 2017-31 Mar 2018 475 China Hotel, A Marriott Hotel, Guangzhou 400 Courtyard by Marriott Hong Kong
January 2018 Air Traffic Activity Summary
 January 2018 Air Traffic Activity Summary Jan-2018 Jan-2017 CY-2018 CY-2017 Passengers 528,947 505,421 4.7% 528,947 505,421 4.7% Passengers 537,332 515,787 4.2% 537,332 515,787 4.2% Passengers 1,066,279
Finding Rationality in an Irrational World: The Economics of Successful Hotel Negotiations
 Finding Rationality in an Irrational World: The Economics of Successful Hotel Negotiations Isaac Collazo, Vice President, Performance Strategy & Planning, InterContinental Hotels Group (IHG) Maria Lowry,
EFFECTS OF CITYWIDE CONVENTIONS ON DOWNTOWN VANCOUVER HOTELS IN 2016
 EFFECTS OF CITYWIDE CONVENTIONS ON DOWNTOWN VANCOUVER HOTELS IN 2016 NICOLETTE DOUGLAS CONSULTING APRIL 2017 TABLE OF CONTENTS EXECUTIVE SUMMARY... 3 BACKGROUND AND PURPOSE... 6 APPROACH... 6 ANALYSIS...
Panama City Beach CVB Visitor Profile & Economic Impact Report. Prepared for: Panama City Beach Convention & Visitors Bureau
 Panama City Beach CVB 2015 Visitor Profile & Economic Impact Report Presented by: Berkeley Young, President Young Strategies, Inc. Larry D. Gustke, PhD Prepared for: Panama City Beach Convention & Visitors
29 th European Hotel Investment Conference Heading into thin air? Robin Rossmann Wednesday 8 November
 29 th European Hotel Investment Conference Heading into thin air? Robin Rossmann Wednesday 8 November European Hotel Investment Conference Robin Rossmann, Managing Director - STR rrossmann@str.com @STR_Data
Panama City Beach Travel Market Economic Impact Report. Prepared for: Panama City Beach Convention & Visitors Bureau
 Panama City Beach 2016 Travel Market Economic Impact Report Presented by: Berkeley Young, President Young Strategies, Inc. Data Analysis: Larry D. Gustke, PhD Steve Morse, PhD Prepared for: Panama City
Occupancy in North Carolina
 Smith Travel Research Year-End 2009 Lodging Report Year-end 2009 hotel/motel occupancy was down -9.0% statewide from 2008. This represents a decrease of -12.2% since 2005. o The US occupancy was down -8.6%
U.S. Hotel Industry Performance HBI Annual Conference
 U.S. Hotel Industry Performance HBI Annual Conference February 17, 2017 Jeff Higley VP/Editorial Director jeff@str.com @jeffhigley1 2016 STR, Inc. All Rights Reserved. Any reprint, use or republication
HOTEL INDUSTRY OVERVIEW. Texas
 HOTEL INDUSTRY OVERVIEW Texas DEMAND GROWTH STRONG BALANCED OCC & ADR GROWTH % Change Room Supply* 149M 1.3% Room Demand* 92M 5.6% Occupancy 61.6% 4.3% A.D.R. $90 4.4% RevPAR $55 8.9% Room Revenue* $8.3B
Hotel Industry Performance Overview Washington Lodging Convention
 Hotel Industry Performance Overview Washington Lodging Convention Valerie Woods Director of Business Development, Hotels vwoods@str.com Valerie_STR 2016 STR, Inc. All Rights Reserved. Any reprint, use
TOURISM PERFORMANCE 2017
 4 th QUARTER TOURISM PERFORMANCE 2017 TOTAL STAYOVER ARRIVALS 105,658 TOTAL CRUISE ARRIVALS 224,212 TOTAL VISITOR NIGHTS AVERAGE HOTEL OCCUPANCY 935,402 71.7% ECONOMIC IMPACT $142.6 million HOW WAS OUR
Third Quarter Marketing Report B R A N SON/LAKES A R EA C VB N OVEMBER, 2013
 Third Quarter Marketing Report B R A N SON/LAKES A R EA C VB N OVEMBER, 2013 Economic Outlook +5.1% from July 2011 Consumer Confidence is Up 7% This Year Increasing from 66.7 in Dec to 71.2 Today +6.7%
Monthly Update - Aruba s Tourism Industry: November 2016 and Year to Date 2016
 Summary Highlights. MONTHLY UPDATE - ARUBA S TOURISM INDUSTRY November 2016 and Year to Date 2016 The total number of stopovers visiting Aruba decreased by 28.7% in November, from 110,307 in November 2015
Lodging Outlook. Canadian August What Does a Franchise Cost? computers and reservation personnel.
 Canadian August 2005 Lodging Outlook SMITH TRAVEL RESEARCH What Does a Franchise Cost? By: Stephen Rushmore, MAI, CHA - HVS International - New York T he selection of an appropriate hotel franchise affiliation
COUNCIL OF INNS & SUITES Lodging Overview. Jan D. Freitag Senior Vice President
 COUNCIL OF INNS & SUITES Lodging Overview Jan D. Freitag Senior Vice President 1 www.hotelnewsnow.com Click on Hotel Data Presentations 2 Agenda Total US Review Chain Scale Review Upper Midscale / Midscale
Monthly Update - Aruba s Tourism Industry: October 2016 and Year to Date 2016
 Summary Highlights. MONTHLY UPDATE - ARUBA S TOURISM INDUSTRY October 2016 and Year to Date 2016 The total number of stopovers visiting Aruba decreased by 29.8% in October, from 109,024 in October 2015
HelmsBr Meeting I ndustry T rends 2011 September 10, 2010
 HelmsBriscoe Meeting Industry Trends 2011 September 10, 2010 Agenda HelmsBriscoe Overview Market Conditions Key Meeting Industry Trends Q&A HB By the Numbers The largest meetings procurement firm in the
Nova Scotia Tourism Indicators November 2018
 Nova Scotia Tourism Indicators November 2018 2018 Tourism Visitation YTD Jan Feb Mar Apr May Jun Jul Aug Sep Oct Nov Dec Visitor Entries ('000s) Road Visits by Entry Point* 1,507 68 69 83 90 122 149 274
Nova Scotia Tourism Indicators August 2017
 Nova Scotia Tourism Indicators August 2017 Data as of September 28, 2017 2017 Tourism Visitation YTD Jan Feb Mar Apr May Jun Jul Aug Sep Oct Nov Dec Visitor Entries ('000s) Road Visits by Entry Point*
SYSTEM BRIEF DAILY SUMMARY
 SYSTEM BRIEF SUMMARY * ANNUAL (PEAK HOURS 7:00 AM TO 10:00 PM MON-SAT) MaxTemp NEL (MWH) Hr Ending Hr Ending LOAD ENERGY (MWH) INCREMENTAL COST DAY DATE Civic TOTAL MAXIMUM @Max MINIMUM @Min FACTOR ON
U.S. Hotel Industry Performance. Brad Garner Chief Operating Officer
 U.S. Hotel Industry Performance Brad Garner Chief Operating Officer 1 Agenda Total US Review Scale Review Segmentation Markets Supply Pipeline 2013 / 2014 Forecast 2 www.hotelnewsnow.com Click on Hotel
Prices are Starting From MARINER OF THE SEAS VOYAGER CLASS TONNAGE :
 MARINER OF THE SEAS SAILING ON MARCH 2018 1-Mar-18 5-Mar-18 9-Mar-18 12-Mar-18 16-Mar-18 19-Mar-18 29-Mar-18 2-Apr-18 6-Apr-18 4 NIGHTS 4 NIGHTS 3 NIGHTS 4 NIGHTS 3 NIGHTS 3 NIGHTS 4 NIGHTS 4 NIGHTS 3
Nova Scotia Tourism Indicators March 2018
 Nova Scotia Tourism Indicators March 2018 Data as of May 31st, 2018 2018 Tourism Visitation YTD Jan Feb Mar Apr May Jun Jul Aug Sep Oct Nov Dec Visitor Entries ('000s) Road Visits by Entry Point* 220 68
Mexico Hotel & Tourism Investment Conference Global Hotel Industry Overview
 Mexico Hotel & Tourism Investment Conference Global Hotel Industry Overview Jeff Higley VP, digital media & communications Thursday, 7 February 2013 www.hotelnewsnow.com Click on Hotel Data Presentations
MPI Nashville Chapter
 MPI Nashville Chapter Monthly Meeting Embassy Suites Cool Springs September 20, 2017 Veronica Andrews Director, Digital Data Solutions vandrews@str.com @STR_Data 2017 STR, Inc. All Rights Reserved. Any
CARIBBEAN TRENDS IN THE HOTEL INDUSTRY TWELFTH EDITION SAMPLE
 CARIBBEAN TRENDS IN THE HOTEL INDUSTRY TWELFTH EDITION - 2017 Maps Table of Contents Map of the Caribbean Region 5 One Step Back 6 Caribbean Hospitality Industry Updates Airbnb in the Caribbean 8 How Currency
The Economic Impact of Travel in Kansas. Tourism Satellite Account Calendar Year 2013
 The Economic Impact of Travel in Kansas Tourism Satellite Account Calendar Year 2013 Who we are Tourism Economics Union of industry expertise and economic disciplines Real world insights based on quantitative
Alberta Tourism Market Monitor
 Alberta Tourism Market Monitor + 7.0% (YYC & YEG only) +2.5% -0.7% (Banff, Jasper and Waterton Lakes only) AIR PASSENGERS (Arrivals and Departures) HIGHWAY COUNT NATIONAL PARKS ATTENDANCE -5.0% (Accommodation
THE GROWTH OF THE HOSPITALITY INDUSTRY IN DUBAI
 THE GROWTH OF THE HOSPITALITY INDUSTRY IN DUBAI THE DEFINITION OF TOURISM Tourism is travel for recreational, leisure or business purposes. The World Tourism Organization defines tourists as people "traveling
Alberta Tourism Market Monitor
 Alberta Tourism Market Monitor + 8.4% (YYC & YEG only) +0.1% -4.8% (Banff, Jasper and Waterton Lakes only) AIR PASSENGERS (Arrivals and Departures) HIGHWAY COUNT NATIONAL PARKS ATTENDANCE -7.5% (Accommodation
Passenger Traffic Achieves Strong Growth of 4.8% for the Month of August
 Passenger Traffic Achieves Strong Growth of 4.8% for the Month of August Montréal, 7 October Passenger traffic experienced a slight surge in growth to almost +5% for August compared to previous months
Louisiana Travel Pulse May 2007
 Louisiana Travel Pulse May 2007 Produced by the Louisiana Office of Tourism Monthly Analysis/Highlights: Although nationwide airport activity was stagnant for the first quarter, New Orleans, Alexandria,
TOURISM PERFORMANCE 2017
 3 RD QUARTER TOURISM PERFORMANCE TOTAL STAYOVER ARRIVALS 91,732 TOTAL CRUISE ARRIVALS 99,919 TOTAL VISITOR NIGHTS AVERAGE HOTEL OCCUPANCY 862,376 76.3% ECONOMIC IMPACT $124.7 million HOW WAS OUR THIRD
Monthly Update - Aruba s Tourism Industry: August 2017 and 2017 YTD. MONTHLY UPDATE - ARUBA S TOURISM INDUSTRY August 2017 and Year to Date 2017.
 MONTHLY UPDATE - ARUBA S TOURISM INDUSTRY August 2017 and Year to Date 2017. Total stopovers fell by 5.7% in August. Summary Highlights. The total number of stopovers visiting Aruba fell by 5.7% in August
Loudon County, TN. Hotel, Restaurant, and Travel Industries: Economic Profile and Business Trends, Loudon County (Loudon and Lenoir City areas)
") Loudon County, TN Loudon County (Loudon and Lenoir City areas) Hotel, Restaurant, and Travel Industries: Economic Profile and Business Trends, Steve Morse, Ph.D. Director & Economist Tourism Institute
Loudon County, TN Loudon County (Loudon and Lenoir City areas) Hotel, Restaurant, and Travel Industries: Economic Profile and Business Trends, Steve Morse, Ph.D. Director & Economist Tourism Institute
Maury County, TN. Hotel, Restaurant, and Travel Industries: Economic Profile and Business Trends, Maury County (Columbia and Spring Hill area)
") Maury County, TN Maury County (Columbia and Spring Hill area) Hotel, Restaurant, and Travel Industries: Economic Profile and Business Trends, 06 Steve Morse, Ph.D. Director & Economist Tourism Institute
Maury County, TN Maury County (Columbia and Spring Hill area) Hotel, Restaurant, and Travel Industries: Economic Profile and Business Trends, 06 Steve Morse, Ph.D. Director & Economist Tourism Institute
MARRIOTT INTERNATIONAL, INC. PRESS RELEASE SCHEDULES QUARTER 4, 2016 TABLE OF CONTENTS
 PRESS RELEASE SCHEDULES QUARTER 4, 06 TABLE OF CONTENTS Consolidated Statements of Income - As Reported A- Consolidated Statements of Income - Fourth Quarter Adjusted 06 Compared to Combined 05 A-3 Consolidated
April 2012 Visitor Profile
 RESEARCH DATA SERVICES, INC. 777 SOUTH HARBOUR ISLAND BOULEVARD SUITE 260 TAMPA, FLORIDA 33602 TEL (813) 254-2975 FAX (813) 223-2986 Naples, Marco Island, Everglades Convention and Visitors Bureau April
Second Quarter 2014 Visitor Profile (April June) Amelia Island Tourist Development Council
 Amelia Island Tourist Development Council") RESEARCH DATA SERVICES, INC. 777 SOUTH HARBOUR ISLAND BOULEVARD SUITE 260 TAMPA, FLORIDA 33602 TEL (813) 254-2975 FAX (813) 223-2986 Second Quarter 2014 Visitor Profile (April June) Amelia Island Tourist
RESEARCH DATA SERVICES, INC. 777 SOUTH HARBOUR ISLAND BOULEVARD SUITE 260 TAMPA, FLORIDA 33602 TEL (813) 254-2975 FAX (813) 223-2986 Second Quarter 2014 Visitor Profile (April June) Amelia Island Tourist
SET Opportunity Day #3/2011
 SET Opportunity Day #3/2011 2Q11 & 1H11 Performance & Outlook 18 August 2011 The views expressed here contain some information derived from publicly available sources that have not been independently verified.
Third Quarter 2015 Visitor Profile (July-September) Amelia Island Tourist Development Council
 Amelia Island Tourist Development Council") RESEARCH DATA SERVICES, INC. 777 SOUTH HARBOUR ISLAND BOULEVARD SUITE 26 TAMPA, FLORIDA 3362 TEL (813) 254-2975 FAX (813) 223-2986 Third Quarter 215 Visitor Profile (July-September) Amelia Island Tourist
RESEARCH DATA SERVICES, INC. 777 SOUTH HARBOUR ISLAND BOULEVARD SUITE 26 TAMPA, FLORIDA 3362 TEL (813) 254-2975 FAX (813) 223-2986 Third Quarter 215 Visitor Profile (July-September) Amelia Island Tourist
STELLAR MARTINEAU PLACE LP
 INVESTOR UPDATE - JUNE 2016 Contents Executive Summary Page 3 Market Performance Page 5 Operational Performance Page 6 Hotel Profitability Page 8 Hotel Budget: 2016/17 Page 10 02 Executive Summary ASSET
Hotel InduSTRy Overview
 Hotel InduSTRy Overview Lindsay Culbreath, CMHS, CHIA Senior Director of Business Development & Marketing STR Tennessee Business Travel Association October 14, 2014 STR provides monthly, weekly and daily
Alberta Tourism Market Monitor
 Alberta Tourism Market Monitor + 7.2% (YYC & YEG only) +2.2% +6.6% (Banff, Jasper & Waterton only) AIR PASSENGERS (Arrivals and Departures) HIGHWAY COUNT NATIONAL PARKS ATTENDANCE October 2017 +1.0% (Accommodation
17 th Annual Lodging Industry Update Year End 2014
 17 th Annual Lodging Industry Update Year End 2014 Pinkowski & Company Metropolitan Memphis Hotel & Lodging Association HotelNewsNow.com STR February 13, 2015 Memphis, Tennessee 17 th Annual Lodging Industry
Second Quarter 2015 Visitor Profile (April-June) Amelia Island Tourist Development Council
 Amelia Island Tourist Development Council") RESEARCH DATA SERVICES, INC. 777 SOUTH HARBOUR ISLAND BOULEVARD SUITE 26 TAMPA, FLORIDA 3362 TEL (813) 254-2975 FAX (813) 223-2986 Second Quarter 215 Visitor Profile (April-June) Amelia Island Tourist
RESEARCH DATA SERVICES, INC. 777 SOUTH HARBOUR ISLAND BOULEVARD SUITE 26 TAMPA, FLORIDA 3362 TEL (813) 254-2975 FAX (813) 223-2986 Second Quarter 215 Visitor Profile (April-June) Amelia Island Tourist
Tampa Bay Area Lodging Investment Update: As Good As It Gets HCHMA Trends & Forecasting Forum
 Tampa Bay Area Lodging Investment Update: As Good As It Gets HCHMA Trends & Forecasting Forum Presented by Lou Plasencia July 26, 2018 PRESENTED BY Disclaimer We are presenting information today regarding
Alberta Tourism Market Monitor
 Alberta Tourism Market Monitor Federal Budget 2017 shows commitment to tourism industry The Federal budget announced in March contains encouraging news for the tourism industry. Starting in 2018-19, Parks
Hotel Market Overview
 STR Global Ltd is the exclusive owner of all rights to hotel related data in this presentation and its content. Reproduction of all or a portion of this presentation for any purpose without prior approval
COMPANY OVERVIEW Unique Ability to Manage Across All Chain Scales
 Aimbridge Hospitality, based in Dallas, is one of the largest independent management companies in the U.S. We currently manage approximately 500 hotels throughout the U.S. and Caribbean with more than
Hertfordshire Business Barometer July 2018
 Hertfordshire Business Barometer July 1 Contents Summary of findings 3 Marketing update 4 Visitor Attractions: monthly performance 6 Serviced Accommodation: monthly performance 10 Other news: national
Club Connections Quick Reference Point Chart For reservations with occupancy from 1 January December 2017
 Club Connections Quick Reference Point Chart For reservations with occupancy from 1 January 2017-31 December 2017 ASIA Beijing Marriott Hotel City Wall 475 Courtyard by Marriott Hong Kong Sha Tin 350 Hong
Hossana Solomon PhD; Henry H. Smith PhD University of the Virgin Islands (UVI)
") Effectiveness of Mandatory Law of Cistern Construction for Rainwater Harvesting on Supply and Demand of Public Water in U.S. Virgin Islands Hossana Solomon PhD; Henry H. Smith PhD University of the Virgin
Effectiveness of Mandatory Law of Cistern Construction for Rainwater Harvesting on Supply and Demand of Public Water in U.S. Virgin Islands Hossana Solomon PhD; Henry H. Smith PhD University of the Virgin
TOURISM PERFORMANCE 2017
 2 ND QUARTER TOURISM PERFORMANCE TOTAL STAYOVER ARRIVALS 92,228 TOTAL CRUISE ARRIVALS 105,504 TOTAL VISITOR NIGHTS AVERAGE HOTEL OCCUPANCY 798,080 61.7% ECONOMIC IMPACT $118.5 million HOW WAS OUR SECOND
September 2016 Visitor Profile
 RESEARCH DATA SERVICES, INC. 777 SOUTH HARBOUR ISLAND BOULEVARD SUITE 26 TAMPA, FLORIDA 3362 TEL (813) 254-2975 FAX (813) 223-2986 Visit St. Petersburg/Clearwater September 216 Visitor Profile Prepared
March 2011 Visitor Profile
 RESEARCH DATA SERVICES, INC. 777 SOUTH HARBOUR ISLAND BOULEVARD SUITE 260 TAMPA, FLORIDA 33602 TEL (813) 254-2975 FAX (813) 223-2986 Visit St. Petersburg/Clearwater March 2011 Visitor Profile Prepared
Alberta Tourism Market Monitor
 Alberta Tourism Market Monitor + 8.6% (YYC & YEG only) +2.9% -0.3% (Banff, Jasper and Waterton Lakes only) AIR PASSENGERS (Arrivals and Departures) February 2018 HIGHWAY COUNT January 2018 NATIONAL PARKS
Monthly Update - Aruba s Tourism Industry: October 2017 and 2017 YTD. MONTHLY UPDATE - ARUBA S TOURISM INDUSTRY October 2017 and Year to Date 2017.
 MONTHLY UPDATE - ARUBA S TOURISM INDUSTRY October 2017 and Year to Date 2017. Summary Highlights. Total stopovers grew by 6.5% in October. The total number of stopovers visiting Aruba grew by 6.5% in October
Sound Transit Operations January 2014 Service Performance Report. Ridership
 Ridership Total Boardings by Mode Mode Jan-13 Jan-14 % YTD-13 YTD-14 % ST Express 1,343,290 1,426,928 6.2% 1,343,290 1,426,928 6.2% Sounder 245,135 256,775 4.7% 245,135 256,775 4.7% Tacoma Link 86,229
FRANCHISE DISCLOSURE DOCUMENT. MARRIOTT INTERNATIONAL, INC. a Delaware corporation. MIF, L.L.C. a Delaware limited liability company
 FRANCHISE DISCLOSURE DOCUMENT MARRIOTT INTERNATIONAL, INC. a Delaware corporation MIF, L.L.C. a Delaware limited liability company 10400 Fernwood Road Bethesda, Maryland 20817 (301) 380-3000 www.marriott.com
March 2011 Visitor Profile
 RESEARCH DATA SERVICES, INC. 777 SOUTH HARBOUR ISLAND BOULEVARD SUITE 260 TAMPA, FLORIDA 33602 TEL (813) 254-2975 FAX (813) 254-2986 Naples, Marco Island, Everglades Convention and Visitors Bureau March
Tourism Snapshot. June 2015 Volume 11, Issue 6. A focus on the markets in which Destination Canada (DC) and its partners are active.
 and its partners are active.") Tourism Snapshot Tourism PEI / Paul Baglole A focus on the markets in which Destination Canada (DC) and its partners are active. www.destinationcanada.com June Volume 11, Issue 6 Key highlights Over the
Tourism Snapshot Tourism PEI / Paul Baglole A focus on the markets in which Destination Canada (DC) and its partners are active. www.destinationcanada.com June Volume 11, Issue 6 Key highlights Over the
April 2011 Visitor Profile
 RESEARCH DATA SERVICES, INC. 777 SOUTH HARBOUR ISLAND BOULEVARD SUITE 260 TAMPA, FLORIDA 33602 TEL (813) 254-2975 FAX (813) 223-2986 Visit St. Petersburg/Clearwater April 2011 Visitor Profile Prepared
MARRIOTT INTERNATIONAL 2017 SECURITY ANALYST MEETING. March 21, 2017
 MARRIOTT INTERNATIONAL 2017 SECURITY ANALYST MEETING March 21, 2017 FORWARD LOOKING STATEMENTS, NON GAAP FINANCIAL MEASURES, AND INFORMATION FOR 2016 AND 2015 This material contains forward looking statements
I T N E T R E N R A N T A I T ON O AL A L A R A R R I R VA V L A S L S A N A D N D D E D PA
 INTERNATIONAL ARRIVALS AND DEPARTURES July 2015 Government of Tonga SD18M-36 Statistical Bulletin Month of Change from Change from July 2015 Number previous month previous year All Arrivals 8,252-28.0
San Francisco Travel Association Selling in a Seller s Market DMO Perspective. May 21, 2014
 San Francisco Travel Association Selling in a Seller s Market DMO Perspective May 21, 2014 Agenda Discussion Themes 1. Meetings Are Important 2. Market Meetings Pace 3. Occupancy & Rate 4. Booking Windows
Scottsdale Tourism Study - Lodging Statistics
 Scottsdale Tourism Study - Lodging Statistics January 2018 Tourism and Events Department Scottsdale Lodging Statistics January 2018 Scottsdale City Council W.J. Jim Lane Mayor Linda Milhaven Kathy Littlefield
Annual Report Collier s Hospitality &Tourism Industry
 Annual Report - 2015 Collier s Hospitality &Tourism Industry Welcome to Our Celebration of the 33 rd National Travel & Tourism Week Thank You To Our Host Today Naples Bay Resort Please Welcome John Reilly,
Cheatham County, TN. Hotel, Restaurant, and Travel Industries: Economic Profile and Business Trends, 2006
 Cheatham County, TN Cheatham County (Kingston Springs & Ashland City areas) Hotel, Restaurant, and Travel Industries: Economic Profile and Business Trends, Steve Morse, Ph.D. Director & Economist Tourism
2017 Kansas Tourism Conference Hotel Industry Overview October 25, 2017
 2017 Kansas Tourism Conference Hotel Industry Overview October 25, 2017 Chris Klauda, Research Director cklauda@str.com 2017 STR, Inc. All Rights Reserved. Any reprint, use or republication of all or a
DECEMBER2014. InternationalVisitorArrivalstoBC. CanadianRe-entriestoBC. TravelPartiestoVisitorCentresbyRegion
 Research,Planning&Evaluation Page1 USTotal USOvernight Europe Asia/Pacific International Overnight - - - 4,453,346 245,014 286,729 444,425 727,196 703,547 574,646 442,525 286,160 269,439 237,541 236,124
Jan-18. Dec-17. Travel is expected to grow over the coming 6 months; at a slower rate
 Analysis provided by TRAVEL TRENDS INDEX DECEMBER 2018 CTI reading of 51.8 in December 2018 indicates that travel to or within the U.S. grew 3.6% in December 2018 compared to December 2017. LTI predicts
Fourth Quarter 2013 Visitor Profile (October December) Amelia Island Tourist Development Council
 Amelia Island Tourist Development Council") RESEARCH DATA SERVICES, INC. 777 SOUTH HARBOUR ISLAND BOULEVARD SUITE 260 TAMPA, FLORIDA 33602 TEL (813) 254-2975 FAX (813) 223-2986 Fourth Quarter 2013 Visitor Profile (October December) Amelia Island
RESEARCH DATA SERVICES, INC. 777 SOUTH HARBOUR ISLAND BOULEVARD SUITE 260 TAMPA, FLORIDA 33602 TEL (813) 254-2975 FAX (813) 223-2986 Fourth Quarter 2013 Visitor Profile (October December) Amelia Island
FRANCHISE DISCLOSURE DOCUMENT. MARRIOTT INTERNATIONAL, INC. a Delaware corporation. MIF, L.L.C. a Delaware limited liability company
 FRANCHISE DISCLOSURE DOCUMENT MARRIOTT INTERNATIONAL, INC. a Delaware corporation MIF, L.L.C. a Delaware limited liability company 10400 Fernwood Road Bethesda, Maryland 20817 (301) 380-3000 www.marriott.com
First Quarter 2014 Visitor Profile (January March) Amelia Island Tourist Development Council
 Amelia Island Tourist Development Council") RESEARCH DATA SERVICES, INC. 777 SOUTH HARBOUR ISLAND BOULEVARD SUITE 260 TAMPA, FLORIDA 33602 TEL (813) 254-2975 FAX (813) 223-2986 First Quarter 2014 Visitor Profile (January March) Amelia Island Tourist
RESEARCH DATA SERVICES, INC. 777 SOUTH HARBOUR ISLAND BOULEVARD SUITE 260 TAMPA, FLORIDA 33602 TEL (813) 254-2975 FAX (813) 223-2986 First Quarter 2014 Visitor Profile (January March) Amelia Island Tourist
October Air Traffic Statistics. Prepared by the Office of Corporate Risk and Strategy
 October 214 Air Traffic Statistics Prepared by the Office of Corporate Risk and Strategy Metropolitan Washington Airports Authority Air Traffic Statistics Table of Contents Summary Air Traffic Summary...
Oct-17 Nov-17. Travel is expected to grow over the coming 6 months; at a slower rate
 Analysis provided by TRAVEL TRENDS INDEX OCTOBER 2018 CTI reading of 51.6 in October 2018 indicates that travel to or within the U.S. grew 3.2% in October 2018 compared to October 2017. LTI predicts travel
Tourism Snapshot A Monthly Monitor of the Performance of Canada s Tourism Industry
 Tourism Snapshot A Monthly Monitor of the Performance of Canada s Tourism Industry February 2017 Volume 13, Issue 2 www.destinationcanada.com Tourism Snapshot February 2017 1 KEY HIGHLIGHTS Canada welcomed
Coast to coast. STR Coastal Town Review Coastal Towns Market Review Report_JE.indd 3
 Coast to coast. STR Coastal Town Review 16 Coastal Towns Market Review Report_JE.indd 3 4//17 8:31:38 AM Table of Contents Introduction...3 United Kingdom...4 Blackpool...6 Bournemouth...8 Brighton...
Securing Tourism s Place at the Local Economic Development Table. Steve Morse, Ph.D. Director & Economist Tourism Institute Sept.
 Securing Tourism s Place at the Local Economic Development Table Steve Morse, Ph.D. Director & Economist Tourism Institute Sept. 20, 2007 1 First, Welcome to Tourism professionals from Tennessee Faculty
Loudoun County Lodging Study
 Loudoun County Lodging Study Prepared for: Visit Loudoun Study Conducted: February - May, 2015 Report Submitted: June, 2015 YSI Lodging Research Methodology Young Strategies, Inc. (YSI) conducted a survey
Hertfordshire Business Barometer April 2018
 Hertfordshire Business Barometer April 1 Contents Summary of findings 3 Marketing update 4 Visitor Attractions: monthly performance 6 Serviced Accommodation: monthly performance 10 Other news: national