FACTS & FIGURES THE PORTS OF BREMEN AND BREMERHAVEN. The Senator for Economic Affairs, Labour and Ports. Free Hanseatic City of Bremen
|
|
|
- James Blankenship
- 5 years ago
- Views:
Transcription

1 FACTS & FIGURES THE PORTS OF BREMEN AND BREMERHAVEN The Senator for Economic Affairs, Labour and Ports Free Hanseatic City of Bremen 1

2 xxx FACTS & FIGURES 2017 INQUIRIES AND SUGGESTIONS ABOUT THE LATEST STATISTICS FRAGEN UND ANREGUNGEN ZU AKTUELLEN STATISTIKEN The figures for the ports of Bremen are published by the Senator for Economic Affairs, Labour and Ports, in this case the Department of Port Economy, Infrastructure, Shipping. bremenports GmbH & Co. KG is responsible for port infrastructure The contact data is stated on the back cover of this publication. Der Senator für Wirtschaft, Arbeit und Häfen Zweite Schlachtpforte Bremen Martina Ferreira Referat 31 - Hafenwirtschaft und -infrastruktur, Schifffahrt Tel.: +49 (0) Fax: +49 (0) Martina.Ferreira@WAH. bremen.de Dr. Iven Krämer Referatsleiter - Hafenwirtschaft und -infrastruktur, Schifffahrt Tel.: +49 (0) Fax: +49 (0) Iven.Kraemer@WAH. bremen.de Jörg Lattner Referat 31 - Hafenwirtschaft und -infrastruktur, Schifffahrt Tel.: +49 (0) Fax: +49 (0) Joerg.Lattner@WAH.bremen.de THE PORTS OF BREMEN AND BREMERHAVEN IN FACTS AND FIGURES 2
3 FACTS & FIGURES 2017 Introduction DEAR READERS OF THE FACTS & FUGURES 2017 How many seagoing vessels called at the ports in 2017? How has container throughput developed over the past five years? What types of cargo are handled at Bremen s ports which consistsing of the port group Bremen and Bremerhaven? The annual Facts & Figures brochure provides details of the seagoing vessels and seaborne freight handled at the ports. The following pages contain tables and charts of the latest traffic and throughput figures from Bremen and Bremerhaven. CONTENT Shipping and Freight Traffic 6 Container Throughput 20 Automobile Throughput 28 Cruise Shipping 32 Inland Barges 36 Container Hinterland Traffic 40 Vessels Draughts 43 Port Statistics 46 3

4 xxx FACTS & FIGURES 2017 TRAFFIC VOLUMES BREMEN /BREMERHAVEN It is not only the roads in the ports of Bremen that have to cope with immense traffic volumes; there is also heavy traffic on the water and on rail. SHIPPING AND FREIGHT TRAFFIC IN BREMEN AND BREMERHAVEN 4

5 FACTS & FIGURES 2017 xxx 5


6 Shipping and Freight Traffic FACTS & FIGURES 2017 SEAGOING VESSELS IN BREMEN AND BREMERHAVEN 2017 according to number of port calls and gross tonnage inbound Type of vessel No. of calls in 1,000 GT* Container vessels 3, ,091 General cargo vessels 1,518 13,767 Ro-ro / Car carriers 1,496 73,812 Tankers 535 2,027 Other 423 3,272 Bulk carriers 344 7,470 Passenger vessels 110 4,481 Total 7, ,921 6


7 BREAKDOWN TYPES OF VESSEL according to GT* in % *GT = gross tonnage, unit of measurement for the volume of a vessel. 7

8 SEAGOING VESSELS IN BREMEN AND BREMERHAVEN according to number of port calls and gross tonnage inbound Period Bremen Number 1,440 1,376 1,362 1,398 in 1,000 GT 13,304 12,785 12,375 12,845 Average size of vessel in GT 9,239 9,291 9,086 9,188 Bremerhaven Number 6,735 6,505 6,525 6,285 in 1,000 GT 214, , , ,076 Average size of vessel in GT 31,794 33,332 35,118 37,880 Ports of Bremen and Bremerhaven Number 8,175 7,881 7,887 7,683 in 1,000 GT 227, , , ,921 Average size of vessel in GT 27,821 29,135 30,622 32,659 8
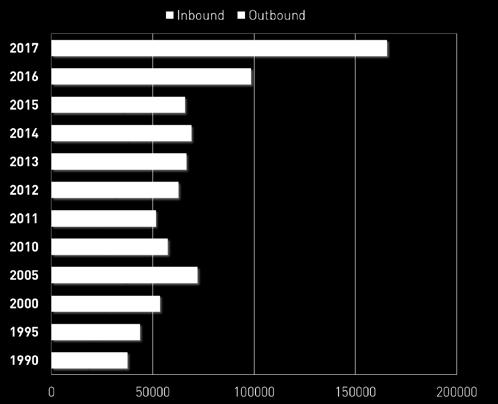
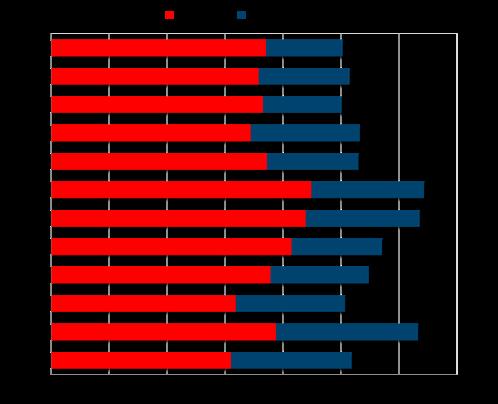
9 FACTS & FIGURES 2017 Shipping and Freight Traffic SEABORNE FREIGHT THROUGHPUT IN BREMEN AND BREMERHAVEN in 1,000 tonnes Ports of Bremen and Bremerhaven INBOUND OUTBOUND TOTAL Year Bulk Cargo General Cargo Total Bulk Cargo General Cargo Total Bulk Cargo General Cargo Total ,327 2,758 7,085 1,771 3,167 4,937 6,098 5,924 12, ,110 3,806 8,917 1,746 4,475 6,221 6,857 8,281 15, ,616 5,009 11,626 1,539 4,330 5,868 8,155 9,339 17, ,152 5,815 15,967 1,497 5,920 7,417 11,649 11,735 23, ,573 5,395 13, ,071 8,025 9,527 12,466 21, ,440 7,417 16, ,235 10,104 10,309 16,652 26, ,101 7,012 17,113 1,311 11,403 12,714 11,412 18,415 29, ,555 9,292 18,847 1,184 10,173 11,358 10,739 19,465 30, ,499 9,570 19, ,034 12,001 10,467 20,604 31, ,036 15,651 25, ,180 19,082 10,939 33,831 44, ,193 19,977 28, ,492 26,021 8,721 45,469 54, ,605 26,683 35, ,999 33,573 9,179 59,682 68, ,617 32,580 41, ,013 39,429 9,033 71,594 80, ,463 32,701 42, ,562 41,864 9,765 74,263 84, ,636 30,411 39, ,354 39,687 8,970 69,764 78, ,783 29,916 38, ,949 39,537 9,372 68,864 78, ,014 28,044 37, ,934 36,352 9,432 63,978 73, ,334 28,930 38, ,605 36,907 9,636 65,535 75, ,970 28,135 37, ,558 37,078 9,490 64,693 74,183 9
10 Shipping and Freight Traffic FACTS & FIGURES 2017 SEABORNE FREIGHT THROUGHPUT IN BREMEN AND BREMERHAVEN in 1,000 tonnes Bremen INBOUND OUTBOUND TOTAL Year Bulk Cargo General Cargo Total Bulk Cargo General Cargo Total Bulk Cargo General Cargo Total ,012 2,115 6,127 1,755 2,885 4,640 5,767 5,000 10, ,741 3,277 8,018 1,653 3,724 5,377 6,394 7,001 13, ,405 3,962 7,367 1,495 3,793 5,288 4,900 7,755 12, ,171 4,525 9,696 1,454 4,514 5,968 6,625 9,040 15, ,961 3,017 7, ,966 5,887 5,882 7,983 13, ,256 3,606 8, ,510 6,362 6,108 9,116 15, ,328 3,206 8,534 1,283 5,837 7,119 6,610 9,043 15, ,061 3,621 8,681 1,175 3,857 5,032 6,236 7,477 13, ,006 2,131 11, ,220 3,160 9,947 4,351 14, ,682 1,668 11, ,265 3,101 10,519 3,932 14, ,602 1,252 8, ,671 4,163 8,094 4,923 13, ,349 1,437 9, ,847 3,408 8,910 4,284 13, ,281 1,615 9, ,658 3,057 8,680 4,273 12, ,124 1,043 10, ,146 3,447 9,424 4,189 13, ,323 1,084 9, ,849 3,177 8,651 3,933 12, ,345 1,085 9, ,830 3,406 8,920 3,915 12, ,571 1,410 9, ,361 2,761 8,971 3,771 12, ,792 1,070 9, ,060 2,329 9,061 3,130 12, ,489 1,671 10, ,659 3,113 8,943 4,330 13,273 10
11 FACTS & FIGURES 2017 Shipping and Freight Traffic SEABORNE FREIGHT THROUGHPUT IN BREMEN AND BREMERHAVEN in 1,000 tonnes Bremerhaven INBOUND OUTBOUND TOTAL Year Bulk Cargo General Cargo Total Bulk Cargo General Cargo Total Bulk Cargo General Cargo Total , ,280 1, ,211 1,048 4, ,255 1,584 4, ,981 1,290 6, ,406 1,449 5,024 2,695 7, ,612 2,378 5, ,105 2,138 3,645 4,483 8, ,184 3,811 7, ,725 3,742 4,201 7,536 11, ,773 3,805 8, ,566 5,595 4,802 9,372 14, ,494 5,671 10, ,317 6,326 4,503 11,988 16, ,439 7, ,814 8, ,253 16, ,984 14, ,915 15, ,899 30, ,725 19, ,821 21, ,546 41, ,246 25, ,152 30, ,398 55, ,966 31, ,355 36, ,321 67, ,658 31, ,416 38, ,073 70, ,327 29, ,505 36, ,831 66, ,831 29, ,118 36, ,949 65, ,634 27, ,573 33, ,207 60, ,860 28, ,545 34, ,405 62, ,464 26, ,899 33, ,363 60,910 11
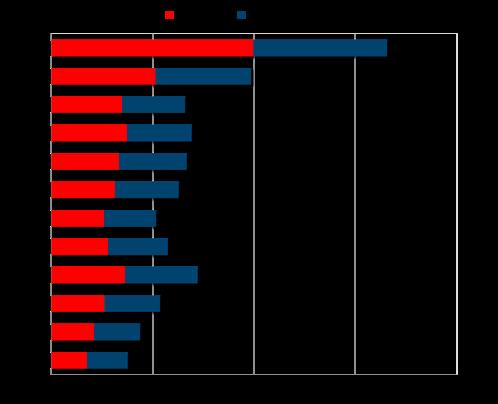
12 Shipping and Freight Traffic FACTS & FIGURES 2017 SEABORNE FREIGHT THROUGHPUT IN BREMEN AND BREMERHAVEN 2017 selected countries in 1,000 tonnes Inbound No Country Total of which Bulk Cargo General Cargo No Country Total of which Bulk Cargo General Cargo containerised containerised 1 USA 4, ,027 3, Spain China 4, ,203 4, Brazil Norway 3,588 2, Netherland Russia 2,538 1,186 1,352 1, Turkey Sweden 2, ,768 1, Mexico Finland 2, ,394 1, Liberia France 1,939 1, Lithunia Indonesia 1, ,516 1, South Africa Poland 1, ,438 1, Panama Germany 1, Sri Lanka Canada 1, Oman Belgium Latvia Korea Rep India Denmark Estonia United Kingdom Egypt
13 HAFENSPIEGEL 2017 Schiffs- und Güterverkehr SEABORNE FREIGHT THROUGHPUT IN BREMEN AND BREMERHAVEN 2017 selected countries in 1,000 tonnes Outbound No Country Total of which Bulk Cargo General Cargo No Country Total of which Bulk Cargo General Cargo containerised containerised 1 USA 7, ,659 6, Indonesia China 3, ,045 2, Korea Rep Russia 1, ,767 1, Italy Mexico 1, ,577 1, Litunia Belgiun 1, , United Arab. Emirates United Kingdom 1, , Brazil Norway 1, ,213 1, Denmark Singapore 1, ,214 1, Marocco Poland 1, ,118 1, Oman Sweden 1, , Netherland Turkey Israel Canada Germany South Afrika India Spain Estonia Finland Latvia
14 xxx FACTS & FIGURES 2017 SEABORNE FREIGHT THROUGHPUT IN BREMEN AND BREMERHAVEN 2017 selected trading areas in 1,000 tonnes Inbound Outbound Total Europe 20,680 14,843 35,523 Federal Republic of Germany 1, ,664 Schleswig-Holstein Hamburg Saxony Mecklenburg - Western Pomerania Other Europe 19,407 14,452 33,859 Finland 2, ,017 Sweden 2,396 1,026 3,422 Norway 3,588 1,218 4,806 Denmark ,293 United Kingdom 739 1,259 1,998 Iceland Ireland Netherland ,005 Belgium 831 1,259 2,090 France 1, ,181 Portugal Spain ,419 Italy Greece Turky ,506 Poland 1,446 1,118 2,564 CIS/Baltic States 3,389 3,328 6,717 14
15 Empfang Versand Gesamt Africa 1,285 1,862 3,147 North Africa, Mediterranean North Africa, Atlantic West Africa South Africa ,269 East Africa Africa, Gulf of Aden, Red Sea America 7,196 11,551 18,747 North America, Atlantic 4,403 6,828 11,231 Gulf of Mexico, Caribbean 1,699 3,384 5,083 South America, Atlantic ,366 North America, Pacific Central America, Pacific South America, Pacific Asia 7,888 8,421 16,309 Near East, Mediterranean Arabia, Persian Gulf 532 1,403 1,935 Middle East ,176 Far East 6, ,621 Australia, Oceania Non-included countries Total 37,105* 37,078* 74,183* * deviations result from rounding figures on page 6 15


16 Shipping and Freight Traffic FACTS & FIGURES 2017 SEABORNE FREIGHT THROUGHPUT IN BREMEN AND BREMERHAVEN 2017 selected commodities (non-containerised) in 1,000 tonnes Commodities Agriculture, forestry and fishing products Coal, crude oil, natural gas Ores, non-metallic minerals Food, beverages and tobacco Textiles, clothing, leather goods Wood, cork, paper, board, printed products Coke, refined petroleum products Chemical products Other mineral products Metals, metal products, semi-finished products Machinery and equipment Vehicles Furniture, other manufactured goods Secondary raw materials, waste Transport equipment and material Other transport equipment Groupage consignments Total 16
17 Inbound Outbound ,377 1,414 1,175 1,084 5,482 5,496 6,060 5, ,424 1,621 1,655 1, ,055 1, ,870 11,132 11,726 11,894 31, ,699 1,347 1,467 1, ,130 3,101 2,553 3, ,666 7,208 6,575 5,611 31,190 17

18 xxx FACTS & FIGURES 2017 REVOLUTION IN GLOBAL WORLD TRADE HUB FOR THE GLOBAL FLOW OF GOODS As the fourth-largest container hub in Europe, the terminal now has a total of 14 berths for mega container vessels. CONTAINER THROUGHPUT IN BREMEN AND BREMERHAVEN 18

19 FACTS & FIGURES 2017 xxx 19
20 Container Throughput FACTS & FIGURES 2017 SEABORNE CONTAINER TRAFFIC IN BREMEN AND BREMERHAVEN Inbound and Outbound (x1,000) Inbound Containers 803 1,062 1,385 1,646 1,545 1,550 1,501 TEU* 1,340 1,799 2,332 2,770 2,595 2,648 2,581 Weight in tonnes 12,850 17,257 24,206 27,582 25,331 26,370 24,661 Outbound Containers 850 1,152 1,519 1,791 1,718 1,694 1,710 TEU* 1,412 1,945 2,544 3,007 2,883 2,887 2,928 Weight in tonnes 14,872 20,078 27,735 32,335 29,776 31,296 30,306 Total Containers 1,653 2,214 2,905 3,437 3,263 3,244 3,212 TEU* 2,752 3,744 4,876 5,777 5,479 5,535 5,509 Weight in tonnes 27,722 37,335 51,934 59,917 55,107 57,666 54,967 * 20-foot ISO container 20

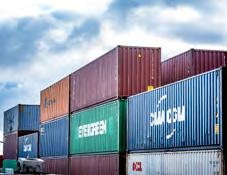
21 in 1,000 TEU 21
22 xxx HAFENSPIEGEL 2017 SEABORNE CONTAINER TRAFFIC IN BREMEN AND BREMERHAVEN Bremen/Bremerhaven (in total) of which Bremerhaven No. of containers in 1,000 TEU in 1,000 t* No. of containers in 1,000 TEU in 1,000 t* , , , , , , , ,198 11, ,029 9, ,518 15, ,451 14, ,653 2,752 27,722 1,633 2,721 27, ,214 3,744 37,335 2,189 3,699 36, ,644 4,444 44,804 2,629 4,420 44, ,916 4,892 48,730 2,902 4,868 48, ,244 5,448 54,933 3,225 5,416 54, ,739 4,579 48,818 2,723 4,552 48, ,905 4,876 51,934 2,894 4,859 51, ,558 5,925 62,767 3,550 5,912 62, ,662 6,134 65,141 3,648 6,112 65, ,467 5,838 60,918 3,456 5,822 60, ,437 5,777 59,917 3,425 5,758 59, ,263 5,479 55,107 3,255 5,464 55, ,244 5,535 57,666 3,240 5,530 57, ,212 5,509 54,967 3,205 5,497 54,900 22
23 Land N Land No 1 USA , Germany China Turkey Russia Brazil Poland Litunia Mexico Spain Indonesia Belgium Sweden India Finland Oman selected countries in 1,000 TEU 9 Canada Panama Norway Marocco Korea Rep United Arab. Emirates United Kingdom Netherland Denmark Latvia South Africa Israel Singapore Sri Lanka

24 SEABORNE CONTAINER TRAFFIC IN BREMEN AND BREMERHAVEN selected trading areas in 1,000 TEU Europe 1,057 1,551 1,771 2,341 2,273 2,200 1,992 Scandinavia United Kingdom/Ireland Netherland/Belgium Portugal/Spain CIS/Baltic States Africa North Africa, Mediterranean North Africa, Atlantic West Africa South Africa East Africa

25 FACTS & FIGURES 2017 Container Throughput America 935 1,178 1,430 1,547 1,509 1,658 1,821 North Amerika, Atlantic ,206 Gulf of Mexico, Caribbean of which US Gulf South America, Atlantic North America, Pacific Central America, Pacific South America, Pacific Asia ,410 1,661 1,484 1,487 1,502 Near East, Mediterranean Arabia, Persian Gulf Middle East Far East ,065 1,236 1,091 1,142 1,193 of which Japan Australia, Oceania Non-included countries Total 2,752 3,744 4,876 5,777 5,478 5,537 5,510 25

26 xxx FACTS & FIGURES 2017 EUROPE S SECOND-LARGEST TERMINAL FOR AUTOMOBILE TRANSHIPMENT FIRST-CLASS AUTOMOBILE TERMINAL With a throughput of more than two million vehicles per annum, the ports of Bremen are firmly established as one of the largest automobile hubs in the world. AUTOMOBILE THROUGHPUT IN BREMEN AND BREMERHAVEN 26

27 FACTS & FIGURES 2017 xxx 27


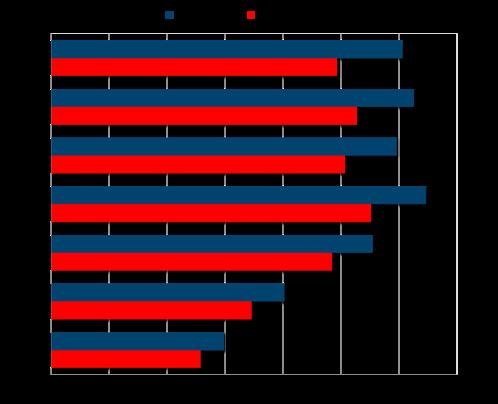
28 Automobile Throughput FACTS & FIGURES 2017 SEABORNE AUTOMOBILE TRAFFIC IN BREMEN AND BREMERHAVEN Number of vehicles Inbound Outbound Total , , , , , , , ,173 1,099, ,806 1,034,000 1,645, ,830 1,227,613 1,631, ,928 1,573,971 2,127, ,650 1,690,343 2,181, ,702 1,752,018 2,178, ,682 1,783,830 2,269, ,587 1,688,351 2,254, ,530 1,458,408 2,067, ,103 1,628,792 2,303,895 28

29 29

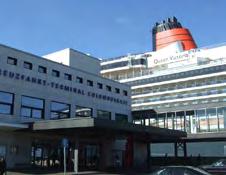
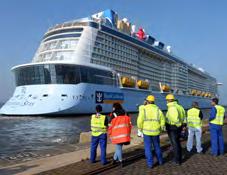
30 xxx FACTS & FIGURES 2017 THE BREMERHAVEN CRUISE TERMINAL TRAVELLING AROUND THE WORLD Columbus Cruise Center Bremerhaven (CCCB) is one of the most modern passenger terminals in the world. Located at Columbuskaje, the terminal was refurbished in 2003 and the investments in modern handling facilities for cruise liners and tourists have proved well worthwhile, as this sector appears set for continuous growth. CRUISE SHIPPING IN BREMERHAVEN 30

31 FACTS & FIGURES 2017 xxx 31


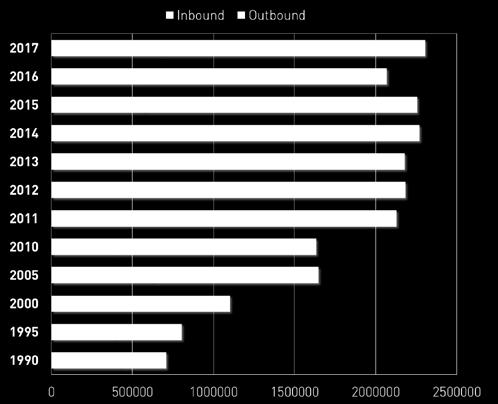
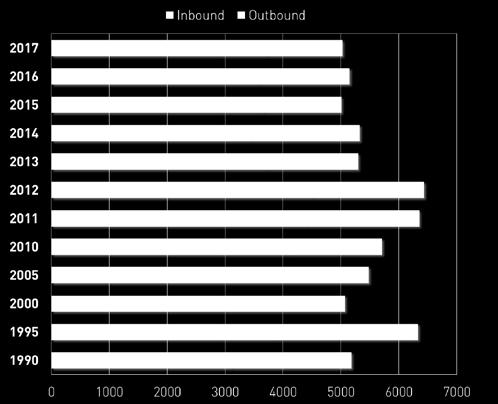
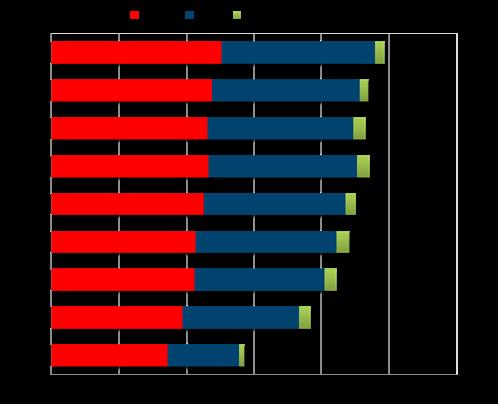
32 Cruise Shipping FACTS & FIGURES 2017 CRUISE SHIPPING IN BREMERHAVEN Number of passengers and ships Einkommende Ausgehende Gesamt Passengers* Ships Passengers* Ships Passengers* , , , , , , , , , , , , , , , , , , , , , , , , , , , , , , , , , , , , * inclusive of transit passengers
33 Number of pasengers* 33

34 xxx FACTS & FIGURES 2017 FIRST CLASS LOCATION INLAND BARGES Bremen is not only a traditional port for seagoing vessels, but is also a wellestablished port of call for barges. Many people are not aware that in addition to their role as the second-largest German seaport, Bremen and Bremerhaven are also Germany s seventh-largest inland shipping port INLAND BARGES IN BREMEN AND BREMERHAVEN 34

35 FACTS & FIGURES 2017 xxx 35

36 INLAND BARGES IN BREMEN AND BREMERHAVEN Number of vessels and in 1,000 tonnes Bremen 2010* Number of vessels Inbound Outbound Total Bremerhaven 2010* Number of vessels Inbound Outbound Total Ports of Bremen and Bremerhaven Number of vessels Inbound Outbound Total * Change in the federal government data collection method: as from 2010, movements inside the port areas of Bremen and Bremerhaven are no longer counted. 36


37 FACTS & FIGURES 2017 Inland Barges 37

38 xxx FACTS & FIGURES 2017 A HEART FOR THE RAILWAY BREMERHAVEN RAIL PORTS More than one million containers (TEU) are carried annually by rail on hinterland routes. Because of their traditional links with the railway, the ports of Bremen have well developed rail infrastructure and the terminal railway meanwhile covers a total length of 187 km. CONTAINER HINTERLAND TRAFFIC TO AND FROM BREMERHAVEN 38

39 FACTS & FIGURES 2017 xxx 39

40 MODAL SPLIT IN CONTAINER HINTERLAND TRAFFIC WITH BREMERHAVEN in 1,000 TEU and as a percentage of hinterland traffic Container throughput 3,699 4,859 5,912 6,112 5,822 5,758 5,464 5,530 5,497 of which transshipment 2,274 2,941 3,804 3,909 3,569 3,404 3,140 3,185 3,032 of which hinterland 1,425 1,918 2,108 2,203 2,253 2,354 2,324 2,345 2,465 of which road ,057 1,066 1,126 1,161 1,156 1,189 1,261 of which rail ,042 1,049 1,101 1,078 1,093 1,134 of which inland waterway Modal Split in % of which transshipment of which hinterland of which road of which rail of which inland waterway


41 FACTS & FIGURES 2017 Container Hinterland Traffic 41

42 xxx FACTS & FIGURES 2017 MAINTAINING THE WATER DEPTHS ALWAYS ABLE TO COPE WITH HUGE VESSELS Although the number of port calls is declining, the ships themselves grow larger and larger. In the last four years alone, vessel size increased by a total of 30 %. The ports have to have sufficient water depths to cope with this global trend. VESSELS DRAUGHT IN BREMEN AND BREMERHAVEN 42


43 FACTS & FIGURES 2017 Vessels Draughts VESSELS DRAUGHTS IN BREMEN AND BREMERHAVEN Arrival Bremen Draught = 6.60 m = 7.60 till 6.60 m = 8.60 till 7.60 m = 9.60 till 8.60 m =10.35 till 9.60 m m Bremerhaven Draught = m 5,548 5,493 5,575 5,671 5,426 =12.50 till m 1,065 1, =13.50 till m m

44 xxx FACTS & FIGURES 2017 WORLD PORT IN GOOD HANDS THE PORT MANAGEMENT COMPANY BREMENPORTS bremenports is actively involved in every area where the ports have to operate reliably. Round the clock, 24 hours a day, 365 days a year. PORT STATISTICS IN BREMEN AND BREMERHAVEN 44

45 FACTS & FIGURES 2017 xxx 45
46 Port Statistics FACTS & FIGURES 2017 INFRASTRUCTURE IN BREMEN AND BREMERHAVEN in kilometre Total of which Bremen of which Bremerhaven Bank structures of which quays embankments Dykes and flood barriers Roads Port railway and industrial main lines Source: Kennzahlenbericht (Stand: ), bremenports GmbH & Co. KG, Data based only on the sites and infrastructure facilities allocated to bremenports GmbH & Co. KG in buildings Total of which Bremen of which Bremerhaven Locks Movable bridges Pump stations Pontoon Dolphins Berth for seagoing vessels of which for mega vessels Source: Kennzahlenbericht (Stand: ), bremenports GmbH & Co. KG, Data based only on the sites and infrastructure facilities allocated to bremenports GmbH & Co. KG 46

, bremenports GmbH & Co. KG, 2018 Angaben beziehen sich ausschließlich auf die der bremenports GmbH & Co.")
47 FACTS & FIGURES 2017 Port Statistics SITE USE IN BREMEN AND BREMERHAVEN in hectares Total of which Bremen of which Bremerhaven Sites with port-related usen 3, ,164 of which land sites 2, ,848 of which trade and industry road traffic rail green spaces and agriculture substitute and reserve sites 1, ,053 other of which water sites Quelle: Kennzahlenbericht (Stand: ), bremenports GmbH & Co. KG, 2018 Angaben beziehen sich ausschließlich auf die der bremenports GmbH & Co. KG zugewiesenen Flächen 47
48 Port Statistics FACTS & FIGURES 2017 NAUTICAL CONDITIONS IN BREMEN AND BREMERHAVEN Bremen Bremerhaven Draughts 1 non-tidal [m] (Panamax) Bottom of deepest berth (Post-Panamax) tidal [m] inbound: outbound: in the Weser [SKN(LAT)] behind the locks [MHWL] Distance to open sea [km] Data from traffic control centres of Bremen and Bremerhaven Water and Shipping Authorities. 2 Mean harbour water level 3 Distance between Weser approach-entrance Oslebshausen Lock 4 Distance between Weser approach-container Terminal Bremerhaven WATER LEVELS IN BREMEN AND BREMERHAVEN Bremen Bremerhaven Mean high tide, MHT (LAT) Mean low tide, MLT (LAT) Mean tidal range, MTR [m] year mean 2013/2017 based on level at Bremen Oslebshausen (CD (LAT = NHN -2.10m)) and Bremerhaven Alter Leuchtturm (CD (LAT = MSL -2.62m)), Source: Water and Shipping Authority Bremerhaven,
 Percentage of port-related jobs in total no.")

49 FACTS & FIGURES 2017 Port Statistics EFFECTS ON EMPLOYMENT IN AND AROUND THE FEDERAL LAND OF BREMEN No. of port-related jobs (Reference year 2015) Percentage of port-related jobs in total no. of jobs (Reference year 2015) Federal Land of Bremen Bremen, Hamburg and Lower Saxony 77, , % 9.8 % Source: Beschäftigungseffekte der bremischen Häfen für das Jahr 2015, Institute of Shipping Economics and Logistics, Bremen,
50 IMPRINT Publisher The Senator for Economic Affairs, Labour and Ports Zweite Schlachtpforte Bremen and bremenports GmbH & Co. KG Am Strom Bremerhaven Photographs/Design bremenports GmbH & Co. KG Sources CONTACTS Facts and Figures Martina Ferreira Tel.: +49 (0) Fax: +49 (0) Martina.Ferreira@WAH.bremen.de Jörg Lattner Tel.: +49 (0) Fax: +49 (0) Joerg.Lattner@WAH.bremen.de Port Statistics Jan Janssen Tel.: +49 (0) Jan.Janssen@bremenports.de Bremen Statistical Office Terminal operators in Bremen/Bremerhaven Data based on ships reporting HBH bremenports GmbH & Co. KG Stand Bremen, May 2018 The Senator for Economic Affairs, Labour and Ports Free Hanseatic City of Bremen 50
ONLINE UNTER W W W.BREMENPORTS.DE/STATISTIKEN FACTS & FIGURES THE PORTS OF BREMEN BREMEN/BREMERHAVEN 2016
 ONLINE UNTER W W W.BREMENPORTS.DE/STATISTIKEN 1 FACTS & FIGURES THE PORTS OF BREMEN BREMEN/BREMERHAVEN 216 FACTS & FIGURES 216 3 13 18 2 22 25 29 FACTS & FIGURES ABOUT THE PORTS OF BREMEN/BREMERHAVEN 216
Online unter
 Online unter www.bremenports.de/statistiken 1 FACTS & FIGURES THE PORTS OF BREMEN The Senator for Economic Affairs, Labour and Ports Free Hanseatic City of Bremen Bremen/Bremerhaven 2012 Design and layout:
IUMI 2005 Amsterdam Facts & Figures Committee
 Report on Marine Insurance Premium 23 and 24 IUMI 25 Amsterdam Facts & Figures Committee Tore Forsmo, Managing Director Astrid Seltmann, Analyst The Central Union of Marine Underwriters, Oslo, Norway Thanks
FINLAND. Table 1. FDI flows in the host economy, by geographical origin. (Millions of US dollars)
") Table 1. FDI flows in the host economy, by geographical origin World 3 732 8 046 3 319 2 823 4 750 7 652 12 451-1 144 718 7 359 2 550 4 158 Developed economies 3 638 8 003 2 382 2 863 4 934 7 258 12 450-855
Table 1. FDI flows in the host economy, by geographical origin World 3 732 8 046 3 319 2 823 4 750 7 652 12 451-1 144 718 7 359 2 550 4 158 Developed economies 3 638 8 003 2 382 2 863 4 934 7 258 12 450-855
SLOVAKIA. Table 1. FDI flows in the host economy, by geographical origin. (Millions of US dollars)
") Table 1. FDI flows in the host economy, by geographical origin World 1 271 4 095 1 060 1 058 714 4 693 3 267 4 692-6 1 769 3 491 2 825 Developed economies 1 204 4 050 1 036 1 113 485 4 265 1 001 5 084-881
Table 1. FDI flows in the host economy, by geographical origin World 1 271 4 095 1 060 1 058 714 4 693 3 267 4 692-6 1 769 3 491 2 825 Developed economies 1 204 4 050 1 036 1 113 485 4 265 1 001 5 084-881
KINGDOM OF CAMBODIA NATION RELIGION KING 3
 KINGDOM OF CAMBODIA NATION RELIGION KING 3 TOURISM STATISTICS REPORT March 2014 MINISTRY OF TOURISM Statistics and Tourism Information Department No. A3, Street 169, Sangkat Veal Vong, Khan 7 Makara, Phnom
KINGDOM OF CAMBODIA NATION RELIGION KING 3
 KINGDOM OF CAMBODIA NATION RELIGION KING 3 TOURISM STATISTICS REPORT June 2014 MINISTRY OF TOURISM Statistics and Tourism Information Department No. A3, Street 169, Sangkat Veal Vong, Khan 7 Makara, Phnom
IMD World Talent Report Factor 1 : Investment and Development
 THAILAND 2012 2013 2014 2015 2016 Overall Investment & Development Appeal Rank 2016 37 42 24 Readiness 49 of 61 Factor 1 : Investment and Development Total Public Expenditure on Education Percentage of
KINGDOM OF CAMBODIA NATION RELIGION KING 3
 KINGDOM OF CAMBODIA NATION RELIGION KING 3 TOURISM STATISTICS REPORT September 2014 MINISTRY OF TOURISM Statistics and Tourism Information Department No. A3, Street 169, Sangkat Veal Vong, Khan 7 Makara,
1.0 Introduction Zambia s Major Trading Partners Zambia s Major Export Markets... 4
 Bank of Zambia CONTENTS 1.0 Introduction... 3 2.0 Zambia s Major Trading Partners... 3 3.0 Zambia s Major Export Markets... 4 4.0 Major Source Countries Of Zambia s Imports... 5 5.0 Direction Of Trade
Sprint Real Solutions Switched Data Service International Rates from the U.S. Mainland, Hawaii, Puerto Rico, and the U.S.
 1* The international rates below apply to calls from the U.S. Mainland, Hawaii, Puerto Rico, and the U.S. Virgin Islands. The usage rates below reflex the discount found in Section 6.4 of Schedule No.
Sprint Real Solutions Option A SDS International Outbound Rates from the U.S. Mainland, Hawaii, Puerto Rico, and the U.S.
 1* The international rates below apply to calls from the U.S. Mainland, Hawaii, Puerto Rico, and the U.S. Virgin Islands. For additional termination poinst for some countries, see International Termination
MONTHLY NATURAL GAS SURVEY. November 2009
 MONTHLY NATURAL GAS SURVEY November 2009 INTERNATIONAL ENERGY AGENCY INTERNATIONAL ENERGY AGENCY Next Release: 12 March 2010 MONTHLY NATURAL GAS SURVEY - 1 CONTENTS TABLE 1 Natural Gas Balances in OECD
KINGDOM OF CAMBODIA NATION RELIGION KING 3
 KINGDOM OF CAMBODIA NATION RELIGION KING 3 TOURISM STATISTICS REPORT October 2015 MINISTRY OF TOURISM Statistics and Tourism Information Department No. A3, Street 169, Sangkat Veal Vong, Khan 7 Makara,
Sprint Real Solutions VPN SDS International Rates from the U.S. Mainland, Hawaii, Puerto Rico, and the U.S. Virgin Islands 1*
 1* The international rates below apply to calls from the U.S. Mainland, Hawaii, Puerto Rico, and the U.S. Virgin Islands where available. The rates, which are shown below in full minute increments, are
Sprint Real Solutions Switched Data Service International Rates from the U.S. Mainland, Hawaii, Puerto Rico, and the U.S.
 1* The international rates below apply to calls from the U.S. Mainland, Hawaii, Puerto Rico, and the U.S. Virgin Islands. The usage rates below reflex the discount found in Section 6.4 of Schedule No.
1.0 Introduction Zambia s Major Trading Partners Zambia s Major Export Markets... 4
 Bank of Zambia CONTENTS 1.0 Introduction... 3 2.0 Zambia s Major Trading Partners... 3 3.0 Zambia s Major Export Markets... 4 4.0 Major Source Countries Of Zambia s Imports... 5 5.0 Direction Of Trade
Sprint Real Solutions Switched Data Service International Rates from the U.S. Mainland, Hawaii, Puerto Rico, and the U.S.
 1* The international rates below apply to calls from the U.S. Mainland, Hawaii, Puerto Rico, and the U.S. Virgin Islands. The usage rates below reflex the discount found in Section 6.4 of Schedule No.
An overview of Tallinn tourism trends
 An overview of Tallinn tourism trends August 2015 The data is collected from Statistics Estonia, Tallinn Airport and Port of Tallinn. In August 2015, 179,338 stayed overnight in Tallinn s accommodation
INTERNATIONAL TRAVEL AND TOURISM
 INTERNATIONAL TRAVEL AND TOURISM YEAR 2014 1. INTRODUCTION This issue of the Economic and Social Indicators presents data on International Travel and Tourism for the year 2014. A brief on the compilation
Global robot installations: high double digit growth rates
 ' of units Global robot installations: high double digit growth rates 5 45 4 35 3 25 2 15 1 5 113 6 Estimated annual worldwide supply of industrial robots 28-216 and 217-22* +15% on average per year 121
1.0 Introduction Zambia s Major Trading Partners Zambia s Major Export Markets... 4
 Bank of Zambia CONTENTS 1.0 Introduction... 3 2.0 Zambia s Major Trading Partners... 3 3.0 Zambia s Major Export Markets... 4 4.0 Major Source Countries Of Zambia s Imports... 5 5.0 Direction Of Trade
END OF YEAR RESULTS 2016 INVESTOR CONSULTING
 END OF YEAR RESULTS 016 INVESTOR CONSULTING BERLIN, 09.0.01 Achim Hartig Managing Director Investor Consulting www.gtai.com Executive Summary In 016, 01 projects, creating a total of,6 jobs, were processed
I The shipping market contents ISL
 Comment - Charts and Tables concerning The Shipping Market World Merchant Fleet Tanker Market Bulk Carrier Market Tab. 1 Additions/Reductions by Ship Types 2014-2016 and up to June 2017... III Tab. 2 Size
REVIEW 2017 NOVEMBER 12 18, HANOVER
 REVIEW 2017 REVIEW 2017 www.agritechnica.com facebook.com/agritechnica EXHIBITORS 2,802 exhibitors from 52 countries presented their machinery and technology for professional crop production. DEVELOPMENT
ROMANIA. Table 1. FDI flows in the host economy, by geographical origin. (Millions of US dollars)
") Table 1. FDI flows in the host economy, by geographical origin World.... 2 196 6 435 6 485 11 333 9 928 13 910 4 843 2 939 2 522 2 746 Developed economies.... 1 521 5 361 6 309 11 445 9 136 13 422 4 812
Table 1. FDI flows in the host economy, by geographical origin World.... 2 196 6 435 6 485 11 333 9 928 13 910 4 843 2 939 2 522 2 746 Developed economies.... 1 521 5 361 6 309 11 445 9 136 13 422 4 812
CROATIA. Table 1. FDI flows in the host economy, by geographical origin. (Millions of US dollars)
") Table 1. FDI flows in the host economy, by geographical origin World 1 307 1 153 2 107 1 210 1 844 3 228 4 928 5 941 3 566 515 1 511 1 370 Developed economies 1 207 1 113 1 719 1 190 1 885 3 093 4 775
Table 1. FDI flows in the host economy, by geographical origin World 1 307 1 153 2 107 1 210 1 844 3 228 4 928 5 941 3 566 515 1 511 1 370 Developed economies 1 207 1 113 1 719 1 190 1 885 3 093 4 775
Next Release: 13 April Next Release: 13 April December
 43070 Next Release: 13 April 2018 Next Release: 13 April 2018 December Date of publication: 15 March 2018 TABLE OF CONTENTS Charts 1 Gross consumption of natural gas by OECD region 3 2 Indigenous production
5.3. Cannabis: Wholesale and Street Prices and Purity Levels
 5. Prices: Cannabis 5.3. Cannabis: Wholesale and Street Prices and Purity Levels HERBAL CANNABIS Africa East Africa Ghana 51.0 39.2-62.7 1999 Kenya 0.2 0.1-0.3-2002 119.8-1996 Madagascar 1.3 1.1-1.4 100.0
The World Pasta Industry in 2011
 The World Pasta Industry in 2011 Survey The World Pasta Industry in 2011 25 October 2012 1 Like every year, we have completed our Annual Survey on the World Pasta Industry. We would like to thank all the
Call Type PAYU1 PAYU2 PAYU3 Out Of Bundle
 Jan-18 Mobile Tariff Information Headline Rates Call Type PAYU1 PAYU2 PAYU3 Out Of Bundle Calls to Own Mobiles 1p 1p 1p 1p Calls to Own Landlines 1p 1p 1p 1p Calls to UK Landlines (Starting 01, 02, 03)
Maritime ports freight and passenger statistics
 Maritime ports freight and passenger statistics Statistics Explained Data from March 2018. Planned update: January 2019. This article presents the latest statistical data on freight handling and passenger
Exports of Canadian Grain and Wheat Flour
 Canadian Grain Commission Commission canadienne des grain JULY CROP YEAR 2012 Exports of Canadian Grain and Wheat Flour date Tonnes (millions) 14.0 12.0 10.0 8.0 6.0 4.0 2.0 0.0 9.0 8.0 7.0 6.0 5.0 4.0
Exports of Canadian Grain and Wheat Flour
 Canadian Grain Commission Commission canadienne des grain FEBRUARY CROP YEAR 2012 Exports of Canadian Grain and Wheat Flour date Tonnes (millions) 10.0 9.0 8.0 7.0 6.0 5.0 4.0 3.0 2.0 1.0 0.0 6.0 5.5 5.0
Animal products; badger hair and other brush making hair and waste of such bristles or hair, n.e.c. in heading no (excluding horsehair)
") Page 1 05021000 Animal products; hair or bristles, of pigs, hogs or boars, and waste thereof Qty2=KGM Qty1=KG Value=NZ$ UNITED KINGDOM 2 3 378 SAMOA 20 20 131 ALL COUNTRIES TOTAL 22 23 509 05029000 Animal
Page 1 05021000 Animal products; hair or bristles, of pigs, hogs or boars, and waste thereof Qty2=KGM Qty1=KG Value=NZ$ UNITED KINGDOM 2 3 378 SAMOA 20 20 131 ALL COUNTRIES TOTAL 22 23 509 05029000 Animal
Base Commission To all destinations 0%
 Commissions Offshore/Transborder Ticketing American Airlines does not pay base commission for tickets issued by travel agents on itineraries originating within the territory of the United States, including
Exports of Canadian Grain and Wheat Flour
 Canadian Grain Commission Commission canadienne des grain JANUARY CROP YEAR 2011 Exports of Canadian Grain and Wheat Flour date Tonnes (millions) 8.0 7.0 6.0 5.0 4.0 3.0 2.0 1.0 0.0 4.0 3.5 3.0 2.5 2.0
Effective for all tickets issued where American validation is used. IATA-approved locations classified by American as full service.
 Commissions Base Commission Rates Agencies Located in 50 U.S, Puerto Rico, U.S. Virgin Islands and Canada Agencies Located Outside the 50 U.S., Puerto Rico, U.S. Virgin Islands and Canada Offshore/Trans-border
Exports of Canadian Grain and Wheat Flour
 Canadian Grain Commission Commission canadienne des grain MAY 2011 CROP YEAR Exports of Canadian Grain and Wheat Flour date Tonnes (millions) 14.0 12.0 10.0 8.0 6.0 4.0 2.0 0.0 7.0 6.0 5.0 4.0 3.0 2.0
Statistical Data 2010
 Statistical Data 2010 Thessaloniki Port Authority S.A. http:www.thpa.gr Vessels Ship arrivals Year International Domestic G.R.T N.R.T 2000 2.334 1.090 3.424 23.737.210 11.643.798 2001 2.285 1.146 3.431
CONTENTS Executive Summary... iii 1. Introduction Major Destinations for Zambia s Exports Major Source Countries for Zambia s
 Bank of Zambia CONTENTS Executive Summary... iii 1. Introduction... 1 2. Major Destinations for Zambia s Exports... 1 3. Major Source Countries for Zambia s Imports... 4 4. Conclusion... 6 ii Executive
UNITED NATIONS CONFERENCE ON TRADE AND DEVELOPMENT INVESTMENT COUNTRY PROFILES LATVIA. October 2011
 UNITED NATIONS CONFERENCE ON TRADE AND DEVELOPMENT INVESTMENT COUNTRY PROFILES LATVIA October 2011 i NOTE The Division on Investment and Enterprise of UNCTAD is a global centre of excellence, dealing with
DOMESTIC AND FOREIGN DIRECT INVESTMENT REALIZATION IN QUARTER II AND JANUARY JUNE 2013
 Invest in remarkable indonesia Invest in indonesia Invest in remarkable indonesia Invest in remarkable indonesia Invest in Invest in remarkable indonesia Invest in indonesia Invest in remarkable indonesia
ENGAGING ALUMNI WORLDWIDE
 ENGAGING ALUMNI WORLDWIDE COLUMBIA GLOBAL CENTERS and COLUMBIA ALUMNI ASSOCIATION Columbia University Senate Feb. 27, 2015 Mission Statement: Columbia Global Centers Columbia Global Centers promote and
REPUBLIC OF KOREA. Table 1. FDI flows in the host economy, by geographical origin. (Millions of US dollars)
") Table 1. FDI flows in the host economy, by geographical origin World 4 130 3 395 4 383 8 980 7 050 4 950 2 629 8 409 7 501 8 117 10 247 11 117 Developed economies 3 123 2 385 2 949 7 185 5 743 3 423-275
Table 1. FDI flows in the host economy, by geographical origin World 4 130 3 395 4 383 8 980 7 050 4 950 2 629 8 409 7 501 8 117 10 247 11 117 Developed economies 3 123 2 385 2 949 7 185 5 743 3 423-275
Port Services and Facilities
 KEY PERFORMANCE INDICATORS Port Services and Facilities Fremantle Ports objectives for the provision of services and facilities are aimed at ensuring that port services and facilities are reliable and
The Nordic Countries in an International Comparison. Helga Kristjánsdóttir 20. apríl 2012
 The Nordic Countries in an International Comparison Helga Kristjánsdóttir 20. apríl 2012 15 Figure 1. World Bank, GDP growth (annual %) 10 5 0 1961 1963 1965 1967 1969 1971 1973 1975 1977 1979 1981 1983
Summer Work Travel Season Program Dates by Country
 The program dates are windows of opportunity for program participation. Within this timeframe, students are still subject to their university's official academic break schedule. Even though the window
DEVELOPMENT AID AT A GLANCE
 DEVELOPMENT AID AT A GLANCE STATISTICS BY REGION 3. AMERICA 2018 edition All the data in this report are available at: http://www.oecd.org/dac/financing-sustainable-development/ 3.1. ODA TO AMERICA - SUMMARY
BADGER HAIR AND OTHER BRUSH-MAKING HAIR AND WASTE THEREOF
 Page 1 05021000 PIGS', HOGS' OR BOARS' BRISTLES AND HAIR AND WASTE THEREOF NETHERLANDS - 11,400 101,140 ALL COUNTRIES TOTAL 0 11,400 101,140 05029000 BADGER HAIR AND OTHER BRUSH-MAKING HAIR AND WASTE THEREOF
% change vs. Dec ALL VISITS (000) 2,410 12% 7,550 5% 31,148 1% Spend ( million) 1,490 15% 4,370-1% 18,710 4%
 2,410 12% 7,550 5% 31,148 1% Spend ( million) 1,490 15% 4,370-1% 18,710 4%") HEADLINES FULL YEAR 2012 (PROVISIONAL) 1 Overall visits 31.148 million visits making 2012 the best year for inbound tourism since 2008 but not a record. 1% increase in visits on 2011 (30.798 visits) slightly
HEADLINES FULL YEAR 2012 (PROVISIONAL) 1 Overall visits 31.148 million visits making 2012 the best year for inbound tourism since 2008 but not a record. 1% increase in visits on 2011 (30.798 visits) slightly
Exports of Canadian Grain and Wheat Flour
 Canadian Grain Commission Commission canadienne des grain APRIL CROP YEAR - Exports of Canadian Grain and Wheat Flour 2005- - date Tonnes (millions) 14.0 12.0 10.0 8.0 6.0 4.0 2.0 0.0 5.0 4.5 4.0 3.5 3.0
Summer Work Travel Season Program Dates by Country
 Albania 1-Jul 30-Sep 3 Months Argentina 1-Dec 1-Apr 4 Months Armenia 1-Jun 31-Aug 3 Months Australia 15-Nov 8-Mar 3.5 Months Visa Waiver Country Austria 1-Jul 30-Sep 3 Months Visa Waiver Country Azerbaijan
EUROPEAN CENTRE FOR DISEASE PREVENTION AND CONTROLInfluenza A(H1N1)v
v") Table 1: Reported new confirmed cases and cumulative number of influenza A(H1N1)v and cumulative deaths among confirmed cases by country as of August, 1: hours (CEST) in the EU and EFTA countries Confirmed
Table 1: Reported new confirmed cases and cumulative number of influenza A(H1N1)v and cumulative deaths among confirmed cases by country as of August, 1: hours (CEST) in the EU and EFTA countries Confirmed
THE GROWTH OF THE HOSPITALITY INDUSTRY IN DUBAI
 THE GROWTH OF THE HOSPITALITY INDUSTRY IN DUBAI THE DEFINITION OF TOURISM Tourism is travel for recreational, leisure or business purposes. The World Tourism Organization defines tourists as people "traveling
Country (A - C) Local Number Toll-Free Premium Rates
 Local Number Toll-Free Premium Rates") Choose a number from the provided list based on the country that you re calling from. Numbers with Premium Rates are only available to Enterprise Groups that are subscribed to the BlueJeans Premium Calling
Choose a number from the provided list based on the country that you re calling from. Numbers with Premium Rates are only available to Enterprise Groups that are subscribed to the BlueJeans Premium Calling
Anuga 2017 in figures
 Press Release No. 10 / hac / September 2017, Cologne Anuga 2017 in figures Participation from home and abroad Exhibitors Domestic participation 716 Foreign participation 6,689 Total 7,405 The companies
Intra-African Air Services Liberalization
 Intra-African Air Services Liberalization James Wiltshire Senior Economist, www.iata.org/economics To represent, lead and serve the airline industry Aviation connects African businesses to world markets
Country (A - C) Local Number Toll-Free Premium Rates
 Local Number Toll-Free Premium Rates") Choose a number from the provided list based on the country that you re calling from. Numbers with Premium Rates are only available to Enterprise Groups that are subscribed to the BlueJeans Premium Calling
Choose a number from the provided list based on the country that you re calling from. Numbers with Premium Rates are only available to Enterprise Groups that are subscribed to the BlueJeans Premium Calling
Republic of Turkey - Ministry of Economy,
 Republic of Turkey - Ministry of Economy, 2012 0 SHIPBUILDING INDUSTRY Turkey is surrounded by sea on three sides, is a natural bridge between Asia and Europe. Turkey borders the Black Sea, the Mediterranean,
Pistachio Industry Inventory Shipment Report Pounds Crop Year
 Pistachio Industry Inventory Shipment Report Pounds March 2017 Year to Date Summary - Pounds 2016-2017 Crop Year Open Inshell AO Closed Shell Shelling Stock Total 8/31/16 Carryover 46,956,408 41,224,713
SOUTHERN AFRICA TRAVEL AND TOURISM BAROMETER REPORT 2015
 SOUTHERN AFRICA TRAVEL AND TOURISM BAROMETER REPORT 2015 1 Contents 1. TOURISM TRENDS: GLOBAL AND SOUTHERN AFRICA S MARKET SHARE IN AFRICA... 4 1.1. TOURIST ARRIVALS... 4 1.1.1. Global Tourist Arrivals
Copyrights Statistics Botswana 2016
 STATISTICS BOTSWANA TOURISM STATISTICS ANNUAL REPORT 2014 Copyrights Statistics Botswana 2016 Statistics Botswana. Private Bag 0024 Botswana Tel: (267) 367 1300. Fax: (267) 395 2201.Email: info@statsbots.org.bw
III. TRADE IN COMMERCIAL SERVICES BY CATEGORY
 .. TRADE IN COMMERCIAL SERVICES BY CATEGORY Transportation services China records impressive growth of world transportation services reached $750 billion in 2007, an increase of 19 per cent, following
Summer Work Travel Season Program Dates by Country
 The program dates are windows of opportunity for program participation. Within this timeframe, students are still subject to their university's official academic break schedule. Even though the window
Post Show Report. The 19th China International Pet Show (CIPS 2015) National Exhibition and Convention Center (Shanghai)
 National Exhibition and Convention Center (Shanghai)") 2015.11.4-7 National Exhibition and Convention Center (Shanghai) The 19th China International Pet Show (CIPS 2015) China Great Wall International Exhibition Co. Ltd. November 2015 Content OVERVIEW... 1
2015.11.4-7 National Exhibition and Convention Center (Shanghai) The 19th China International Pet Show (CIPS 2015) China Great Wall International Exhibition Co. Ltd. November 2015 Content OVERVIEW... 1
(A) Comparative Summary of Canadian Grain Exports (A) Comparative Summary of Canadian Grain Exports
 Comparative Summary of Canadian Grain Exports (A) Comparative Summary of Canadian Grain Exports") (A) Comparative Summary of Canadian Grain Exports 3 Wheat Amber Durum Oat Barley Rye Flax Canola Soybeans Peas Corn Lentil Total, 2013 947.0 318.7 52.9 103.3 3.3 29.2 685.5 8.3 323.2 18.9 8.3 2,498.5 February,
(A) Comparative Summary of Canadian Grain Exports 3 Wheat Amber Durum Oat Barley Rye Flax Canola Soybeans Peas Corn Lentil Total, 2013 947.0 318.7 52.9 103.3 3.3 29.2 685.5 8.3 323.2 18.9 8.3 2,498.5 February,
CONTENTS Executive Summary... iii 1. Introduction Major Destinations for Zambia s Exports Major Source Countries for Zambia s
 Bank of Zambia CONTENTS Executive Summary... iii 1. Introduction... 1 2. Major Destinations for Zambia s Exports... 1 3. Major Source Countries for Zambia s Imports... 3 4. Conclusion... 6 ii Executive
COUNTRY & TERRITORY PROFILES A Summary of Oil Spill Response Arrangements & Resources Worldwide
 3. COUNTRY & TERRITORY PROFILES (including date of update) A Albania August 2010 Antigua January 2009 Algeria May 2011 Argentina December 2015 Angola May 2009 Aruba April 2008 Anguilla November 2005 Australia
EU-Russia summit Strong recovery of trade in goods between EU27 and Russia in 2011 An EU27 deficit of 91 bn euro with Russia in 2011
 STAT/2/82 June 202 EU-Russia summit Strong recovery of trade in goods between EU27 and Russia in 20 An EU27 deficit of 9 bn euro with Russia in 20 Following a sharp fall in 2009, EU27 trade in goods with
TOOLS, TOOL BODIES, TOOL HANDLES, BROOM OR BRUSH BODIES AND HANDLES, OF WOOD; BOOT OR SHOE LASTS AND TREES OF WOOD
 Page 1 05029000 BADGER HAIR AND OTHER BRUSH-MAKING HAIR AND WASTE THEREOF Qty2= Qty1=KG Value=HKD THE MAINLAND OF CHINA - 58,349 73,579,151 ALL COUNTRIES TOTAL 0 58,349 73,579,151 44170000 TOOLS, TOOL
Performance Derby: MSCI Share Price Indexes
 Performance Derby: MSCI Share Price Indexes January 5, 2018 Dr. Ed Yardeni 516-972-7683 eyardeni@yardeni.com Joe Abbott 732-497-5306 jabbott@yardeni.com Please visit our sites at blog.yardeni.com thinking
Accounting Basis by Country
 Accounting Basis by Country Egypt Africa Northern Africa Morocco Africa Northern Africa Sudan Africa Northern Africa Western Sahara Africa Northern Africa Angola Africa Sub-Saharan Africa Benin Africa
POST SHOW REPORT. Stats quoted are based on attendee info supplied at registration #ELECTRIFYEUROPE
 POST SHOW REPORT QUICK STATS QUICK STATS 18% of attendees were Utility/IPP s 30% of attendees were General / Corporate Managers 30% of attendees were interested in Renewables and related technologies 50%
CONTENTS Executive Summary... iii 1. Introduction Major Destinations for Zambia s Exports Major Source Countries for Zambia s
 Bank of Zambia CONTENTS Executive Summary... iii 1. Introduction... 1 2. Major Destinations for Zambia s Exports... 1 3. Major Source Countries for Zambia s Imports... 4 4. Conclusion... 6 ii Executive
The W20. The 20 wealthiest countries in the world. Publication Date: October 2015 NEW WORLD WEALTH
 The W20 The 20 wealthiest countries in the world Publication Date: October 2015 W20 wealth rankings The following tables ranks the top 20 countries in the world by total individual wealth held. Total individual
INTERNATIONAL REGISTRY IN ORGAN DONATION and TRANSPLANTATION
 INTERNATIONAL REGISTRY IN ORGAN DONATION and TRANSPLANTATION www.irodat.org Final Numbers 2016 December 2017 Dear colleagues On behalf of all IRODaT staff, we are glad to present the 2016 final numbers
STATISTICS AT A GLANCE
 POST SHOW REPORT STATISTICS AT A GLANCE QUICK STATS 18% of attendees were Utility/IPP s 30% of attendees were General / Corporate Managers 15% of attendees were interested in Natural Gas 50% of attendees
DEVELOPMENT AID AT A GLANCE
 DEVELOPMENT AID AT A GLANCE STATISTICS BY REGION 3. AMERICA 26 edition 3.. ODA TO AMERICA - SUMMARY 3... Top ODA receipts by recipient USD million, net disbursements in 24 3..3. Trends in ODA Colombia
United Nations Conference on Trade And Development INVESTMENT COUNTRY PROFILES. FRANCE February 2012
 United Nations Conference on Trade And Development INVESTMENT COUNTRY PROFILES FRANCE February 2012 i NOTE The Division on Investment and Enterprise of UNCTAD is a global centre of excellence, dealing
MGTA Ocean Freight. January 21, 2016
 MGTA Ocean Freight January 21, 2016 Brief History History 1848: Pacific Mail Steamship Company is founded; the company is given a ten-year government contract to deliver mail between Panama and Oregon;
GODINA XI SARAJEVO, BROJ 2 TOURISM STATISTICS. Tourism in BIH, February 2017
 number of nights GODINA XI SARAJEVO, 06.04.2017. BROJ 2 TOURISM STATISTICS Tourism in BIH, February 2017 In February 2017 tourists realised 56,042 tourist arrivals in Bosnia and Hercegovina which represent
Chris Schmidt - istockphoto. Germany s Major Investment Partners USA
 Chris Schmidt - istockphoto Germany s Major Investment Partners USA I. The Big Picture II. Individual Analysis of Selected Countries North America (USA) III. Contacts www.gtai.com 2 I. The Big Picture
PRESS RELEASE. ARRIVALS OF NON-RESIDENTS IN GREECE: January - June 2016 HELLENIC REPUBLIC HELLENIC STATISTICAL AUTHORITY. Piraeus, 13 October 2016
 HELLENIC REPUBLIC HELLENIC STATISTICAL AUTHORITY Piraeus, 13 October 2016 PRESS RELEASE ARRIVALS OF NON-RESIDENTS IN GREECE: January - June 2016 According to the Frontier Statistical Survey conducted by
Port construction in Bremerhaven Construction of the new Kaiserschleuse sea lock
 Port construction in Bremerhaven Construction of the new Kaiserschleuse sea lock Requirement: permanent demand for engineering skills History repeats itself On 23 August 1897, the new double-propeller
Financial Reporting Standards Adoption by Country
 Financial Reporting Standards Adoption by Country Egypt Africa Northern Africa Morocco Africa Northern Africa Sudan Africa Northern Africa Western Sahara Africa Northern Africa Angola Africa Sub-Saharan
III. TRADE IN COMMERCIAL SERVICES BY CATEGORY
 .. TRADE IN COMMERCIAL SERVICES BY CATEGORY Transportation services China records impressive growth Exports of world transportation services reached $750 billion in 2007, an increase of 19 per cent, following
Global Travel Trends 2005
 Preliminary World Travel Monitor Results from IPK international for the ITB Berlin Message, 03/10/06 Global Travel Trends 2005 Based on the new data from the 2005 World Travel Monitor, and as it does every
COUNTRIES & REGIONS GREENMAX GLOBAL PARTNERS. Asia. Africa. Europe. Oceania. America. Iran Irseal Japan Korea Lebanon Malaysia
 P A R T N E R S GREENMAX GLOBAL PARTNERS 68 COUNTRIES & REGIONS Europe America Oceania Asia Africa Belarus Belgium Croatia Cyprus Czech Denmark Estonia Finland France Germany Greece Holland Hungary Ireland
A F R I C A TANZANIA. 21 st POST SHOW REPORT
 21 st TANZANIA A F R I C A 2 0 1 8 East Africa s Largest International Trade Exhibition On Building & Construction Products, Equipments & Machinery POST SHOW REPORT 01-03 November 2018 Diamond Jubilee
Bunker Charge (BUC) and Currency Adjustment Factor (CAF) application from/to North Europe
 and Currency Adjustment Factor (CAF) application from/to North Europe") Bunker Charge (BUC) and Currency Adjustment Factor (CAF) application from/to October 30, 2015 Dear Customer, Please be informed about the following Bunker Charge (BUC), Low Sulphur Fuel Surcharge* (LSF)
Bunker Charge (BUC) and Currency Adjustment Factor (CAF) application from/to October 30, 2015 Dear Customer, Please be informed about the following Bunker Charge (BUC), Low Sulphur Fuel Surcharge* (LSF)
HONG KONG (Special Administrative Region)
") HONG KONG (Special Administrative Region) Attachments: A short note on External Trade Year 2010 Imports of Hong Kong from the World Imports of Hong Kong from Italy by product groups Exports (re-exports
HONG KONG (Special Administrative Region) Attachments: A short note on External Trade Year 2010 Imports of Hong Kong from the World Imports of Hong Kong from Italy by product groups Exports (re-exports
March 2015 compared with February 2015 Volume of retail trade down by 0.8% in euro area Down by 0.6% in EU28
 03-2006 06-2006 09-2006 12-2006 03-2007 06-2007 09-2007 12-2007 03-2008 06-2008 09-2008 12-2008 03-2009 06-2009 09-2009 12-2009 03-2010 06-2010 09-2010 12-2010 03-2011 06-2011 09-2011 12-2011 03-2012 06-2012
Bunker Charge (BUC) and Currency Adjustment Factor (CAF) application from/to North Europe
 and Currency Adjustment Factor (CAF) application from/to North Europe") Bunker Charge (BUC) and Currency Adjustment Factor (CAF) application from/to August 31, 2016 Dear Customer, Please be informed about the following Bunker Charge (BUC), Low Sulphur Fuel Surcharge* (LSF)
Bunker Charge (BUC) and Currency Adjustment Factor (CAF) application from/to August 31, 2016 Dear Customer, Please be informed about the following Bunker Charge (BUC), Low Sulphur Fuel Surcharge* (LSF)
Press Information. Post Show Report
 Press Information Post Show Report Date: October 11 (Wed.) - 13 (Fri.), 2017 Venue: Makuhari Messe, Japan Organiser: Reed Exhibitions Japan Ltd. Co-organiser: Japan External Trade Organization (JETRO)
YELLOW BOOK. World PA6 & PA66 Supply / Demand Report
 YELLOW BOOK World PA6 & PA66 Supply / Demand Report 2016 WORLD PA6 & PA66 Supply/Demand Report 2016 PCI Research GmbH Holzweg 14 D-61440 Oberursel Germany Phone: 0049-6171-98909-0 Fax: 0049-6171-98909-22
ICCA & the International Association Meetings ICCA-JNTO-JTA Bid Workshop 2013
 ICCA & the International Association Meetings ICCA-JNTO-JTA Bid Workshop 2013 Asia continues to be one of the most dynamic meetings regions in the world, and has continued to grow and develop throughout
Bunker Charge (BUC) and Currency Adjustment Factor (CAF) application from/to North Europe
 and Currency Adjustment Factor (CAF) application from/to North Europe") Bunker Charge (BUC) and Currency Adjustment Factor (CAF) application from/to April 29, 2016 Dear Customer, Please be informed about the following Bunker Charge (BUC), Low Sulphur Fuel Surcharge* (LSF)
Bunker Charge (BUC) and Currency Adjustment Factor (CAF) application from/to April 29, 2016 Dear Customer, Please be informed about the following Bunker Charge (BUC), Low Sulphur Fuel Surcharge* (LSF)
Performance Derby: MSCI Regions/Countries Earnings & Revenues Growth 2018E / 2017E / 2016A
 Performance Derby: MSCI Regions/Countries Earnings & Revenues Growth 2018E / 2017E / 2016A December 6, 2017 Dr. Ed Yardeni 516-972-7683 eyardeni@yardeni.com Joe Abbott 732-497-5306 jabbott@yardeni.com
Organiser. Project team. Hotel service. Main product group. Opening hours
 Texcare International Weltmarkt Moderner Textilpflege print_md_d_m essedetailseite.rdl Venue Frankfurt/Main, Germany Messegelände Date 20.06.-24.06.2020 Interval: every four years Founded in: 1956 Supporter/sponsor