SIAM FUTURE DEVELOPMENT PUBLIC CO., LTD. Corporate Presentation Q4-15
|
|
|
- Phyllis Watson
- 5 years ago
- Views:
Transcription


1 SIAM FUTURE DEVELOPMENT PUBLIC CO., LTD. Corporate Presentation Q4-15
2 Overview Financial Summary Project Update 2


3 Overview Founded: 1994 Staff: 80 Centers: 22 Vision Unlike other developers, we create a place for people first then for business. 3
4 Business Model Total Rental Space 408,563 sq.m. with 22 Centers 32%, 131,901 sq.m. Shopping Center Development Neighborhood Center Lifestyle Center Power Center Entertainment Center Convenience Center Stand-Alone Retail Center Super Regional Center 60% 242,713 sq.m. 15 centers 4 centers: 8%, 33,949 sq.m. 3 centers: -La Villa -Piyarom Place -The Avenue Changwattana -Petchkasem -Ekkamai -Ratchayothin -Mega Bangna 4


5 Development Timeline 1994 Established Siam Future Development 2002 Listed in MAI and opened Thonglo 2011 Open Nawamin Festival Walk 1995 Opened first open-air shopping center Bangbon 1998 Opened Sukhumvit Completed Changwattana, 2003 La-villa and Esplanade Listed in SET PP to Major Cineplex Group and opened Thungmahamek 1996 Opened Prachautid and Sukaphiban Opened Changwattana, Ladprao120, Chachoengsao, Piyarom Place and J Avenue 2007 Opened Pattaya and Kao-yai 2000 Opened 2 Convenient centers and 8 B-quik centers 2005 Opened Wanghin 2, Petchkasem and Ekkamai 2008 Opened Nawamin and Ratchayothin 2009 Opened Nawamin City Avenue 2012 Open 1 st IKEA Store in Mega Bangna 5
6 Leasable Area and Occupancy Format No. of centers GLA* (sq.m.) No. of centers GLA (sq.m.) No. of centers GLA (sq.m.) Average size (sq.m.) Lifestyle Center 8 79, , ,709 10,000 Power Center 3 67, , ,217 22,500 Entertainment Center Neighborhood Center Convenience Center Automotive Service center 1 43, , ,241 43, , , ,389 5, , , , , , Super Regional 1 180, , , ,000 Total , , ,563 16,400 Occupancy Rate 97% 93% 98% *Gross Leasable Area 6


7 Shareholding Structure Major Cineplex Group PLC. 23% Management 26% Jantaraprapa Group Suttapong Group 7% 4% Witoonchart group 8% Pojkasemsin Group 3% Freefloat 51% Local Institutions 7% Retails 30% Foreigners 16% Number of shares: 1, Million Source: Shareholder list as of 30 Dec 15 7
8 Overview Financial Summary Project Update 8

9 Balance Sheet Million Baht 16,000 14,000 12,000 11,430 12,002 12,460 14,422 10,000 8,000 6,000 4,000 2,000 7,146 5,903 6,430 5,527 5,572 5,314 5,516 8,906 0 Y2012 Y2013 Y2014 Y2015 Assets Liabiilites Equity 9
10 Income Statement (Management Account) (Million Baht) A B C D E 1 Recurring Revenue 1,347 1,396 1,372 1,429 2 Cost of rental & service (908) (1,002) (936) (909) 3 Gross profit SG&A (197) (198) (229) (233) 5 EBIT Interest expenses (102) (99) (95) (96) 7 Income tax (32) (27) (32) (38) 8 Minority (15) (18) (18) (21) 9 Recurring profit (excl. MEGA BANGNA) Profit from joint venture Total recurring profit Add: Profit from Fin Lease (after tax) Project disposal ** (170) Fair value adjustment on IP * SF (after tax) Fair value adjustment on IP Mega Bangna (49%) 1, Net profit 1, , Earnings per share (EPS) Average Occupancy Rate (%) 96% 94% 93% 98% Remarks: * Fair value adjustment on Investment Property= Depreciation & Amortization + Gain (Loss) from revaluation ** Loss from termination of Finance Lease contract of CAWOW 10


11 Rental Structure by Revenue by GLA Revenue Share 10% Revenue Share 31% Fixed Rent 90% Fixed Rent 69% As of 31 Dec
12 Costs Breakdown SG&A Breakdown Depreciation & Amortization 26% Land Rent 16% Operating 19% Admin 21% Depreciation 6% Marketing 15% Utilities 38% Personnel 57% As of 31 Dec
13 Debt Structure (MB) As of Dec 15 As of Mar 16 Total Debt = 1,950 MB 100% Debenture Average interest rate = 4.83% Total Debt = 1,500 MB 80% Debenture Average interest rate = 4.83% Repayment schedule (MB) Bond Repayment schedule (MB) Bond P/N D:E Ratio Y10 = 0.53 Y11 = 0.47 Y12 = 0.33 Y13 = 0.33 Y14 = 0.27 Y15 =
14 Stock Information and Dividend INDEX SET Index 1,033 1,025 1,392 1,299 1,498 1,288 SF (stock price) Market Cap (MB) 5,873 6,528 8,249 7,435 9,256 11,104 Dividend Summary Par Value (Baht) Dividend Paid (MB) 155 Stock Dividend 8:1 Stock Dividend 5:1 266 Dividend/share * Dividend Payout Ratio 66% N.A. N.A. N.A. N.A. 80% Statistics as of 9 Mar 16 Stock Price 5.95 Par Value (Baht) 1.00 Share Capital (M shares) 1, P/E (times) 7.51 Market Cap (MB) 10,571 P/BV (times)
15 Overview Financial Summary Project Update 15
16 Expansion Plan * GLA (sq.m.) 450, , , , , , , ,000 50,000 97% 63,344 96,837 Type of Center Location Existing GLA (sq.m.) Power Center Petchkasem (Major Renovation) Future GLA (sq.m.) CAPEX Target Opening Date 43,735 43, MB Q2,2016 Neighborhood Center Rangsit-Klong 1-5,925 - Q2,2016 Power Center Lifestyle Center 95% 95% 95% Chachoengsao (expansion) Thungmahamek (expansion) Lifestyle Center Thonglor 4 (redevelopment) * Subject to change upon future situation 98% 95% 98% 97% 97% 94% 93% 140, , , , , , , , , , , , , , , , (F) 98% 8,400 10, MB Q4,2016 3,000 12, MB Q3,2018 3,000 14, MB (Land lease renewal) 8, % 95% 90% 85% 80% 75% 70% 65% 60% 55% 50% New project Mega Bangna Existing Occupancy Rate 16
 Prior Tenant: New Tenant:")

17 PETCHKASEM Power Center (major renovation) Prior Tenant: New Tenant: Revenue (Y) 3.76 MB MB MB Renovation area 10,000 sq.m. Target Opening Q

18 Marketplace RANGSIT-Klong1 (new project) Shopping centre format Neighborhood centre GLA 5,925 sq.m. Anchor Tops Market Target Opening Q

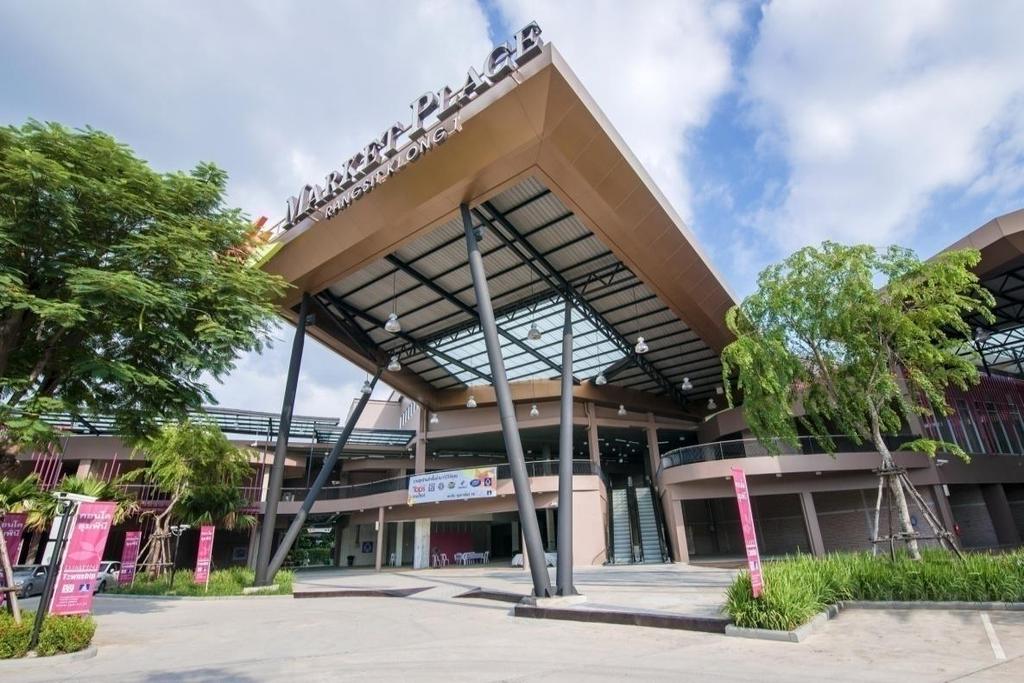
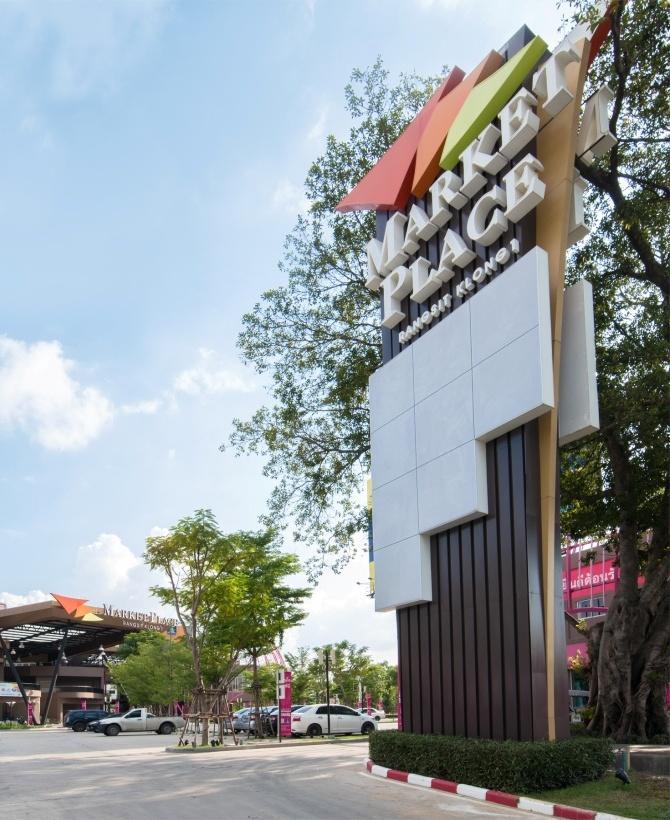
19 Marketplace RANGSIT-Klong1 (new project) 19

20 Marketplace CHACHOENGSAO (expansion) Shopping centre format Power Center GLA 10,500 sq.m. (+2,100) Anchor Major Cineplex Target Opening Q

21 Marketplace CHACHOENGSAO (expansion) 21

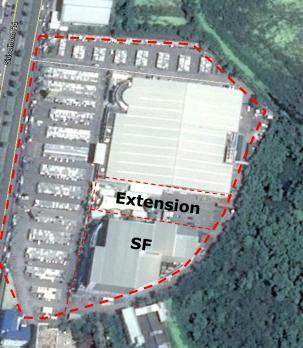
22 Marketplace THUNGMAHAMEK (expansion) Shopping centre format Lifestyle center GLA 12,000 sq.m. (+9,000) Anchor Tops Market Target Opening Q

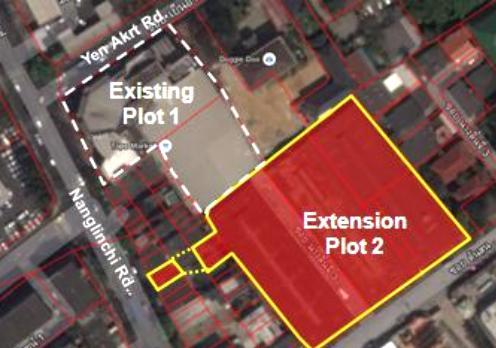


23 Marketplace THUNGMAHAMEK (expansion) 23

24 Marketplace THONGLOR 4 (redevelopment) Shopping centre format Lifestyle center GLA 14,000 sq.m. (+11,000) Anchor Target Opening 2018 Tops Market 24


25 25

26 MEGA BANGNA, Fact Sheet Land Area Building Area Leasable Area 254 Rais (406,400 sq.m.) 400,000 sq.m. 180,000 sq.m. Tenants Parking Space 440 shops 8,000 cars & 2,200 motorcycles Opening 5 May

27 MEGA BANGNA, Location 27


28 MEGA BANGNA, Tenants Mix Anchors 91,500 sq.m. Tenants 55,500 sq.m. 34% 24% 51% Mini-anchors 33,000 sq.m. 18% 31% 43% NEW COMERS 28
29 Visitor Numbers Car Numbers (Mil. People) (Mil. cars) % 7% 28 10% % Occupancy Rate (Dec-15) In line units 99.6% Common Area 99.2 % 29

30 MEGA BANGNA, Mixed Use Project Prospect Development Lease / Sell the land - Office Building - Hotel Land size - Convention Hall approx. 70 rais (112,000 sq.m.) - Residential 30
 60,000 sq.m. 10,000 sq.m. Tenants 30 shops Parking Space 1,300 cars Opening Q4-2017 31")
31 MEGA BANGNA, Phase 2 Land Area Building Area Leasable Area 10 Rais (16,000 sq.m.) 60,000 sq.m. 10,000 sq.m. Tenants 30 shops Parking Space 1,300 cars Opening Q
SIAM FUTURE DEVELOPMENT PUBLIC CO., LTD. Corporate Presentation 2016
 SIAM FUTURE DEVELOPMENT PUBLIC CO., LTD. Corporate Presentation 2016 Overview Financial Summary Project Update 2 Overview Founded: 1994 Staff: 78 Centers: 22 Vision Unlike other developers, we create a
Siam Future Development PLC
 Siam Future Development PLC 1 Content Company & Business Overview Project Operations & Development Financial Summary 2 Company & Business Overview 3 Company Overview 1994: Founded by two former Siam Cement
ERW. 083/ ACC012/ th November Subject: Management's Discussion and Analysis period ending 30 th September 2012
 ERW. 083/ ACC012/55 12 th November 2012 Subject: Management's Discussion and Analysis period ending 30 th September 2012 Attention: The President, The Stock Exchange of Thailand Dear Sir, The Erawan Group
ERW. 022/ ACC003/ th February Subject: Management's Discussion and Analysis period ending 31 st December 2012
 ERW. 022/ ACC003/56 26 th February 2013 Subject: Management's Discussion and Analysis period ending 31 st December 2012 Attention: The President, The Stock Exchange of Thailand Dear Sir, The Erawan Group
Fourth Quarter and Full Year 2009
 Investor and analyst meeting: Fourth Quarter and Full Year 29 25 th February 21 2 The views expressed here contain some information derived from publicly available sources that have not been independently
Summary of Results for the First Three Quarters FY2015/3
 Summary of Results for the First Three Quarters FY2015/3 February 10, 2015 Tokyu Corporation (9005) http://www.tokyu.co.jp/ Contents Ⅰ.Executive Summary 2 Ⅱ.Conditions in Each Business 5 Ⅲ.Details of Financial
Summary of Results for the First Quarter of FY2015/3
 Summary of for the First Quarter of FY2015/3 August 8, 2014 Tokyu Corporation (9005) http://www.tokyu.co.jp/ Contents Ⅰ.Executive Summary 2 Ⅱ.Conditions in Each Business 4 Ⅲ.Details of Financial for the
Preliminary Figures FY 2016
 February 14, 2017 Preliminary Figures FY 2016 Capital Markets Day 2017 Tom Blades (CEO) Disclaimer This presentation has been produced for support of oral information purposes only and contains forwardlooking
Summary o f Results for the First Half of FY2018
 Summary o f Results for the First Half of FY2018 November 9, 2018 (9005) https://www.tokyu.co.jp/ Contents Ⅰ.Executive Summary 2 Ⅱ.Conditions in Each Business 6 Ⅲ.Details of Financial Results for the 13
Investor presentation FY 2011 results
 Investor presentation FY 2011 results Recent highlights Itakeskus refurb & extension scaled up extension 11.000 sqm in total; anchor tenant will relocate (to Piazza); investment volume 90m, YoC 6.0-6.5%
HOPEWELL HOLDINGS LIMITED ANNOUNCES FY 2018/19 INTERIM RESULTS
 Press Release HOPEWELL HOLDINGS LIMITED ANNOUNCES FY 2018/19 INTERIM RESULTS Highlights 1H FY19 (1 April to 30 September 2018) First financial year after the change of financial year end date from 30 June
2016 Half-Yearly Results
 Presentation 29th July 2016 2016 Half-Yearly Review Underlying profit down 6% Commercial portfolio benefited from higher occupancy Steady contribution from mainland China residential business Profit attributable
Fact Sheet for Q3 and January-September 2017 October 20, 2017
 Fact Sheet for Q3 and January-September 2017 October 20, 2017 Contents Daimler Group Stock Market Information 3 Earnings and Financial Situation 4-12 Information for Divisions Mercedes-Benz Cars 13-16
PRESS RELEASE Financial Results. Rising passenger traffic at 12.5m Exceeding 1bn in consolidated revenue
 PRESS RELEASE 2016 Financial Results Rising passenger traffic at 12.5m Exceeding 1bn in consolidated revenue Kifissia, 23 March 2017 AEGEAN reports full year 2016 results with consolidated revenue at 1,020m,
SET Opportunity Day #3/2011
 SET Opportunity Day #3/2011 2Q11 & 1H11 Performance & Outlook 18 August 2011 The views expressed here contain some information derived from publicly available sources that have not been independently verified.
Fact Sheet for Q4 and Full Year 2017 pre IFRS 15 and 9 adjustments February 1, 2018
 Fact Sheet for Q4 and Full Year 2017 pre IFRS 15 and 9 adjustments February 1, 2018 Contents Daimler Group Stock Market Information 3 Earnings and Financial Situation 4-12 Information for Divisions Mercedes-Benz
Quarterly Meeting# 4/2018
 Quarterly Meeting# 4/2018 3Q18 & 9M18 Performance & Outlook 14 November 2018 1 2016 ERAWAN. All rights reserved. The views expressed here contain some information derived from publicly available sources
Press release February 21, 2014
 Press release February 21, 2014 2013 earnings Recurrent ent net income per share up +1.2%, with NAV per share growth of +1.7% Significant improvement in the financial occupancy rate and rental margin Recurrent
Financial Results 1 st Quarter Mar/2016 (FY2015) 30 July, 2015
 30 July, 2015") Financial Results Mar/2016 (FY2015) 30 July, 2015 Today s Topics P.2 P.3 P.15 1 Overview of FY Mar/2016 Financial Results Operating Revenue Operating Profit 320 307.0 +4.9Bn (+1.6%) 312.0 50 +17.6Bn (+94.6%)
Financial Results Mar/2016 (FY2015) 30 July, 2015 Today s Topics P.2 P.3 P.15 1 Overview of FY Mar/2016 Financial Results Operating Revenue Operating Profit 320 307.0 +4.9Bn (+1.6%) 312.0 50 +17.6Bn (+94.6%)
Finnair Group Interim Report 1 January 30 September 2008
 Finnair Group Interim Report 1 January 30 September 2008 1 31/10/2008 Presentation name / Author Airline industry at a historical turning point Expensive fuel price in the beginning of 2008 has dramatical
Fact Sheet for Q4 and Full Year 2016 February 2, 2017
 Fact Sheet for Q4 and Full Year 2016 February 2, 2017 Contents Daimler Group Stock Market Information 3 Earnings and Financial Situation 4-13 Information for Divisions Mercedes-Benz Cars 14-17 Daimler
Fact Sheet for Q and H July 21, 2016
 Fact Sheet for Q2 2016 and H1 2016 July 21, 2016 Contents Daimler Group Stock Market Information 3 Earnings and Financial Situation 4-13 Information for Divisions Mercedes-Benz Cars 14-17 Daimler Trucks
Cebu Air, Inc. Annual Stockholders Briefing. 24 June cebupacificair.com
 Cebu Air, Inc. Annual Stockholders Briefing 24 June 2015 cebupacificair.com Business Updates Passengers (M) Operating Statistics 2014: Passenger traffic grew 17.5% to 16.9M. Seat capacity grew 14.8% to
Cairo, May 21, TMG Holding reports EGP BN consolidated revenue, EGP 161 MN consolidated net profit
 First Quarter ending Earning Release Cairo, May 21, - reports EGP 1.139 BN consolidated revenue, EGP 161 MN consolidated net profit after minority and EGP 2.2 BN of new sales value for the first quarter
MANAGEMENT DISCUSSION AND ANALYSIS
 MANAGEMENT DISCUSSION AND ANALYSIS COMPANY AND SUBSIDIARIES FINANCIAL STATUS AND PERFORMANCE MINOR INTERNATIOANL PUBLIC COMPANY LIMITED CONSOLIDATED FINANCIAL STATEMENTS AS OF JUNE 2006 1.) Overview In
PRESS RELEASE. First Half 2017 Financial Results Higher Load Factors and traffic lead to a significant rebound in second quarter profitability
 PRESS RELEASE First Half 2017 Financial Results Higher Load Factors and traffic lead to a significant rebound in second quarter profitability Kifissia, 12 September 2017 AEGEAN announces first half 2017
Cairo, November 15, 2016 TMG holding reports EGP 3.9 BN consolidated revenues, EGP 616 MN consolidated net profit
 Nine Months and Third Quarter ending September 30, Earning Release Cairo, November 15, TMG holding reports EGP 3.9 BN consolidated revenues, EGP 616 MN consolidated net profit after minority and EGP 5.5
Positive rental reversions in Hong Kong portfolio. Rising contribution from Singapore office portfolio. Strong performance from Residential business
 2012 Review The Group performed well in 2012 Positive rental reversions in Hong Kong portfolio Rising contribution from Singapore office portfolio Strong performance from Residential business 2 Highlights
Interim Report 6m 2014
 August 11, 2014 Interim Report 6m 2014 Investors and Analysts Conference Call on August 11, 2014 Joachim Müller, CFO Latest ad-hoc release (August 4, 2014) Reduction of forecast, primarily due to a further
AMATA VN Public Company Limited
 AMATA VN Public Company Limited Welcome to Opportunity Day Financial Results for the period ended December 31, 2017 1 Disclaimer This document was prepared by Amata VN Public Company Limited in good faith
2012 Result. Mika Vehviläinen CEO
 2012 Result Mika Vehviläinen CEO 1 Agenda Market environment in Q4 Business performance and strategy execution Outlook Financials 2 Market Environment According to IATA, Global air travel continues to
2017 results: REVENUE up to million (+1.6%), NET PROFIT FOR THE PERIOD 1 shows significant increase to million (+12.
, NET PROFIT FOR THE PERIOD 1 shows significant increase to million (+12.") Business Results in 2017: Significant Rise in Profits of the Flughafen Wien Group Management Board Announces Substantial Upward Revision of Earnings Guidance and Traffic Figures for 2018 2017 results:
Business Results in 2017: Significant Rise in Profits of the Flughafen Wien Group Management Board Announces Substantial Upward Revision of Earnings Guidance and Traffic Figures for 2018 2017 results:
Executive Directors Review
 Financial Summary Turnover for the year ended 31 December 2011 amounted to HK$571.4 million ( 47.6 million) (2010: HK$706.8 million ( 58.7 million)). The turnover was principally attributable to the recognition
Performance of Q1/2018
 Performance of Q1/2018 Business Overview FPT BAFS was founded in 1983 by the Cabinet Resolution to provide aircraft refueling system services. The scope of services comprises of : I. Aviation fuel storage
Performance of Q1 2017
 Performance of Q1 2017 Business Overview FPT BAFS was founded in 1983 by the Cabinet Resolution to provide aircraft refueling system services. The scope of services comprises of : I. Aviation fuel storage
1Q 2014 Edition. Share Information. Daily Share Price Movements
 1Q 2014 Edition 1Q 2013 1Q 2014 Change Financial Summary (USD Mio) OPERATING REVENUES 807 807 0.01% OPERATING EXPENSES 827 1,000 20.86% OTHERS (INCOME) 4 25 460.80% INCOME (LOSS) FROM OPERATIONS -20-193
Year ended December 31, 2012
 Consolidated Earnings Report - Supplementary Information Consolidated Results ( ) 1. Consolidated Financial Highlights 2. Major Sales Sales Volume Data 3. Condensed Consolidated Statements of Income Condensed
MAJOR CINEPLEX GROUP PLC.
 MAJOR CINEPLEX GROUP PLC. 4Q17 Analyst Meeting 20 th 1 February 2018, Paragon Cineplex IMAX FINANCIAL OVERVIEW 2 017 YEARLY BRIEFING Financial Highlights Bt.Million 2016 2017 Growth Amt. % Revenue 8,745
Finnair Q Result
 Finnair Q1 2015 Result 7 May 2015 CEO Pekka Vauramo, Interim CFO Mika Stirkkinen 1 Turbulent market environment The weakness of the Finnish economy continued to be reflected in the demand in the first
Highlights from the Annual Results December 2007
 Highlights from the Annual Results December 2007 Disclaimer The information in this document is taken from the BAA 2007 Annual Results ( the Results ) which were published on 11 March 2008 and other public
Interim Report 3m Bilfinger Berger SE, Mannheim May 10, 2012 Joachim Müller, CFO
 Interim Report 3m 2012 Bilfinger Berger SE, Mannheim May 10, 2012 Joachim Müller, CFO Bilfinger Berger SE Interim report 3m 2012 May 10, 2012 Page 1 3m 2012: Highlights Growth in output volume and orders
THIRD QUARTER RESULTS 2018
 THIRD QUARTER RESULTS 2018 KEY RESULTS In the 3Q18 Interjet total revenues added $ 6,244.8 million pesos that represented an increase of 7.0% over the revenue generated in the 3Q17. In the 3Q18, operating
Results presentation. December 2012
 Results presentation December 2012 1 Introduction A Romanian focused property investment company Distribute dividends (or return of capital & share subscription) on a semi-annual basis Focus on properties
Analyst Presentation Schiphol Group 2006 Interim Financial Results
 Analyst Presentation Schiphol Group 2006 Interim Financial Results 24 August 2006 Interim Results Disclaimer This release may contain certain forward-looking statements with respect to the financial condition,
Airports of Thailand Public Company Limited
 Airports of Thailand Public Company Limited (AOT) 2 nd nd Quarter 2006 (January - March 2006) Agenda AOT Business Highlights Air Traffic Statistics Airport Capacity Suvarnabhumi Airport Recent Development
Financial Results 3 rd Quarter MAR/2016 (FY2015)
") Financial Results MAR/2016 (FY2015) January 29 th, 2016 CONTENTS P.1 P.2 P.3 P.4~ Overview of FY MAR/16 Results Operating Revenue Operating Profit 1,030 1,020 1,010 +1.0Bn 1,022.3 1,023.4 (+0.1%) 180 160
Financial Results MAR/2016 (FY2015) January 29 th, 2016 CONTENTS P.1 P.2 P.3 P.4~ Overview of FY MAR/16 Results Operating Revenue Operating Profit 1,030 1,020 1,010 +1.0Bn 1,022.3 1,023.4 (+0.1%) 180 160
Aéroports de Paris 2007 consolidated annual results. Dividend proposal to be submitted to the Annual General Meeting: 1.
 Paris, 13 March 2008 Aéroports de Paris 2007 consolidated annual results Dividend proposal to be submitted to the Annual General Meeting: 1.63 euro per share Strong growth in all of the Group's business
The Wharf (Holdings) Limited. Interim Results. 15 August 2007
 Limited. Interim Results. 15 August 2007") The Wharf (Holdings) Limited Interim Results 15 August 2007 Key Recaps for Interim 2007 Properties continued to be the growth driver: turnover: HK$5,031M, +74; profit: HK$3,191M, +68 Core properties Harbour
The Wharf (Holdings) Limited Interim Results 15 August 2007 Key Recaps for Interim 2007 Properties continued to be the growth driver: turnover: HK$5,031M, +74; profit: HK$3,191M, +68 Core properties Harbour
CAPITAL MARKETS DAY 14 NOVEMBER 2016
 CAPITAL MARKETS DAY 14 NOVEMBER 2016 DISCLAIMER This disclaimer governs the use of this presentation. You must not rely on the information in the presentations and alternatively we recommend you to seek
Annual Shareholders Presentation. April 29, 2015
 Annual Shareholders Presentation April 29, 2015 Strong cashflow, consumer play Leading BPO office space provider Multiple locations, multiple brands Diversified hospitality portfolio A LEADING PHILIPPINE
NORWEGIAN AIR SHUTTLE ASA QUARTERLY REPORT FIRST QUARTER 2004 [This document is a translation from the original Norwegian version]
![NORWEGIAN AIR SHUTTLE ASA QUARTERLY REPORT FIRST QUARTER 2004 [This document is a translation from the original Norwegian version]](/thumbs/87/95085804.jpg "NORWEGIAN AIR SHUTTLE ASA QUARTERLY REPORT FIRST QUARTER 2004 [This document is a translation from the original Norwegian version]") NORWEGIAN AIR SHUTTLE ASA QUARTERLY REPORT 2004 IN BRIEF At the start of 2003, Norwegian has become a pure low-fare airline. The Fokker F-50 operations have been terminated, and during the quarter the
NORWEGIAN AIR SHUTTLE ASA QUARTERLY REPORT 2004 IN BRIEF At the start of 2003, Norwegian has become a pure low-fare airline. The Fokker F-50 operations have been terminated, and during the quarter the
Forward-Looking Statements Statements in this presentation that are not historical facts are "forward-looking" statements and "safe harbor
 2017 Annual Meeting of Shareholders Presentation May 2017 Forward-Looking Statements Statements in this presentation that are not historical facts are "forward-looking" statements and "safe harbor statements"
Even Frydenberg, President & CEO Jan Johansson, CFO
 Even Frydenberg, President & CEO Jan Johansson, CFO CONTINUED IMPROVED EARNINGS Good demand in the quarter driven by leisure Sales growth of 23% fueled by more rooms in operation and currency effects Like-for-like
OPERATING AND FINANCIAL HIGHLIGHTS. Subsequent Events
 Copa Holdings Reports Net Income of $103.8 million and EPS of $2.45 for the Third Quarter of 2017 Excluding special items, adjusted net income came in at $100.8 million, or EPS of $2.38 per share Panama
1Q13 R sults esentation
 1Q13 Results Presentation 14 May 2013 Disclaimer The presentation is dated the day it is given. The delivery of this presentation shall not, under any circumstances, create any implication that there has
MGM Resorts International Reports Second Quarter Financial Results
 NEWS RELEASE MGM Resorts International Reports Second Quarter Financial Results 8/5/2014 Consolidated Adjusted EBITDA Increased 8%, Led By 10% Growth In Wholly Owned Domestic Resorts MGM China Declares
Thailand --- A Preferred FDI Destination. Thailand. Political stability. Skilled workforce. Business friendly. Sustained economic growth
 Thailand --- A Preferred FDI Destination Global FDI Rankings Skilled workforce India Welcoming culture Tax & other incentives Political stability Thailand Indonesia Malaysia Singapore China Vietnam Strategic
Talaat Moustafa Group Holding 1Q08 Results Earnings Release
 Talaat Moustafa Group Holding Results Earnings Release Cairo, April 13 th 08 Talaat Moustafa Group Holding ( TMG Holding ) the leading Egyptian community real estate developer with over years of experience,
Q Earnings Financial Results for the First Quarter Ended June 30, July 28, 2016 OMRON Corporation
 Q1 2016 Earnings Financial Results for the First Quarter Ended June 30, 2016 July 28, 2016 OMRON Corporation Summary Q1 Results Both sales and operating income are in line with internal plan (decreased
Analysts and Investors conference call. Q results. 15 May 2013
 Analysts and Investors conference call Q1 2013 results 15 May 2013 Management summary Key messages of Q1 2013 +6% +9% +3.3%p. Q1 2013 operational KPIs are in line with 109.7 116.2 6.5 7.1 82.3 85.6 expectations,
AMATA VN Public Company Limited
 AMATA VN Public Company Limited Welcome to Opportunity Day Financial Performance Results for the 3 months period ended March 31, 2018 Disclaimer This document was prepared by Amata VN Public Company Limited
Crown Resorts Limited
 Crown Resorts Limited 2016 Half Year Results Presentation 25 February 2016 1 Crown Resorts Limited Results Overview Crown Resorts Limited (Crown) performance: The 2016 First Half results across Crown s
Copa Holdings Reports Net Income of $136.5 million and EPS of $3.22 for the First Quarter of 2018
 Copa Holdings Reports Net Income of $136.5 million and EPS of $3.22 for the First Quarter of 2018 May 9, 2018 PANAMA CITY, May 9, 2018 /PRNewswire/ -- Copa Holdings, S.A. (NYSE: CPA), today announced financial
Quarterly Meeting# 1/2018
 Quarterly Meeting# 1/2018 4Q17 & FY17 Performance & Outlook 2 March 2018 1 2016 ERAWAN. All rights reserved. The views expressed here contain some information derived from publicly available sources that
Indiabulls Real Estate Limited (CIN : L45101DL2006PLC148314)
") Indiabulls Real Estate Limited (CIN : L45101DL2006PLC148314) Earnings Update Audited Financial Results FY 2013-14 April 23, 2014 Safe Harbor Statement This document contains certain forward looking statements
Indiabulls Real Estate Limited (CIN : L45101DL2006PLC148314) Earnings Update Audited Financial Results FY 2013-14 April 23, 2014 Safe Harbor Statement This document contains certain forward looking statements
1 st Quarter Results FY
 1 st Quarter Results FY 2004-05 05 Q1 Highlights p Context 8Improving economic context 8Strong economic growth in Americas and Asia 8Modest economic recovery in Europe 8Soaring fuel prices 8IPE Brent up
Investor update presentation. August 2016
 Investor update presentation August 2016 Content Update on Q2 2016 financial performance 4-8 Update on hospitality projects 10-11 Update on E-commerce businesses 13-16 2 Section 1 Update on Q2 2016 financial
Quarterly Highlight. Company Overview
 MBK Public Company Limited Key Performance 1H 2012 1 Disclaimer This presentation is made, furnished and distributed for information purposes only. Nothing in this release should be construed as either
Air Berlin PLC Frankfurt, 29 August 2012 DVFA Small Cap Conference
 Air Berlin PLC Frankfurt, 29 August 2012 DVFA Small Cap Conference 2012 is the transition year business transformation airberlin on its journey to sharpen its profile in the scheduled business Shape &
Norwegian Air Shuttle ASA
 Norwegian Air Shuttle ASA Q1 2018 Presentation 26 April 2018 Highlights Q1 2018 Successfully completed private placement of NOK 1.3 billion Added two 737-800s and six 787-9s to operations Launched interline
Ref. PE004/ May Subject: Management Discussion and Analysis for the First Quarter of 2018
 Ref. PE004/2561 10 May 2018 Subject: Management Discussion and Analysis for the First Quarter of 2018 Attention: President The Stock Exchange of Thailand According to the financial reports of Nok Airlines
Investor update presentation. November 2016
 Investor update presentation November 2016 Content Update on Q3 2016 financial performance 3-8 Recap on ATG Evolution 9-10 Update on hospitality strategic business unit 11-14 Update on online travel and
Lead pic. Report on the first quarter of 2018
 Lead pic. Report on the first quarter of 2018! Operational Highlights Purchase and sale of properties in Budapest - Acquisition of B52 Office - Sale of Ülloi land plot Early redemption of convertible bonds
Consolidated Statement of Financial Position as at December 31, 2017
 86 Key Figures Consolidated Statement of Financial Position as at December 31, 2017 Assets in million December 31, 2017 December 31, 2016 Non-current assets Goodwill 19.3 19.3 Investments in airport operating
Copa Holdings Reports Net Income of $49.9 million and EPS of $1.18 for the Second Quarter of 2018
 Copa Holdings Reports Net Income of $49.9 million and EPS of $1.18 for the Second Quarter of 2018 Panama City, Panama --- Aug 8, 2018. Copa Holdings, S.A. (NYSE: CPA), today announced financial results
United Continental Holdings, Inc (NYSE: UAL) ONE YEAR PRICE RANGE : $ LAST PRICE: $ ANALYST RATING: Sell
 ONE YEAR PRICE RANGE : $ LAST PRICE: $ ANALYST RATING: Sell") United Continental Holdings, Inc (NYSE: UAL) ONE YEAR PRICE RANGE : $61.91 68.76 LAST PRICE: $68.39 ANALYST RATING: Sell VALUATION DATE: August 3, 2017 NEXT EARNINGS DATE: October 17, 2017 Investment Thesis:
United Continental Holdings, Inc (NYSE: UAL) ONE YEAR PRICE RANGE : $61.91 68.76 LAST PRICE: $68.39 ANALYST RATING: Sell VALUATION DATE: August 3, 2017 NEXT EARNINGS DATE: October 17, 2017 Investment Thesis:
Finnair Group Annual Report 1 January 31 December 2006
 Finnair Group Annual Report 1 January 31 December 2006 2006: A year for restructuring Scheduled Passenger Traffic transforming to meet Asian traffic demands Labour negotiations to cut 670 jobs 80 million
JAPAN AIRLINES Financial Results 2 nd Quarter Mar / 2014 (FY2013)
") JAPAN AIRLINES Financial Results 2 nd Quarter Mar / 2014 (FY2013) Yoshiharu Ueki, President Norikazu Saito, Managing Executive Officer 31 October, 2013 Contents P.2 P.3 P.4 P.6 1 Overview of 2 nd Quarter
JAPAN AIRLINES Financial Results 2 nd Quarter Mar / 2014 (FY2013) Yoshiharu Ueki, President Norikazu Saito, Managing Executive Officer 31 October, 2013 Contents P.2 P.3 P.4 P.6 1 Overview of 2 nd Quarter
Flughafen Wien Group Maintains Upward Trend: Passenger Growth and Strong Earnings Improvement in the First Nine Months of 2016
 Flughafen Wien Group Maintains Upward Trend: Passenger Growth and Strong Earnings Improvement in the First Nine Months of 2016 REVENUE increase to 545.4 million (+10.2%), EBITDA rise to 306.5 million (+13.1%
THAI AIRWAYS INTERNATIONAL Pcl. Fiscal Year 2007
 THAI AIRWAYS INTERNATIONAL Pcl. Fiscal Year 2007 (Oct 06-Sep 07) Relations Department Investor Relations Investor Relations Table of Contents 1. The Company 2. Statistic Information 3. Current Issue 4.
VR Group s result for 2018 was excellent rail traffic volumes increased
 Press release 1 (5) VR Group s result for 2018 was excellent rail traffic volumes increased Financial details for 2018 presented in this press release are unaudited FAS figures. The figures in brackets
Presentation Results. 4th March 2016
 Presentation 4th March 2016 2015 Review Sound result in 2015 Continued strong performance from commercial portfolio Entry into Shanghai with prime mixed-use site Stable asset values 1 Highlights 2014 2015
JAPAN AIRLINES Co., Ltd. Financial Results 1 st Quarter Mar/2017(FY2016) July 29, 2016
 July 29, 2016") JAPAN AIRLINES Co., Ltd. Financial Results Mar/2017(FY2016) July 29, 2016 Today s Topics P.1 P.2 P.13 From the first quarter of this fiscal year, figures for Revenue Passengers Carried, ASK, RPK and Load
JAPAN AIRLINES Co., Ltd. Financial Results Mar/2017(FY2016) July 29, 2016 Today s Topics P.1 P.2 P.13 From the first quarter of this fiscal year, figures for Revenue Passengers Carried, ASK, RPK and Load
Finnair 2015 kolmannen vuosineljänneksen tulos
 Finnair 215 kolmannen vuosineljänneksen tulos Q3 Result 215 3 October 215 3.1.215 Toimitusjohtaja Pekka Vauramo Talousjohtaja Pekka Vähähyyppä 1 Highlights of the quarter Excellent Q3 result: Record result
Annual Results for the year ended 28 February 2015
 Annual Results for the year ended 28 February 2015 AGENDA OVERVIEW PROPERTY UNITED KINGDOM PROPERTY DEVELOPMENT AFRICA FINANCIAL SERVICES FINANCIAL REVIEW LOOKING AHEAD Q & A ANNUAL RESULTS FOR THE YEAR
CENTRALPLAZA NAKHON SI THAMMARAT SUK NAKHON
 Factsheet CENTRALPLAZA NAKHON SI THAMMARAT SUK NAKHON CentralPlaza Nakhon Si Thammarat, CPN s 30 th shopping complex with the investment value of over 1.8 MB on the gross area of approximately 125,000
Finnair Q Result
 17 August 2016 CEO Pekka Vauramo CFO Pekka Vähähyyppä Finnair Q2 2016 Result 1 Highlights of the second quarter The seventh consecutive quarter of profit improvement Fukuoka & Guangzhou route openings
FIRST QUARTER RESULTS 2017
 FIRST QUARTER RESULTS 2017 KEY RESULTS In the 1Q17 Interjet total revenues added $4,421.5 million pesos that represented an increase of 14.8% over the income generated in the 1Q16. In the 1Q17, operating
Quarterly Meeting# 2/2017
 Quarterly Meeting# 2/2017 1Q17 Performance & Outlook 16 May 2017 1 2017 ERAWAN. All rights reserved. The views expressed here contain some information derived from publicly available sources that have
 1 2 23 24 15 16 7 8 9 Ancillary Revenue target per pax RM55 10 Online 365 11 212 13 14 14 Quarter Ended: 31 March RM'000 Revenue 2,068,227 Operating expenses: - Staff costs (286,663) - Depreciation
FIRST HALF RESULTS SFAF MEETING, 27 SEPTEMBER 2017
 FIRST HALF RESULTS SFAF MEETING, 27 SEPTEMBER 2017 2017 CONTENTS 1. Patrimoine & Commerce Pursuing development over the 1 st half of 2017 2. Patrimoine & Commerce Reinforcing value-oriented SIIC status
Half-yearly results presentation. 8 November 2012
 Half-yearly results presentation 8 November 2012 Land Securities half-yearly results Introduction Robert Noel Financial results Martin Greenslade Retail Portfolio Richard Akers London Portfolio and outlook
Analyst and Investor Conference Call Q Ulrik Svensson, CFO and Member of the Executive Board
 Analyst and Investor Conference Call Q2 2017 Ulrik Svensson, CFO and Member of the Executive Board Frankfurt, 2 August 2017 Disclaimer The information herein is based on publicly available information.
2006 INTERIM ANNOUNCEMENT
 (Stock Code: 78) 2006 INTERIM ANNOUNCEMENT FINANCIAL HIGHLIGHTS Six months ended 30th June, 2006 (Unaudited) Six months ended 30th June, 2005 % Change (Unaudited) HK$ M HK$ M Revenue 608.3 542.4 +12.1%
SAS Group Presentation Carnegie, May 22, 2012 Sture Stölen, Head of IR
 SAS Group Presentation Carnegie, May 22, 2012 Sture Stölen, Head of IR 1 This is the SAS Group 128 destinations 27,2 million passengers 28 new routes to be launched 2012 1,085 daily flights Revenues 2011,
Ramsay Health Care Limited Results Briefing Half Year ended 31 December 2018
 Ramsay Health Care Limited Results Briefing Half Year ended 31 December 2018 Craig McNally, Group Managing Director & Bruce Soden, Group Finance Director 28 February 2019 ramsayhealth.com Agenda Group
AGENDA. Group overview. Financial highlights. Operational highlights. Expansion plans
 1 AGENDA Group overview Financial highlights Operational highlights Expansion plans 2 3 CURRENT FOOTPRINT Kenya 12 stores 2 DCs Tanzania 2 stores Number of stores 31-Dec-16 31-Dec-17 Increase: Dec-16 to
Schiphol Group. Annual Report
 Schiphol Group Annual Report 2013 Business model Business model Schiphol Group distinguishes four core activities: Aviation, Consumer Products and Services, Real Estate, and Alliances and Participations.
OPERATING AND FINANCIAL HIGHLIGHTS
 Copa Holdings Reports Financial Results for the Fourth Quarter of 2018 Excluding special items, adjusted net profit came in at $44.0 million, or Adjusted EPS of $1.04 Panama City, Panama --- February 13,
Crown Resorts Limited
 Crown Resorts Limited 2015 Full Year Results Presentation 13 August 2015 1 Crown Resorts Limited Results Overview Crown Resorts Limited (Crown) performance: Overall, the results for Crown s portfolio of