Results presentation. December 2012
|
|
|
- Josephine Greene
- 5 years ago
- Views:
Transcription
1 Results presentation December
2 Introduction A Romanian focused property investment company Distribute dividends (or return of capital & share subscription) on a semi-annual basis Focus on properties with long term multinational leases in Euro In-house property management, asset management, property investment & property development in an integrated approach 12.15% naca growth in distribution per share since
3 Romania Macro economic Low 2012 growth due to EU slow-down and drought Stable economic outlook Election year Key indicators Real GDP growth (%) General gov. budget balance (% of GDP) (2.2) (2.4) (2.3) (2.2) (2.2) (2.1) General gov. debt (% of GDP) Unemployment (%) Price inflation (%) *Source: EIU January
4 Highlights Distribution per share 15.0% Recurring distributable income per share 12.6% Adjusted NAV per share 18.5% No. of shareholders 79.0% Cost : income ratio 11.7% Conclusion of office acquisition Completion of major retail development Expansion of development pipeline 4
5 General strategy The relationship between retained distributable earnings, property developments, cash holdings & distribution growth per share Listed securities Retail regional dominance Office A-grade in prime locations, cities with significant multi-national tenant presence Increase in scale Expansion beyond Romania 5
6 Financial performance Distribution per share ( cents) Adjusted NAV per share 31 Dec Jun Dec Jun Dec Jun Gearing* 25.0% 33.9% 32.1% 41.9% 49.0% 42.3% Shares in issue Property portfolio analysis % by gross rental % by value % by area Retail 49% 50% 52% Office 46% 46% 38% Industrial 5% 4% 10% * (Debt cash) / investment property + listed securities 6
7 Interest rate hedge position 6% 5% 4% 3% 2% 1% 0% 5 year SWAP 3month Euribor CAP SWAP Jun Dec Jun Dec Jun Dec Jun Dec Jun 2010 Dec Jun 2011 Dec Jun 2012 Dec 2.5% 2.0% 1.5% 1.0% 0.5% 0.0% Yield Curve SWAP rate Cap rate


 BRD BCR")


8 Debt repayment profile million Bank loans reimbursement schedule Alpha Bank Morgan Stanley (listed shares facility) BRD BCR Investkredit Eurohypo Nord LB KBC Bank Unicredit/Banca Romaneasca Raiffeisen and beyond 8


9 Contracted rent profile per sector million Expiry profile contractual rental income Retail Office Industrial Tenant profile contractual rental income 80% 5% 15% Type A Type B Type C Weighted average duration of 6.5 years 9
10 Operational performance Receivables Vacancies Renewals Retail Office Industrial 10
11 Completed property initiatives 11

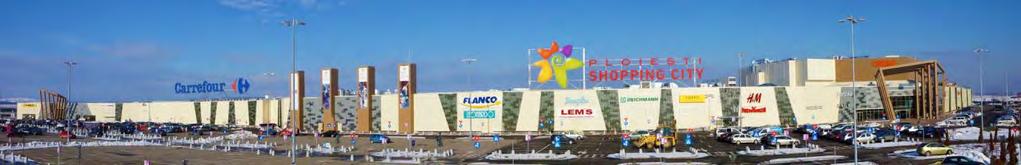

12 Ploiesti Shopping City 12


13 Ploiesti Shopping City 13

14 Ploiesti Shopping City 14

15 Ploiesti Shopping City 15

16 Ploiesti Shopping City 16

17 Ploiesti Shopping City 17

18 Ploiesti Shopping City 18

19 Ploiesti Shopping City 19

20 Ploiesti Shopping City 20


21 Promenada Mall Braila 21
")
22 City Business Centre acquisition (Timisoara) 22
23 Ongoing property initiatives 23 23

24 Brasov Shopping City 24


25 Brasov Shopping City EXISTING ADDED TOTAL Fashion & Food & Home & Services Accessories Entertainment Decoration Hyper Adjacent Retail Parking 4,850m² 60m² 1,200m² 8,600m² 14,700m² 13,200m² 1,300bays 25,550m² 6,940m² 500m² 2,400m² bays 30,400m² 7,000m² 1,700m² 11,000m² 14,700m² 13,200m² 2,100bays TOTAL GLA 42,610m² 35,390m² 78,000m² 13 screens UPPER FLOOR BASEMENT PARKING 25


26 Galati Shopping City 26


27 Galati Shopping City Galati 27

28 Galati Shopping City HYPERMARKET HYPER GALLERY SHOPPING MALL PHASE I SHOPPING MALL PHASE II + Upper TOTAL GLA PARKING 13,000 m² 3,000 m² 14,000 m² 17,000 m² 47,000 m² 1,800 bays 28


29 Vulcan Value Centre - Bucharest Vulcan 29


30 Vulcan Value Centre - Bucharest 30

31 Vulcan Value Centre - Bucharest 31


32 Kaufland Value Extensions - Sf Gheorghe 32

33 City Business Centre - Building D 33

34 City Business Centre - Building D 34


35 The Office Cluj-Napoca Railway Station Intl Airport The Office Business Centre Old City Centre Cluj-Napoca 35

36 The Office Cluj-Napoca 36

37 The Office Cluj-Napoca 37


38 The Lakeview - Bucharest 38
39 Prospects 39 39
40 Investment pipeline Two retail development opportunities (Romania) Two retail acquisition opportunities (Romania) with extension potential Retail acquisition opportunities in Central Europe (outside Romania) 40


41 Questions & Answers 41
SUMMARISED CONSOLIDATED RESULTS FOR THE YEAR ENDED 30 JUNE 2017 STRATEGIC & OPERATIONAL OVERVIEW. Hyde Park Corner (Gauteng)
") SUMMARISED CONSOLIDATED RESULTS FOR THE YEAR ENDED 30 JUNE 2017 STRATEGIC & OPERATIONAL OVERVIEW Hyde Park Corner (Gauteng) 2 1 Strategy Invested in South-Africa, sub-saharan Africa and South-Eastern Europe
SUMMARISED CONSOLIDATED RESULTS FOR THE YEAR ENDED 30 JUNE 2017 STRATEGIC & OPERATIONAL OVERVIEW Hyde Park Corner (Gauteng) 2 1 Strategy Invested in South-Africa, sub-saharan Africa and South-Eastern Europe
Presentation Results. 4th March 2016
 Presentation 4th March 2016 2015 Review Sound result in 2015 Continued strong performance from commercial portfolio Entry into Shanghai with prime mixed-use site Stable asset values 1 Highlights 2014 2015
RESULTS PRESENTATION 30 JUNE 2016
 RESULTS PRESENTATION 30 JUNE 2016 RESULTS PRESENTATION 30 JUNE 2016 1 Company profile Leading property investment and development group in the CEE. Largest retail owner and operator in Romania. Exceptional
2017 Half-Yearly Results
 2017 Half-Yearly Results Presentation 4th August 2017 Agenda Speakers: Robert Wong, Chief Executive & Simon Dixon, Chief Financial Officer 1. 2017 Half-Yearly Highlights 2. Investment Properties 3. Development
Annual Results for the year ended 28 February 2015
 Annual Results for the year ended 28 February 2015 AGENDA OVERVIEW PROPERTY UNITED KINGDOM PROPERTY DEVELOPMENT AFRICA FINANCIAL SERVICES FINANCIAL REVIEW LOOKING AHEAD Q & A ANNUAL RESULTS FOR THE YEAR
Portfolio. income at ANZ income was up. With. first-half. share
 NZX and media announcement 19 February 2013 Precinct announces improvedi result and positive outlook Performance for six months to 31 December 2012 Financial Performance Net profit after tax: $23.6 millionn
Bucharest City Report Q3 2015
 City Report Retail Sales Jan - Sep 2015 y-o-y GDP Growth H1 2015 Unemployment Rate August 2015 Economy / Investment Economy Inflation 3.8% Sep. 2015 / Sep. 6.8% 5.8% R O N -1.73% Exports / Imports Jan.
Positive rental reversions in Hong Kong portfolio. Rising contribution from Singapore office portfolio. Strong performance from Residential business
 2012 Review The Group performed well in 2012 Positive rental reversions in Hong Kong portfolio Rising contribution from Singapore office portfolio Strong performance from Residential business 2 Highlights
Bucharest City Report Q1 2015
 City Report Retail Sales y-o-y Construction Works (first 2 months 2015 y-o-y) GDP Growth Unemployment Rate (March 2015) Economy / Investment Economy Macroeconomic Overview 4.3% Inflation (Mar. 2015 / Mar.
Sofia City Report H City Reports
 Sofia City Report H1 2016 City Reports Gross Salary Q1 Economy & Investment GDP growth Q1 y-o-y 2.9% 650 Inflation May y-o-y - 2.0% Unemployment Rate Q1 8.6% Source: National Statistical Institute of Republic
Investor presentation FY 2011 results
 Investor presentation FY 2011 results Recent highlights Itakeskus refurb & extension scaled up extension 11.000 sqm in total; anchor tenant will relocate (to Piazza); investment volume 90m, YoC 6.0-6.5%
2016 Half-Yearly Results
 Presentation 29th July 2016 2016 Half-Yearly Review Underlying profit down 6% Commercial portfolio benefited from higher occupancy Steady contribution from mainland China residential business Profit attributable
SIAM FUTURE DEVELOPMENT PUBLIC CO., LTD. Corporate Presentation Q4-15
 SIAM FUTURE DEVELOPMENT PUBLIC CO., LTD. Corporate Presentation Q4-15 Overview Financial Summary Project Update 2 Overview Founded: 1994 Staff: 80 Centers: 22 Vision Unlike other developers, we create
Forward-Looking Statements Statements in this presentation that are not historical facts are "forward-looking" statements and "safe harbor
 2017 Annual Meeting of Shareholders Presentation May 2017 Forward-Looking Statements Statements in this presentation that are not historical facts are "forward-looking" statements and "safe harbor statements"
STRATEGIC & OPERATIONAL OVERVIEW. Condensed consolidated interim results for the six months ended 31 December 2017
 Condensed consolidated interim results for the six months ended 31 December 2017 30 years of property investment excellence STRATEGIC & OPERATIONAL OVERVIEW Clearwater Mall (Roodepoort, Gauteng) 2 1 Strategy
Operational activities
 Interim statement of the Statutory Management Company 31 March 2015 Increased rental income of 11.6 mln (2014: 9.1 mln) Value real estate portfolio, including development projects: 751.1 mln Start construction
ARSN Interim Report Responsible Entity Brookfield Capital Management Limited ACN AFSL
 Brookfield Prime Property Fund ARSN 110 096 663 Interim Report 2015 Responsible Entity Brookfield Capital Management Limited ACN 094 936 866 AFSL 223809 1 Message from the Chairman 2 Half Year Review 5
Euroz Rottnest Investor Briefing
 Cedar Woods Properties Limited Euroz Rottnest Investor Briefing 15 March 2016 Cedar Woods Presentation 2 Snapshot of Achievements in FY2016 Extensive portfolio of residential estates in Perth and WA regions,
SIAM FUTURE DEVELOPMENT PUBLIC CO., LTD. Corporate Presentation 2016
 SIAM FUTURE DEVELOPMENT PUBLIC CO., LTD. Corporate Presentation 2016 Overview Financial Summary Project Update 2 Overview Founded: 1994 Staff: 78 Centers: 22 Vision Unlike other developers, we create a
AIRBUS. H Roadshow Presentation. July 2018
 AIRBUS H1 2018 Roadshow Presentation July 2018 H1 18 HIGHLIGHTS 2 Robust commercial aircraft environment Backlog of ~7,200 a/c underpins ramp-up plans H1 financials reflect mainly A350 performance and
Belgrade City Report Q City Reports
 Belgrade City Report Q2 2016 City Reports GDP Growth Q1 (y-o-y) Net Salary May Economy & Investment Economics 3.5% Inflation May y-o-y 0.7% 452 Unemployment Rate Q1 19% Retail Sales Index April y-o-y 7.4%
Press Release Regulated Information. Trading Update
 Press Release Regulated Information Trading Update 11 May 2018 7.00 a.m. CET, Diegem (Belgium): VGP NV ( VGP or the Group ) today publishes its trading update for the period from 1 January 2018 to 10 May
Lippo Malls Indonesia Retail Trust 4Q 2016 Results Presentation
 Lippo Malls Indonesia Retail Trust 4Q 2016 Results Presentation 15 February 2017 Disclaimer Certain statements in this presentation concerning our future growth prospects are forward-looking statements,
SAS Q3 2017/ August 2018
 SAS Q3 2017/2018 31 August 2018 Strong earnings in peak season POSITIVES Record number of passengers Total revenue up MSEK 936 vs. LY Currency adjusted yield up 1.1% vs. LY EB point sale up 27% vs. LY
Finnair Q Result
 17 August 2016 CEO Pekka Vauramo CFO Pekka Vähähyyppä Finnair Q2 2016 Result 1 Highlights of the second quarter The seventh consecutive quarter of profit improvement Fukuoka & Guangzhou route openings
2008 INTERIM ANNOUNCEMENT
 (Stock Code: 78) 2008 INTERIM ANNOUNCEMENT FINANCIAL HIGHLIGHTS Six months ended 30th June, 2008 (Unaudited) Six months ended 30th June, 2007 (Unaudited) HK$ M HK$ M Revenue 750.8 622.0 Operating profit
Frasers Commercial Trust. Portfolio details as at 31 March 2018
 Frasers Commercial Trust Portfolio details as at 31 March 2018 20 April 2018 Portfolio Composition 2 Asset values Total: S$2,219.2 million as at 31 March 2018^ Singapore: S$1,226.0 million (55%) Australia:
2017 Results 2018 Half-Yearly Results
 2017 Results 2018 Half-Yearly Results Presentation Presentation 27 July 2018 Agenda Speakers: Robert Wong, Chief Executive & Simon Dixon, Chief Financial Officer 1. 2018 Half-Yearly Highlights 2. Investment
Act 2. Analyst Meeting 27 July 2016
 Act 2 Analyst Meeting 27 July 2016 1 Contents 1. Highlights Page 3 2. Portfolio Page 10 3. Finance Page 26 2 Highlights July 2016 3 Highlights Main financial indicators Gross Rental Income +11% EBITDA
The Property Franchise Group
 The Property Franchise Group Capital Markets Event 22 October 2015 This afternoon s agenda 2 15:15 Welcome Richard Martin, Chairman 15:20 Introduction to MartinCo PLC Ian Wilson, Chief Executive Officer
Executive Directors Review
 Financial Summary Turnover for the year ended 31 December 2011 amounted to HK$571.4 million ( 47.6 million) (2010: HK$706.8 million ( 58.7 million)). The turnover was principally attributable to the recognition
2005 year-end results presentation March 2006
 2005 year-end results presentation March 2006 2005 Key Points Twofold increase in portfolio and share capital Execution of business plan Commitments in first half 2005 : 105 M Acquisition of Locafimo in
Finnair Q Result
 Finnair Q1 2015 Result 7 May 2015 CEO Pekka Vauramo, Interim CFO Mika Stirkkinen 1 Turbulent market environment The weakness of the Finnish economy continued to be reflected in the demand in the first
Frasers Commercial Trust. Portfolio details as at 30 June 2018
 Frasers Commercial Trust Portfolio details as at 30 June 2018 25 July 2018 Portfolio Composition 2 Asset values Total: S$2,242.9 million as at 30 June 2018^ Singapore: S$1,239.6 million (55%) Australia:
Annual General Meeting. 20 April 2011
 Annual General Meeting 20 April 2011 Presentation outline 1 FY2010 in review 2 Financial highlights 3 Looking ahead 2 1. FY2010 in review A strident leap forward December 2010 Recent acquisitions in Indonesia:
JOINTLY ANNOUNCES 2017/18 INTERIM RESULTS * * * RENTAL INCOME SURGES 25% STRENGTHS RECURRING INCOME STREAMS FOR SUSTAINABLE GROWTH
 [For Immediate Release] JOINTLY ANNOUNCES 2017/18 INTERIM RESULTS * * * RENTAL INCOME SURGES 25% STRENGTHS RECURRING INCOME STREAMS FOR SUSTAINABLE GROWTH (Hong Kong, 23 November, 2017) Emperor International
Belgrade City Report Q City Reports
 Belgrade City Report City Reports GDP Growth Q4 (y-o-y) Net Salary February Economy / Investment Economics 1.2% Inflation February (y-o-y) 1.5% 450 Unemployment Rate Q4 18.5% Retail Sales Index February
Full go towards year end
 Beni Stabili: 9-month 2017 rents Full go towards year end Milan: October 24 th, 2017 Growth in operating metrics 1.5% L-f-L rental growth excl. TI assets 95.5% financial occupancy 93.1% excluding TI portfolio
FIRST HALF RESULTS SFAF MEETING, 27 SEPTEMBER 2017
 FIRST HALF RESULTS SFAF MEETING, 27 SEPTEMBER 2017 2017 CONTENTS 1. Patrimoine & Commerce Pursuing development over the 1 st half of 2017 2. Patrimoine & Commerce Reinforcing value-oriented SIIC status
Bordeaux portfolio: venues for premium shopping. Benjamin Blossier, Director Asset management & Investments 1 October 2013
 Bordeaux portfolio: venues for premium shopping Benjamin Blossier, Director Asset management & Investments 1 October 2013 1 Bordeaux in a nutshell: a perfect fit for our high street portfolio Bordeaux:
Siam Future Development PLC
 Siam Future Development PLC 1 Content Company & Business Overview Project Operations & Development Financial Summary 2 Company & Business Overview 3 Company Overview 1994: Founded by two former Siam Cement
Press release February 21, 2014
 Press release February 21, 2014 2013 earnings Recurrent ent net income per share up +1.2%, with NAV per share growth of +1.7% Significant improvement in the financial occupancy rate and rental margin Recurrent
I. Main events during H1 2016/2017
 Paris, 30 May 2017 First-half results affected by heightened seasonal factors in the tourism and property development businesses and costs associated with the delivery of Villages Nature; Target confirmed
Singapore. 23 October 2007
 Raffles Raffles City City Acquisition Singapore 23 October 2007 1 3Q 2007 - RCS Trust Actual S$'000 1 Jan 2007 to 30 Sep 2007 CCT's 60% Interest RCS Trust Forecast 1 S$'000 Var. % Actual S$'000 Gross Revenue
Financial Results for the year ended December January Results Overview Capital Management Portfolio Performance AEIs Strategy
 Financial Results for the year ended December 2018 28 January 2019 Results Overview Capital Management Portfolio Performance AEIs Strategy FY2018 Key Highlights Financial Performance Portfolio Performance
2017 Results. Presentation. 9 March 2018
 2017 Results Presentation 9 March 2018 Agenda Speakers: Robert Wong, Chief Executive & Simon Dixon, Chief Financial Officer 1. 2017 Results Highlights 2. Investment Properties 3. Development Properties
Cebu Air, Inc. Annual Stockholders Briefing. 24 June cebupacificair.com
 Cebu Air, Inc. Annual Stockholders Briefing 24 June 2015 cebupacificair.com Business Updates Passengers (M) Operating Statistics 2014: Passenger traffic grew 17.5% to 16.9M. Seat capacity grew 14.8% to
Frasers Commercial Trust. Portfolio details as at 30 September 2018
 Frasers Commercial Trust Portfolio details as at 30 September 2018 19 October 2018 Portfolio Composition 2 Asset values Total: S$2,133.5 million as at 30 September 2018^ Singapore: S$1,140.4 million (54%)
4.5% 1.4% 14.3% Inflation March 2018 y-o-y. Retail Sales, March 2018 y-o-y
 City Report Q1 2018 4.5% 1.4% 14.3% GDP Growth Q1 2018 y-o-y Inflation March 2018 y-o-y Unemployment rate Q4 2017, Belgrade 494 2.2% 4.1% Net Salary February 2018, Belgrade Retail Sales, March 2018 y-o-y
MARKETBEAT RETAIL SNAPSHOT
 Bil US$ MARKETBEAT RETAIL SNAPSHOT LAS VEGAS, NV A Cushman & Wakefield Research Publication Q4 2014 NATIONAL ECONOMIC OVERVIEW Like Floyd Mayweather in the final round of a championship match, the U.S
Dalata Hotel Group Strategy Update. Dermot Crowley, Deputy CEO, Business Dev & Finance
 Dalata Hotel Group Strategy Update Dermot Crowley, Deputy CEO, Business Dev & Finance The Value Proposition in March 2014 POSITIVE OUTLOOK FOR DEMAND Positive outlook for increased number of international
GOING PLACES MACARTHURCOOK OFFICE PROPERTY TRUST
 GOING PLACES MACARTHURCOOK OFFICE PROPERTY TRUST ANNUAL REPORT 2006 1 2 3 4 1 2 181 Miller Street, North Sydney, NSW 150 170 Leichhardt Street, Spring Hill, Brisbane, QLD 3 4 38 Akuna Street, Canberra,
Information meeting. 12 September 2011
 Information meeting 12 September 2011 Full Year 2010-11 key data April 2010-March 2011 Revenues in billions Operating result in millions 77% Passenger 18.10 +11.3% -44 +874 13% Cargo 3.16 +29.5% +69 +505
PCT delivers strong profit result and launches One Queen Street
 NZX announcement 16 August 2018 PCT delivers strong profit result and launches One Queen Street Performance summary for the 12 months ended 30 June 2018 Delivering strong results Net profit after tax increased
CapitaLand Limited. Acquisition Of 94.9% Interest In Main Airport Center in Frankfurt, Germany
 CapitaLand Limited Acquisition Of 94.9% Interest In Main Airport Center in Frankfurt, Germany 28 December 2017 Disclaimer This presentation may contain forward-looking statements that involve risks and
FY2016 Financial Results
 Cedar Woods Properties Limited FY2016 Financial Results 25 August 2016 Cedar Woods Presentation 2 Agenda 1 Company Overview 2 FY16 Financial Highlights 3 Operational Overview 4 Market Conditions 5 Company
2018 full-year results
 2018 full-year results 01 Message from Chairman & CEO 02 FY 2018 Results 03 Business drivers 04 Outlook 02 FY 2018 financial results Key figures Revenue 2.85 Bn ROP 115 M Net debt 252 M Free cash flow
Financial Review. Changing the Game
 Financial Review Changing the Game 1 $7,238 +8.1% Revenue (1) $ Millions $7,824 $10,095 30-Sep-05 30-Sep-06 12 Months Ended Sept. 9 months ended 30, 2006 2 8.1% revenue growth achieved with only 3.8% ASM
QUARTERLY UPDATE 31 MARCH 2017
 AUSTRALIAN PROPERTY OPPORTUNITIES FUND QUARTERLY UPDATE 31 MARCH 2017 The Australian Property Opportunities Fund (APOF I or the Fund) is pleased to provide this update for the March quarter 2017 (Q1 2017)
Freehold Investment For Sale
 29-31 George Street Croydon Surrey CR0 1LB Retail / office investment opportunity with future development potential subject to vacant possession of the upper parts and necessary consents Multi-let to 4
2012 Full Year Results Briefing. 28 February 2013
 2012 Full Year Results Briefing 28 February 2013 1 KEY FINANCIALS & STRATEGY BUSINESS REVIEW OUTLOOK Q&A 2 UOL GROUP LIMITED KEY FINANCIALS & STRATEGY GWEE LIAN KHENG GROUP CHIEF EXECUTIVE 3 S$m FY 2012
Ramsay Health Care Limited Results Briefing Half Year ended 31 December 2018
 Ramsay Health Care Limited Results Briefing Half Year ended 31 December 2018 Craig McNally, Group Managing Director & Bruce Soden, Group Finance Director 28 February 2019 ramsayhealth.com Agenda Group
Heathrow (SP) Limited
 Limited") Draft v2.0 10 Feb Heathrow (SP) Limited Results for year ended 31 December 2013 24 February 2014 Strong operational and financial performance in 2013 Passenger satisfaction at record high and over 72 million
Draft v2.0 10 Feb Heathrow (SP) Limited Results for year ended 31 December 2013 24 February 2014 Strong operational and financial performance in 2013 Passenger satisfaction at record high and over 72 million
1.2% 3.5% 13.2% Inflation May 2017 y-o-y. Retail Sales, May 2017 y-o-y
 City Report Q2 2017 1.2% 3.5% 13.2% GDP Growth Q1 2017 y-o-y Inflation May 2017 y-o-y Unemployment rate Q1 2017, Belgrade 489 11.1% 6.2% Net Salary May 2017, Belgrade Retail Sales, May 2017 y-o-y Industrial
FCOT Portfolio detail as at 30 September 2017
 FCOT Portfolio detail as at 30 September 2017 Portfolio Composition 2 Asset values Net property income TOTAL: S$2,070.9 million as at 30 September 2017^ Singapore: S$1,212.0 million (59%) Australia: S$858.9
Great Portland Estates Trading Update Strong Operational Performance
 Press Release 6 July 2017 Great Portland Estates Trading Update Strong Operational Performance Great Portland Estates plc ( GPE ) today publishes its trading update for the quarter to 30 June 2017. Continued
DEXUS Property Group (ASX: DXS) ASX release
 ASX release") 6 May 2013 DEXUS and DWPF to acquire strategic office investment in Perth DEXUS Property Group (DEXUS or DXS) and DEXUS Wholesale Property Fund (DWPF) today announced the joint acquisition of a strategic
6 May 2013 DEXUS and DWPF to acquire strategic office investment in Perth DEXUS Property Group (DEXUS or DXS) and DEXUS Wholesale Property Fund (DWPF) today announced the joint acquisition of a strategic
2010 Full Year Results Briefing. 22 February 2011
 2010 Full Year Results Briefing 22 February 2011 1 2010 IN SUMMARY RESULTS OVERVIEW PERFORMANCE REVIEW GOING FORWARD Q&A 2 UOL GROUP LIMITED 2010 IN SUMMARY RESULTS OVERVIEW GWEE LIAN KHENG GROUP CHIEF
Annual General Meeting May 3 rd FULL YEAR RESULTS DELIVERING OUR PROMISE
 Annual General Meeting May 3 rd 2018 2017 FULL YEAR RESULTS DELIVERING OUR PROMISE Key Value Drivers By focusing on our customers, our people, our brands and our growth strategy: We continue to outperform
Airline industry outlook remains fragile
 Airline industry outlook remains fragile June 2009 www.iata.org/economics To represent, lead and serve the airline industry Airline industry outlook remains fragile Green shoots starting to appear Recovery
MEDIA RELEASE JUST GROUP ACHIEVES FIRST HALF PROFIT INCREASE OF 25.2%
 MEDIA RELEASE 7 March 2006 JUST GROUP ACHIEVES FIRST HALF PROFIT INCREASE OF 25.2% Just Group today announced a record net profit of $36.4 million for the six months ending 28 January 2006, a rise of 25.2%.
Frasers Commercial Trust Non-deal roadshow in Hong Kong April 2016
 Frasers Commercial Trust Non-deal roadshow in Hong Kong 25-26 April 2016 Important notice Certain statements in this Presentation constitute forward-looking statements, including forward-looking financial
Australian Property Growth Fund
 Australian Property Growth Fund Presentation Overview 2006/07 Key Highlights Property Trust Assets Funds Management & Development Company Projects Future Projects 2006/07 Key Highlights Profit after tax
Fourth Quarter 2015 Financial Results
 Fourth Quarter 2015 Financial Results AerCap Holdings N.V. February 23, 2016 Disclaimer Incl. Forward Looking Statements & Safe Harbor This presentation contains certain statements, estimates and forecasts
01 Amadeus at a glance
 01 Amadeus at a glance 7 Amadeus Annual Report 2011 1.1 Company s origins and development Most people associate the birth of electronic commerce distribution with the arrival of the internet. In fact,
Unlocking potential SALES TEAM BRIEFING. Kaupthing Singer & Friedlander Capital Markets Ltd. Great Portland Estates plc Toby Courtauld Chief Executive
 Unlocking potential Unlocking potential SALES TEAM BRIEFING Kaupthing Singer & Friedlander Capital Markets Ltd Great Portland Estates plc Toby Courtauld Chief Executive Robert Noel Property Director 8
Regional REIT Limited. Several New Lettings Secured. Continuation of Capital Recycling Programme
 Regional REIT Limited Several New Lettings Secured. Continuation of Capital Recycling Programme PRESS RELEASE: Glasgow, 24 April 2017 Regional REIT, the UK regional office and industrial property focused
Phase 1 opening July 2009 Phase 2 opening Summer 2010 ARAD ROMANIA
 Phase 1 opening July 2009 Phase 2 opening Summer 2010 ARAD ROMANIA HIGHLIGHTS Ice Plaza will be the first shopping centre in Arad, Romania, supporting a local population of 250,000 people and a catchment
1.0% 3.6% 15.9% Inflation March 2017 y-o-y. Retail Sales,
 City Report Q1 2017 1.0% 3.6% 15.9% GDP Growth Q1 2017 Inflation March 2017 y-o-y Unemployment rate 2016, Belgrade 495 11.4% 0.9% Salary March 2017, Belgrade Retail Sales, March 2017 y-o-y, Serbia Industrial
Information meeting. September 2011
 Information meeting September 2011 Full Year 2010-11 key data April 2010-March 2011 Revenues in billions Operating result in millions 77% Passenger 18.10 +11.3% -44 +874 13% Cargo 3.16 +29.5% +69 +505
Charter Hall Long WALE REIT
 Electrolux, Beverley, South Australia Virgin Australia Head Office, Bowen Hills, Queensland Bunnings, South Mackay, Queensland 15 February 2018 Charter Hall Long WALE REIT FY18 Half Year Results Agenda
Mexico at a Glance. Toronto, December 2013
 Mexico at a Glance Toronto, December 2013 1990 1991 1992 1993 1994 1995 1996 1997 1998 1999 Billion Dollars 1990 s the land of opportunity but not for the faint of heart NAFTA Dynamic growth in the industrial
RESULTS PRESENTATION
 RESULTS PRESENTATION JUNE 2015 Company profile 3 Highlights 4 Financial performance 5 Cash management and debt 6 Operational highlights 7 Macroeconomic prospects 12 Mega Mall 15 Acquisitions, developments
Property Tour 26 June 2013
 Property Tour 26 June 2013 Successful Strategy is Delivering 1. Profitable developments - Completed 2 schemes - 100% pre-let - 51% profit on cost - Started 2 schemes - 12/14 New Fetter Lane, EC4 pre-let
2005 Interim Results. September 7, 2005
 2005 Interim Results September 7, 2005 Outline First-Half 2005 Results Business activity at August 31, 2005 Update on the Real Estate and Expansion Strategies 2 First-half 2005 +22.8% Solid growth in interim
2018 HALF-YEAR FINANCIAL INFORMATION
 2018 HALF-YEAR FINANCIAL INFORMATION CONTENTS - 1. Half-year management report at 30 June 2018.. p. 3-2. Condensed consolidated financial statements at 30 June 2018. p. 23-3. Statutory Auditors' report
The GPT Group today announced its operational update for the March 2017 quarter.
 THE GPT GROUP ANNOUNCES 27 April 2017 March Quarter Operational Update The GPT Group today announced its operational update for the March 2017 quarter. Key Highlights Retail specialty sales growth of 2.4
Q Fast growth continued, Comparable operating result at record high levels Pekka Vauramo
 2018 Fast growth continued, Comparable operating result at record high levels 17.7.2018 Pekka Vauramo 2 A good - Comparable operating result increased to new seasonal high Revenue Comparable operating
1 st ANNUAL GENERAL MEETING. 28 th SEPTEMBER 2017
 KIP Real Estate Investment Trust 1 st ANNUAL GENERAL MEETING 28 th SEPTEMBER 2017 CORPORATE MILESTONE Commencement of operations at KiP Mart Tampoi, Johor Bahru with total lettable area of 137,474 sq feet
Frasers Centrepoint Limited strengthens UK and Europe platform with acquisition of a high quality portfolio of business parks
 Frasers Centrepoint Limited strengthens UK and Europe platform with acquisition of a high quality portfolio of business parks Aggregate consideration of 686 million 1 for four business parks Entry into
SAS AB Q December 2018
 SAS AB Q4 2018 4 December 2018 Q4 financial highlights Q4 POSITIVES Q4-18 CHANGE VS. Q4-17 Record number of passengers Total revenue up SEK 1bn vs. LY Yield (nominal) up 5.1% vs. LY RASK (nominal) up 7.0%
CENTURION CORP ACHIEVES RECORD NET PROFIT OF S$31.1 MILLION FROM ITS CORE BUSINESS OPERATIONS FOR FY2014
 PRESS RELEASE For Immediate Release CENTURION CORP ACHIEVES RECORD NET PROFIT OF S$31.1 MILLION FROM ITS CORE BUSINESS OPERATIONS FOR FY2014 Highest ever revenue of S$84.4 million for FY2014 63% growth
2011 Hotel investment strategy :
 2011 Hotel investment strategy : What every developer should know New World Hotel 27 Sept, 2011 Presented by: Robert McIntosh, Executive Director, CBRE Hotels, Asia Pacific. SUMMARY Hotel Performance Hotel
Annual Shareholders Meeting Presentation
 Annual Shareholders Meeting Presentation JUNE 28, 2017 44 SHOPPING CENTERS STRONG CASHFLOW CONSUMER PLAY 13 OFFICE BUILDINGS LEADING BPO OFFICE SPACE PROVIDER 67 RESIDENTIAL BUILDINGS 35 HOUSING SUBDIVISIONS
Investor Briefings First-Half FY2016 Financial Results
 Cedar Woods Properties Limited Investor Briefings First-Half FY2016 Financial Results 26 February 2016 Cedar Woods Presentation 2 Snapshot of Achievements in FY2016 Extensive portfolio of residential estates
Investor Update April 2009
 I t U d t Investor Update April 2009 Strong First Half Performance Revenue $78.9 million, 26% pcp Pre-tax profit $15.5m, 45% pcp Net profit after tax $12.2m, 63% 2m pcp Earnings per share of 6.7c, 31%
8 May Derwent London DEVELOPING. Highlights 626,000 sq ft of. December 2013 low at 0.9% in January. Brunswick Group
 8 May 2014 Derwent London plc ( Derwent London / thee Group ) FIRST QUARTER INTERIM MANAGEMENT STATEMENT DEVELOPING IN A STRONG MARKETT Highlights 626,000 sq ft of developments on site with future capital
1HFY2012 RESULTS PRESENTATION
 1HFY2012 RESULTS PRESENTATION 21st February 2012 AWARD WINNING PROPERTY DEVELOPER Listed 1994, consistently profitable, always paid dividends Strategically located and diverse residential portfolio Urban
SAS Group Presentation Carnegie, May 22, 2012 Sture Stölen, Head of IR
 SAS Group Presentation Carnegie, May 22, 2012 Sture Stölen, Head of IR 1 This is the SAS Group 128 destinations 27,2 million passengers 28 new routes to be launched 2012 1,085 daily flights Revenues 2011,
FULL-YEAR RESULTS. Presentation of 23 February 2012
 FULL-YEAR RESULTS 2011 Presentation of 23 February 2012 KEY FIGURES Affine EPRA earnings per share ( ) EPRA Net Asset Value ( m) 1.33 1.45 1.60 284.4 281.9 287.6 2009 2010 2011 2009 2010 2011 Dividend