Forward-Looking Statements Statements in this presentation that are not historical facts are "forward-looking" statements and "safe harbor
|
|
|
- Rosalyn Grant
- 6 years ago
- Views:
Transcription


1 2017 Annual Meeting of Shareholders Presentation May 2017
2 Forward-Looking Statements Statements in this presentation that are not historical facts are "forward-looking" statements and "safe harbor statements" within the meaning of the Private Securities Litigation Reform Act of 1995 that involve risks and/or uncertainties, including those described in the Company's public filings with the Securities and Exchange Commission and any amendments thereto. The Company has based forwardlooking statements on management's current expectations and assumptions and not on historical facts. Examples of these statements include, but are not limited to, the Company s expectations regarding its ability to meet its financial and strategic goals, the Company s ability to further grow its portfolio on an accretive basis and the Company s expectations with respect to future rent growth, including potential rent from the ROFO properties. These forward-looking statements involve a number of risks and uncertainties. Among the important factors that could cause actual results to differ materially from those indicated in such forward-looking statements include risks related to the Company s ability to receive, or delays in obtaining, any regulatory approvals required to own its properties, or other delays or impediments to completing the Company s planned acquisitions or projects, including any acquisitions of properties from MGM Resorts International ( MGM ); the ultimate timing and outcome of any planned acquisitions or projects; the Company s ability to maintain its status as a REIT; the availability of and the ability to identify suitable and attractive acquisition and development opportunities and the ability to acquire and lease those properties on favorable terms; the Company s ability to access capital through debt and equity markets in amounts and at rates and costs acceptable to the Company; changes in the U.S. tax law and other state, federal or local laws, whether or not specific to REITs or to the gaming or lodging industries; and other factors described in the Company's public filings with the Securities and Exchange Commission (the SEC ). In providing forward-looking statements, the Company is not undertaking any duty or obligation to update these statements publicly as a result of new information, future events or otherwise, except as required by law. If the Company updates one or more forward-looking statements, no inference should be drawn that it will make additional updates with respect to those other forward-looking statements. In addition, the Company has included certain historical information in this presentation related to the Company and MGM, including historical information related to the Company s and MGM s business, financial condition and results of operations. The delivery of this presentation is not intended to and does not create any implication that there have been no changes to the Company s or MGM s affairs since the date of any of the historical information provided. Market and Industry Data This presentation also contains estimates and information concerning the Company s industry, including market position, rent growth and rent coverage of the Company s peers, that are based on industry publications, reports and peer company public filings. This information involves a number of assumptions and limitations, and you are cautioned not to rely on or give undue weight to this information. The Company has not independently verified the accuracy or completeness of the data contained in these industry publications, reports or filings. The industry in which we operate is subject to a high degree of uncertainty and risk due to variety of factors, including those described in the Risk Factors section of the Company s public filings with the SEC. Non-GAAP Disclaimer This presentation includes certain financial measures, such as MGM s Adjusted EBITDA and MGM s Adjusted Property EBITDA, which are not calculated in accordance with U.S. generally accepted accounting principles ( U.S. GAAP ). Management recommends that you focus on the U.S. GAAP numbers as the best indicator of financial performance. These alternative measures are provided only as a supplement to aid in your analysis. MGM uses Adjusted EBITDA and Adjusted Property EBITDA as the primary profit measure for its reportable segments. Adjusted EBITDA is a measure defined as earnings before interest and other non-operating income (expense), taxes, depreciation and amortization, preopening and start-up expenses, and property transactions, net. Adjusted Property EBITDA is a measure defined as Adjusted EBITDA before corporate expense and stock compensation expense related to MGM s stock option plan, not allocated to each casino resort. Adjusted EBITDA or Adjusted Property EBITDA should not be construed as an alternative to operating income or net income, as an indicator of MGM s performance; or as an alternative to cash flows from operating activities, as a measure of liquidity; or as any other measure determined in accordance with generally accepted accounting principles. MGM has significant uses of cash flows, including capital expenditures, interest payments, taxes and debt principal repayments, which are not reflected in Adjusted EBITDA or Adjusted Property EBITDA. Also, other companies in the gaming and hospitality industries that report Adjusted EBITDA or Adjusted Property EBITDA information may calculate Adjusted EBITDA or Adjusted Property EBITDA in a different manner. Please see MGM s earnings releases which have been filed with the SEC and are available on MGM s website for a reconciliation of MGM s reported Adjusted EBITDA and Adjusted Property EBITDA to net income. Financial information for MGM included in this presentation has been derived from MGM s public filings, which includes certain expenses related to the Company that are not eliminated in consolidation. 1


3 MGM Growth Properties $1.2 Billion Initial Public Offering on April 20, 2016 International Financing Review Magazine s 2016 U.S. IPO of the Year 2

 (4) 2 5.")
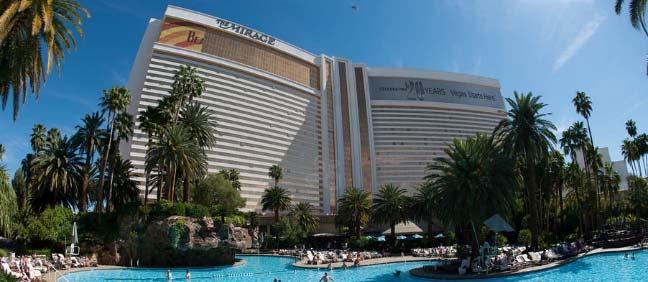
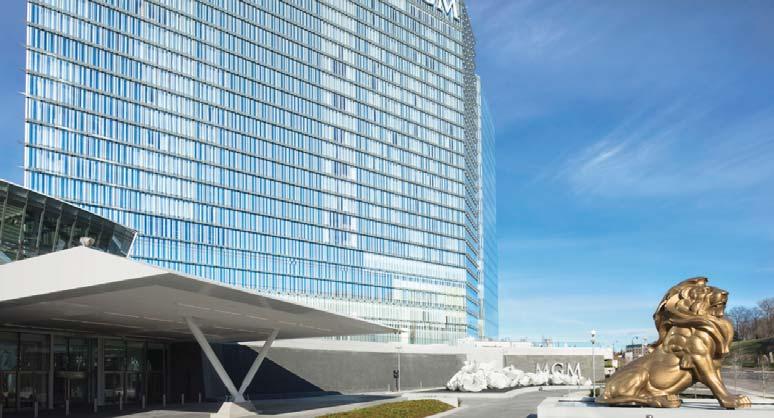
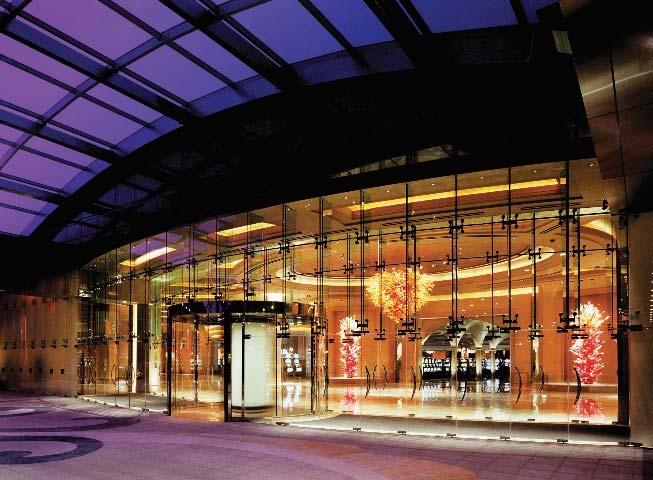
4 MGM Growth Properties Publicly traded REIT engaged in owning, acquiring and leasing high-quality leisure, entertainment and hospitality assets with one of the largest portfolios of premier assets on the Las Vegas Strip based on hotel rooms and convention square footage Assets leased to MGM Resorts with current annual revenues of $662 million as part of a long-term triple net master lease Las Vegas Assets Company Highlights 4.1x Corporate Rent Coverage (1) 1.8%+ Annual Increase Fixed Through 2022 (2) No Near Term Lease Expirations Embedded Growth Pipeline through ROFOs ~8.4% Dividend Growth since IPO Regional Assets 3 4 Right of First Offer ( ROFO ) (4) 2 5.6% Dividend Yield (3) (1) See appendix additional details; as of 12/31/2016; excludes fixed rent escalator, effective as of April 1, (2) Based on 2.0% annual escalator on fixed rent (90% of total rent), compounded through (3) As of share price close on 05/25/2017. (4) The Master Lease provides us with a right of first offer with respect to MGM National Harbor in Maryland and MGM s development property located in Springfield, Massachusetts should MGM Resorts choose to sell such assets. 3


 MGM Grand Detroit Borgata Meeting /")

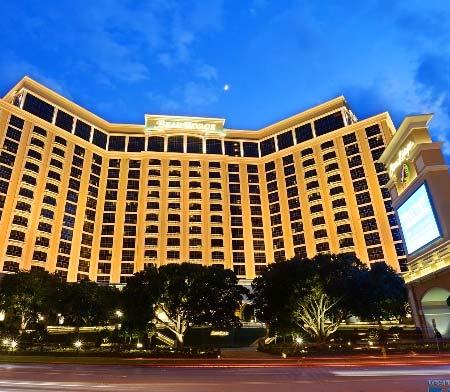
 Beau Rivage")

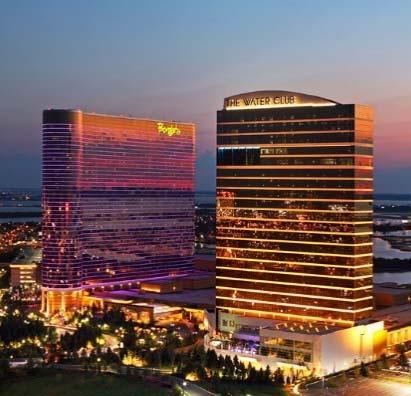
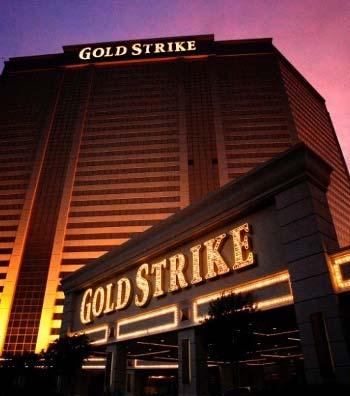
5 Landmark Real Estate Portfolio Snapshot Mandalay Bay Significant Real Estate Asset Value (Data as of 12/31/16) # of Hotel Rooms 27,233 The Mirage Total Acres (Las Vegas / Regional) 465 (354 / 111) MGM Grand Detroit Borgata Meeting / Convention Space Square Footage 2,582,000 Total Casino Square Footage 1,028,000 Gross Book Value of Assets as of 3/31/17 ($ in millions) Beau Rivage Land Value $4,144 4 Seasons, Mandalay Bay Buildings Value $7,324 Gross Land & Building Value $11,468 4


 See")

6 Stable and Secure Rent Corporate Rent Coverage (1) Master Lease All Properties Under 1 Master Lease Over 4x Corporate Coverage Coverage stress tested through both the Recession & Las Vegas supply increases Corporate Guarantee from MGM Source: MGM Resorts International public filings (1) See appendix for additional details; as of 12/31/2016. MGM Macau MGM Cotai 5


7 Right of First Offer Assets MGM Springfield (Opening 9/2018) MGM National Harbor (Opened 12/2016) 6


 Includes fixed rent")
8 Accomplishments Since IPO April 20, 2016 August 2016 April 1, 2017 Initial Public Offering Acquired Borgata For $ % Cap Rate First Escalator Annualized Rental Revenue +20% (1) Annualized Dividend / Share +8% ($ in millions) (1) Includes fixed rent escalator effective as of April 1,


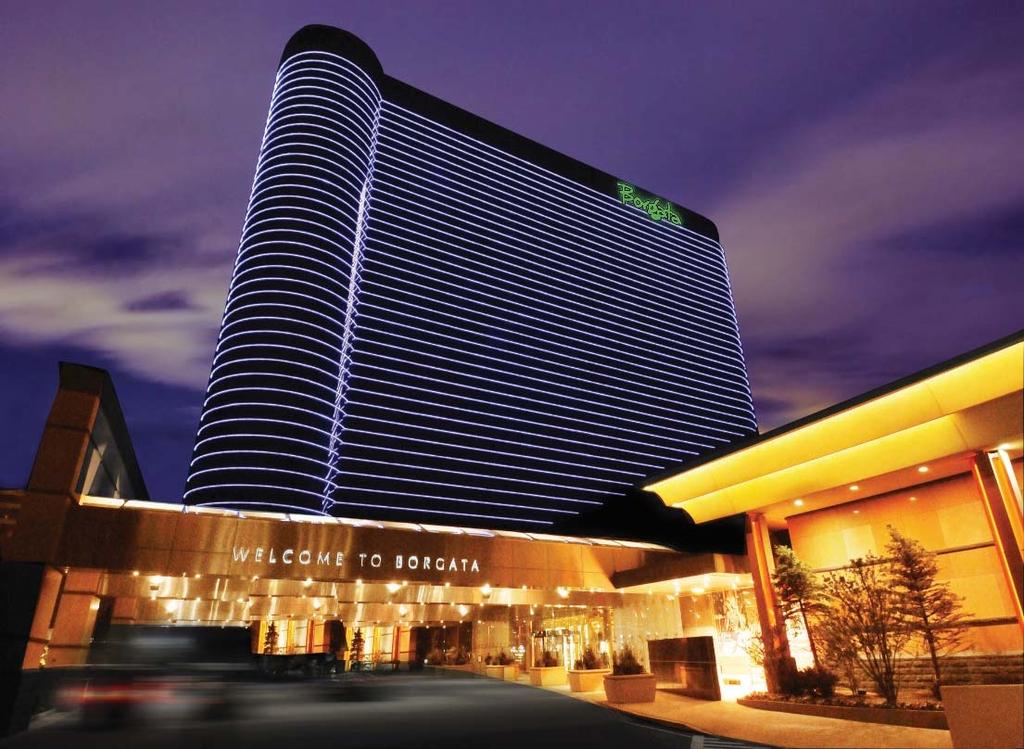
9 The Borgata Hotel Casino & Spa 8
10 Total Return Since Initial Public Offering on April 20, 2016 Source: FactSet, SNL Financial as of 5/25/2017 9
 per Share of contractual rent growth through the")


11 Long-Term Strategy $60+ million or ~$0.25 (1) per Share of contractual rent growth through the first six years of lease Contractual Rent Escalators ROFO Assets MGM National Harbor: $1.4 billion development opened December 8, 2016 MGM Springfield: $865 million development opening September 2018 Opportunity to acquire additional gaming properties from third parties Pursue attractive net lease acquisitions that may be available in leisure, entertainment, hospitality and related sectors Asset Class and Tenant Diversification Existing MGM Assets, Future Acquisitions, Development, and Expansions Potential opportunities The Park Theater CityCenter Grand Victoria Bellagio MGM Grand Las Vegas Circus Circus Las Vegas (1) ~242.9 million units and shares outstanding as of 3/31/17. 10
12 Appendix 11
13 MGM Supplemental Data Non-GAAP Financial Measures MGM RESORTS INTERNATIONAL AND SUBSIDIARIES RECONCILIATION OF OPERATING INCOME (LOSS) TO ADJUSTED PROPERTY EBITDA AND ADJUSTED EBITDA (In thousands) (Unaudited) Twelve Months Ended December 31, 2016 Operating NV Energy exit Preopening and start-up Property transactions, net and gain on Borgata Depreciation and income (loss) expense expenses transaction amortization Adjusted EBITDA Bellagio $ 366,543 $ 23,815 $ - $ 118 $ 88,783 $ 479,259 MGM Grand Las Vegas 231,327 25, ,719 72, ,681 Mandalay Bay 114,202 29, ,377 89, ,609 The Mirage 85,300 13, , ,427 Luxor 57,653 11,594 1, , ,192 New York-New York 93,169 7, , ,729 Excalibur 71,885 9,083-4,405 16, ,525 Monte Carlo 33,291 8,409 1,929 1,131 34,102 78,862 Circus Circus Las Vegas 33,516 10, ,963 61,989 MGM Grand Detroit 147, (59) 23, ,414 Beau Rivage 68, (172) 25,880 93,762 Gold Strike Tunica 39, ,792 49,690 Borgata (1) 38, ,652 33,923 81,281 National Harbor (2) (13,626) - 17,986-5,236 9,596 Other resort operations (3) Domestic resorts 1,367, ,335 22,443 20, ,596 2,063,016 MGM China 255,264-27,848 (216) 237, ,736 Unconsolidated resorts (4) 524,448-3, ,616 Management and other operations 4,316-1, ,505 13,000 2,151, ,335 54,609 19, ,941 3,124,368 Stock compensation (44,957) (44,957) Corporate (26,910) - 85,466 (432,869) 90,586 (283,727) $ 2,079,787 $ 139,335 $ 140,075 $ (413,040) $ 849,527 $ 2,795,684 (1) Represents operating results of Borgata for the period from August 1, 2016 (the first day of the Company's full ownership) through December 31, (2) Represents operating results of National Harbor for the month ended December 31, (3) Sold in (4) Represents the Company's share of operating income (loss), adjusted for the effect of certain basis differences. Includes the Company's share of Borgata results for the twelve months ended December 31, 2015 and the seven months ended July 31,
14 Calculation of MGM Historical Corporate Rent Coverage Ratio (1) ($ in 000s) Year Ended December 31, (2) Adjusted EBITDA Related to: Domestic Resorts $1,901,031 $1,343,562 $1,165,413 $1,298,116 $1,325,220 $1,442,686 $1,518,307 $1,689,966 $2,063,016 Management & Other Operations 16,894 18,322 (12,158) 287 9,947 25,777 35,984 37,419 13,000 Corporate (Excluding Stock-Based Compensation) (95,862) (131,142) (109,911) (156,086) (215,757) (200,708) (220,664) (254,104) (4) (264,160) Subtotal $1,822,063 $1,230,742 $1,043,344 $1,142,317 $1,119,410 $1,267,755 $1,333,627 $1,473,281 $1,811,856 Dividends & distributions received by MGM (3) CityCenter $200,000 $540,000 MGM China ,355 30, , , , ,159 52,902 Grand Victoria 41,125 33,750 33,500 30,000 22,000 16,275 15,450 16,850 14,250 Borgata 19,579 60, , ,094 (5) 2,654 Subtotal $60,704 $93,886 $339,277 $60,513 $225,886 $328,500 $405,189 $535,103 $609,806 Total Adj. EBITDA & Div. & Dist. $1,882,767 $1,324,628 $1,382,621 $1,202,830 $1,345,296 $1,596,255 $1,738,816 $2,008,384 $2,421,662 Corporate Rent Coverage Ratio 3.4x 2.4x 2.5x 2.2x 2.4x 2.9x 3.2x 3.7x 4.1x (1) MGM s historical corporate rent coverage ratio is calculated by dividing (a) the sum of Adjusted EBITDA as reported by MGM related to domestic resorts, management and other operations, and corporate (excluding stockbased compensation and MGP corporate expense), plus dividends and distributions received by MGM from CityCenter, Borgata, Grand Victoria and MGM China, by (b) year one rent under the Master Lease of $550.0 million for December 31, 2015 and prior periods. On August 1, 2016, Borgata was added to the existing Master Lease between the Landlord and the Tenant. As a result, the initial annual rent amount under the Master Lease increased by $100.0 million to $650.0 million, prorated for the remainder of the first lease year. The calculation of MGM s historical corporate rent coverage ratio includes the impact of the Borgata Transaction for the year ended December 31, 2016 including Borgata Adjusted EBIDTA for the period from August 1, 2016 through December 31, 2016 and increased annual rent for 5 months. (2) Ratio of Adjusted EBITDA reported by MGM related to Domestic resorts, Management and other operations, and Corporate (excluding stock-based compensation) plus Dividends and Distributions received by MGM to year one rent under the Master Lease of $550 million for the years ended December 31, 2015 and previous periods. For the period ended December 31, 2016 annual rent was increased for the Borgata transaction to include 5 months of increased rent during (3) The numerator to the historical corporate rent coverage ratio includes special and ordinary dividends and other cash distributions actually received by MGM from CityCenter, Borgata, Grand Victoria and MGM China for the years ended December 31, 2008, 2009, 2010, 2011, 2012, 2013, 2014 and Dividends and distributions are made at the discretion of each relevant entity s board of directors or similar body, and depend on several factors, including financial position, results of operations, cash flows, capital requirements, debt covenants, and applicable law, among others. Accordingly, historical dividends and distributions may not be indicative of future dividends or distributions and should not be relied upon as an indicator of MGM s historical corporate rent coverage ratio for future periods. In addition, as described in note (1) above, Borgata was acquired by MGM on August 1, The historic dividends and distributions related to Borgata have not been adjusted as a result of the Borgata Transaction for the period ended December 31, 2015 and previous periods. (4) Excludes MGP general & administrative expenses. (5) Represents dividends and distributions received during 2016 from Borgata prior to the date of acquisition. 13
MGM GROWTH PROPERTIES LLC Second Quarter 2016 Earnings Presentation
 MGM GROWTH PROPERTIES LLC Second Quarter 06 Earnings Presentation August 4, 06 Forward-Looking Statements Statements in this presentation that are not historical facts are "forward-looking" statements
Wells Fargo Net Lease REIT Forum 2016
 Wells Fargo Net Lease REIT Forum 2016 September 2016 Forward-Looking Statements Statements in this presentation that are not historical facts are "forward-looking" statements and "safe harbor statements"
Forward-Looking Statements Statements in this presentation that are not historical facts are "forward-looking" statements and "safe harbor
 Investor Presentation November 2017 Forward-Looking Statements Statements in this presentation that are not historical facts are "forward-looking" statements and "safe harbor statements" within the meaning
Market and Industry Data
 Investor Presentation March 2018 Forward-Looking Statements Statements in this presentation that are not historical facts are "forward-looking" statements and "safe harbor statements" within the meaning
Investor Presentation
 Investor Presentation December 2016 Forward-Looking Statements Statements in this presentation that are not historical facts are "forward-looking" statements and "safe harbor statements" within the meaning
Market and Industry Data
 Investor Presentation June 2018 Forward-Looking Statements Statements in this presentation that are not historical facts are "forward-looking" statements and "safe harbor statements" within the meaning
Forward-Looking Statements Statements in this presentation that are not historical facts are "forward-looking" statements and "safe harbor
 Investor Presentation November 2018 Forward-Looking Statements Statements in this presentation that are not historical facts are "forward-looking" statements and "safe harbor statements" within the meaning
MGM Resorts International Reports Second Quarter Financial Results
 NEWS RELEASE MGM Resorts International Reports Second Quarter Financial Results 8/5/2014 Consolidated Adjusted EBITDA Increased 8%, Led By 10% Growth In Wholly Owned Domestic Resorts MGM China Declares
MGM Resorts International Reports Fourth Quarter And Full Year Financial And Operating Results; Announces Quarterly Dividend
 NEWS RELEASE MGM Resorts International Reports Fourth Quarter And Full Year Financial And Operating Results; Announces Quarterly Dividend 2/16/2017 Increased diluted earnings per share in the fourth quarter
MGM Resorts International Reports First Quarter Financial And Operating Results
 NEWS RELEASE MGM Resorts International Reports First Quarter Financial And Operating Results 4/27/2017 LAS VEGAS, April 27, 2017 /PRNewswire/ -- MGM Resorts International (NYSE: MGM) ("MGM Resorts" or
GAMING INVESTMENT FORUM AT G2E. September 26, 2016
 GAMING INVESTMENT FORUM AT G2E September 26, 2016 Dan D Arrigo EVP & Chief Financial Officer MGM Resorts International MGM RESORTS INTERNATIONAL Strong Domestic Operating Results Las Vegas Trends Maximizing
MGM Resorts International Reports Strong First Quarter Financial And Operating Results
 NEWS RELEASE MGM Resorts International Reports Strong First Quarter Financial And Operating Results 5/5/2016 Increases Wholly Owned Domestic Resorts Net Revenue and Adjusted Property EBITDA by 3% and 24%
MGM RESORTS INTERNATIONAL Third Quarter 2016 Earnings Presentation
 MGM RESORTS INTERNATIONAL Third Quarter 2016 Earnings Presentation November 7, 2016 Forward-Looking Statements Statements in this presentation that are not historical facts are forward-looking statements,
Forward-Looking Statements. Note Regarding Presentation of Non-GAAP Financial Measures
 First Quarter 2016 Earnings Presentation May 5, 2016 Forward-Looking Statements Statements in this presentation that are not historical facts are forward-looking statements, within the meaning of the Private
BAML 2017 Japan Conference The Opportunity For Integrated Resorts In Japan
 BAML 2017 Japan Conference The Opportunity For Integrated Resorts In Japan September 7, 2017 Jim Murren Chairman and CEO MGM Resorts International AGENDA 1. MGM Resorts Who We Are 2. The Japan Opportunity
MGM Resorts International Reports Fourth Quarter and Full Year Results
 NEWS RELEASE MGM Resorts International Reports Fourth Quarter and Full Year Results 2/14/2011 LAS VEGAS, Feb. 14, 2011 /PRNewswire-FirstCall/ -- MGM Resorts International (NYSE: MGM) today announced a
MGM RESORTS INTERNATIONAL REPORTS SECOND QUARTER FINANCIAL AND OPERATING RESULTS
 Exhibit 99.1 MGM RESORTS INTERNATIONAL REPORTS SECOND QUARTER FINANCIAL AND OPERATING RESULTS Las Vegas, Nevada, August 2, 2018 MGM Resorts International (NYSE: MGM) ( MGM Resorts or the Company ) today
MGM Resorts International (Exact name of registrant as specified in its charter)
") UNITED STATES SECURITIES AND EXCHANGE COMMISSION Washington, D.C. 20549 FORM 8-K CURRENT REPORT PURSUANT TO SECTION 13 OR 15(d) OF THE SECURITIES EXCHANGE ACT OF 1934 Date of report (Date of earliest event
UNITED STATES SECURITIES AND EXCHANGE COMMISSION Washington, D.C. 20549 FORM 8-K CURRENT REPORT PURSUANT TO SECTION 13 OR 15(d) OF THE SECURITIES EXCHANGE ACT OF 1934 Date of report (Date of earliest event
MGM MIRAGE Reports Record First Quarter Results
 NEWS RELEASE MGM MIRAGE Reports Record First Quarter Results 5/3/2007 PRNewswire-FirstCall LAS VEGAS MGM MIRAGE (NYSE: MGM) today reported its first quarter 2007 financial results, achieving the Company's
MGM MIRAGE Reports Fourth Quarter and Full Year Financial Results
 NEWS RELEASE MGM MIRAGE Reports Fourth Quarter and Full Year Financial Results 2/18/2010 CityCenter Opens to Rave Reviews Convention Booking Pace Continues to Strengthen PRNewswire-FirstCall LAS VEGAS
MGM MIRAGE Reports Second Quarter Results
 NEWS RELEASE MGM MIRAGE Reports Second Quarter Results 8/5/2008 PRNewswire-FirstCall LAS VEGAS MGM MIRAGE (NYSE: MGM) today reported its second quarter 2008 financial results. The Company achieved 97%
Q3 HIGHLIGHTS. Strong High End Table Games Volume Baccarat Volume Up 22%
 what if Q3 HIGHLIGHTS Net Revenues up 5% to $1.9 Billion 5% Increase in Gaming Revenues Strong High End Table Games Volume Baccarat Volume Up 22% Slot Revenue Up 5% Hotel Revenues Grew 3% - Led by a 6%
LD Micro Conference June 2017 FULL HOUSE RESORTS 1
 LD Micro Conference June 2017 FULL HOUSE RESORTS 1 Forward-looking Statements / Regulation G This presentation may contain statements that are "forward-looking statements" within the meaning of the safe
Q2 Financial Results Before One-Time Charges
 Q2 Highlights Generated Record Net Revenues of $1.7 Billion, Up 60% Same-Store Net Revenues were $1.2 Billion, Up 11% Over 2004 Produced Record Property-Level EBITDA of $567 Million Same-Store Property-Level
MGM MIRAGE Reports Record Second Quarter Revenue, Cash Flow and Net Income
 NEWS RELEASE MGM MIRAGE Reports Record Second Quarter Revenue, Cash Flow and Net Income 7/24/2001 PRNewswire LAS VEGAS MGM MIRAGE (NYSE: MGG) today reported earnings of 47 cents per diluted share for the
MGM Resorts International INVESTOR PRESENTATION
 MGM Resorts International INVESTOR PRESENTATION March 2017 Forward-Looking Statements Statements in this presentation that are not historical facts are forward-looking statements, within the meaning of
Investor Presentation
 MGM Resorts International Investor Presentation The MGM Resorts Investment Case July 27, 2017 Forward-Looking Statements Statements in this presentation that are not historical facts are forward-looking
Gaming Investment Forum September 2014
 Gaming Investment Forum September 2014 Forward Looking Statements This presentation contains forward-looking statements regarding operating trends, future results of operations and the completion of new
MGM RESORTS INTERNATIONAL 4Q and FY 2016 Earnings Presentation
 MGM RESORTS INTERNATIONAL 4Q and FY 2016 Earnings Presentation February 16, 2017 Forward-Looking Statements Statements in this presentation that are not historical facts are forward-looking statements,
Copa Holdings Reports Record Earnings of US$41.8 Million for 4Q06 and US$134.2 Million for Full Year 2006
 Copa Holdings Reports Record Earnings of US$41.8 Million for 4Q06 and US$134.2 Million for Full Year 2006 Panama City, Panama --- March 7, 2007. Copa Holdings, S.A. (NYSE: CPA), parent company of Copa
44th Consecutive Profitable Quarter Fourth Quarter Fully Diluted Earnings per Share of $0.94 Full Year Fully Diluted Earnings per Share of $4.
 Allegiant Travel Company Fourth Quarter and Full Year 2013 Financial Results January 29, 2014 1:00 PM PT 44th Consecutive Profitable Quarter Fourth Quarter Fully Diluted Earnings per Share of $0.94 Full
CONTACT: Investor Relations Corporate Communications
 NEWS RELEASE CONTACT: Investor Relations Corporate Communications 435.634.3200 435.634.3553 Investor.relations@skywest.com corporate.communications@skywest.com SkyWest, Inc. Announces Second Quarter 2017
MGM MIRAGE Reports Record Third Quarter Revenue, Cash Flow, and Net Income
 NEWS RELEASE MGM MIRAGE Reports Record Third Quarter Revenue, Cash Flow, and Net Income 10/18/2000 PRNewswire LAS VEGAS MGM MIRAGE (NYSE: MGG) today reported earnings of 42 cents per diluted share for
CLSA Investors Forum 2015 September 2015
 CLSA Investors Forum 2015 September 2015 Forward Looking Statements This presentation contains forward-looking statements regarding operating trends, future results of operations and the completion of
Fourth Quarter 2015 Financial Results
 Fourth Quarter 2015 Financial Results AerCap Holdings N.V. February 23, 2016 Disclaimer Incl. Forward Looking Statements & Safe Harbor This presentation contains certain statements, estimates and forecasts
CLSA Asia Investor Forum. January, 2008
 CLSA Asia Investor Forum January, 2008 Forward Looking Statements This presentation contains forward-looking statements regarding operating trends, future results of operations and the completion of new
Spirit Airlines Reports First Quarter 2017 Results
 Spirit Airlines Reports First Quarter 2017 Results MIRAMAR, Fla., April 28, 2017 - Spirit Airlines, Inc. (NASDAQ: SAVE) today reported first quarter 2017 financial results. GAAP net income for the first
Nomura Investor Forum December 2014
 Nomura Investor Forum December 2014 Forward Looking Statements This presentation contains forward-looking statements regarding operating trends, future results of operations and the completion of new projects,
Management Presentation. March 2016
 Management Presentation March 2016 Forward looking statements This presentation as well as oral statements made by officers or directors of Allegiant Travel Company, its advisors and affiliates (collectively
CONTACT: Investor Relations Corporate Communications
 NEWS RELEASE CONTACT: Investor Relations Corporate Communications 435.634.3200 435.634.3553 Investor.relations@skywest.com corporate.communications@skywest.com SkyWest, Inc. Announces Fourth Quarter 2017
SkyWest, Inc. Announces First Quarter 2018 Profit
 NEWS RELEASE CONTACT: Investor Relations Corporate Communications 435.634.3200 435.634.3553 Investor.relations@skywest.com corporate.communications@skywest.com SkyWest, Inc. Announces First Quarter 2018
MARRIOTT INTERNATIONAL, INC. PRESS RELEASE SCHEDULES QUARTER 4, 2016 TABLE OF CONTENTS
 PRESS RELEASE SCHEDULES QUARTER 4, 06 TABLE OF CONTENTS Consolidated Statements of Income - As Reported A- Consolidated Statements of Income - Fourth Quarter Adjusted 06 Compared to Combined 05 A-3 Consolidated
Management Presentation. November 2018
 Management Presentation November 2018 Forward looking statements This presentation as well as oral statements made by officers or directors of Allegiant Travel Company, its advisors and affiliates (collectively
CONTACT: Investor Relations Corporate Communications
 NEWS RELEASE CONTACT: Investor Relations Corporate Communications 435.634.3200 435.634.3553 Investor.relations@skywest.com corporate.communications@skywest.com SkyWest, Inc. Announces Second Quarter 2016
AIR CANADA REPORTS 2010 THIRD QUARTER RESULTS; Operating Income improved $259 million or 381 per cent from previous year s quarter
 AIR CANADA REPORTS 2010 THIRD QUARTER RESULTS; Operating Income improved $259 million or 381 per cent from previous year s quarter MONTRÉAL, November 4, 2010 Air Canada today reported operating income
Copa Holdings Reports Net Income of $57.7 million and EPS of $1.36 for the Third Quarter of 2018
 Copa Holdings Reports Net Income of $57.7 million and EPS of $1.36 for the Third Quarter of 2018 November 14, 2018 PANAMA CITY, Nov. 14, 2018 /PRNewswire/ -- Copa Holdings, S.A. (NYSE: CPA), today announced
Copa Holdings Reports Net Income of $136.5 million and EPS of $3.22 for the First Quarter of 2018
 Copa Holdings Reports Net Income of $136.5 million and EPS of $3.22 for the First Quarter of 2018 May 9, 2018 PANAMA CITY, May 9, 2018 /PRNewswire/ -- Copa Holdings, S.A. (NYSE: CPA), today announced financial
Spirit Airlines Reports First Quarter 2018 Results
 Spirit Airlines Reports First Quarter 2018 Results MIRAMAR, Fla., April 26, 2018 - Spirit Airlines, Inc. (NYSE: SAVE) today reported first quarter 2018 financial results. For the first quarter 2018, Spirit
OPERATING AND FINANCIAL HIGHLIGHTS. Subsequent Events
 Copa Holdings Reports Net Income of $103.8 million and EPS of $2.45 for the Third Quarter of 2017 Excluding special items, adjusted net income came in at $100.8 million, or EPS of $2.38 per share Panama
Crown Resorts Limited
 Crown Resorts Limited 2015 Full Year Results Presentation 13 August 2015 1 Crown Resorts Limited Results Overview Crown Resorts Limited (Crown) performance: Overall, the results for Crown s portfolio of
Melco International Development Limited (Incorporated in Hong Kong with limited liability) Website : (Stock Code : 200)
 Website : (Stock Code : 200)") Hong Kong Exchanges and Clearing Limited and The Stock Exchange of Hong Kong Limited take no responsibility for the contents of this announcement, make no representation as to its accuracy or completeness
Hong Kong Exchanges and Clearing Limited and The Stock Exchange of Hong Kong Limited take no responsibility for the contents of this announcement, make no representation as to its accuracy or completeness
Management Presentation. November 2011
 Management Presentation November 2011 Forward looking statements This presentation as well as oral statements made by officers or directors of Allegiant Travel Company, its advisors and affiliates (collectively
Full House Resorts. Investor Presentation December 2018
 Full House Resorts Investor Presentation December 2018 Forward-looking Statements & Regulation G 2 This presentation may contain statements that are "forward-looking statements" within the meaning of the
Spirit Airlines Reports Second Quarter 2018 Results
 Spirit Airlines Reports Second Quarter 2018 Results MIRAMAR, Fla., July 25, 2018 - Spirit Airlines, Inc. (NYSE: SAVE) today reported second quarter 2018 financial results. GAAP net income for the second
Spirit Airlines Reports Fourth Quarter and Full Year 2016 Results
 Spirit Airlines Reports Fourth Quarter and Full Year 2016 Results MIRAMAR, FL. (February 7, 2017) - Spirit Airlines, Inc. (NASDAQ: SAVE) today reported fourth quarter and full year 2016 financial results.
Investor Relations Update January 25, 2018
 General Overview Investor Relations Update Accounting Changes On January 1, 2018, the company adopted two new Accounting Standard Updates: (ASUs): ASU 2014-9: Revenue from Contracts with Customers (the
Spirit Airlines Reports Third Quarter 2017 Results
 Spirit Airlines Reports Third Quarter 2017 Results MIRAMAR, Fla., October 26, 2017 - Spirit Airlines, Inc. (NASDAQ: SAVE) today reported third quarter 2017 financial results. GAAP net income for the third
MIRAMAR, Fla., April 29, 2015 (GLOBE NEWSWIRE) -- Spirit Airlines, Inc. (Nasdaq:SAVE) today reported first quarter 2015 financial results.
 -- Spirit Airlines, Inc. (Nasdaq:SAVE) today reported first quarter 2015 financial results.") April 29, 2015 Spirit Airlines Announces First Quarter 2015 Results; Adjusted Net Income Increases 87.1 Percent to $70.7 Million and Pre-Tax Margin Increases 900 Basis Points to 22.7 Percent MIRAMAR, Fla.,
April 29, 2015 Spirit Airlines Announces First Quarter 2015 Results; Adjusted Net Income Increases 87.1 Percent to $70.7 Million and Pre-Tax Margin Increases 900 Basis Points to 22.7 Percent MIRAMAR, Fla.,
Highlights from the Annual Results December 2007
 Highlights from the Annual Results December 2007 Disclaimer The information in this document is taken from the BAA 2007 Annual Results ( the Results ) which were published on 11 March 2008 and other public
Melco International Development Limited (Incorporated in Hong Kong with limited liability) Website : (Stock Code : 200)
 Website : (Stock Code : 200)") Hong Kong Exchanges and Clearing Limited and The Stock Exchange of Hong Kong Limited take no responsibility for the contents of this announcement, make no representation as to its accuracy or completeness
Hong Kong Exchanges and Clearing Limited and The Stock Exchange of Hong Kong Limited take no responsibility for the contents of this announcement, make no representation as to its accuracy or completeness
Management Presentation. August 2012
 Management Presentation August 2012 Forward looking statements This presentation as well as oral statements made by officers or directors of Allegiant Travel Company, its advisors and affiliates (collectively
Management Presentation. May 2013
 Management Presentation May 2013 Forward looking statements This presentation as well as oral statements made by officers or directors of Allegiant Travel Company, its advisors and affiliates (collectively
Management Presentation. September 2011
 Management Presentation September 2011 Forward looking statements This presentation as well as oral statements made by officers or directors of Allegiant Travel Company, its advisors and affiliates (collectively
Crown Resorts Limited
 Crown Resorts Limited 2016 Half Year Results Presentation 25 February 2016 1 Crown Resorts Limited Results Overview Crown Resorts Limited (Crown) performance: The 2016 First Half results across Crown s
Financial Results 1 st Quarter Mar/2016 (FY2015) 30 July, 2015
 30 July, 2015") Financial Results Mar/2016 (FY2015) 30 July, 2015 Today s Topics P.2 P.3 P.15 1 Overview of FY Mar/2016 Financial Results Operating Revenue Operating Profit 320 307.0 +4.9Bn (+1.6%) 312.0 50 +17.6Bn (+94.6%)
Financial Results Mar/2016 (FY2015) 30 July, 2015 Today s Topics P.2 P.3 P.15 1 Overview of FY Mar/2016 Financial Results Operating Revenue Operating Profit 320 307.0 +4.9Bn (+1.6%) 312.0 50 +17.6Bn (+94.6%)
SKYWEST, INC. ANNOUNCES THIRD QUARTER 2014 RESULTS
 NEWS RELEASE For Further Information Contact: Investor Relations Telephone: (435) 634-3203 Fax: (435) 634-3205 FOR IMMEDIATE RELEASE: October 29, 2014 SKYWEST, INC. ANNOUNCES THIRD QUARTER 2014 RESULTS
MGM MIRAGE and Mandalay Resort Group Sign Definitive Agreement for MGM MIRAGE to Acquire Mandalay for $71.00 Per Share in Cash
 NEWS RELEASE MGM MIRAGE and Mandalay Resort Group Sign Definitive Agreement for MGM MIRAGE to Acquire Mandalay for $71.00 Per Share in Cash 6/16/2004 Will Create the Premier Global Diversified Gaming and
FOURTH QUARTER RESULTS 2017
 FOURTH QUARTER RESULTS 2017 KEY RESULTS In the 4Q17 Interjet total revenues added $5,824.8 million pesos that represented an increase of 10.8% over the revenue generated in the 4Q16. In the 4Q17, operating
Copa Holdings Reports Net Income of $49.9 million and EPS of $1.18 for the Second Quarter of 2018
 Copa Holdings Reports Net Income of $49.9 million and EPS of $1.18 for the Second Quarter of 2018 Panama City, Panama --- Aug 8, 2018. Copa Holdings, S.A. (NYSE: CPA), today announced financial results
ISI Group Annual Conference February 15, 2011
 ISI Group Annual Conference February 15, 2011 CURRENT LAS VEGAS MARKET TRENDS (Full Year 2010) Visitation Up 2.7% Las Vegas Strip Gaming Revenues Up 4.1% Airline Passengers Down 1.8% Auto Traffic Up 3.1%
OPERATING AND FINANCIAL HIGHLIGHTS
 Copa Holdings Reports Net Income of US$18.6 Million and EPS of US$0.42 for the Second Quarter of 2010 Excluding special items, adjusted net income came in at $26.3 million, or $0.60 per share Panama City,
10TH ANNUAL WOLFE RESEARCH GLOBAL TRANSPORTATION CONFERENCE MAY 23, 2017
 1 10TH ANNUAL WOLFE RESEARCH GLOBAL TRANSPORTATION CONFERENCE MAY 23, 2017 SAFE HARBOR This presentation contains forward-looking statements within the meaning of the Private Securities Litigation Reform
HK GAAP RESULTS RELEASE 12 August 2008 STAR CRUISES GROUP ANNOUNCES FIRST HALF RESULTS FOR 2008
 HK GAAP RESULTS RELEASE 12 August 2008 FOR IMMEDIATE RELEASE INTERNATIONAL STAR CRUISES GROUP ANNOUNCES FIRST HALF RESULTS FOR 2008 The below commentary is prepared based on the comparison of the results
Copa Holdings Reports Fourth Quarter and Full Year 2007 Results
 Copa Holdings Reports Fourth Quarter and Full Year 2007 Results Panama City, Panama --- February 21, 2008. Copa Holdings, S.A. (NYSE: CPA), parent company of Copa Airlines and Aero Republica, today announced
Parques Reunidos Corporate Presentation March 2016
 Parques Reunidos Corporate Presentation March 216 Disclaimer The information contained in this presentation (the Presentation ), including but not limited to forward-looking statements, is provided as
ABX HOLDINGS, INC. Shareholders Meeting. May 13, 2008
 Shareholders Meeting May 13, 2008 1 1 1 Safe Harbor Statement Except for historical information contained herein, the matters discussed in this presentation contain forward-looking statements that involve
OPERATING AND FINANCIAL HIGHLIGHTS. Subsequent Events
 Copa Holdings Reports Net Income of US$113.1 Million and EPS of US$2.57 for the First Quarter of 2015 Excluding special items, adjusted net income came in at US$106.0 million, or EPS of US$2.41 per share
WestJet announces 18th consecutive quarter of profitability Airline reports third quarter net earnings of $31.4 million
 FOR IMMEDIATE RELEASE WestJet announces 18th consecutive quarter of profitability Airline reports third quarter net earnings of $31.4 million CALGARY, ALBERTA. November 4, 2009. WestJet (TSX:WJA) today
JAPAN AIRLINES Co., Ltd. Financial Results 1 st Quarter Mar/2017(FY2016) July 29, 2016
 July 29, 2016") JAPAN AIRLINES Co., Ltd. Financial Results Mar/2017(FY2016) July 29, 2016 Today s Topics P.1 P.2 P.13 From the first quarter of this fiscal year, figures for Revenue Passengers Carried, ASK, RPK and Load
JAPAN AIRLINES Co., Ltd. Financial Results Mar/2017(FY2016) July 29, 2016 Today s Topics P.1 P.2 P.13 From the first quarter of this fiscal year, figures for Revenue Passengers Carried, ASK, RPK and Load
OPERATING AND FINANCIAL HIGHLIGHTS SUBSEQUENT EVENTS
 Copa Holdings Reports Net Income of US$6.2 Million and EPS of US$0.14 for the Third Quarter of 2015 Excluding special items, adjusted net income came in at $37.4 million, or EPS of $0.85 per share Panama
THIRD QUARTER RESULTS 2017
 THIRD QUARTER RESULTS 2017 KEY RESULTS In the 3Q17 Interjet total revenues added $5,835.1 million pesos that represented an increase of 22.0% over the revenue generated in the 3Q16. In the 3Q17, operating
Deutsche Bank 2011 Leveraged Finance Conference Sarah Rogers - Investor Relations
 Deutsche Bank 2011 Leveraged Finance Conference Sarah Rogers - Investor Relations Las Vegas Indicators Improving (YTD through August 2011) Visitation +5% Average Daily Auto Traffic Flat McCarran Airport
Copa Holdings Reports Earnings of US$30.3 Million and EPS of US$0.70 for 3Q08
 Copa Holdings Reports Earnings of US$30.3 Million and EPS of US$0.70 for 3Q08 Panama City, Panama --- November 13, 2008. Copa Holdings, S.A. (NYSE: CPA), parent company of Copa Airlines and Aero Republica,
Summary of Results for the First Three Quarters FY2015/3
 Summary of Results for the First Three Quarters FY2015/3 February 10, 2015 Tokyu Corporation (9005) http://www.tokyu.co.jp/ Contents Ⅰ.Executive Summary 2 Ⅱ.Conditions in Each Business 5 Ⅲ.Details of Financial
The Manager Company Announcements Australian Stock Exchange Limited Sydney NSW Dear Sir. Demerger of BHP Steel
 The Manager Company Announcements Australian Stock Exchange Limited Sydney NSW 2000 Dear Sir Demerger of BHP Steel At the time of the announcement of the creation of the DLC between BHP Limited and Billiton
Forward Looking Statements
 October 2, 2012 Forward Looking Statements Certain information in this presentation may be considered forward-looking information within the meaning of the Private Securities Litigation Reform Act of 1995.
Joe Randell President and Chief Executive Officer Jolene Mahody Executive Vice President and Chief Financial Officer
 Joe Randell President and Chief Executive Officer Jolene Mahody Executive Vice President and Chief Financial Officer Nathalie Megann Vice President, Investor Relations and Corporate Affairs December, 2015
Spirit Airlines Reports Third Quarter 2015 Pre-Tax Margin of 26.9 Percent
 October 27, 2015 Spirit Airlines Reports Third Quarter 2015 Pre-Tax Margin of 26.9 Percent MIRAMAR, Fla., Oct. 27, 2015 (GLOBE NEWSWIRE) -- Spirit Airlines, Inc. (NASDAQ:SAVE) today reported third quarter
Investor Update Issue Date: April 9, 2018
 Investor Update Issue Date: April 9, 2018 This investor update provides guidance and certain forward-looking statements about United Continental Holdings, Inc. (the Company or UAL ). The information in
JP Morgan Internet Conference. Michelle Peluso. New York March 13, 2006 C O N F I D E N T I A L
 JP Morgan Internet Conference Michelle Peluso New York March 13, 2006 2005 Accomplishments & Financial Results 2 Travelocity 2005 Accomplishments Acquired lastminute.com, significantly increasing scale
ABX. Holdings, Inc. BB&T Transportation Conference. February 2008
 ABX Holdings, Inc. BB&T Transportation Conference February 2008 1 Safe Harbor Statement Except for historical information contained herein, the matters discussed in this presentation contain forward-looking
FIRST QUARTER RESULTS 2017
 FIRST QUARTER RESULTS 2017 KEY RESULTS In the 1Q17 Interjet total revenues added $4,421.5 million pesos that represented an increase of 14.8% over the income generated in the 1Q16. In the 1Q17, operating
Cowen 11 th Annual Global Transportation Conference
 Cowen 11 th Annual Global Transportation Conference September 5, 2018 Disclaimer This presentation contains forward-looking statements within the meaning of Section 27A of the Securities Act of 1933, as
Spirit Airlines Reports Highest Second Quarter Pre-Tax Margin in Company History
 July 24, 2013 Spirit Airlines Reports Highest Second Quarter Pre-Tax Margin in Company History MIRAMAR, Fla., July 24, 2013 (GLOBE NEWSWIRE) -- Spirit Airlines, Inc. (Nasdaq:SAVE) today reported second
E190 REPLACEMENT & FLEET UPDATE JULY 11, 2018
 1 E190 REPLACEMENT & FLEET UPDATE JULY 11, 2018 SAFE HARBOR This presentation contains forward-looking statements within the meaning of the Private Securities Litigation Reform Act of 1995, Section 27A
Analyst and Investor Conference Call Q Ulrik Svensson, CFO and Member of the Executive Board
 Analyst and Investor Conference Call Q2 2017 Ulrik Svensson, CFO and Member of the Executive Board Frankfurt, 2 August 2017 Disclaimer The information herein is based on publicly available information.
RESULTS RELEASE 20 August GENTING HONG KONG GROUP ANNOUNCES FIRST HALF RESULTS FOR 2015 Highlights
 RESULTS RELEASE 20 August 2015 FOR IMMEDIATE RELEASE INTERNATIONAL GENTING HONG KONG GROUP ANNOUNCES FIRST HALF RESULTS FOR 2015 Highlights The commentary below is prepared based on a comparison of the
Adjusted net income of $115 million versus an adjusted net loss of $7 million in the second quarter of 2012, an improvement of $122 million
 Air Canada Reports Record Second Quarter 2013 Results Highest Adjusted Net Income, Operating Income and EBITDAR Results for Second Quarter in Air Canada s History Adjusted net income of $115 million versus
OPERATING AND FINANCIAL HIGHLIGHTS
 Copa Holdings Reports Financial Results for the Fourth Quarter of 2018 Excluding special items, adjusted net profit came in at $44.0 million, or Adjusted EPS of $1.04 Panama City, Panama --- February 13,
Volaris Reports Strong First Quarter 2015: 32% Adjusted EBITDAR Margin, 9% Operating Margin
 Volaris Reports Strong First Quarter 2015: 32% Adjusted EBITDAR Margin, 9% Operating Margin Mexico City, Mexico, April 22, 2015 Volaris* (NYSE: VLRS and BMV: VOLAR), the ultra-low-cost airline serving