Positive rental reversions in Hong Kong portfolio. Rising contribution from Singapore office portfolio. Strong performance from Residential business
|
|
|
- Marion Lyons
- 5 years ago
- Views:
Transcription

1
2 2012 Review The Group performed well in 2012 Positive rental reversions in Hong Kong portfolio Rising contribution from Singapore office portfolio Strong performance from Residential business 2
3 Highlights US$703m Underlying profit attributable to shareholders US$777m US$4,603m Non-trading items US$662m US$5,306m Profit attributable to shareholders US$1,439m US Underlying earnings per share US US Earnings per share US US$10.58 NAV per share US$11.11 US Final dividend per share US US Total dividend per share US

4 Commercial Property
5 Commercial Portfolio ( 000 sq. ft NFA) HKL s SHARE Office Retail Hotel Total Hong Kong 4, ,884 Macau Singapore 1, ,785 Jakarta Hanoi Bangkok Others TOTAL 6, ,251 5

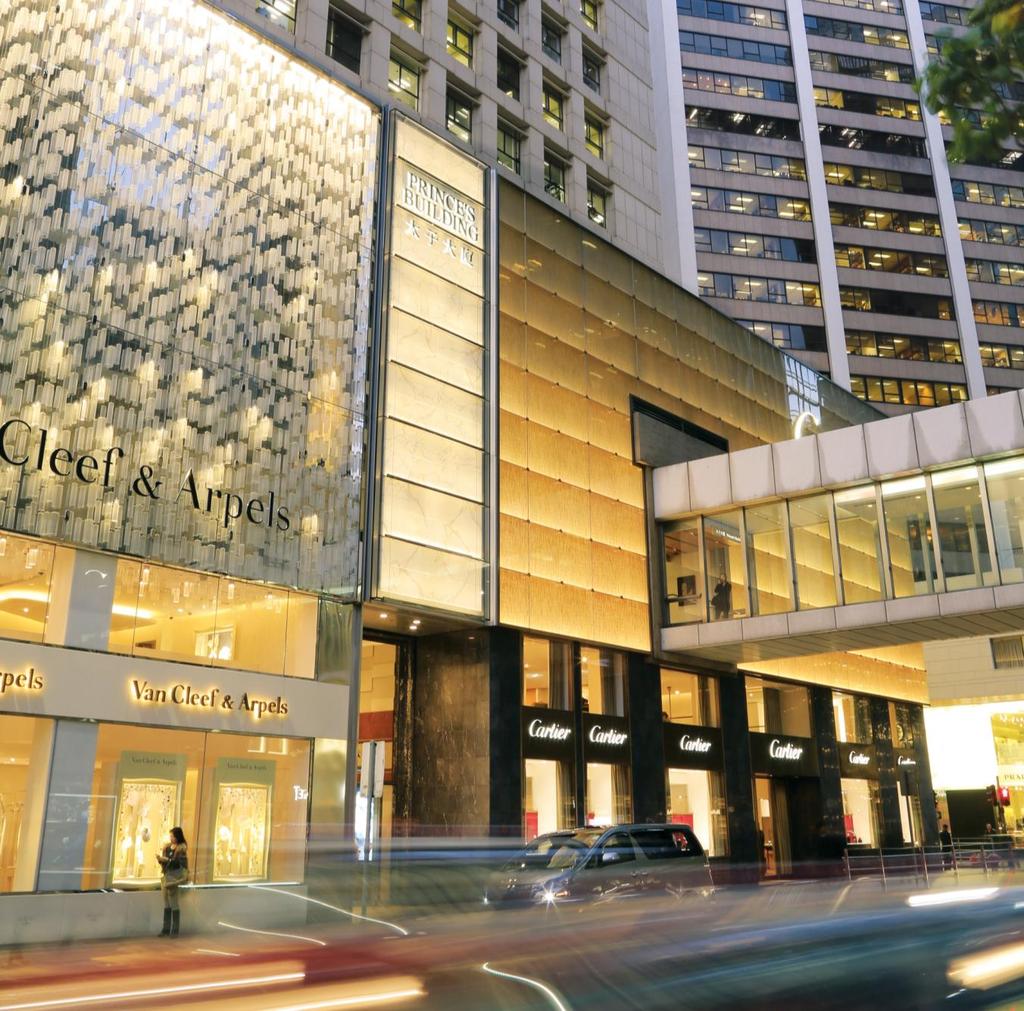
6 Hong Kong 1. One Exchange Square 2. Two Exchange Square 3. Three Exchange Square 4. The Forum under redevelopment 5. Jardine House 6. Chater House 7. Alexandra House 8. Gloucester Tower 9. Edinburgh Tower 9a. The Landmark Mandarin Oriental 10. York House 11. Landmark Atrium 12. Prince s Building 6
7 Hong Kong Central Grade A Office Rental Index Index Source: Jones Lang LaSalle 7
8 Hong Kong Central Grade A Office Market m sq. ft New supply Net take up Vacancy Vacancy % '98 '99 '00 '01 '02 '03 '04 '05 '06 '07 '08 '09 '10 '11 '12 '13 '14 '15 '16 '17 Source: Jones Lang LaSalle Disclaimer: The above forecast shall be regarded solely as general guide, no representation is made nor responsibility accepted by Jones Lang LaSalle for the accuracy of the whole or any part whatsoever. 8
9 Hong Kong Grade A Office Market m sq. ft Vacancy % 8 16 New supply Net take up Vacancy '98 '99 '00 '01 '02 '03 '04 '05 '06 '07 '08 '09 '10 '11 '12 '13 '14 '15 '16 '17 Source: Jones Lang LaSalle Disclaimer: The above forecast shall be regarded solely as general guide, no representation is made nor responsibility accepted by Jones Lang LaSalle for the accuracy of the whole or any part whatsoever. 9
10 Hongkong Land Central Portfolio: Office Average Net Rent (HK$ psf/month) Year-end Vacancy 2.9% 2.0% 3.4% Weighted Average Lease Expiry (years)
11 Hong Kong: Office Tenant Profile Property 6% Trading 3% Government 5% Accounting 8% Others 13% Banks and other financial services 35% Legal 30% 11
12 Hong Kong: Expiration and Interim Rent Revisions Total lettable office area subject to expiration/rent revisions ( 000 sq. ft) 864 1,322 1,304 % of area subject to expiration/rent revisions 21% 32% 32% Average expiring net rent (HK$ psf/month)

13 The Forum Redevelopment Premium office development 40,700 sq. ft NFA Completion in early 2014 Pedestrian Plaza to be significantly enhanced 13
14 Hongkong Land Central Portfolio: Retail Average Net Rent (HK$ psf/month) Year-end Vacancy 0% 0% 0% Weighted Average Lease Expiry (years)


15 Macau One Central (47%-owned) Retail component 95% let 15


")


16 Singapore One Raffles Link Marina Bay Financial Centre (33%-owned) Singapore One Raffles Quay (33%-owned) Background Image from Google Earth 16
17 Singapore CBD Grade A Office Market m sq. ft 4 3 New supply Net take up Vacancy Vacancy % '98 '99 '00 '01 '02 '03 '04 '05 '06 '07 '08 '09 '10 '11 '12 '13 '14 '15 '16 '17 CBD Raffles Place, Shenton Way & Marina Bay Source: Jones Lang LaSalle Disclaimer: The above forecast shall be regarded solely as general guide, no representation is made nor responsibility accepted by Jones Lang LaSalle for the accuracy of the whole or any part whatsoever. 17
18 Singapore Commercial Portfolio ( 000 sq. ft NFA) Attributable HKL Office Retail Total Interest One Raffles Link One Raffles Quay 1, , Marina Bay Financial Centre Towers 1 & 2 1, , Tower 3 1, , TOTAL 4, ,732 1,785 18

19 Singapore: Office Tenant Profile Natural resources 10% Accounting 1% Other 5% Banks and other financial services 78% Legal 6% 19
20 Singapore: Average Rents and Occupancy Average Gross Rent: S$8.9 psf (2011: S$8.6 psf) Occupancy: 94% (including MBFC Tower 3) Weighted Average Lease Expiry (years): 6.6 Note: Average gross rent applies to office portion only and excludes MBFC Tower 3 20
21 Singapore: Expiration and Interim Rent Revisions HKL Share: Total lettable office area subject to expiration/rent revisions ( 000 sq. ft) % of area subject to expiration/rent revisions 5% 16% 28% Average expiring rent (S$ psf/month) Note: The analysis excludes the unlet 22% of MBFC Tower 3 21

22 Jakarta Jakarta Land (50%-owned) Commercial space of 140,000 sq. m. after completion of World Trade Centre II Occupancy: 94% Average gross rent: US$20.6 psm (2011: US$18.2 psm) 22

 Hanoi")
")
 Background")
23 Hanoi, Bangkok and Phnom Penh Central Building (71%-owned) 63 Ly Thai To (74%-owned) Hanoi Bangkok Phnom Penh Gaysorn (49%-owned) Embassy Site (100%-owned) Background Image from Google Earth 23

24 Beijing Wangfujing (95%-owned) Prestigious retail-led centre, including small luxury hotel Completion: - retail Q hotel Q

25 Beijing CBD (30%-owned) Prime Grade A office Completion: mid


26 Residential Property

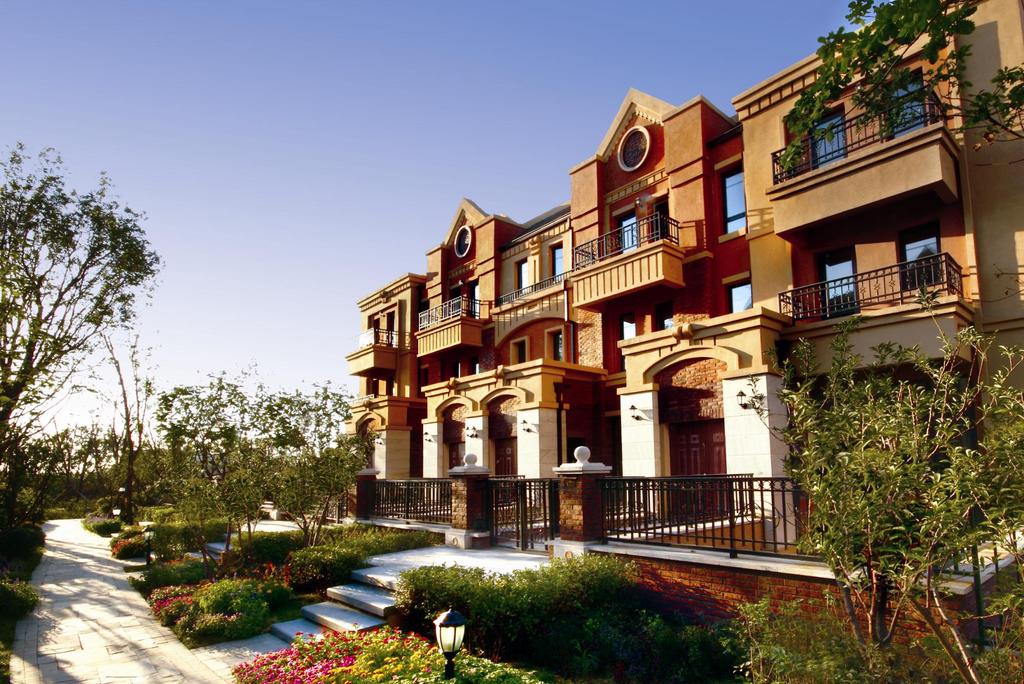
27 Hong Kong Serenade 140,000 sq. ft Two 47-storey towers 97 units 20 units handed over in remaining units 27

28 Macau One Central Macau (47%-owned) 12 units handed over 3 units remaining for sale 10 units scheduled for completion over next 18 months 28


29 Mainland China Shenyang Beijing Chengdu Chongqing Background Image from Google Earth 29


30 Mainland China Completed Projects Project Interest Project Type Maple Place, Beijing 90% High end residential - 13 units handed over in units available for future sale, mostly leased Central Park, Beijing 40% 72 units of serviced apartments Maple Place Central Park 30
31 Mainland China Development Projects Summary Project Interest Project Type Bamboo Grove, Chongqing 50% Primarily Residential Landmark Riverside, Chongqing 50% Residential (80%), Office, Retail & Other Yorkville South, Chongqing 100% Primarily Residential Yorkville North, Chongqing 100% Residential (73%), Office, Retail & Other Chengdu Project 50% Residential (47%), Office (22%), Hotel & Serviced Apartments (14%), Retail (17%) Shenyang Projects 50% Primarily Residential 31
32 Mainland China Development Projects Summary Project Year of Acquisition Site Area (ha) Developable Area (m sq. m.) HKL Share Constructed (m sq. m.) Under Construction (m sq. m.) Bamboo Grove Landmark Riverside Yorkville South Yorkville North Chengdu Project Shenyang Projects TOTAL
33 Mainland China Contracted Sales US$m 500 Chongqing Chengdu Shenyang Beijing 400 $429m $165m $160m Note: The above chart includes HKL s share of Contracted Sales 33
34 Mainland China Revenue Recognised US$m 500 Chongqing Shenyang Beijing $142m $159m $213m Note: The above chart includes HKL s share of Revenue Recognised 34
35 Mainland China Projects Launched for Sale Project Bamboo Grove - Phases 3C, 5A & B - Phase 6D Landmark Riverside - Phase 1A - Phase 1B Units in Phase 1, Units Launched for Sale 1, Units Pre-Sold (as at Feb 2013) 74% 100% 89% 43% HKL Share GFA Sold (sq. m.) 58,000 5,000 24,800 23,300 Completion Date Yorkville South % 54, Chengdu Project % 15, Shenyang Projects % 3, TOTAL 3,628 3, ,900 Note: Units sold are stated on a 100% basis but attributable GFA is HKL s share only 35


36 Singapore Current Residential Projects The Estuary Este Villa Avenue Ripple Bay Jurong West Terrasse Jurong Gateway D Mira Parvis Hallmark Residences Uber 388 Marina Bay Suites 36

 248 394 Sep")

37 Singapore Completions in 2012 Project Units GFA ( 000 sq. ft) Completion Date Sold Parvis (50%-owned) Sep % D Mira Nov % TOTAL Parvis D Mira 37
38 Singapore Projects Launched for Sale Project Units GFA ( 000 sq. ft) Estimated Completion Date Pre-Sold Este Villa % The Estuary % Terrasse % Uber % Ripple Bay % TOTAL 1,917 2,117 38
 Estimated Completion Date Palms@Sixth Avenue 32 109")

39 Singapore Projects to be Launched Project Units GFA ( 000 sq. ft) Estimated Completion Date Palms@Sixth Avenue Hallmark Residences Jurong Gateway TOTAL Palms@Sixth Avenue Hallmark Residences 39

40 Singapore Recent Acquisition Acquired Jan 2013 Cost: US$350m Total GFA: 675,000 sq. ft 670 apartments 40
 221 units, 0.")

41 Singapore Marina Bay Suites (33%-owned) 221 units, 0.47m sq. ft Completion % sold 34 units sold in

42 Indonesia BSD City, Greater Jakarta (49%-owned) JV with PT Bumi Serpong Damai Site area 68 ha Southwest of Central Jakarta Master planning underway 42

43 Financial Results
44 Consolidated Profit and Loss Account (US$m) ,224 Revenue 1,115 (392) Net operating costs (315) 832 Operating profit Share of results of joint ventures 166 (67) Net financing charges (61) (134) Tax (125) (4) Non-controlling interests (3) 703 Underlying profit 777 4,603 Non-trading items 662 5,306 Profit attributable to shareholders 1,439 44
45 Revenue (US$m) Commercial revenue Residential revenue 259 1,224 Total 1,115 Higher average rents in Hong Kong drove Commercial revenue Lower Residential revenue due to Singapore, where major 2012 project was in 50% joint venture 45
46 Underlying Profit by Business (US$m) Commercial property Residential property 301 (51) Corporate expenses (60) 996 1,061 (97) Net financing charges (96) (190) Tax (183) (6) Non-controlling interests (5) 703 Underlying profit
47 Commercial Property Operating Profit (US$m) Greater China Hong Kong Mainland China & Macau 17 Southeast Asia & Others 86 - Singapore Others Total
48 Residential Property Operating Profit (US$m) Greater China 77 - Hong Kong Mainland China & Macau 96 Southeast Asia & Others Singapore Others Total
49 Consolidated Cash Flow (US$m) Operating activities 299 (235) Investing activities (846) (59) Financing activities (297) (43) Others (70) (1) Movement in net debt (914) (2,358) Net debt at beginning of period (2,359) (2,359) Net debt at end of period (3,273) 49
50 Operating Activities (US$m) Operating profit excl. non-trading items 800 (57) Net interest paid (34) (118) Tax paid (148) 58 Dividends received from joint ventures 140 (373) Purchase of residential sites (791) (6) Others (primarily pre-sale proceeds)
51 Investing Activities (US$m) (51) Major renovations capex (48) (257) Funding of joint ventures (349) Development expenditure - - Wangfujing, China (498) (34) - Phnom Penh, Cambodia (2) 111 Loan repayments from joint ventures 58 (4) Others (7) (235) (846) 51
52 Consolidated Cash Flow (US$m) Operating activities 299 (235) Investing activities (846) Financing activities (371) - Dividends paid by the Company (374) Conversion of convertible bonds 57 (24) - Others 20 (59) (297) (43) Others (70) (1) Movement in net debt (914) (2,358) Net debt at beginning of period (2,359) (2,359) Net debt at end of period (3,273) 52
53 Consolidated Balance Sheet (US$m) ,623 3,132 Investment properties - Subsidiaries - Joint ventures 23,494 3,740 25,755 27,234 1,521 1,007 Properties held for sale - Subsidiaries - Joint ventures 2,514 1,168 2,528 3,682 (1,160) Others (1,459) 27,123 Gross assets (excl. cash) 29,457 24,764 2,359 Financed by: - Total equity - Net debt 26,184 3,273 27,123 29,457 53
54 Investment Property - Basis of Valuation Capitalisation Rates H Hong Kong Office Exchange Square 1 & % 4.20% 4.00% Hong Kong Retail Landmark Atrium 4.50% 4.50% 4.50% Singapore Office MBFC 4.00% 4.00% 4.00% Note: These capitalisation rates are provided on an indicative basis 54
55 Investment Property Carrying Values (US$m) Greater China 21,881 - Hong Kong 22, Mainland China & Macau 984 Southeast Asia & Others 3,187 - Singapore 3, Others ,755 Total 27,234 Note: The analysis includes share of Joint Ventures & Associates 55
56 Properties Held for Sale - Carrying Values (US$m) Greater China Hong Kong 83 1,228 - Mainland China & Macau 2,064 Southeast Asia & Others 1,157 - Singapore 1, Others 10 2,528 3,682 (644) Pre-sale Proceeds (938) 1,884 Net Investment 2,744 Note: The analysis includes share of Joint Ventures & Associates 56

57 Gross Assets at 31 Dec 2012 By Activity Residential 11% By Location Mainland China 8% Macau 2% Southeast Asia 15% Commercial 89% Hong Kong 75% 57
58 Treasury Management Summary Net debt (US$m) 2,359 3,273 Gearing 10% 13% Average tenor of debt (years) Average interest cost 2.6% 2.7% Credit ratings - S & P - Moody s A- A3 A- A3 58
59 2012 Financing Activity US$837m notes issued (under MTN Programme) Total of US$880m in bank facilities raised - US$642m in bilateral facilities with multiple banks - US$238m project loan for MCL Land The US$642m bilateral facilities to be used to partially refinance US$968m syndicated facility expiring June
60 Maturity Profile of Committed Facilities US$m 2,500 2,000 Bank Facilities (Drawn & Undrawn) Bonds 2 1,500 1, , Notes: (1) US$724m bank facilities due in 2013 have already been refinanced (2) Include bonds and notes issued under MTN Programme which are at face value 60
61 Liquidity at 31 Dec 2012 (All figures in US$bn) 2011 HK$ S$ US$ RMB Total Committed lines Gross debt Available lines Cash Available liquidity Notes: (1) HK$ debt includes US$ debt swapped into HK$ (2) S$ debt includes HK$ debt swapped into S$ 61
62 Outlook Commercial portfolio in Hong Kong will continue to benefit from limited supply Three Singapore residential completions due in 2013 Growing contribution from China residential business expected from 2014 onwards Our strategy remains focused on premium property developments in Greater China and Southeast Asia 62
63
Presentation Results. 4th March 2016
 Presentation 4th March 2016 2015 Review Sound result in 2015 Continued strong performance from commercial portfolio Entry into Shanghai with prime mixed-use site Stable asset values 1 Highlights 2014 2015
2016 Half-Yearly Results
 Presentation 29th July 2016 2016 Half-Yearly Review Underlying profit down 6% Commercial portfolio benefited from higher occupancy Steady contribution from mainland China residential business Profit attributable
2017 Half-Yearly Results
 2017 Half-Yearly Results Presentation 4th August 2017 Agenda Speakers: Robert Wong, Chief Executive & Simon Dixon, Chief Financial Officer 1. 2017 Half-Yearly Highlights 2. Investment Properties 3. Development
2017 Results 2018 Half-Yearly Results
 2017 Results 2018 Half-Yearly Results Presentation Presentation 27 July 2018 Agenda Speakers: Robert Wong, Chief Executive & Simon Dixon, Chief Financial Officer 1. 2018 Half-Yearly Highlights 2. Investment
2017 Results. Presentation. 9 March 2018
 2017 Results Presentation 9 March 2018 Agenda Speakers: Robert Wong, Chief Executive & Simon Dixon, Chief Financial Officer 1. 2017 Results Highlights 2. Investment Properties 3. Development Properties
2016 HALF YEAR RESULTS. Mandarin Oriental Hotel Group
 2016 HALF YEAR RESULTS Mandarin Oriental Hotel Group 2016 Half Year Results Highlights US $ m June 2016 June 2015 Combined Total Revenue * 644 641 Underlying EBITDA 71 82 * Includes revenue from the Group
2016 ANNUAL RESULTS. Mandarin Oriental Hotel Group
 2016 ANNUAL RESULTS Mandarin Oriental Hotel Group 2016 Annual Results Highlights US $ m 2016 2015 Combined Total Revenue * 1,324 1,335 Group s Total Revenue # 597 607 Underlying EBITDA 158 188 * Includes
The Wharf (Holdings) Limited. Interim Results. 15 August 2007
 Limited. Interim Results. 15 August 2007") The Wharf (Holdings) Limited Interim Results 15 August 2007 Key Recaps for Interim 2007 Properties continued to be the growth driver: turnover: HK$5,031M, +74; profit: HK$3,191M, +68 Core properties Harbour
The Wharf (Holdings) Limited Interim Results 15 August 2007 Key Recaps for Interim 2007 Properties continued to be the growth driver: turnover: HK$5,031M, +74; profit: HK$3,191M, +68 Core properties Harbour
Executive Directors Review
 Financial Summary Turnover for the year ended 31 December 2011 amounted to HK$571.4 million ( 47.6 million) (2010: HK$706.8 million ( 58.7 million)). The turnover was principally attributable to the recognition
15th August Interim Results Analyst Briefing
 15th August 2013 2013 Interim Results Analyst Briefing Brickell CityCentre, Miami, U.S.A. Financial Summary Results Highlights Gross Rental Income Underlying Profit Equity Attri. to Shareholders HK$ M
Great Portland Estates Trading Update Strong Operational Performance
 Press Release 6 July 2017 Great Portland Estates Trading Update Strong Operational Performance Great Portland Estates plc ( GPE ) today publishes its trading update for the quarter to 30 June 2017. Continued
Standard Chartered to move to Marina Bay Financial Centre
 PRESS RELEASE Standard Chartered to move to Marina Bay Financial Centre Leasing up to 500,000 sq ft of space at Tower 1 to accommodate business growth 18 April 2007, Singapore Standard Chartered and BFC
2017 ANNUAL RESULTS. Mandarin Oriental Hotel Group
 2017 ANNUAL RESULTS Mandarin Oriental Hotel Group 2017 Performance and Highlights Hotels performed better in 2017 Results impacted by ongoing renovation of London property Restoration of Hotel Ritz, Madrid
KSH HOLDINGS LIMITED. Corporate Presentation May 27, 2014
 KSH HOLDINGS LIMITED Corporate Presentation May 27, 2014 KSH Corporate Presentation OVERVIEW KSH Holdings Limited RESULTS FY2014 UPDATES Corporate Developments OUTLOOK Strategies Moving Forward CONCLUSION
2011 Final Results Analyst Briefing
 2011 Final Results Analyst Briefing Analyst Presentation XX March 2010 15 March 2012 Hong Kong 1. Key Developments Key Developments Apr2011 Acquiredtwo parcels of land adjoining the existing Brickell CitiCentre
Interim Results Presentation. 27 March 2008
 Interim Results Presentation 27 March 2008 Contents Page Group structure Results snapshot Review of operations Hong Kong China Market outlook Looking ahead Investor contact 3 4-7 8-10 11-14 15 16 18-2
2008 INTERIM ANNOUNCEMENT
 (Stock Code: 78) 2008 INTERIM ANNOUNCEMENT FINANCIAL HIGHLIGHTS Six months ended 30th June, 2008 (Unaudited) Six months ended 30th June, 2007 (Unaudited) HK$ M HK$ M Revenue 750.8 622.0 Operating profit
FULL YEAR FINANCIAL REPORT
 FULL YEAR FINANCIAL REPORT 1 Jan 31 Dec 2013 27 February 2014 ANALYST / MEDIA BRIEFING Artist s Impression of Lush Acres FINANCIAL HIGHLIGHTS Artist s Impression of D Nest KEY FINANCIAL HIGHLIGHTS Delivered
HALF YEAR RESULTS 2012
 HALF YEAR RESULTS 2012 2012 HALF YEAR PERFORMANCE Improved performances at most Asian hotels Challenging economic conditions impacted results in Europe Total revenues increased in The Americas, despite
2008 ANNUAL RESULTS HIGHLIGHTS
 2008 ANNUAL RESULTS HIGHLIGHTS US$m Combined Total Revenue EBITDA 2008 1,016 164 2007 1,008 190 Two-thirds of drop in earnings in 2008 due to currency related movements and Geneva renovation Remaining
Cathay Pacific Airways Interim Results for the six months ended 30 June 2012
 Cathay Pacific Airways Interim Results for the six months ended 30 June 2012 8 August 2012 1 Interim Result 1H2012 1H2011 Change Group attributable (loss) / profit HK$ million (935) 2,808-133.3% Group
 FINANCIAL STATEMENT AND RELATED ANNOUNCEMENT https://www1.sgxnet.sgx.com/sgxnet/lcanncsubmission.nsf/vwprint/f844e4b372cc79d4482578e900280e08?open... Page 1 of 1 12/8/2011 Print this page Presentation
HOPEWELL HOLDINGS LIMITED ANNOUNCES FY 2018/19 INTERIM RESULTS
 Press Release HOPEWELL HOLDINGS LIMITED ANNOUNCES FY 2018/19 INTERIM RESULTS Highlights 1H FY19 (1 April to 30 September 2018) First financial year after the change of financial year end date from 30 June
Singapore Property Market
 Half Year Financial Report 1 Jan 30 June 2006 14 August 2006 Presentation Outline I. Singapore Property Market II. Operation Review III. Financial Highlights IV. Market Outlook 1 Singapore Property Market
2006 INTERIM ANNOUNCEMENT
 (Stock Code: 78) 2006 INTERIM ANNOUNCEMENT FINANCIAL HIGHLIGHTS Six months ended 30th June, 2006 (Unaudited) Six months ended 30th June, 2005 % Change (Unaudited) HK$ M HK$ M Revenue 608.3 542.4 +12.1%
2014 Annual Results 1
 1 2014 Annual Results Annual Results 2014 2013 Change HK$M HK$M Attributable profit 573 625-8.3% Revenue 11,927 7,387 +61.5% Earnings per share (HK$) 3.45 3.76-8.3% Total dividends per share (HK$) 2.10
Singapore. 23 October 2007
 Raffles Raffles City City Acquisition Singapore 23 October 2007 1 3Q 2007 - RCS Trust Actual S$'000 1 Jan 2007 to 30 Sep 2007 CCT's 60% Interest RCS Trust Forecast 1 S$'000 Var. % Actual S$'000 Gross Revenue
Cathay Pacific Airways Annual Results 10 March Cathay Pacific Airways Interim Results 6 August 2008
 Cathay Pacific Airways 2009 Annual Results 10 March 2010 Cathay Pacific Airways 2008 Interim Results 6 August 2008 Annual Result 2009 2008 (restated) Group Profit/(Loss) HK$4,694m (HK$8,696m) Group Turnover
Investor Meeting Presentation. 4 June 2014
 Investor Meeting Presentation 4 June 2014 COMPANY OVERVIEW 1Q2014 RESULTS OVERVIEW OPERATION HIGHLIGHTS Q&A 2 Founded in 1963, listed on the Singapore Exchange in 1964 Three core businesses: - Property
Oxley Delivers Stellar Growth of 58% in PATMI to. S$130.9 million for HY2017
 For immediate release Oxley Delivers Stellar Growth of 58% in PATMI to S$130.9 million for HY2017 - Half-year revenue increased by 19% year-on-year to S$732.2 million - Gross profit margin increased from
Cathay Pacific Airways
 Cathay Pacific Airways Interim Results for the six months ended 30 th June 2014 13th August 2014 1 Interim Results 1H2014 1H2013 Change Profit attributable to the shareholders of Cathay Pacific HK$ million
Hongkong Land Officially Opens WF CENTRAL in Beijing
 News Release To: Business Editors For immediate release Hongkong Land Officially Opens WF CENTRAL in Beijing BEIJING, 29 th May 2018 - Hongkong Land today officially opened WF CENTRAL, its US$1.2 billion
HALF YEAR REPORT February Leighton Holdings Limited
 HALF YEAR REPORT February 2009 PRESENTATION OUTLINE Results highlights Operational update Financial statements Strategy and outlook 2 Half Year Report I 12 February 2009 I RESULTS HIGHLIGHTS 3 Half Year
Analysts Briefing. 18 March Cathay Pacific Airways Limited
 Analysts Briefing 18 March 2015 Cathay Pacific Airways Limited Annual Results 2014 2013 Change Group attributable profit HK$m 3,150 2,620 +20.2% Group turnover HK$m 105,991 100,484 +5.5% Profit margin
Cathay Pacific Airways 2010 Annual Results 9 March 2011
 Cathay Pacific Airways 2010 Annual Results 9 March 2011 1 Annual Result 2010 2009 Change Group Profit/(Loss) HK$14,048m HK$4,694m +199.3% Group Turnover HK$89,524m HK$66,978m +33.7% Profit Margin 15.7%
CapitaMalls Asia Limited Annual General Meeting Extraordinary General Meeting
 CapitaMalls Asia Limited Annual General Meeting Extraordinary General Meeting 17 April 2014 1 Disclaimer No representation or warranty expressed or implied is made as to, and no reliance should be placed
Centurion Corporation Limited
 Centurion Corporation Limited Corporate Presentation 6 January 2014 Disclaimer This presentation and the accompanying presentation materials (if any) ("Presentation") are made for informational purposes,
SET Opportunity Day #3/2011
 SET Opportunity Day #3/2011 2Q11 & 1H11 Performance & Outlook 18 August 2011 The views expressed here contain some information derived from publicly available sources that have not been independently verified.
Cathay Pacific Airways
 Cathay Pacific Airways Annual Results for the year ended 31 st December 2011 14 March 2012 1 Annual Result 2011 2010 Change Group attributable profit HK$5,501m HK$14,048m -60.8% Group Turnover HK$98,406m
An improvement in first-half results relative to the year-earlier period, driven by growth in tourism revenue.
 Paris, 30 May 2018 An improvement in first-half results relative to the year-earlier period, driven by growth in tourism revenue. I. Main events during H1 2017/2018 Financing operations In order to refinance
Wheelock and Company Limited The Wharf (Holdings) Limited. 28 November 2007 Analyst Briefing
 Limited. 28 November 2007 Analyst Briefing") Wheelock and Company Limited The Wharf (Holdings) Limited 28 November 2007 Analyst Briefing Wheelock s Results (for 6-month period ended 30.9.07) Consolidation Wharf s financial statements were fully consolidated
Wheelock and Company Limited The Wharf (Holdings) Limited 28 November 2007 Analyst Briefing Wheelock s Results (for 6-month period ended 30.9.07) Consolidation Wharf s financial statements were fully consolidated
2009 HALF-YEARLY RESULTS HIGHLIGHTS
 2009 HALF-YEARLY RESULTS HIGHLIGHTS US$m Combined Total Revenue of Hotels under Management EBITDA (US$m) June 2009 389.7 34.5 June 2008 520.2 86.2 Depressed demand due to global downturn Group takes action
2012 Full Year Results Briefing. 28 February 2013
 2012 Full Year Results Briefing 28 February 2013 1 KEY FINANCIALS & STRATEGY BUSINESS REVIEW OUTLOOK Q&A 2 UOL GROUP LIMITED KEY FINANCIALS & STRATEGY GWEE LIAN KHENG GROUP CHIEF EXECUTIVE 3 S$m FY 2012
Unlocking potential SALES TEAM BRIEFING. Kaupthing Singer & Friedlander Capital Markets Ltd. Great Portland Estates plc Toby Courtauld Chief Executive
 Unlocking potential Unlocking potential SALES TEAM BRIEFING Kaupthing Singer & Friedlander Capital Markets Ltd Great Portland Estates plc Toby Courtauld Chief Executive Robert Noel Property Director 8
JOINTLY ANNOUNCES 2017/18 INTERIM RESULTS * * * RENTAL INCOME SURGES 25% STRENGTHS RECURRING INCOME STREAMS FOR SUSTAINABLE GROWTH
 [For Immediate Release] JOINTLY ANNOUNCES 2017/18 INTERIM RESULTS * * * RENTAL INCOME SURGES 25% STRENGTHS RECURRING INCOME STREAMS FOR SUSTAINABLE GROWTH (Hong Kong, 23 November, 2017) Emperor International
2005 INTERIM ANNOUNCEMENT
 (Stock Code: 78) 2005 INTERIM ANNOUNCEMENT FINANCIAL HIGHLIGHTS Six months ended 30th June, 2005 (Unaudited) HK$ M Six months ended 30th June, 2004 (Unaudited and restated) HK$ M % Change Turnover 542.4
Crown Limited Full Year. Results Presentation. 25 August 2011
 Crown Limited 2011 Full Year Results Presentation 25 August 2011 1 Crown Limited Overview Normalised 1 NPAT up 18.0% to $340.3 million, Reported NPAT $335.9 million, up 14.9% Australian casinos performance:
Portfolio. income at ANZ income was up. With. first-half. share
 NZX and media announcement 19 February 2013 Precinct announces improvedi result and positive outlook Performance for six months to 31 December 2012 Financial Performance Net profit after tax: $23.6 millionn
HALF YEAR RESULTS TO 30 SEPTEMBER 2017
 HALF YEAR RESULTS TO 30 SEPTEMBER 2017 1 AGENDA ONE RESULTS HIGHLIGHTS Gerald Kaye TWO FINANCIALS Tim Murphy THREE PORTFOLIO HIGHLIGHTS Matthew Bonning-Snook FOUR OUTLOOK Gerald Kaye FIVE Q&A 2 RESULTS
Frasers Commercial Trust. Portfolio details as at 31 March 2018
 Frasers Commercial Trust Portfolio details as at 31 March 2018 20 April 2018 Portfolio Composition 2 Asset values Total: S$2,219.2 million as at 31 March 2018^ Singapore: S$1,226.0 million (55%) Australia:
THE HONGKONG AND SHANGHAI HOTELS, LIMITED
 To: All Financial/Business/Travel Editors FOR IMMEDIATE RELEASE 24 AUGUST, 2011 THE HONGKONG AND SHANGHAI HOTELS, LIMITED INTERIM RESULTS FOR THE SIX MONTHS ENDED 30 JUNE 2011 HIGHLIGHTS Positive momentum
Frasers Commercial Trust. Portfolio details as at 30 September 2018
 Frasers Commercial Trust Portfolio details as at 30 September 2018 19 October 2018 Portfolio Composition 2 Asset values Total: S$2,133.5 million as at 30 September 2018^ Singapore: S$1,140.4 million (54%)
Cathay Pacific Airways Interim Results 04 August Cathay Pacific Airways Interim Results 6 August 2008
 Cathay Pacific Airways 2010 Interim Results 04 August 2010 Cathay Pacific Airways 2008 Interim Results 6 August 2008 Interim Result 1H 2010 1H 2009 Group Profit/(Loss) HK$6,840m HK$812m Group Turnover
2008 INTERIM RESULTS HIGHLIGHTS
 2008 INTERIM RESULTS HIGHLIGHTS US$m Combined Total Revenue of Hotels under Management EBITDA (US$m) June 2008 520.1 86.2 June 2007 477.4 84.5 2008 INTERIM RESULTS HIGHLIGHTS US$m June 2008 June 2007 Profit
HATTEN LAND LIMITED. Shaping the Future, Melaka and Beyond. Corporate Presentation 12 October 2017
 HATTEN LAND LIMITED Shaping the Future, Melaka and Beyond Corporate Presentation 12 October 2017 Disclaimer Information in this presentation may contain forward-looking statements that reflect the current
2008/09 Interim Results For the six months ended 31 December 2008
 Bossini International Holdings Limited 2008/09 Interim Results For the six months ended 31 December 2008 Corporate Presentation 18 March 2009 0 0 Disclaimer The information contained in this presentation
Crown Resorts Limited
 Crown Resorts Limited 2015 Full Year Results Presentation 13 August 2015 1 Crown Resorts Limited Results Overview Crown Resorts Limited (Crown) performance: Overall, the results for Crown s portfolio of
ARSN Interim Report Responsible Entity Brookfield Capital Management Limited ACN AFSL
 Brookfield Prime Property Fund ARSN 110 096 663 Interim Report 2015 Responsible Entity Brookfield Capital Management Limited ACN 094 936 866 AFSL 223809 1 Message from the Chairman 2 Half Year Review 5
THE HONGKONG AND SHANGHAI HOTELS, LIMITED
 FOR IMMEDIATE RELEASE 26 AUGUST 2009 THE HONGKONG AND SHANGHAI HOTELS, LIMITED INTERIM RESULTS FOR THE SIX MONTHS ENDED 30 JUNE 2009 HIGHLIGHTS Key financial results Turnover decreased by 18% to HK$1,962
Crown Resorts Limited
 Crown Resorts Limited Annual General Meeting 20 October 2016 1 Presentation Outline F16 Year in Review 2 Crown Resorts Limited Group Result F16 Normalised $m F15 Normalised $m Variance F/(U) F16 Actual
IHG. Supplementary Information 31 December 2014
 Supplementary Information 31 December 2014 Index RevPAR - 3 and 12 months to 31 December 2014 2014 Current Trading RevPAR, ADR & Occupancy Hotel & Room Count at 31 December 2014 Pipeline at 31 December
Cathay Pacific Airways 2011 Analyst Briefing 23 June 2011
 Cathay Pacific Airways 2011 Analyst Briefing 23 June 2011 1 Airline Strategy Grow our international network, expand frequencies and further develop Hong Kong as one of the world s leading aviation hubs
Colliers International March 2016 The New Bund
 Colliers International March 2016 The New Bund 3 WENSHUI ROAD A 20 MIDDLE RING ROAD Shanghai Railway Station Lujiazui People s Square Hongqiao Transportation Hub WEST YAN AN ROAD Xujiahui INNER RING
274% 150% of the Company (HK$ million) Basic earnings per share (HK cent) % Interim dividend per share (HK cent) 5 5
 Basic earnings per share (HK cent) % Interim dividend per share (HK cent) 5 5") Press Release For Immediate Release KWIH 2015 Interim Profit Increased 150% to HK$534 Million Attributable Contracted Sales Surged 5 Times to Approximately HK$8,700 Million in the First Half of the Year
Press Release For Immediate Release KWIH 2015 Interim Profit Increased 150% to HK$534 Million Attributable Contracted Sales Surged 5 Times to Approximately HK$8,700 Million in the First Half of the Year
Annual Results for the year ended 28 February 2015
 Annual Results for the year ended 28 February 2015 AGENDA OVERVIEW PROPERTY UNITED KINGDOM PROPERTY DEVELOPMENT AFRICA FINANCIAL SERVICES FINANCIAL REVIEW LOOKING AHEAD Q & A ANNUAL RESULTS FOR THE YEAR
1HFY2012 RESULTS PRESENTATION
 1HFY2012 RESULTS PRESENTATION 21st February 2012 AWARD WINNING PROPERTY DEVELOPER Listed 1994, consistently profitable, always paid dividends Strategically located and diverse residential portfolio Urban
Frasers Commercial Trust. Portfolio details as at 30 June 2018
 Frasers Commercial Trust Portfolio details as at 30 June 2018 25 July 2018 Portfolio Composition 2 Asset values Total: S$2,242.9 million as at 30 June 2018^ Singapore: S$1,239.6 million (55%) Australia:
An Overview of SATS. Cho Wee Peng, CFO SIAS Corporate Profile & Investment Seminar 30 November 2013
 An Overview of SATS Cho Wee Peng, CFO SIAS Corporate Profile & Investment Seminar 30 November 2013 Forward Looking Statements This presentation may contain forward-looking statements regarding, among other
BAA (SP) Limited Results for six months ended 30 June July 2011
 Limited Results for six months ended 30 June July 2011") BAA (SP) Limited Results for six months ended 30 June 2011 July 2011 Record Q2 Heathrow traffic Good overall service standards Strong financial results Successful dollar and sterling financings H1 2011
BAA (SP) Limited Results for six months ended 30 June 2011 July 2011 Record Q2 Heathrow traffic Good overall service standards Strong financial results Successful dollar and sterling financings H1 2011
Record Retail Sales Drove Robust Performance. Wharf Real Estate Investment Company Limited 2018 Interim Results 7 Aug 2018
 Record Retail Sales Drove Robust Performance Wharf Real Estate Investment Company Limited 2018 Interim Results 7 Aug 2018 Highlights 999-year Land Leases Offer a Differentiation* HKIP & Hotel 6 Core Assets
Corporate Presentation 2015/16 Interim Results
 Corporate Presentation 2015/16 Interim Results 24 February 2016 0 Disclaimer The information contained in this presentation is intended solely for your personal reference. Such information is subject to
PAN PACIFIC HOTELS GROUP LIMITED 2010 FULL YEAR RESULTS BRIEFING 22 FEB 2011
 PAN PACIFIC HOTELS GROUP LIMITED 2010 FULL YEAR RESULTS BRIEFING 22 FEB 2011 2010 RESULTS OVERVIEW STRATEGIC & OPERATIONS HIGHLIGHTS NEO SOON HUP CHIEF FINANCIAL OFFICER 2 CONTENTS Focus and Highlights
Quarterly Meeting# 4/2018
 Quarterly Meeting# 4/2018 3Q18 & 9M18 Performance & Outlook 14 November 2018 1 2016 ERAWAN. All rights reserved. The views expressed here contain some information derived from publicly available sources
YANLORD, TOGETHER WITH HO BEE AND SHANGHAI YOUYOU, ACQUIRES TWO PRIME RESIDENTIAL SITES IN ZHUHAI FOR RMB3.0 BILLION
 YANLORD, TOGETHER WITH HO BEE AND SHANGHAI YOUYOU, ACQUIRES TWO PRIME RESIDENTIAL SITES IN ZHUHAI FOR RMB3.0 BILLION Yanlord, together with Ho Bee and Shanghai Youyou Group in a 60%, 20%, 20% joint venture,
Heathrow (SP) Limited
 Limited") 28 April 2014 Heathrow (SP) Limited Results for three months ended 31 March 2014 Strong operational and financial performance at the outset of the new regulatory period Highest ever passenger satisfaction
28 April 2014 Heathrow (SP) Limited Results for three months ended 31 March 2014 Strong operational and financial performance at the outset of the new regulatory period Highest ever passenger satisfaction
Ramsay Health Care Limited Results Briefing Half Year ended 31 December 2018
 Ramsay Health Care Limited Results Briefing Half Year ended 31 December 2018 Craig McNally, Group Managing Director & Bruce Soden, Group Finance Director 28 February 2019 ramsayhealth.com Agenda Group
Cathay Pacific Airways Analyst Briefing. 21 November 2014
 Cathay Pacific Airways Analyst Briefing 21 November 2014 Operating Performance Passenger demand remains strong, although growth in North America is significantly short of increase in capacity. Demand for
Corporate Presentation 2012/13 Interim Results
 Corporate Presentation 2012/13 Interim Results 26 February 2013 0 Disclaimer The information contained in this presentation is intended solely for your personal reference. Such information is subject to
Page 1. News Release
 Page 1 News Release To: Business/Finance/Property/News Page For immediate release Hongkong Land Breathes New Life into Wangfujing with Landmark Project WF CENTRAL Introducing WF CENTRAL, a premium lifestyle
APAC HOSPITALITY INVESTMENTS IN 2013 HIGHEST IN 5 YEARS. 1H 2014 continues to see healthy level
 PRESS RELEASE For Immediate Release APAC HOSPITALITY INVESTMENTS IN 2013 HIGHEST IN 5 YEARS 1H 2014 continues to see healthy level HONG KONG, 21 st Aug, 2014 Cushman & Wakefield, Global Real Estate Consultancy,
Record Retail Sales Drove Robust Performance. Wharf Real Estate Investment Company Limited 2018 Interim Results 7 Aug 2018
 Record Retail Sales Drove Robust Performance Wharf Real Estate Investment Company Limited 2018 Interim Results 7 Aug 2018 Highlights 999-year Land Leases Offer a Differentiation* HKIP & Hotel 6 Core Assets
UOL Group FY2017 Full Year Results 27 February 2018
 UOL Group FY2017 Full Year Results 27 February 2018 AGENDA FY2017 HIGHLIGHTS KEY FINANCIALS OPERATION HIGHLIGHTS MARKET OUTLOOK Panelists: Mr Liam Wee Sin, Deputy Group Chief Executive Officer (UOL Group)
Heathrow (SP) Limited
 Limited") Draft v2.0 10 Feb Heathrow (SP) Limited Results for year ended 31 December 2013 24 February 2014 Strong operational and financial performance in 2013 Passenger satisfaction at record high and over 72 million
Draft v2.0 10 Feb Heathrow (SP) Limited Results for year ended 31 December 2013 24 February 2014 Strong operational and financial performance in 2013 Passenger satisfaction at record high and over 72 million
Goodman Property Trust. 30 & 31 October 2018 NAB First Look USPP Conference, Sydney
 Goodman Property Trust 30 & 31 October 2018 NAB First Look USPP Conference, Sydney Contents Presented by: Andy Eakin Chief Financial Officer James Spence Director Investment Management GMT overview 3 Auckland
Minor International Public Company Limited
 Minor International Public Company Limited Management Discussion & Analysis MINT s financial performance as of 30th June 2008 Summary of Key Financial Performance 2Q08 Performance Minor International Public
Press Release For Immediate Release
 Press Release For Immediate Release FRANSHION PROPERTIES (CHINA) LIMITED Announces 2008 Interim Results Revenue Surged by 797% to HK$870.3 million Profit Attributable to Equity Holders Grew by a Substantial
GOING PLACES MACARTHURCOOK OFFICE PROPERTY TRUST
 GOING PLACES MACARTHURCOOK OFFICE PROPERTY TRUST ANNUAL REPORT 2006 1 2 3 4 1 2 181 Miller Street, North Sydney, NSW 150 170 Leichhardt Street, Spring Hill, Brisbane, QLD 3 4 38 Akuna Street, Canberra,
Melco International Development Limited (Incorporated in Hong Kong with limited liability) Website : (Stock Code : 200)
 Website : (Stock Code : 200)") Hong Kong Exchanges and Clearing Limited and The Stock Exchange of Hong Kong Limited take no responsibility for the contents of this announcement, make no representation as to its accuracy or completeness
Hong Kong Exchanges and Clearing Limited and The Stock Exchange of Hong Kong Limited take no responsibility for the contents of this announcement, make no representation as to its accuracy or completeness
Suzhou Cultural & Tourism Development, China
 AT A GLANCE VALUATION & ADVISORY SERVICES I ASIA FEATURE STORIES Retail Consultancy in Busan, South Korea We completed a retail consultancy study for a landmark shopping mall in Busan, South Korea. The
CapitaMalls Asia Limited Asia s Leading Mall Developer, Owner and Manager Singapore China Malaysia Japan India
 CapitaMalls Asia Limited Asia s Leading Mall Developer, Owner and Manager Singapore China Malaysia Japan India Joint Venture with Changi Airport Group to Develop an Iconic Mixed-Use Development at Changi
Results presentation. December 2012
 Results presentation December 2012 1 Introduction A Romanian focused property investment company Distribute dividends (or return of capital & share subscription) on a semi-annual basis Focus on properties
UOL Group 1H2018 Financial Results 3 August 2018
 UOL Group 1H2018 Financial Results 3 August 2018 AGENDA 1H2018 KEY FINANCIALS OPERATION HIGHLIGHTS 2 COMPANY OVERVIEW UOL Group Limited (UOL) was founded in 1963 and listed on the Singapore Exchange in
2010 Full Year Results Briefing. 22 February 2011
 2010 Full Year Results Briefing 22 February 2011 1 2010 IN SUMMARY RESULTS OVERVIEW PERFORMANCE REVIEW GOING FORWARD Q&A 2 UOL GROUP LIMITED 2010 IN SUMMARY RESULTS OVERVIEW GWEE LIAN KHENG GROUP CHIEF
2006 Preliminary Results. 7 March 2007
 2006 Preliminary Results 7 March 2007 Anthony Rabin 16 Headline numbers 2005 2006 Revenue 4,938m 5,852m +19% Pre-tax profit* 134m 152m +13% Adjusted eps* 24.1p 27.3p +13% Full-year proposed dividend 8.1p
For personal use only
 ASX Announcement 16 November 2015 DESTINATION BRISBANE CONSORTIUM AND QUEENSLAND GOVERNMENT ENTER INTO AGREEMENTS FOR QUEEN S WHARF BRISBANE Echo Entertainment Group Limited (Echo) 1 today announced that
3Q2017 Financial Results. 9 November 2017
 3Q2017 Financial Results 9 November 2017 COMPANY OVERVIEW 3Q2017 RESULTS OVERVIEW OPERATION HIGHLIGHTS 2 Founded in 1963, listed on the Singapore Exchange in 1964 Three core businesses: - Property development
METRO HOLDINGS REGISTERS REVENUE OF S$46.3 MILLION AND PROFIT AFTER TAX OF S$13.0 MILLION FOR 2QFY2019
 NEWS RELEASE METRO HOLDINGS REGISTERS REVENUE OF S$46.3 MILLION AND PROFIT AFTER TAX OF S$13.0 MILLION FOR 2QFY2019 - Records a 53.2% increase in revenue mainly driven by the sale recognition of S$14.0
2015 PRELIMINARY RESULTS
 2015 PRELIMINARY RESULTS 1 Funding investment through disposals since 2010 Strategy strengthening the business and delivering on our plan m 1,600 1,400 4,036.5bn Pence per share 1,400 % 45 1,200 1,300
Indiabulls Real Estate Limited (CIN : L45101DL2006PLC148314)
") Indiabulls Real Estate Limited (CIN : L45101DL2006PLC148314) Earnings Update Audited Financial Results FY 2013-14 April 23, 2014 Safe Harbor Statement This document contains certain forward looking statements
Indiabulls Real Estate Limited (CIN : L45101DL2006PLC148314) Earnings Update Audited Financial Results FY 2013-14 April 23, 2014 Safe Harbor Statement This document contains certain forward looking statements
UOL Group 3Q2018 Financial Results 13 November 2018
 UOL Group 3Q2018 Financial Results 13 November 2018 AGENDA 3Q2018 KEY FINANCIALS OPERATION HIGHLIGHTS 2 COMPANY OVERVIEW UOL Group Limited (UOL) was founded in 1963 and listed on the Singapore Exchange