Performance of Q1/2018
|
|
|
- Alfred Bailey
- 5 years ago
- Views:
Transcription
1 Performance of Q1/2018

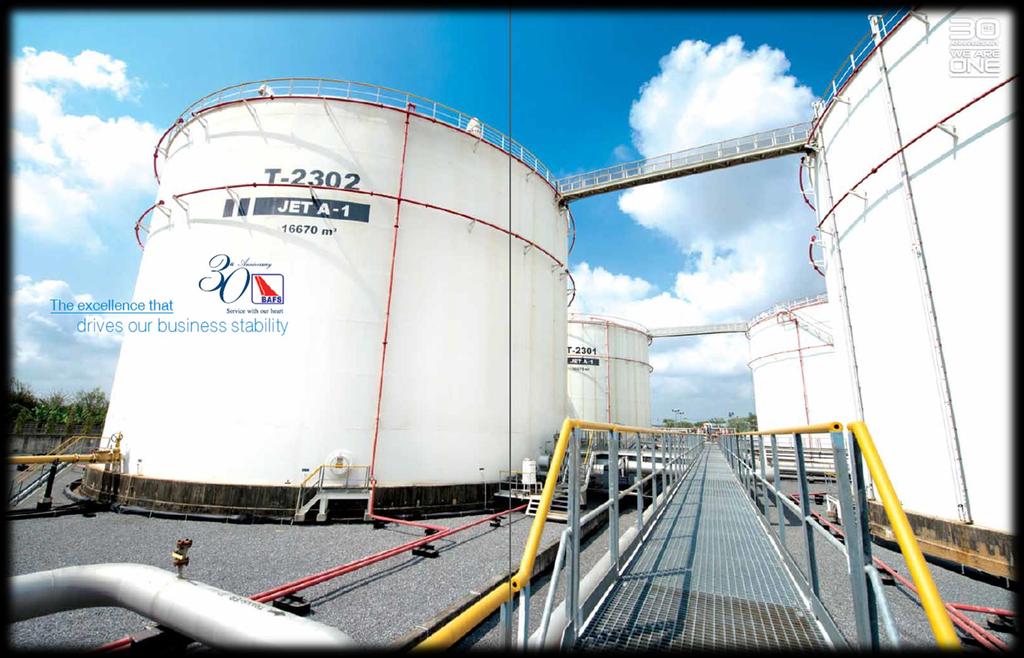
2 Business Overview FPT BAFS was founded in 1983 by the Cabinet Resolution to provide aircraft refueling system services. The scope of services comprises of : I. Aviation fuel storage services II. Aviation fuel transportation services via high pressure pipeline system, Hydrant system, to the aircraft aprons and III. Refuelling services 2

3 BAFS Group BAFS Storage and Aircraft Refueling Services at Suvarnabhumi, Don Mueang, Samui, Sukhothai and Trat Airports 90.0% 83.3% 75.0% 100.0% Operating aviation fuel services using the Hydrant technology at Suvarnabhumi Airport Refueling services which is hired only for labor. Currently, it provides services at Samui, Sukhothai and Trat Airports Storing and transporting multi-products fuel through pipeline system research and development, the design and improvement, and the production and sales, of innovative products 3
4 Major Shareholders Retail Investors % THAI 22.6% AOT 4.9% Others Oil Com. 6.9% Chevron 2.5% Institutional Investors % ESSO (Th) 7.1% SHELL (Th) 7.1% PTT 7.1% 4
5 Passenger Statistic At BKK & DMK Total passenger of BKK &DMK in Q1/2018 increased by +6.6%(y-o-y) and +7.0%(q-o-q) Q1/2018 Passenger By Airports (M Passenger) Q1/2018 DMK, 38.1% Domestic, 34.9% BKK, 61.9% Q1/2018 Passenger By Categories Q1 Q2 Q3 Q4 Source : AOT International, 65.1% 5
6 Flights Fueling Services by BAFS at BKK & DMK Total flights fueling services at BKK & DMK in Q1/2018 increased by +4.6% (y-o-y) and +2.4%(q-o-q) (Flights) 350, , , , , ,000 50, , , , ,042 71,410 74, ,121 67,492 59,718 55,948 69,807 71,649 63,693 50,904 50,774 67,842 69,441 62,484 75,850 48,978 51,067 49,291 55,483 63,121 70,207 72,518 75, Q1/ % 10% 8% 6% 4% 2% 0% Flights growth (y-o-y) 11.2% 9.6% 8.6% 5.8% 3.8% 4.6% 3.3% 2.4% 2.6% Q1 Q2 Q3 Q4 Q1 Q2 Q3 Q4 Q1 Q1 Q2 Q3 Q Source : BAFS 6
7 Flights Fueling Services by BAFS at BKK & DMK In Q1/2018 total flights fueling services growth by +4.6%(y-o-y) which were BKK s growth by +4.9%(y-o-y) and DMK s growth by +4.1%(y-o-y) DMK BKK (Flights) 75,000 60,000 45, % 72,518 75,850 41,225 43,260 30,000 15,000-31,293 32,590 Q1/17 Q1/18 DMK 43.2% BKK 56.8% DMK 43.0% BKK 57.0% Source : BAFS 7
8 Fuel Volume Services At BKK & DMK Aviation volume of Q1/2018 increased by +4.1% (y-o-y) and +4.3%(q-o-q) (M Litres) 7,000 6,000 5,657 5,747 5,284 4,951 10% 5,000 4,855 1,454 1,485 1,382 1,307 1,290 8% 4,000 1,393 1,418 1,277 3,000 1,215 1,130 6% 2,000 1,180 1,139 1,268 1,350 1,357 1,548 4% 1,000 2% 1,249 1,296 1,357 1,461 1,487 1, % Q1/2018 Q1 Q2 Q3 Q4 Aviation volume growth (y-o-y) 9.1% 7.7% 6.5% 5.2% 4.1% 1.8% 1.8% 2.1% 0.5% Q1 Q2 Q3 Q4 Q1 Q2 Q3 Q4 Q Source : BAFS 8
9 Fuel Volume Services At BKK & DMK In Q1/2018 total Aviation volume growth by 4.1%(y-o-y) which were BKK s growth by +3.8%(y-o-y) and DMK s growth by +5.3%(y-o-y) BKK DMK (M Litres) +4.1% 1,600 1,487 1,548 1, ,208 1,254 - Q1/2017 Q1/2018 DMK 18.8% BKK 81.2% DMK 19.0% BKK 81.0% Source : BAFS 9
10 Into-plane Market Share at BKK Into-plane market share at BKK was 88.4% BAFS 88.4% Other 11.6% Source : BAFS 10
11 Financial Performance 11
 to Bt966M, which 79% was the income from Refueling business (Bt m) 6,000 5,000 4,000 4,951 4,855 4,091 3,919 5,284 4,372 5,657 5,747 4,509 4,643 Q1/2018 s Services income Fuel")
12 Services Income and Services Volume Q1/2018 Services income increased by +3.8%(y-o-y) to Bt966M, which 79% was the income from Refueling business (Bt m) 6,000 5,000 4,000 4,951 4,855 4,091 3,919 5,284 4,372 5,657 5,747 4,509 4,643 Q1/2018 s Services income Fuel Transportation, 21% 3,000 2,000 1, ,328 3,565 3,581 1,487 1,548 2,761 2,981 1,217 1, Q1/17 Q1/18 Aviation Refueling Business, 79% Services Income (Bt M) Aviation volume (M litres) Fuel transportation volume (M litres) % YoY Growth ) Y CAGR Q1/2018 Services Income 17.5% 8.0% 11.6% 7.1% 0.5% 6.7% 3.8% Aviation Fuel Volume 8.5% -1.9% 8.8% 7.1% 1.6% 3.8% 4.1% Fuel Transportation Volume 11.7% -4.2% 11.6% 3.1% 3.0% 3.2% 3.0% Notes : 1) Y2013, the Group has consoled FPT in its Consolidated financial statement 12
13 Net Profit attributable to Equity holders of the Company and Net Profit Margin Q1/2018 Net profit increased by +5.6%(y-o-y) to Bt322.6M with 35.3% of Net profit margin (Bt m) 1,400 1,200 1, % 1, % % 31.6% 61 1, % % 35.3% 40% 35% 30% 25% 20% 15% 10% Q1/2018 s Net profit Fuel Transportation 16% Aviation Refueling Business, 84% ) 2) Q1/2017 Q1/2018 5% 0% Extra Items Net Profit attributable to Equity holders of the Company Net Profit Margin Notes : 1) Y2013, the Group recorded extra revenue around Bt150m and Bt217m from received insurance claims from flood occurred in 2011 and consoled FPT in its Consolidated financial statement 2) In 2016 the Group recorded extra. revenue of Bt76.4m from the compensation of FPT s fuel pipeline damaged and from the reversal of FPT s fuel pipeline relocation 13
14 Statement of Comprehensive Income Unit : Bt M % Change Q1/2018 Q1/2017 (y-o-y) Services income % Others income (39.3%) Total revenues % Cost of services % Administrative expenses (3.4%) Total expenses % EBIT % Finance cost (10.6%) Income tax expenses % Net Profit for the year % Net Profit to Equity holders of the Company % Depreciation % EBITDA % Earning per share % Profitability margin Profitability Ratio Q1/2018 Q1/2017 Gross Margin 60.9% 60.9% EBIT Margin 47.9% 47.3% EBITDA Margin 62.1% 61.6% Net Profit Margin 35.3% 34.4% 14
15 ROA, ROE and BV/Share ROA and ROE declined due to Total Assets and Total Equity increased by +9.7% and +4.3% from Dec, % ROA and ROE (Bt) 16.0 BV/Share 25% 20% 15% 10% 5% 23.6% 14.2% 15.6% 9.7% 13.8% 13.4% 11.1% 11.3% 8.4% 8.0% % * Q1/2018 ROA ROE 4.0 * Q1/2018 (Unit : %) 2017 Q1/2018 ROA 8.4% 8.0% ROE 13.8% 13.4% (Unit : bt) 2017 Q1/2018 BV/Share * Notes : Y2013, the Group recorded extra revenue around Bt150m and Bt217m from received insurance claims from flood occurred in 2011 and consoled FPT in its Consolidated financial statement * Notes : In 2016, the Group recorded gain from the sale of investments in a subsidiary, FPT, in its Equity around Bt557m 15
16 Capital Structure Equity was 58% of total capital in Q1/2018 while D/E ratio was 0.73 : 1 time (Bt M) (X) D/E 16,000 14,000 12,000 10,000 8,000 6,000 4,000 2,000 8,084 8,258 8,541 2,344 2,374 2, ,988 5,212 5,664 13,621 12,158 12,414 4,749 3,932 3, , ,371 7,570 7, Q1/ Q1/2018 Equity S/T Liabilities L/T Liabilities (Unit : X) 2017 Q1/2018 D/E IBD/E Net IBD/E
17 Debts Profile Long term debts was Bt4,012M (Unit : Bt M) Credit Facilities Outstanding BAFS-KBANK BAFS-BBL 2, BAFS-TBANK BAFS-BBL BAFS-TMB 2,250 2,250 TARCO-TMB FPT-BBL FPT-BBL FPT-BCP FPT-BBL 6,300 1,050 Total 4,012 * Notes : Outstanding value include current portion to be paid within 1 year (Bt M) 1, Principle payment BBL (FPT) TMB TMB (TARCO) BCP (FPT) TBANK BBL KBANK 17
18 BAFS s Price vs SET Index and Resource Index BAFS s price has accreted compared to SET index and Resource index since Jan 1, 2016 Closed Price Jan 1, 16 May 17, 18 Change (%) SET Index 1, , % RESOURCE Index % BAFS (Bt) % 18
19 Company Update 19
20 Company Update I. The Boards approved to establish the Joint Venture Companies as follow :- BAFS INTECH Company Limited which 90% own by BAFS. The objective is to design, produce, assembly, aviation refueling vehicle and aviation ground service equipment BPTG Company Limited which 40% own by BAFS. The objective is to operate petrol stations located in the front area of Pichit Depot, Lampang Depot, and Kampang Petch Booster Pump Station of Fuel Pipeline Transportation Company Limited 20
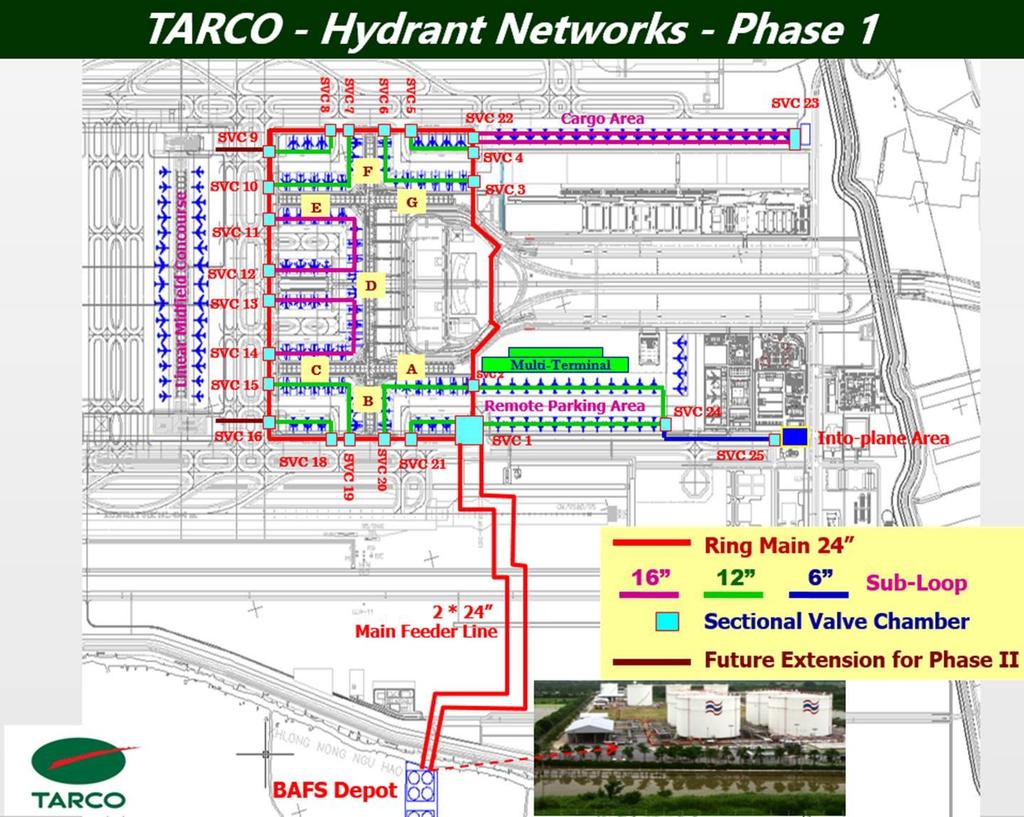
21 Company Update II. Progression of expansion projects as of Apr 2018:- Hydrant pipeline network system for BKK phase2 was around 67% and The Northern fuel pipeline expansion project was around 52% 21
22 Performance of Q1/2018
23 Dividend and Payout Ratio Dividend Policy : Not less than 50% of Net Profit of company only (Bt / share) % 81% 82% % 93% 90.0% 65.0% % 15.0% -10.0% -35.0% EPS of company only DPS Dividend Payout -60.0% 23
24 Aviation Volume growth at BKK & DMK Unit : ML +7.1% +1.6% +8.8% -0.9% 4, % -1.9% 4,951 4,855 5,284 5,657 5,
25 Expansion Projects 25
26 26


27 Existing fuel pipeline in Thailand and FPT s expansion project Lampang depot 209 Km. Phichit depot Separation Station, Kamphaeng Phet Bang Pa In depot 367 Km. Saraburi depot Tie-In point Chong Nonsi depot Don Mueang depot Dia. 14 Lum Lukka depot Suvarnabhumi depot BCP s Refinery TOP s Refinery Existing fuel pipeline in Thailand and FPT s expansion project FPT s existing pipeline Thappline s existing pipeline FPT s expansion project, North pipeline Refinery at Map Ta Phut 27
Performance of Q1 2017
 Performance of Q1 2017 Business Overview FPT BAFS was founded in 1983 by the Cabinet Resolution to provide aircraft refueling system services. The scope of services comprises of : I. Aviation fuel storage
Airports of Thailand Public Company Limited
 Airports of Thailand Public Company Limited (AOT) 2 nd nd Quarter 2006 (January - March 2006) Agenda AOT Business Highlights Air Traffic Statistics Airport Capacity Suvarnabhumi Airport Recent Development
Cebu Air, Inc. Annual Stockholders Briefing. 24 June cebupacificair.com
 Cebu Air, Inc. Annual Stockholders Briefing 24 June 2015 cebupacificair.com Business Updates Passengers (M) Operating Statistics 2014: Passenger traffic grew 17.5% to 16.9M. Seat capacity grew 14.8% to
ERW. 022/ ACC003/ th February Subject: Management's Discussion and Analysis period ending 31 st December 2012
 ERW. 022/ ACC003/56 26 th February 2013 Subject: Management's Discussion and Analysis period ending 31 st December 2012 Attention: The President, The Stock Exchange of Thailand Dear Sir, The Erawan Group
Investor Relations Center, Tel: (662) , Fax (662)
 , Fax (662)") 1 Airports of Thailand Plc. For The fiscal Year 2011 (October 2010 September 2011) Investor Relations Center, E-mail: aotir@airportthai.co.th, Tel: (662) 535-5900, Fax (662) 535-5909 Disclaimer This presentation
1 Airports of Thailand Plc. For The fiscal Year 2011 (October 2010 September 2011) Investor Relations Center, E-mail: aotir@airportthai.co.th, Tel: (662) 535-5900, Fax (662) 535-5909 Disclaimer This presentation
Management s Discussion and Analysis
 Management s Discussion and Analysis For the period ended 31 December 2015 Bangkok Airways Public Company Limited and Its Subsidiaries 1 Bangkok Airways Public Company Limited and its Subsidiaries Management
Management s Discussion and Analysis
 Management s Discussion and Analysis For the period ended 30 June 2016 Bangkok Airways Public Company Limited and Its Subsidiaries 1 Bangkok Airways Public Company Limited and its Subsidiaries Management
ERW. 083/ ACC012/ th November Subject: Management's Discussion and Analysis period ending 30 th September 2012
 ERW. 083/ ACC012/55 12 th November 2012 Subject: Management's Discussion and Analysis period ending 30 th September 2012 Attention: The President, The Stock Exchange of Thailand Dear Sir, The Erawan Group
Airports of Thailand Plc.
 Airports of Thailand Plc. For The Fiscal Year 2017 (October 2016 September 2017) Investor Relations Department, E-mail: aotir@airportthai.co.th, Tel: (662) 535-5900, Fax (662) 535-5909 Disclaimer This
Investor Relations Center, Tel: (662) , Fax (662)
 , Fax (662)") Airports of Thailand Plc. For The fiscal Year 2012 (October 2011 September 2012) Investor Relations Center, E-mail: aotir@airportthai.co.th, Tel: (662) 535-5900, Fax (662) 535-5909 Disclaimer This presentation
Airports of Thailand Plc. For The fiscal Year 2012 (October 2011 September 2012) Investor Relations Center, E-mail: aotir@airportthai.co.th, Tel: (662) 535-5900, Fax (662) 535-5909 Disclaimer This presentation
Analyst Meeting 1Q/2015
 Analyst Meeting 1Q/2015 DISCLAIMER The presentation is dated the day it is given. The delivery of this presentation shall not, under any circumstances, create any implication that there has been no change
Summary of Results for the First Three Quarters FY2015/3
 Summary of Results for the First Three Quarters FY2015/3 February 10, 2015 Tokyu Corporation (9005) http://www.tokyu.co.jp/ Contents Ⅰ.Executive Summary 2 Ⅱ.Conditions in Each Business 5 Ⅲ.Details of Financial
Air China Limited Annual Results. March Under IFRS
 Air China Limited 21 Annual Results Under IFRS March 211 Agenda Part 1 Highlights Part 2 Business Overview Part 3 Financial Overview Part 4 Outlook 2 Part 1 Highlights Steady Economic Growth; Asia Pacific
PRESS RELEASE Financial Results. Rising passenger traffic at 12.5m Exceeding 1bn in consolidated revenue
 PRESS RELEASE 2016 Financial Results Rising passenger traffic at 12.5m Exceeding 1bn in consolidated revenue Kifissia, 23 March 2017 AEGEAN reports full year 2016 results with consolidated revenue at 1,020m,
1Q13 R sults esentation
 1Q13 Results Presentation 14 May 2013 Disclaimer The presentation is dated the day it is given. The delivery of this presentation shall not, under any circumstances, create any implication that there has
Air China Limited Interim Results. August Under IFRS
 Air China Limited 21 Interim Results Under IFRS August 21 1 Agenda 21 Interim Results Overview Business Overview Financial Overview Outlook 2 2 2 21 Interim Results 3 21 Interim Results Overview 4 4 4
Analyst Briefing Quarter 3/2012
 http://www.thaiairways.com/about-thai/investor-relations/en/investor.html THAI AIRWAYS INTERNATIONAL PCL Analyst Briefing Quarter 3/2012 1 Investor Relations Department DISCLAIMER The information contained
Fourth Quarter and Full Year 2009
 Investor and analyst meeting: Fourth Quarter and Full Year 29 25 th February 21 2 The views expressed here contain some information derived from publicly available sources that have not been independently
ANALYST MEETING 3Q2015
 ANALYST MEETING 3Q2015 November 12, 2015 DISCLAIMER The presentation is dated the day it is given. The delivery of this presentation shall not, under any circumstances, create any implication that there
2017 results: REVENUE up to million (+1.6%), NET PROFIT FOR THE PERIOD 1 shows significant increase to million (+12.
, NET PROFIT FOR THE PERIOD 1 shows significant increase to million (+12.") Business Results in 2017: Significant Rise in Profits of the Flughafen Wien Group Management Board Announces Substantial Upward Revision of Earnings Guidance and Traffic Figures for 2018 2017 results:
Business Results in 2017: Significant Rise in Profits of the Flughafen Wien Group Management Board Announces Substantial Upward Revision of Earnings Guidance and Traffic Figures for 2018 2017 results:
PARENT AIRLINE OPERATIONS LIFT GROUP PROFIT
 PARENT AIRLINE OPERATIONS LIFT GROUP PROFIT HIGHLIGHTS OF THE GROUP S PERFORMANCE Financial Year 2006-07 4th Quarter 2006-07 Apr 2006 Mar 2007 Year-on-Year % Change Jan-Mar 2007 Year-on-Year % Change Operating
Presentation on Results for the 2nd Quarter FY Idemitsu Kosan Co.,Ltd. November 14, 2018
 Presentation on Results for the 2nd Quarter FY 2018 Idemitsu Kosan Co.,Ltd. November 14, 2018 Table of Contents 1. FY 2018 2nd Quarter Financials (1) Overview (2) Segment Information 2. Reference Materials
Summary of Results for the First Quarter of FY2015/3
 Summary of for the First Quarter of FY2015/3 August 8, 2014 Tokyu Corporation (9005) http://www.tokyu.co.jp/ Contents Ⅰ.Executive Summary 2 Ⅱ.Conditions in Each Business 4 Ⅲ.Details of Financial for the
Management Discussions and Analysis for the three-month period ended 31 March 2014 and Executive Summary
 Executive Summary Overview of the global economy during the first quarter of 2015 (Q1/2015) are as following; the US economy has been in recovery mode while rapidly dollar appreciation weighs on net exports
Investor Relations Center, Tel: (662) , Fax (662)
 , Fax (662)") Airports of Thailand Plc. For 6 Months of Fiscal Year 2014 (October 2013 March 2014) Investor Relations Center, E-mail: aotir@airportthai.co.th, Tel: (662) 535-5900, Fax (662) 535-5909 Disclaimer This
Airports of Thailand Plc. For 6 Months of Fiscal Year 2014 (October 2013 March 2014) Investor Relations Center, E-mail: aotir@airportthai.co.th, Tel: (662) 535-5900, Fax (662) 535-5909 Disclaimer This
Summary o f Results for the First Half of FY2018
 Summary o f Results for the First Half of FY2018 November 9, 2018 (9005) https://www.tokyu.co.jp/ Contents Ⅰ.Executive Summary 2 Ⅱ.Conditions in Each Business 6 Ⅲ.Details of Financial Results for the 13
Investment Highlights
 Third Quarter 2014 Investment Highlights 1 Mexican airport portfolio positioned to take full advantage of global growth. 2 Diversified business model contributing to earnings resilience. 3 Well-defined
FOURTH QUARTER RESULTS 2017
 FOURTH QUARTER RESULTS 2017 KEY RESULTS In the 4Q17 Interjet total revenues added $5,824.8 million pesos that represented an increase of 10.8% over the revenue generated in the 4Q16. In the 4Q17, operating
 1 2 23 24 15 16 7 8 9 Ancillary Revenue target per pax RM55 10 Online 365 11 212 13 14 14 Quarter Ended: 31 March RM'000 Revenue 2,068,227 Operating expenses: - Staff costs (286,663) - Depreciation
THIRD QUARTER RESULTS 2018
 THIRD QUARTER RESULTS 2018 KEY RESULTS In the 3Q18 Interjet total revenues added $ 6,244.8 million pesos that represented an increase of 7.0% over the revenue generated in the 3Q17. In the 3Q18, operating
Presentation on Results for the 2nd Quarter FY Idemitsu Kosan Co.,Ltd. November 1, 2016
 Presentation on Results for the 2nd Quarter FY 2016 Idemitsu Kosan Co.,Ltd. November 1, 2016 Table of Contents 1. 2nd Quarter FY 2016 Financials (1) Overview (2) Segment Information 2. Reference Materials
THIRD QUARTER OPERATING PROFIT UP 51% TO $675 MILLION
 THIRD QUARTER OPERATING PROFIT UP 51% TO $675 MILLION GROUP FINANCIAL PERFORMANCE Third Quarter 2007-08 The Group made an operating profit of $675 million in the third quarter of financial year 2007-08,
Air Transportation OVERWEIGHT (Maintain)
") Industry Research 4 Apr 28 Air Transportation OVERWEIGHT (Maintain) Joshua Yang (82-2-769-2738) arbor@daishin.co.kr Growth in IIA s transportation indicators slows down in Mar Maintain OVERWEIGHT, TP adjusted
Industry Research 4 Apr 28 Air Transportation OVERWEIGHT (Maintain) Joshua Yang (82-2-769-2738) arbor@daishin.co.kr Growth in IIA s transportation indicators slows down in Mar Maintain OVERWEIGHT, TP adjusted
MGM Resorts International Reports Second Quarter Financial Results
 NEWS RELEASE MGM Resorts International Reports Second Quarter Financial Results 8/5/2014 Consolidated Adjusted EBITDA Increased 8%, Led By 10% Growth In Wholly Owned Domestic Resorts MGM China Declares
,354 40,934 31,973 31,542 32,248 (millions of yen) Profit Attributable to Owners of the Parent (J-
 Profit Attributable to Owners of the Parent (J-") Income Summary(FullYear) Revenue - - - - - - 935,214 1,002,758 1,031,740 962,555 1,031,256 Revenue (J- 1,068,390 1,027,630 1,071,568 947,843 804,465 777,953 767,879 - - - - Operating Income - - - - - -
Income Summary(FullYear) Revenue - - - - - - 935,214 1,002,758 1,031,740 962,555 1,031,256 Revenue (J- 1,068,390 1,027,630 1,071,568 947,843 804,465 777,953 767,879 - - - - Operating Income - - - - - -
Crown Resorts Limited
 Crown Resorts Limited 2016 Half Year Results Presentation 25 February 2016 1 Crown Resorts Limited Results Overview Crown Resorts Limited (Crown) performance: The 2016 First Half results across Crown s
Finnair Group Annual Report 1 January 31 December 2006
 Finnair Group Annual Report 1 January 31 December 2006 2006: A year for restructuring Scheduled Passenger Traffic transforming to meet Asian traffic demands Labour negotiations to cut 670 jobs 80 million
Air China Limited 2014 Annual Results Under IFRS
 Air China Limited 2014 Annual Results Under IFRS March 2015 Agenda Part 1 Results Highlights Part 2 Business Overview Part 3 Financial Overview Part 4 Outlook Part 1 Results Highlights Gradual Global Economic
Finnair Group Interim Report 1 January 30 September 2008
 Finnair Group Interim Report 1 January 30 September 2008 1 31/10/2008 Presentation name / Author Airline industry at a historical turning point Expensive fuel price in the beginning of 2008 has dramatical
Presentation on Results for the 3rd Quarter FY Idemitsu Kosan Co.,Ltd. February 14, 2019
 Presentation on Results for the 3rd Quarter FY 2018 Idemitsu Kosan Co.,Ltd. February 14, 2019 Table of Contents 1. FY 2018 3rd Quarter Results (1) Overview (2) Segment Information 2. Forecast for FY 2018
PRESS RELEASE. First Half 2017 Financial Results Higher Load Factors and traffic lead to a significant rebound in second quarter profitability
 PRESS RELEASE First Half 2017 Financial Results Higher Load Factors and traffic lead to a significant rebound in second quarter profitability Kifissia, 12 September 2017 AEGEAN announces first half 2017
STRONG OPERATING RESULTS LIFT NET PROFIT 7.3% TO $932 MILLION
 STRONG OPERATING RESULTS LIFT NET PROFIT 7.3% TO $932 MILLION GROUP FINANCIAL PERFORMANCE First Half 2007-08 The Group achieved an operating profit of $982 million for the first half of financial year
Part 1 Performance Highlights. Part 2 Business Overview. Part 3 Financial Review
 August 216 1 Part 1 Performance Highlights Part 2 Business Overview Part 3 Financial Review Part 4 Outlook 2 Under IFRS 3 Part 1 Performance Highlights Performance Highlights - Key Operational Metrics
Management Presentation. November 2011
 Management Presentation November 2011 Forward looking statements This presentation as well as oral statements made by officers or directors of Allegiant Travel Company, its advisors and affiliates (collectively
SIAM FUTURE DEVELOPMENT PUBLIC CO., LTD. Corporate Presentation Q4-15
 SIAM FUTURE DEVELOPMENT PUBLIC CO., LTD. Corporate Presentation Q4-15 Overview Financial Summary Project Update 2 Overview Founded: 1994 Staff: 80 Centers: 22 Vision Unlike other developers, we create
THAI AIRWAYS INTERNATIONAL PCL
 THAI AIRWAYS INTERNATIONAL PCL PHATRA SECURITIES PCL Thai Tourism Day July 4, 2013 1 http://www.thaiairways.com/about-thai/investor-relations/en/investor.html DISCLAIMER The information contained herein
Investor Relations Department
 THAI AIRWAYS INTERNATIONAL Plc. (Year 2008) 1 Table of Contents 1. The Company 2. Statistical Information 3. Tentative Aircraft Delivery 4. Financial Performance 5. Going Forward 2 1. The Company 3 The
Presentation on Results for the 1st Quarter FY Idemitsu Kosan Co.,Ltd. August 14, 2017
 Presentation on Results for the 1st Quarter FY 2017 Idemitsu Kosan Co.,Ltd. August 14, 2017 Table of Contents 1. FY 2017 1st Quarter Financials (1) Overview (2) Segment Information 2. Reference Materials
THAI AIRWAYS INTERNATIONAL Pcl. Fiscal Year 2007
 THAI AIRWAYS INTERNATIONAL Pcl. Fiscal Year 2007 (Oct 06-Sep 07) Relations Department Investor Relations Investor Relations Table of Contents 1. The Company 2. Statistic Information 3. Current Issue 4.
2017 Half-year Results
 2017 Half-year Results A MULTI-LOCAL SPECIALIST STORAGE RETAIL DISTRIBUTION SUPPORT AND SERVICES OF FUEL PRODUCTS 2 KEY FACTS As of june 30, 2017 Purchase of Dinasa and of its subsidiary Sodigaz, leading
OPERATING AND FINANCIAL HIGHLIGHTS. Subsequent Events
 Copa Holdings Reports Net Income of $103.8 million and EPS of $2.45 for the Third Quarter of 2017 Excluding special items, adjusted net income came in at $100.8 million, or EPS of $2.38 per share Panama
FIRST QUARTER RESULTS 2017
 FIRST QUARTER RESULTS 2017 KEY RESULTS In the 1Q17 Interjet total revenues added $4,421.5 million pesos that represented an increase of 14.8% over the income generated in the 1Q16. In the 1Q17, operating
Minor International Public Company Limited
 Minor International Public Company Limited Management Discussion & Analysis MINT s financial performance as of 30th June 2008 Summary of Key Financial Performance 2Q08 Performance Minor International Public
United Continental Holdings, Inc (NYSE: UAL) ONE YEAR PRICE RANGE : $ LAST PRICE: $ ANALYST RATING: Sell
 ONE YEAR PRICE RANGE : $ LAST PRICE: $ ANALYST RATING: Sell") United Continental Holdings, Inc (NYSE: UAL) ONE YEAR PRICE RANGE : $61.91 68.76 LAST PRICE: $68.39 ANALYST RATING: Sell VALUATION DATE: August 3, 2017 NEXT EARNINGS DATE: October 17, 2017 Investment Thesis:
United Continental Holdings, Inc (NYSE: UAL) ONE YEAR PRICE RANGE : $61.91 68.76 LAST PRICE: $68.39 ANALYST RATING: Sell VALUATION DATE: August 3, 2017 NEXT EARNINGS DATE: October 17, 2017 Investment Thesis:
OPERATING AND FINANCIAL HIGHLIGHTS
 Copa Holdings Reports Financial Results for the Fourth Quarter of 2018 Excluding special items, adjusted net profit came in at $44.0 million, or Adjusted EPS of $1.04 Panama City, Panama --- February 13,
3M 2013 Edition. Share Information : GIAA.IJ / GIAA.JK. Daily Share Price Movements
 3M 2013 Edition 3M 2012 3M 2013 Change Financial Summary (USD Mio) OPERATING REVENUES 717 807 12.51% OPERATING EXPENSES 734 827 12.70% INCOME (LOSS) FROM OPERATIONS (17) (20) 20.68% INCOME (LOSS) BEFORE
HIGH FUEL PRICES DRIVE HALF YEAR PROFIT DOWN 62% AMIDST CHALLENGING ENVIRONMENT
 3 November 2011 Page 1 of 4 No. 06/11 03 November 2011 HIGH FUEL PRICES DRIVE HALF YEAR PROFIT DOWN 62% AMIDST CHALLENGING ENVIRONMENT GROUP FINANCIAL PERFORMANCE First Half 2011-12 The Group made a net
Third Quarter 2015 Results
 Third Quarter 2015 Results Investment Highlights Positioned to take full advantage of global growth Diversified business model Well-defined strategy to capitalize on favorable industry dynamic Successful
Copa Holdings Reports Net Income of US$113.9 Million for the Fourth Quarter of 2013
 Copa Holdings Reports Net Income of US$113.9 Million for the Fourth Quarter of 2013 Panama City, Panama --- February 12, 2014. Copa Holdings, S.A. (NYSE: CPA), today announced financial results for the
OPERATING AND FINANCIAL HIGHLIGHTS
 Copa Holdings Reports Financial Results for the Fourth Quarter of 2015 Excluding special items, adjusted net income came in at $31.7 million, or EPS of $0.73 per share Panama City, Panama --- February
Copa Holdings Reports Net Income of $136.5 million and EPS of $3.22 for the First Quarter of 2018
 Copa Holdings Reports Net Income of $136.5 million and EPS of $3.22 for the First Quarter of 2018 May 9, 2018 PANAMA CITY, May 9, 2018 /PRNewswire/ -- Copa Holdings, S.A. (NYSE: CPA), today announced financial
Quarterly Meeting # 2/2014
 Quarterly Meeting # 2/2014 Performance & Outlook 15 May 2014 The views expressed here contain some information derived from publicly available sources that have not been independently verified. No representation
Investment Highlights
 Second Quarter 2014 Investment Highlights 1 Mexican airport portfolio positioned to take full advantage of global growth. 2 Diversified business model contributing to earnings resilience. 3 Well-defined
CROWN ANNOUNCES 2019 HALF YEAR RESULTS
 ASX / MEDIA RELEASE FOR IMMEDIATE RELEASE 20 February 2019 CROWN ANNOUNCES 2019 HALF YEAR RESULTS MELBOURNE: Crown Resorts Limited (ASX: CWN) ( Crown ) today announced its results for the half year ended
Copa Holdings Reports Net Income of $49.9 million and EPS of $1.18 for the Second Quarter of 2018
 Copa Holdings Reports Net Income of $49.9 million and EPS of $1.18 for the Second Quarter of 2018 Panama City, Panama --- Aug 8, 2018. Copa Holdings, S.A. (NYSE: CPA), today announced financial results
PRELIMINARY ACCOUNTS FOR 2012
 INTERIM REPORT FOR Q4 2012 AND INTERIM REPORT FOR Q4 2012 AND PRELIMINARY ACCOUNTS FOR 2012 HIGHLIGHTS Q4 with growth in volume and improved normalized EBITDA MNOK 261 improvement in normalized EBITDA
1Q 2014 Edition. Share Information. Daily Share Price Movements
 1Q 2014 Edition 1Q 2013 1Q 2014 Change Financial Summary (USD Mio) OPERATING REVENUES 807 807 0.01% OPERATING EXPENSES 827 1,000 20.86% OTHERS (INCOME) 4 25 460.80% INCOME (LOSS) FROM OPERATIONS -20-193
Fact Sheet for Q3 and January-September 2017 October 20, 2017
 Fact Sheet for Q3 and January-September 2017 October 20, 2017 Contents Daimler Group Stock Market Information 3 Earnings and Financial Situation 4-12 Information for Divisions Mercedes-Benz Cars 13-16
THAI AIRWAYS INTERNATIONAL PCL
 THAI AIRWAYS INTERNATIONAL PCL Quarter 2/2013 Analyst Briefing 1 http://www.thaiairways.com/about-thai/investor-relations/en/investor.html DISCLAIMER The information contained herein is intended to represent
Management Presentation. September 2011
 Management Presentation September 2011 Forward looking statements This presentation as well as oral statements made by officers or directors of Allegiant Travel Company, its advisors and affiliates (collectively
Crown Resorts Limited
 Crown Resorts Limited 2015 Full Year Results Presentation 13 August 2015 1 Crown Resorts Limited Results Overview Crown Resorts Limited (Crown) performance: Overall, the results for Crown s portfolio of
FLUGHAFEN WIEN AG. Results Q1-3/2018
 FLUGHAFEN WIEN AG Results Q1-3/2018 Q1-3/2018: Outstanding traffic results - Guidance raised Q1-3/2018 Passenger growth of 7.3% at Vienna Airport (Group: +8.7%); strong rise in passenger volumes in Malta
Interim Report 6m 2014
 August 11, 2014 Interim Report 6m 2014 Investors and Analysts Conference Call on August 11, 2014 Joachim Müller, CFO Latest ad-hoc release (August 4, 2014) Reduction of forecast, primarily due to a further
VietJet Aviation Joint Stock Company Key Highlights Q1/2017 Business result. Apr 2017
 VietJet Aviation Joint Stock Company Key Highlights Q1/2017 Business result Apr 2017 Disclaimer INFORMATION CONTAINED IN OUR PRESENTATION IS INTENDED SOLELY FOR YOUR REFERENCE. SUCH INFORMATION IS SUBJECT
OPERATING AND FINANCIAL HIGHLIGHTS
 Copa Holdings Reports Net Income of US$18.6 Million and EPS of US$0.42 for the Second Quarter of 2010 Excluding special items, adjusted net income came in at $26.3 million, or $0.60 per share Panama City,
Copa Holdings Reports Record Earnings of US$41.8 Million for 4Q06 and US$134.2 Million for Full Year 2006
 Copa Holdings Reports Record Earnings of US$41.8 Million for 4Q06 and US$134.2 Million for Full Year 2006 Panama City, Panama --- March 7, 2007. Copa Holdings, S.A. (NYSE: CPA), parent company of Copa
Cebu Air, Inc. 2Q2014 Results of Operation
 Cebu Air, Inc. 2Q2014 Results of Operation 1 Disclaimer This information provided in this presentation is provided only for your reference. Such information has not been independently verified and, as
INVESTOR NEWSLETTER. Full Year 2013 Editions. PT Garuda Indonesia (Persero) Tbk. FY 2012 FY 2013 Change. Summary.
 Tbk. FY 2012 FY 2013 Change. Summary.") INVESTOR NEWSLETTER PT Garuda Indonesia (Persero) Tbk. Full Year 2013 Editions FY 2012 FY 2013 Change Financial Summary (USD Mio) OPERATING REVENUES 3,472 3,716 7.02% OPERATING EXPENSES 3,304 3,660 10.75%
INVESTOR NEWSLETTER PT Garuda Indonesia (Persero) Tbk. Full Year 2013 Editions FY 2012 FY 2013 Change Financial Summary (USD Mio) OPERATING REVENUES 3,472 3,716 7.02% OPERATING EXPENSES 3,304 3,660 10.75%
Ref. PE004/ May Subject: Management Discussion and Analysis for the First Quarter of 2018
 Ref. PE004/2561 10 May 2018 Subject: Management Discussion and Analysis for the First Quarter of 2018 Attention: President The Stock Exchange of Thailand According to the financial reports of Nok Airlines
NORWEGIAN AIR SHUTTLE ASA QUARTERLY REPORT FIRST QUARTER 2004 [This document is a translation from the original Norwegian version]
![NORWEGIAN AIR SHUTTLE ASA QUARTERLY REPORT FIRST QUARTER 2004 [This document is a translation from the original Norwegian version]](/thumbs/87/95085804.jpg "NORWEGIAN AIR SHUTTLE ASA QUARTERLY REPORT FIRST QUARTER 2004 [This document is a translation from the original Norwegian version]") NORWEGIAN AIR SHUTTLE ASA QUARTERLY REPORT 2004 IN BRIEF At the start of 2003, Norwegian has become a pure low-fare airline. The Fokker F-50 operations have been terminated, and during the quarter the
NORWEGIAN AIR SHUTTLE ASA QUARTERLY REPORT 2004 IN BRIEF At the start of 2003, Norwegian has become a pure low-fare airline. The Fokker F-50 operations have been terminated, and during the quarter the
Thank you for participating in the financial results for fiscal 2014.
 Thank you for participating in the financial results for fiscal 2014. ANA HOLDINGS strongly believes that safety is the most important principle of our air transportation business. The expansion of slots
INTESA SANPAOLO VITA RESULTS AT 31 MARCH 2017 APPROVED:
 INTESA SANPAOLO VITA RESULTS AT 31 MARCH 2017 APPROVED: Assets under management at 145,908.2 million euros (143,735.3 million euros at December 2016 +1.5%) Financial liabilities (unit and index linked)
JAPAN AIRLINES Financial Results 2 nd Quarter Mar / 2014 (FY2013)
") JAPAN AIRLINES Financial Results 2 nd Quarter Mar / 2014 (FY2013) Yoshiharu Ueki, President Norikazu Saito, Managing Executive Officer 31 October, 2013 Contents P.2 P.3 P.4 P.6 1 Overview of 2 nd Quarter
JAPAN AIRLINES Financial Results 2 nd Quarter Mar / 2014 (FY2013) Yoshiharu Ueki, President Norikazu Saito, Managing Executive Officer 31 October, 2013 Contents P.2 P.3 P.4 P.6 1 Overview of 2 nd Quarter
THIRD QUARTER RESULTS 2017
 THIRD QUARTER RESULTS 2017 KEY RESULTS In the 3Q17 Interjet total revenues added $5,835.1 million pesos that represented an increase of 22.0% over the revenue generated in the 3Q16. In the 3Q17, operating
Financial Results 3 rd Quarter MAR/2016 (FY2015)
") Financial Results MAR/2016 (FY2015) January 29 th, 2016 CONTENTS P.1 P.2 P.3 P.4~ Overview of FY MAR/16 Results Operating Revenue Operating Profit 1,030 1,020 1,010 +1.0Bn 1,022.3 1,023.4 (+0.1%) 180 160
Financial Results MAR/2016 (FY2015) January 29 th, 2016 CONTENTS P.1 P.2 P.3 P.4~ Overview of FY MAR/16 Results Operating Revenue Operating Profit 1,030 1,020 1,010 +1.0Bn 1,022.3 1,023.4 (+0.1%) 180 160
Finnair Group Interim Report 1 January 31 March 2008
 Finnair Group Interim Report 1 January 31 March 2008 1 29/04/2008 Presentation name / Author Outlook for the industry less positive Growth of demand declining due to uncertainty of global economy Growth
CROWN ANNOUNCES 2018 HALF YEAR RESULTS
 ASX / MEDIA RELEASE FOR IMMEDIATE RELEASE 22 February 2018 CROWN ANNOUNCES 2018 HALF YEAR RESULTS MELBOURNE: Crown Resorts Limited (ASX: CWN) ( Crown ) today announced its results for the half year ended
IMPORTANT NOTES TO THE UNAUDITED CONSOLIDATED FINANCIAL STATEMENTS OF THE KRKA GROUP FOR 2006
 Pursuant to the Rules of the Ljubljana Stock Exchange and the Securities Market Act (ZTVP-1, Official Gazette of the Republic of Slovenia, no 56/99), Krka, d.d., Novo mesto, Šmarješka cesta 6, 8501 Novo
JAPAN AIRLINES Co., Ltd. Financial Results 1 st Quarter Mar/2018(FY2017)
") JAPAN AIRLINES Co., Ltd. Financial Results Mar/2018(FY2017) July 31, 2017 Today s Topics P.1 P.2 P.3 P.4 P.6 P.15 Overview of Financial Results for (FY2017) 1 st quarter resulted in an increase in both
JAPAN AIRLINES Co., Ltd. Financial Results Mar/2018(FY2017) July 31, 2017 Today s Topics P.1 P.2 P.3 P.4 P.6 P.15 Overview of Financial Results for (FY2017) 1 st quarter resulted in an increase in both
Flughafen Wien Group Maintains Upward Trend: Passenger Growth and Strong Earnings Improvement in the First Nine Months of 2016
 Flughafen Wien Group Maintains Upward Trend: Passenger Growth and Strong Earnings Improvement in the First Nine Months of 2016 REVENUE increase to 545.4 million (+10.2%), EBITDA rise to 306.5 million (+13.1%
Copa Holdings Reports Net Income of $57.7 million and EPS of $1.36 for the Third Quarter of 2018
 Copa Holdings Reports Net Income of $57.7 million and EPS of $1.36 for the Third Quarter of 2018 November 14, 2018 PANAMA CITY, Nov. 14, 2018 /PRNewswire/ -- Copa Holdings, S.A. (NYSE: CPA), today announced
Quarterly Meeting# 4/2018
 Quarterly Meeting# 4/2018 3Q18 & 9M18 Performance & Outlook 14 November 2018 1 2016 ERAWAN. All rights reserved. The views expressed here contain some information derived from publicly available sources
SIAM FUTURE DEVELOPMENT PUBLIC CO., LTD. Corporate Presentation 2016
 SIAM FUTURE DEVELOPMENT PUBLIC CO., LTD. Corporate Presentation 2016 Overview Financial Summary Project Update 2 Overview Founded: 1994 Staff: 78 Centers: 22 Vision Unlike other developers, we create a
26 October 2017 Icelandair Group Interim Report NET PROFIT USD 101 MILLION IN THIRD QUARTER
 NET PROFIT USD 101 MILLION IN THIRD QUARTER Total income in Q3 up by 10% between years, to USD 536.0 million Passenger revenue higher than expected EBITDA unchanged year on year, at USD 161.1 million Passenger
HOPEWELL HOLDINGS LIMITED ANNOUNCES FY 2018/19 INTERIM RESULTS
 Press Release HOPEWELL HOLDINGS LIMITED ANNOUNCES FY 2018/19 INTERIM RESULTS Highlights 1H FY19 (1 April to 30 September 2018) First financial year after the change of financial year end date from 30 June
Nicco Parks & Resorts Ltd BSE Scrip Code:
 Nicco Parks & Resorts Ltd BSE Scrip Code: 526721 Other Leisure Facilities September 14, 2012 Equity Statistics Current Market Price Rs. 15.9 52 Week High / Low Rs. 24.4/15.2 Market Capitalisation Rs. crores
Copa Holdings Reports Net Income of US$51.9 Million for the Fourth Quarter of 2008 and US$152.2 Million for Full Year 2008
 Copa Holdings Reports Net Income of US$51.9 Million for the Fourth Quarter of 2008 and US$152.2 Million for Full Year 2008 Panama City, Panama --- February 19, 2009. Copa Holdings, S.A. (NYSE: CPA), parent
Year ended December 31, 2012
 Consolidated Earnings Report - Supplementary Information Consolidated Results ( ) 1. Consolidated Financial Highlights 2. Major Sales Sales Volume Data 3. Condensed Consolidated Statements of Income Condensed
Presentation on Results for the 3rd Quarter FY Idemitsu Kosan Co.,Ltd. February 14, 2018
 Presentation on Results for the 3rd Quarter FY 2017 Idemitsu Kosan Co.,Ltd. February 14, 2018 Table of Contents 1. FY 2017 3rd Quarter Results (1) Overview (2) Segment Information 2. Forecast for FY2017
SAS AB Analyst meeting
 SAS AB Analyst meeting London, August 9, 2001 2 2nd Quarter a tough Quarter The Marketplace Continued weak world economy Weaker Swedish economy SAS Weaker traffic growth and reduced passenger load factors