2016 Half-Yearly Results
|
|
|
- Nathan McDaniel
- 6 years ago
- Views:
Transcription

1 Presentation 29th July 2016
2 2016 Half-Yearly Review Underlying profit down 6% Commercial portfolio benefited from higher occupancy Steady contribution from mainland China residential business Profit attributable to shareholders enhanced by gain on property revaluations 1
3 Highlights 2015 June 16 June 15 US$905m Underlying profit attributable to shareholders US$393m US$419m US$1,107m Non-trading items US$870m US$94m US$2,012m Profit attributable to shareholders US$1,263m US$513m US Underlying earnings per share US US US Earnings per share US US US$12.19 NAV per share US$12.64 US$11.76 N/A Interim dividend per share US 6.00 US

4 Commercial Property 3
5 Commercial Portfolio ( 000 sq. ft NFA) HKL s Share Office Retail Hotel Total Hong Kong 4, ,867 Macau Singapore 1, ,782 Jakarta Hanoi Bangkok Others TOTAL 6, ,207 4

6 Hong Kong 1. One Exchange Square 2. Two Exchange Square 3. Three Exchange Square 4. The Forum 5. Jardine House 6. Chater House 7. Alexandra House 9a Gloucester Tower 9. Edinburgh Tower a. The Landmark Mandarin Oriental 10. York House 11. Landmark Atrium 12. Prince s Building 5
7 Hong Kong Central Grade A Office Rental Index Index H '16 Source: Jones Lang LaSalle 6
8 Hong Kong Central Grade A Office Market m sq. ft New supply Net take up Vacancy Vacancy % '01 '02 '03 '04 '05 '06 '07 '08 '09 '10 '11 '12 '13 '14 '15 '16 '17 '18 '19 '20 Source: Jones Lang LaSalle Disclaimer: The above forecast shall be regarded solely as a general guide. No representation is made nor responsibility accepted by Jones Lang LaSalle for the accuracy of the whole or any part whatsoever. 7
9 Hong Kong Grade A Office Market m sq. ft New supply Net take up Vacancy Vacancy % '01 '02 '03 '04 '05 '06 '07 '08 '09 '10 '11 '12 '13 '14 '15 '16 '17 '18 '19 '20 Source: Jones Lang LaSalle Disclaimer: The above forecast shall be regarded solely as a general guide. No representation is made nor responsibility accepted by Jones Lang LaSalle for the accuracy of the whole or any part whatsoever. 8
10 Hongkong Land Central Portfolio: Office 1H H H 2016 Average Net Rent (HK$ psf/month) Period-end Vacancy 4.2% 3.4% 3.1% Weighted Average Lease Expiry (years)

11 Hong Kong: Office Tenant Profile Property 6% Trading 2% Governments 1% Accounting 7% Others 14% Banks and other financial services 39% Legal 31% 10
12 Hong Kong: Expiration and Interim Rent Revisions 2H Total lettable office area subject to expiration/rent revisions ( 000 sq. ft) 224 1,414 1,357 % of area subject to expiration/rent revisions 5% 34% 33% Average expiring net rent (HK$ psf/month)
13 Hongkong Land Central Portfolio: Retail 1H H H 2016 Average Net Rent (HK$ psf/month) Period-end Vacancy 0% 0% 0% Weighted Average Lease Expiry (years) Note: Vacancy excludes areas under renovation. 12


14 Singapore One Raffles Link (100%-owned) One Raffles Quay (33%-owned) Marina Bay Financial Centre (33%-owned) 13
15 Singapore CBD Grade A Office Market m sq. ft New supply Net take up Vacancy Vacancy % '01 '02 '03 '04 '05 '06 '07 '08 '09 '10 '11 '12 '13 '14 '15 '16 '17 '18 '19 '20 CBD Raffles Place, Shenton Way, Marina Bay & Marina Centre Source: Jones Lang LaSalle Disclaimer: The above forecast shall be regarded solely as a general guide. No representation is made nor responsibility accepted by Jones Lang LaSalle for the accuracy of the whole or any part whatsoever. 14
16 Singapore Commercial Portfolio ( 000 sq. ft NFA) Office Retail Total HKL s Share One Raffles Link One Raffles Quay 1, , Marina Bay Financial Centre 2, ,081 1,027 TOTAL 4, ,723 1,782 15

17 Singapore: Office Tenant Profile Natural resources 7% Accounting 3% Others 9% Legal 6% Banks and other financial services 75% 16
18 Singapore: Office Average Rents and Vacancy 1H H H 2016 Average Gross Rent (S$ psf/month) Period-end Vacancy 1.9% 3.0% 1.0% Weighted Average Lease Expiry (years) Note: According to local market practice, the average office rent includes management charges. 17
19 Singapore: Expiration and Interim Rent Revisions 2H HKL s Share: Total lettable office area subject to expiration/rent revisions ( 000 sq. ft) % of area subject to expiration/rent revisions 2% 12% 46% Average expiring rent (S$ psf/month) Note: According to local market practice, the average office rent includes management charges. 18
 Occupancy: 94% WTC 3: Construction has")
20 Jakarta Jakarta Land (50%-owned) WTC 3 Existing portfolio features 135,000 sq. m. Average gross rent: US$25 psm per month (1H 2015: US$25 psm per month) Occupancy: 94% WTC 3: Construction has progressed to Level 19 (Completion: 2018) 19

21 Phnom Penh EXCHANGE SQUARE (100%-owned) Mixed-use complex of 30,000 sq. m. Heart of Phnom Penh Completion: late

22 Beijing WF CENTRAL (90%-owned) Prestigious retail centre, which includes an exclusive luxury hotel 43,000 sq. m. lettable retail area Open: mid

23 Residential Property 22
 Central Park")

24 Mainland China Completed Projects, Beijing Project Project Type Maple Place Maple Place (90%) Central Park (40%) 4 units handed over in 1H units available for future sale, mostly leased 72 apartments Central Park 23
25 Mainland China Development Projects Summary HKL s Share Project Interest Year of Acquisition Site Area (ha) Developable Area (m sq. m.) Constructed (m sq. m.) Under Construction (m sq. m.) Yorkville South, Chongqing 100% Yorkville North, Chongqing 100% Bamboo Grove, Chongqing 50% New Bamboo Grove, Chongqing 50% Landmark Riverside, Chongqing 50% Central Avenue, Chongqing 50% WE City, Chengdu 50% Parkville, Shanghai 50% Shenyang Projects 50% TOTAL
26 Mainland China Revenue Recognised US$m Chongqing Chengdu Beijing & Other $519m $276m $229m $350m $102m 1H '14 2H '14 1H '15 2H '15 1H '16 Note: The above chart includes HKL s share of Joint Ventures & Associates. 25
27 Mainland China Contracted Sales US$m Chongqing Chengdu Shanghai Beijing & Other $262m $373m $328m $474m $432m H '14 2H '14 1H '15 2H '15 1H '16 Note: The above chart includes HKL s share of Joint Ventures & Associates. 26
28 Mainland China Contracted Sales At 30th June 2016, US$885m (2015: US$821m) in sold but unrecognised contracted sales Some 35% of contracted sales scheduled to be recognised in 2H


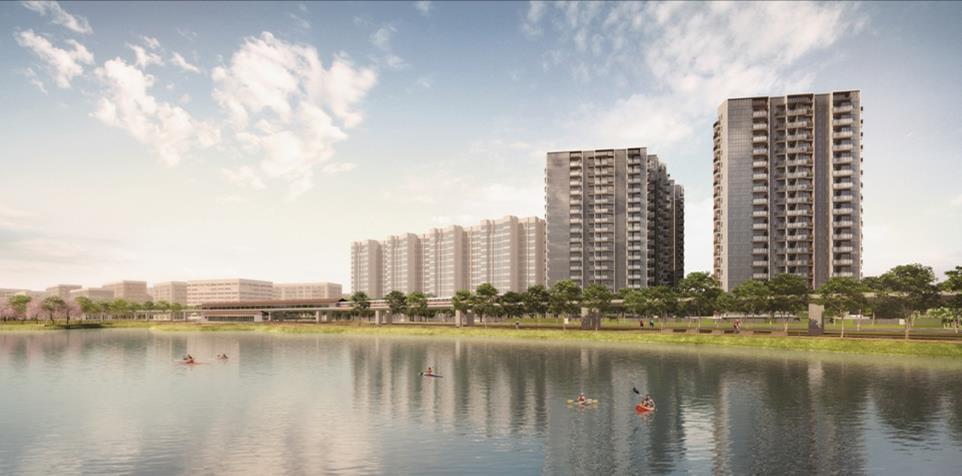
29 Singapore Sol Acres LakeVille Lake Grande J Gateway 28
30 Singapore Projects for Completion from 2H 2016 Project Units GFA ( 000 sq. ft) Estimated Completion Date Pre-Sold J Gateway H % LakeVille % Sol Acres 1,327 1, % Lake Grande (previously known as Jurong West) Launched on 23rd July 2016 TOTAL 3,474 3,218 29

31 Indonesia Nava Park, Greater Jakarta (49%-owned) JV with PT Bumi Serpong Damai Site area: 67 ha Southwest of central Jakarta 426 units launched for sale; 72% pre-sold Completion of - Lancewood: Marigold:

32 Indonesia Anandamaya Residences (40%-owned) JV with Astra International 509 luxury apartments; 91% pre-sold Completion:

33 Philippines Two Roxas Triangle (40%-owned) JV with Ayala Land 182 units; 98% pre-sold Completion:

34 Philippines Mandani Bay (40%-owned) JV with Taft Property Site area: 20 ha 1.2 million sq. m. GFA Residential and commercial Pre-selling commenced 33

35 Financial Results 34
36 Consolidated Profit and Loss Account (US$m) 2015 Full Year 2016 Half-Year 2015 Half-Year 1,932 Revenue (938) Net operating costs (327) (449) 994 Operating profit Share of results of joint ventures (74) Net financing charges (33) (38) (151) Tax (89) (82) (5) Non-controlling interests (1) (3) 905 Underlying profit ,107 Non-trading items ,012 Profit attributable to shareholders 1,
37 Revenue (US$m) 2015 Full Year 2016 Half-Year 2015 Half-Year 973 Commercial revenue Residential revenue ,932 Total
38 Underlying Profit by Business (US$m) 2015 Full Year 2016 Half-Year 2015 Half-Year 942 Commercial property Residential property (62) Corporate expenses (30) (31) 1, (107) Net financing charges (52) (54) (209) Tax (108) (112) (13) Non-controlling interests (5) (6) 905 Underlying profit
39 Commercial Property Underlying Profit (US$m) 2015 Full Year Greater China 2016 Half-Year 2015 Half-Year Hong Kong Mainland China & Macau 6 10 Southeast Asia & Others Singapore Others Total
40 Residential Property Underlying Profit (US$m) 2015 Full Year Greater China 2016 Half-Year 2015 Half-Year 57 - Hong Kong (1) (3) Mainland China & Macau Southeast Asia & Others Singapore 2 42 (1) - Others 1 (1) 354 Total
41 Consolidated Cash Flow (US$m) 2015 Full Year 2016 Half-Year 2015 Half-Year 896 Operating activities (146) Investing activities (81) 189 (449) Financing activities (305) (306) 15 Others (63) (2) 316 Decrease in net debt (2,657) Net debt at beginning of period (2,341) (2,657) (2,341) Net debt at end of period (2,322) (2,575) 40
42 Operating Activities (US$m) 2015 Full Year 2016 Half-Year 2015 Half-Year 994 Operating profit excl. non-trading items (78) Net interest paid (37) (41) (175) Tax paid (50) (67) (281) Payments for residential sites - (259) (407) Dev. expenditure on residential projects (169) (201) 1,079 Proceeds from residential sales Dividends received from joint ventures (353) Others (171) (150)
43 Investing Activities (US$m) 2015 Full Year 2016 Half-Year 2015 Half-Year (58) Major renovations capex (47) (22) (256) Funding of joint ventures (5) (10) 391 Advances and loan repayments from JVs (152) Development expenditure (62) (57) (71) Payment of deposit for a joint venture - - (146) (81)
44 Consolidated Cash Flow (US$m) 2015 Full Year 2016 Half-Year 2015 Half-Year 896 Operating activities (146) Investing activities (81) 189 Financing activities (445) - Dividends paid by the Company (303) (304) (4) - Dividends paid to minority shareholders (2) (2) (449) (305) (306) 15 Others (63) (2) 316 Decrease in net debt (2,657) Net debt at beginning of period (2,341) (2,657) (2,341) Net debt at end of period (2,322) (2,575) 43
45 Consolidated Balance Sheet (US$m) 2015 Full Year 2016 Half-Year 2015 Half-Year Investment properties 24,957 - Subsidiaries 26,079 23,871 4,296 - Joint ventures 4,311 4,428 29,253 30,390 28,299 Properties held for sale 2,714 - Subsidiaries 2,746 3,017 1,771 - Joint ventures 1,818 1,247 4,485 4,564 4,264 (2,677) Others (2,858) (2,263) 31,061 Gross assets (excluding cash) 32,096 30,300 Financed by: 28,720 - Total equity 29,774 27,725 2,341 - Net debt 2,322 2,575 31,061 32,096 30,300 44
46 Investment Property Basis of Valuation Capitalisation Rates 1H H H 2016 Hong Kong Office - Exchange Square 1 & % 3.75% 3.60% Hong Kong Retail - Landmark Atrium 4.50% 4.50% 4.50% Singapore Office - MBFC 3.75% 3.75% 3.50% Note: These capitalisation rates are provided on an indicative basis. 45
47 Investment Property Carrying Values (US$m) 2015 Full Year Greater China 2016 Half-Year 2015 Half-Year 23,671 - Hong Kong 24,746 22,469 1,532 - Mainland China & Macau 1,463 1,712 Southeast Asia & Others 3,428 - Singapore 3,549 3, Others ,253 Total 30,390 28,299 Note: The analysis includes share of Joint Ventures & Associates. 46
48 Properties Held for Sale Carrying Values (US$m) 2015 Full Year Greater China Note: The analysis includes share of Joint Ventures & Associates Half-Year 2015 Half-Year 18 - Hong Kong ,766 - Mainland China & Macau 2,650 2,269 Southeast Asia & Others 1,528 - Singapore 1,698 1, Others ,485 4,564 4,264 (1,187) Pre-sale proceeds (1,497) (1,039) 3,298 Net investment 3,067 3,225 47

49 Gross Assets at 30th June 2016 By Activity By Location Commercial 90% Residential 10% Hong Kong 76% Mainland China and Macau 10% Southeast Asia 14% 48
50 Treasury Management Summary 2014 Full Year 2015 Full Year 2016 Half-Year Net debt (US$m) 2,657 2,341 2,322 Gearing 10% 8% 8% Average tenor of debt (years) Average interest cost 2.9% 3.3% 3.4% Credit ratings - S & P A A A - Moody s A3 A3 A3 49
51 Maturity Profile of Committed Facilities/Bonds (US$m) US$m 3,000 Bank Facilities (Drawn & Undrawn) Bonds * $2,919m 2,500 2,000 1,500 1, $371m $671m $1,115m $882m $306m * Includes bonds and notes issued under MTN Programme which are at face value. 50
52 Liquidity at 30th June 2016 (All figures in US$bn) 2015 HK$ 1 S$ 2 US$ RMB Total 6.4 Committed lines Gross debt Available lines Cash Available liquidity Notes: (1) HK$ debt includes US$ debt swapped into HK$. (2) S$ debt includes HK$ debt swapped into S$. 51
53 Outlook Stable performance from the commercial portfolio is expected to continue Earnings from residential business is anticipated to be lower than last year The Group continues to seek opportunities to develop premium commercial and residential projects in Greater China and Southeast Asia 52

54 Thank you Hongkong Land
Presentation Results. 4th March 2016
 Presentation 4th March 2016 2015 Review Sound result in 2015 Continued strong performance from commercial portfolio Entry into Shanghai with prime mixed-use site Stable asset values 1 Highlights 2014 2015
Positive rental reversions in Hong Kong portfolio. Rising contribution from Singapore office portfolio. Strong performance from Residential business
 2012 Review The Group performed well in 2012 Positive rental reversions in Hong Kong portfolio Rising contribution from Singapore office portfolio Strong performance from Residential business 2 Highlights
2017 Half-Yearly Results
 2017 Half-Yearly Results Presentation 4th August 2017 Agenda Speakers: Robert Wong, Chief Executive & Simon Dixon, Chief Financial Officer 1. 2017 Half-Yearly Highlights 2. Investment Properties 3. Development
2017 Results 2018 Half-Yearly Results
 2017 Results 2018 Half-Yearly Results Presentation Presentation 27 July 2018 Agenda Speakers: Robert Wong, Chief Executive & Simon Dixon, Chief Financial Officer 1. 2018 Half-Yearly Highlights 2. Investment
2017 Results. Presentation. 9 March 2018
 2017 Results Presentation 9 March 2018 Agenda Speakers: Robert Wong, Chief Executive & Simon Dixon, Chief Financial Officer 1. 2017 Results Highlights 2. Investment Properties 3. Development Properties
2016 HALF YEAR RESULTS. Mandarin Oriental Hotel Group
 2016 HALF YEAR RESULTS Mandarin Oriental Hotel Group 2016 Half Year Results Highlights US $ m June 2016 June 2015 Combined Total Revenue * 644 641 Underlying EBITDA 71 82 * Includes revenue from the Group
2016 ANNUAL RESULTS. Mandarin Oriental Hotel Group
 2016 ANNUAL RESULTS Mandarin Oriental Hotel Group 2016 Annual Results Highlights US $ m 2016 2015 Combined Total Revenue * 1,324 1,335 Group s Total Revenue # 597 607 Underlying EBITDA 158 188 * Includes
The Wharf (Holdings) Limited. Interim Results. 15 August 2007
 Limited. Interim Results. 15 August 2007") The Wharf (Holdings) Limited Interim Results 15 August 2007 Key Recaps for Interim 2007 Properties continued to be the growth driver: turnover: HK$5,031M, +74; profit: HK$3,191M, +68 Core properties Harbour
The Wharf (Holdings) Limited Interim Results 15 August 2007 Key Recaps for Interim 2007 Properties continued to be the growth driver: turnover: HK$5,031M, +74; profit: HK$3,191M, +68 Core properties Harbour
Executive Directors Review
 Financial Summary Turnover for the year ended 31 December 2011 amounted to HK$571.4 million ( 47.6 million) (2010: HK$706.8 million ( 58.7 million)). The turnover was principally attributable to the recognition
Great Portland Estates Trading Update Strong Operational Performance
 Press Release 6 July 2017 Great Portland Estates Trading Update Strong Operational Performance Great Portland Estates plc ( GPE ) today publishes its trading update for the quarter to 30 June 2017. Continued
Standard Chartered to move to Marina Bay Financial Centre
 PRESS RELEASE Standard Chartered to move to Marina Bay Financial Centre Leasing up to 500,000 sq ft of space at Tower 1 to accommodate business growth 18 April 2007, Singapore Standard Chartered and BFC
FULL YEAR FINANCIAL REPORT
 FULL YEAR FINANCIAL REPORT 1 Jan 31 Dec 2013 27 February 2014 ANALYST / MEDIA BRIEFING Artist s Impression of Lush Acres FINANCIAL HIGHLIGHTS Artist s Impression of D Nest KEY FINANCIAL HIGHLIGHTS Delivered
2008 INTERIM ANNOUNCEMENT
 (Stock Code: 78) 2008 INTERIM ANNOUNCEMENT FINANCIAL HIGHLIGHTS Six months ended 30th June, 2008 (Unaudited) Six months ended 30th June, 2007 (Unaudited) HK$ M HK$ M Revenue 750.8 622.0 Operating profit
2017 ANNUAL RESULTS. Mandarin Oriental Hotel Group
 2017 ANNUAL RESULTS Mandarin Oriental Hotel Group 2017 Performance and Highlights Hotels performed better in 2017 Results impacted by ongoing renovation of London property Restoration of Hotel Ritz, Madrid
Oxley Delivers Stellar Growth of 58% in PATMI to. S$130.9 million for HY2017
 For immediate release Oxley Delivers Stellar Growth of 58% in PATMI to S$130.9 million for HY2017 - Half-year revenue increased by 19% year-on-year to S$732.2 million - Gross profit margin increased from
HALF YEAR RESULTS 2012
 HALF YEAR RESULTS 2012 2012 HALF YEAR PERFORMANCE Improved performances at most Asian hotels Challenging economic conditions impacted results in Europe Total revenues increased in The Americas, despite
HOPEWELL HOLDINGS LIMITED ANNOUNCES FY 2018/19 INTERIM RESULTS
 Press Release HOPEWELL HOLDINGS LIMITED ANNOUNCES FY 2018/19 INTERIM RESULTS Highlights 1H FY19 (1 April to 30 September 2018) First financial year after the change of financial year end date from 30 June
2008 ANNUAL RESULTS HIGHLIGHTS
 2008 ANNUAL RESULTS HIGHLIGHTS US$m Combined Total Revenue EBITDA 2008 1,016 164 2007 1,008 190 Two-thirds of drop in earnings in 2008 due to currency related movements and Geneva renovation Remaining
Interim Results Presentation. 27 March 2008
 Interim Results Presentation 27 March 2008 Contents Page Group structure Results snapshot Review of operations Hong Kong China Market outlook Looking ahead Investor contact 3 4-7 8-10 11-14 15 16 18-2
THE HONGKONG AND SHANGHAI HOTELS, LIMITED
 FOR IMMEDIATE RELEASE 26 AUGUST 2009 THE HONGKONG AND SHANGHAI HOTELS, LIMITED INTERIM RESULTS FOR THE SIX MONTHS ENDED 30 JUNE 2009 HIGHLIGHTS Key financial results Turnover decreased by 18% to HK$1,962
15th August Interim Results Analyst Briefing
 15th August 2013 2013 Interim Results Analyst Briefing Brickell CityCentre, Miami, U.S.A. Financial Summary Results Highlights Gross Rental Income Underlying Profit Equity Attri. to Shareholders HK$ M
2011 Final Results Analyst Briefing
 2011 Final Results Analyst Briefing Analyst Presentation XX March 2010 15 March 2012 Hong Kong 1. Key Developments Key Developments Apr2011 Acquiredtwo parcels of land adjoining the existing Brickell CitiCentre
2008/09 Interim Results For the six months ended 31 December 2008
 Bossini International Holdings Limited 2008/09 Interim Results For the six months ended 31 December 2008 Corporate Presentation 18 March 2009 0 0 Disclaimer The information contained in this presentation
2006 INTERIM ANNOUNCEMENT
 (Stock Code: 78) 2006 INTERIM ANNOUNCEMENT FINANCIAL HIGHLIGHTS Six months ended 30th June, 2006 (Unaudited) Six months ended 30th June, 2005 % Change (Unaudited) HK$ M HK$ M Revenue 608.3 542.4 +12.1%
Cathay Pacific Airways 2010 Annual Results 9 March 2011
 Cathay Pacific Airways 2010 Annual Results 9 March 2011 1 Annual Result 2010 2009 Change Group Profit/(Loss) HK$14,048m HK$4,694m +199.3% Group Turnover HK$89,524m HK$66,978m +33.7% Profit Margin 15.7%
JOINTLY ANNOUNCES 2017/18 INTERIM RESULTS * * * RENTAL INCOME SURGES 25% STRENGTHS RECURRING INCOME STREAMS FOR SUSTAINABLE GROWTH
 [For Immediate Release] JOINTLY ANNOUNCES 2017/18 INTERIM RESULTS * * * RENTAL INCOME SURGES 25% STRENGTHS RECURRING INCOME STREAMS FOR SUSTAINABLE GROWTH (Hong Kong, 23 November, 2017) Emperor International
2009 HALF-YEARLY RESULTS HIGHLIGHTS
 2009 HALF-YEARLY RESULTS HIGHLIGHTS US$m Combined Total Revenue of Hotels under Management EBITDA (US$m) June 2009 389.7 34.5 June 2008 520.2 86.2 Depressed demand due to global downturn Group takes action
Singapore Property Market
 Half Year Financial Report 1 Jan 30 June 2006 14 August 2006 Presentation Outline I. Singapore Property Market II. Operation Review III. Financial Highlights IV. Market Outlook 1 Singapore Property Market
 FINANCIAL STATEMENT AND RELATED ANNOUNCEMENT https://www1.sgxnet.sgx.com/sgxnet/lcanncsubmission.nsf/vwprint/f844e4b372cc79d4482578e900280e08?open... Page 1 of 1 12/8/2011 Print this page Presentation
Centurion Corporation Limited
 Centurion Corporation Limited Corporate Presentation 6 January 2014 Disclaimer This presentation and the accompanying presentation materials (if any) ("Presentation") are made for informational purposes,
Highlights from the Annual Results December 2007
 Highlights from the Annual Results December 2007 Disclaimer The information in this document is taken from the BAA 2007 Annual Results ( the Results ) which were published on 11 March 2008 and other public
THE HONGKONG AND SHANGHAI HOTELS, LIMITED
 To: All Financial/Business/Travel Editors FOR IMMEDIATE RELEASE 24 AUGUST, 2011 THE HONGKONG AND SHANGHAI HOTELS, LIMITED INTERIM RESULTS FOR THE SIX MONTHS ENDED 30 JUNE 2011 HIGHLIGHTS Positive momentum
HALF YEAR REPORT February Leighton Holdings Limited
 HALF YEAR REPORT February 2009 PRESENTATION OUTLINE Results highlights Operational update Financial statements Strategy and outlook 2 Half Year Report I 12 February 2009 I RESULTS HIGHLIGHTS 3 Half Year
ARSN Interim Report Responsible Entity Brookfield Capital Management Limited ACN AFSL
 Brookfield Prime Property Fund ARSN 110 096 663 Interim Report 2015 Responsible Entity Brookfield Capital Management Limited ACN 094 936 866 AFSL 223809 1 Message from the Chairman 2 Half Year Review 5
Crown Resorts Limited
 Crown Resorts Limited 2015 Full Year Results Presentation 13 August 2015 1 Crown Resorts Limited Results Overview Crown Resorts Limited (Crown) performance: Overall, the results for Crown s portfolio of
Crown Resorts Limited
 Crown Resorts Limited Annual General Meeting 20 October 2016 1 Presentation Outline F16 Year in Review 2 Crown Resorts Limited Group Result F16 Normalised $m F15 Normalised $m Variance F/(U) F16 Actual
2008 INTERIM RESULTS HIGHLIGHTS
 2008 INTERIM RESULTS HIGHLIGHTS US$m Combined Total Revenue of Hotels under Management EBITDA (US$m) June 2008 520.1 86.2 June 2007 477.4 84.5 2008 INTERIM RESULTS HIGHLIGHTS US$m June 2008 June 2007 Profit
Hongkong Land Officially Opens WF CENTRAL in Beijing
 News Release To: Business Editors For immediate release Hongkong Land Officially Opens WF CENTRAL in Beijing BEIJING, 29 th May 2018 - Hongkong Land today officially opened WF CENTRAL, its US$1.2 billion
Corporate Presentation 2015/16 Interim Results
 Corporate Presentation 2015/16 Interim Results 24 February 2016 0 Disclaimer The information contained in this presentation is intended solely for your personal reference. Such information is subject to
Investor Meeting Presentation. 4 June 2014
 Investor Meeting Presentation 4 June 2014 COMPANY OVERVIEW 1Q2014 RESULTS OVERVIEW OPERATION HIGHLIGHTS Q&A 2 Founded in 1963, listed on the Singapore Exchange in 1964 Three core businesses: - Property
2005 INTERIM ANNOUNCEMENT
 (Stock Code: 78) 2005 INTERIM ANNOUNCEMENT FINANCIAL HIGHLIGHTS Six months ended 30th June, 2005 (Unaudited) HK$ M Six months ended 30th June, 2004 (Unaudited and restated) HK$ M % Change Turnover 542.4
Cathay Pacific Airways Annual Results 10 March Cathay Pacific Airways Interim Results 6 August 2008
 Cathay Pacific Airways 2009 Annual Results 10 March 2010 Cathay Pacific Airways 2008 Interim Results 6 August 2008 Annual Result 2009 2008 (restated) Group Profit/(Loss) HK$4,694m (HK$8,696m) Group Turnover
KSH HOLDINGS LIMITED. Corporate Presentation May 27, 2014
 KSH HOLDINGS LIMITED Corporate Presentation May 27, 2014 KSH Corporate Presentation OVERVIEW KSH Holdings Limited RESULTS FY2014 UPDATES Corporate Developments OUTLOOK Strategies Moving Forward CONCLUSION
Cathay Pacific Airways
 Cathay Pacific Airways Interim Results for the six months ended 30 th June 2014 13th August 2014 1 Interim Results 1H2014 1H2013 Change Profit attributable to the shareholders of Cathay Pacific HK$ million
Melco International Development Limited (Incorporated in Hong Kong with limited liability) Website : (Stock Code : 200)
 Website : (Stock Code : 200)") Hong Kong Exchanges and Clearing Limited and The Stock Exchange of Hong Kong Limited take no responsibility for the contents of this announcement, make no representation as to its accuracy or completeness
Hong Kong Exchanges and Clearing Limited and The Stock Exchange of Hong Kong Limited take no responsibility for the contents of this announcement, make no representation as to its accuracy or completeness
Colliers International March 2016 The New Bund
 Colliers International March 2016 The New Bund 3 WENSHUI ROAD A 20 MIDDLE RING ROAD Shanghai Railway Station Lujiazui People s Square Hongqiao Transportation Hub WEST YAN AN ROAD Xujiahui INNER RING
Cathay Pacific Airways
 Cathay Pacific Airways Annual Results for the year ended 31 st December 2011 14 March 2012 1 Annual Result 2011 2010 Change Group attributable profit HK$5,501m HK$14,048m -60.8% Group Turnover HK$98,406m
CapitaMalls Asia Limited Annual General Meeting Extraordinary General Meeting
 CapitaMalls Asia Limited Annual General Meeting Extraordinary General Meeting 17 April 2014 1 Disclaimer No representation or warranty expressed or implied is made as to, and no reliance should be placed
Wheelock and Company Limited The Wharf (Holdings) Limited. 28 November 2007 Analyst Briefing
 Limited. 28 November 2007 Analyst Briefing") Wheelock and Company Limited The Wharf (Holdings) Limited 28 November 2007 Analyst Briefing Wheelock s Results (for 6-month period ended 30.9.07) Consolidation Wharf s financial statements were fully consolidated
Wheelock and Company Limited The Wharf (Holdings) Limited 28 November 2007 Analyst Briefing Wheelock s Results (for 6-month period ended 30.9.07) Consolidation Wharf s financial statements were fully consolidated
An Overview of SATS. Cho Wee Peng, CFO SIAS Corporate Profile & Investment Seminar 30 November 2013
 An Overview of SATS Cho Wee Peng, CFO SIAS Corporate Profile & Investment Seminar 30 November 2013 Forward Looking Statements This presentation may contain forward-looking statements regarding, among other
HATTEN LAND LIMITED. Shaping the Future, Melaka and Beyond. Corporate Presentation 12 October 2017
 HATTEN LAND LIMITED Shaping the Future, Melaka and Beyond Corporate Presentation 12 October 2017 Disclaimer Information in this presentation may contain forward-looking statements that reflect the current
2007/08 Interim Results
 Bossini International Holdings Limited 2007/08 Interim Results For the six months ended 31 December 2007 Corporate Presentation 19 March 2008 0 Agenda Results Highlights Review of Operations Future Plans
Air China Limited 2015 First Quarter Results
 Air China Limited 2015 First Quarter Results April 2015 Under PRC GAAP, unaudited Agenda Part 1 Part 2 Part 3 Results Highlights Business Performance Financial Review Part 1 Results Highlights Results
RESULTS RELEASE 20 August GENTING HONG KONG GROUP ANNOUNCES FIRST HALF RESULTS FOR 2015 Highlights
 RESULTS RELEASE 20 August 2015 FOR IMMEDIATE RELEASE INTERNATIONAL GENTING HONG KONG GROUP ANNOUNCES FIRST HALF RESULTS FOR 2015 Highlights The commentary below is prepared based on a comparison of the
Record Retail Sales Drove Robust Performance. Wharf Real Estate Investment Company Limited 2018 Interim Results 7 Aug 2018
 Record Retail Sales Drove Robust Performance Wharf Real Estate Investment Company Limited 2018 Interim Results 7 Aug 2018 Highlights 999-year Land Leases Offer a Differentiation* HKIP & Hotel 6 Core Assets
Portfolio. income at ANZ income was up. With. first-half. share
 NZX and media announcement 19 February 2013 Precinct announces improvedi result and positive outlook Performance for six months to 31 December 2012 Financial Performance Net profit after tax: $23.6 millionn
Cathay Pacific Airways Interim Results for the six months ended 30 June 2012
 Cathay Pacific Airways Interim Results for the six months ended 30 June 2012 8 August 2012 1 Interim Result 1H2012 1H2011 Change Group attributable (loss) / profit HK$ million (935) 2,808-133.3% Group
Forward-Looking Statements Statements in this presentation that are not historical facts are "forward-looking" statements and "safe harbor
 2017 Annual Meeting of Shareholders Presentation May 2017 Forward-Looking Statements Statements in this presentation that are not historical facts are "forward-looking" statements and "safe harbor statements"
LOCATED AT THE GATEWAY OF THE TROPICAL PROVINCE, RIDING ON THE GROWTH MOMENTUM OF THE COUNTRY, WE ARE ON THE RIGHT TRACK OF TAKING OFF.
 LOCATED AT THE GATEWAY OF THE TROPICAL PROVINCE, RIDING ON THE GROWTH MOMENTUM OF THE COUNTRY, WE ARE ON THE RIGHT TRACK OF TAKING OFF. MANAGEMENT DISCUSSION INDUSTRY REVIEW Civil Aviation Industry in
For personal use only
 ASX Announcement 16 November 2015 DESTINATION BRISBANE CONSORTIUM AND QUEENSLAND GOVERNMENT ENTER INTO AGREEMENTS FOR QUEEN S WHARF BRISBANE Echo Entertainment Group Limited (Echo) 1 today announced that
HALF YEAR RESULTS TO 30 SEPTEMBER 2017
 HALF YEAR RESULTS TO 30 SEPTEMBER 2017 1 AGENDA ONE RESULTS HIGHLIGHTS Gerald Kaye TWO FINANCIALS Tim Murphy THREE PORTFOLIO HIGHLIGHTS Matthew Bonning-Snook FOUR OUTLOOK Gerald Kaye FIVE Q&A 2 RESULTS
Corporate Presentation 2012/13 Interim Results
 Corporate Presentation 2012/13 Interim Results 26 February 2013 0 Disclaimer The information contained in this presentation is intended solely for your personal reference. Such information is subject to
Crown Resorts Limited
 Crown Resorts Limited 2016 Half Year Results Presentation 25 February 2016 1 Crown Resorts Limited Results Overview Crown Resorts Limited (Crown) performance: The 2016 First Half results across Crown s
CROWN ANNOUNCES 2018 HALF YEAR RESULTS
 ASX / MEDIA RELEASE FOR IMMEDIATE RELEASE 22 February 2018 CROWN ANNOUNCES 2018 HALF YEAR RESULTS MELBOURNE: Crown Resorts Limited (ASX: CWN) ( Crown ) today announced its results for the half year ended
2014 Annual Results 1
 1 2014 Annual Results Annual Results 2014 2013 Change HK$M HK$M Attributable profit 573 625-8.3% Revenue 11,927 7,387 +61.5% Earnings per share (HK$) 3.45 3.76-8.3% Total dividends per share (HK$) 2.10
Convenience Retail Asia maintains growth momentum in turnover and profit for first half
 For Immediate Release Convenience Retail Asia maintains growth momentum in turnover and profit for first half Saint Honore integration well underway and synergies being achieved Hong Kong, 2 August 2007
Cathay Pacific Airways Interim Results 04 August Cathay Pacific Airways Interim Results 6 August 2008
 Cathay Pacific Airways 2010 Interim Results 04 August 2010 Cathay Pacific Airways 2008 Interim Results 6 August 2008 Interim Result 1H 2010 1H 2009 Group Profit/(Loss) HK$6,840m HK$812m Group Turnover
2012 Full Year Results Briefing. 28 February 2013
 2012 Full Year Results Briefing 28 February 2013 1 KEY FINANCIALS & STRATEGY BUSINESS REVIEW OUTLOOK Q&A 2 UOL GROUP LIMITED KEY FINANCIALS & STRATEGY GWEE LIAN KHENG GROUP CHIEF EXECUTIVE 3 S$m FY 2012
SET Opportunity Day #3/2011
 SET Opportunity Day #3/2011 2Q11 & 1H11 Performance & Outlook 18 August 2011 The views expressed here contain some information derived from publicly available sources that have not been independently verified.
Investor Newsletter. Building a Future Sharing a Dream. Issue RMB6.1 Billion Contracted Sales Achieved for 2009
 March 2010 Building a Future Sharing a Dream Investor Newsletter Shui On Land (272.HK) Issue 1 2010 1 RMB6.1 Billion Contracted Sales Achieved for 2009 Shui On Land Limited ( SOL ) is pleased to announce
Crown Limited Full Year. Results Presentation. 25 August 2011
 Crown Limited 2011 Full Year Results Presentation 25 August 2011 1 Crown Limited Overview Normalised 1 NPAT up 18.0% to $340.3 million, Reported NPAT $335.9 million, up 14.9% Australian casinos performance:
Air China Limited Interim Results. August Under IFRS
 Air China Limited 21 Interim Results Under IFRS August 21 1 Agenda 21 Interim Results Overview Business Overview Financial Overview Outlook 2 2 2 21 Interim Results 3 21 Interim Results Overview 4 4 4
CONSOLIDATED PROFIT AND LOSS ACCOUNT
 CONSOLIDATED PROFIT AND LOSS ACCOUNT for the year ended 31st December Turnover Note Passenger services 26,407 18,663 Cargo services 11,395 9,913 Catering and other services 1,263 1,002 Total turnover 1
SIAM FUTURE DEVELOPMENT PUBLIC CO., LTD. Corporate Presentation Q4-15
 SIAM FUTURE DEVELOPMENT PUBLIC CO., LTD. Corporate Presentation Q4-15 Overview Financial Summary Project Update 2 Overview Founded: 1994 Staff: 80 Centers: 22 Vision Unlike other developers, we create
HATTEN LAND LIMITED. Shaping the Future, Melaka and Beyond. FY2017 Results. Corporate Presentation 17 August 2017
 HATTEN LAND LIMITED Shaping the Future, Melaka and Beyond FY2017 Results Corporate Presentation 17 August 2017 Disclaimer Information in this presentation may contain forward-looking statements that reflect
Melco International Development Limited (Incorporated in Hong Kong with limited liability) Website : (Stock Code : 200)
 Website : (Stock Code : 200)") Hong Kong Exchanges and Clearing Limited and The Stock Exchange of Hong Kong Limited take no responsibility for the contents of this announcement, make no representation as to its accuracy or completeness
Hong Kong Exchanges and Clearing Limited and The Stock Exchange of Hong Kong Limited take no responsibility for the contents of this announcement, make no representation as to its accuracy or completeness
Singapore. 23 October 2007
 Raffles Raffles City City Acquisition Singapore 23 October 2007 1 3Q 2007 - RCS Trust Actual S$'000 1 Jan 2007 to 30 Sep 2007 CCT's 60% Interest RCS Trust Forecast 1 S$'000 Var. % Actual S$'000 Gross Revenue
2015 PRELIMINARY RESULTS
 2015 PRELIMINARY RESULTS 1 Funding investment through disposals since 2010 Strategy strengthening the business and delivering on our plan m 1,600 1,400 4,036.5bn Pence per share 1,400 % 45 1,200 1,300
Page 1. News Release
 Page 1 News Release To: Business/Finance/Property/News Page For immediate release Hongkong Land Breathes New Life into Wangfujing with Landmark Project WF CENTRAL Introducing WF CENTRAL, a premium lifestyle
BANYAN TREE HOLDINGS LIMITED (Company Registration Number: H)
") BANYAN TREE HOLDINGS LIMITED (Company Registration Number: 200003108H) 2 ND QTR RECORDED A SMALLER LOSS OF S7.0 MILLION Highlights: 2Q11: - Revenue increased 3% to S63.6 million; Operating Profit doubled
BANYAN TREE HOLDINGS LIMITED (Company Registration Number: 200003108H) 2 ND QTR RECORDED A SMALLER LOSS OF S7.0 MILLION Highlights: 2Q11: - Revenue increased 3% to S63.6 million; Operating Profit doubled
Analysts Briefing. 18 March Cathay Pacific Airways Limited
 Analysts Briefing 18 March 2015 Cathay Pacific Airways Limited Annual Results 2014 2013 Change Group attributable profit HK$m 3,150 2,620 +20.2% Group turnover HK$m 105,991 100,484 +5.5% Profit margin
GOING PLACES MACARTHURCOOK OFFICE PROPERTY TRUST
 GOING PLACES MACARTHURCOOK OFFICE PROPERTY TRUST ANNUAL REPORT 2006 1 2 3 4 1 2 181 Miller Street, North Sydney, NSW 150 170 Leichhardt Street, Spring Hill, Brisbane, QLD 3 4 38 Akuna Street, Canberra,
YANLORD, TOGETHER WITH HO BEE AND SHANGHAI YOUYOU, ACQUIRES TWO PRIME RESIDENTIAL SITES IN ZHUHAI FOR RMB3.0 BILLION
 YANLORD, TOGETHER WITH HO BEE AND SHANGHAI YOUYOU, ACQUIRES TWO PRIME RESIDENTIAL SITES IN ZHUHAI FOR RMB3.0 BILLION Yanlord, together with Ho Bee and Shanghai Youyou Group in a 60%, 20%, 20% joint venture,
Wheelock and Company Limited The Wharf (Holdings) Limited Interim Results 27 August 2008
 Limited Interim Results 27 August 2008") Wheelock and Company Limited The Wharf (Holdings) Limited 27 August 2008 Consolidation In 2007, Wheelock changed its financial year end date from 31st Mar to 31st Dec to coincide with that of Wharf Accordingly,
Wheelock and Company Limited The Wharf (Holdings) Limited 27 August 2008 Consolidation In 2007, Wheelock changed its financial year end date from 31st Mar to 31st Dec to coincide with that of Wharf Accordingly,
Cathay Pacific Airways 2011 Interim Results 10 August 2011
 Cathay Pacific Airways 2011 Interim Results 10 August 2011 1 Interim Result 1H 2011 1H 2010 Group profit HK$2,808m HK$6,840m Group turnover HK$46,791 HK$41,337m Profit margin 6.0% 16.5% Return on capital
274% 150% of the Company (HK$ million) Basic earnings per share (HK cent) % Interim dividend per share (HK cent) 5 5
 Basic earnings per share (HK cent) % Interim dividend per share (HK cent) 5 5") Press Release For Immediate Release KWIH 2015 Interim Profit Increased 150% to HK$534 Million Attributable Contracted Sales Surged 5 Times to Approximately HK$8,700 Million in the First Half of the Year
Press Release For Immediate Release KWIH 2015 Interim Profit Increased 150% to HK$534 Million Attributable Contracted Sales Surged 5 Times to Approximately HK$8,700 Million in the First Half of the Year
FAR EAST H-TRUST POSTS 2Q 2014 INCOME AVAILABLE FOR DISTRIBUTION OF $22.1 MILLION
 Highlights: FAR EAST H-TRUST POSTS 2Q 2014 INCOME AVAILABLE FOR DISTRIBUTION OF $22.1 MILLION Gross revenue of $29.6 million in 2Q 2014 amidst challenging operating environment Net property income of $26.6
Minor International Public Company Limited
 Minor International Public Company Limited Management Discussion & Analysis MINT s financial performance as of 30th June 2008 Summary of Key Financial Performance 2Q08 Performance Minor International Public
WHEELOCK. FY2008 Results Highlights WHEELOCK AND COMPANY LIMITED
 2008 Annual Results WHEELOCK FY2008 Results Highlights WHEELOCK AND COMPANY LIMITED 2 Results Highlights Consolidation Wheelock & Co changed its financial year-end date from 31st Mar to 31st Dec at the
2010 Full Year Results Briefing. 22 February 2011
 2010 Full Year Results Briefing 22 February 2011 1 2010 IN SUMMARY RESULTS OVERVIEW PERFORMANCE REVIEW GOING FORWARD Q&A 2 UOL GROUP LIMITED 2010 IN SUMMARY RESULTS OVERVIEW GWEE LIAN KHENG GROUP CHIEF
Passenger services 7,438 10,550 Cargo services 4,405 4,225 Catering and other services Turnover 1 12,275 15,511
 Cathay Pacific Airways Limited - 2003 Interim Results Consolidated Profit and Loss Account - Unaudited Six months ended 30th June 2003 2002 Note Passenger services 7,438 10,550 Cargo services 4,405 4,225
Cairo, May 21, TMG Holding reports EGP BN consolidated revenue, EGP 161 MN consolidated net profit
 First Quarter ending Earning Release Cairo, May 21, - reports EGP 1.139 BN consolidated revenue, EGP 161 MN consolidated net profit after minority and EGP 2.2 BN of new sales value for the first quarter
2010 HALF-YEAR RESULTS HIGHLIGHTS
 2010 HALF-YEAR RESULTS HIGHLIGHTS US$m June 2010 June 2009 Combined Total Revenue 474.2 389.7 Combined EBITDA * 57.8 34.5 Benefited from increased demand in all markets, particularly Asia Occupancies not
Press release February 21, 2014
 Press release February 21, 2014 2013 earnings Recurrent ent net income per share up +1.2%, with NAV per share growth of +1.7% Significant improvement in the financial occupancy rate and rental margin Recurrent
IHG. Supplementary Information 31 December 2014
 Supplementary Information 31 December 2014 Index RevPAR - 3 and 12 months to 31 December 2014 2014 Current Trading RevPAR, ADR & Occupancy Hotel & Room Count at 31 December 2014 Pipeline at 31 December
S$ million 2Q2012 2Q2011 Change 1H2012 1H2011 Change Revenue % % Gross Profit % % Gross Profit Margin
 Roxy-Pacific Holdings Limited NEWS RELEASE ROXY-PACIFIC ACHIEVES 8% INCREASE IN NET PROFIT TO S$17.7 MILLION IN 2Q2012 - Revenue rises 13% to S$52.7 million - 18% surge in revenue from Property Development
Record Retail Sales Drove Robust Performance. Wharf Real Estate Investment Company Limited 2018 Interim Results 7 Aug 2018
 Record Retail Sales Drove Robust Performance Wharf Real Estate Investment Company Limited 2018 Interim Results 7 Aug 2018 Highlights 999-year Land Leases Offer a Differentiation* HKIP & Hotel 6 Core Assets
JAPAN AIRLINES Co., Ltd. Financial Results 1 st Quarter Mar/2018(FY2017)
") JAPAN AIRLINES Co., Ltd. Financial Results Mar/2018(FY2017) July 31, 2017 Today s Topics P.1 P.2 P.3 P.4 P.6 P.15 Overview of Financial Results for (FY2017) 1 st quarter resulted in an increase in both
JAPAN AIRLINES Co., Ltd. Financial Results Mar/2018(FY2017) July 31, 2017 Today s Topics P.1 P.2 P.3 P.4 P.6 P.15 Overview of Financial Results for (FY2017) 1 st quarter resulted in an increase in both
2006 Preliminary Results. 7 March 2007
 2006 Preliminary Results 7 March 2007 Anthony Rabin 16 Headline numbers 2005 2006 Revenue 4,938m 5,852m +19% Pre-tax profit* 134m 152m +13% Adjusted eps* 24.1p 27.3p +13% Full-year proposed dividend 8.1p
1HFY2012 RESULTS PRESENTATION
 1HFY2012 RESULTS PRESENTATION 21st February 2012 AWARD WINNING PROPERTY DEVELOPER Listed 1994, consistently profitable, always paid dividends Strategically located and diverse residential portfolio Urban