Indiabulls Real Estate Limited (CIN : L45101DL2006PLC148314)
|
|
|
- Marcia Cameron
- 6 years ago
- Views:
Transcription
1 Indiabulls Real Estate Limited (CIN : L45101DL2006PLC148314) Earnings Update Audited Financial Results FY April 23, 2014
2 Safe Harbor Statement This document contains certain forward looking statements based on current expectations of Indiabulls management. Actual results may vary significantly from the forward looking statements in this document due to various risks and uncertainties. These risks and uncertainties include the effect of economic and political conditions in India, and outside India, volatility in interest rates and in Securities markets, new regulations and government policies that might impact the business of Indiabulls, the general state of the Indian economy and the management s ability to implement the company s strategy. Indiabulls doesn t undertake any obligation to update these forward looking statements. This document does not constitute an offer or recommendation to buy or sell any securities of Indiabulls or any of its subsidiaries or associate companies. This document also doesn t constitute an offer or recommendation to buy or sell any financial products offered by Indiabulls. Investor Contact Investor.relations@indiabulls.com 2
3 Business Update Key Financial Highlights: FY FY FY Total Revenues (Rs. Cr.) 1, , PBT (Rs. Cr.) PAT (Rs. Cr.) EPS (Rs.) Key Financial Highlights: Q4 FY Q4 FY Q4 FY Total Revenues (Rs. Cr.) PBT (Rs. Cr.) PAT (Rs. Cr.) EPS (Rs.) Dividend of Rs. 1 per share - 50% on face value of Rs. 2 per share has been declared for Q4 FY Total Dividend of Rs.3 for FY i.e. 150% on face value of Rs. 2 per share. Total Sales of Rs. 3,076 Crores for an area of 3.40 msft in FY-14 vs. Rs. 3,002 Crores for an area of 2.82 msft in FY-13. 3


4 Total Land Bank Land Bank for Residential development is acres. Land Bank for Commercial development is acres. Total Land Bank is 1, acres. Region Wise Land Bank Summary Chennai 18% Greater Mumbai & MMR 28% NCR 54% All land mentioned in the table is fully paid for and in our possession. 4

5 IBREL Product Portfolio India s 3 rd largest real estate company with strategic assets Gross Development Value Region Wise Land Bank Summary CHENNAI 18% NCR (Delhi) Rs. 13,355 Cr. MUMBAI 28% NCR 54% Jodhpur Agra Ahmedabad Mumbai Region Rs. 28,055 Cr. Baroda Indore Vishakapatnam Total Land bank of 1,010 acres spread over Mumbai, NCR and Chennai apart from 2,588 acres SEZ land in Nashik, Maharashtra Chennai Rs. 4,135 Cr. Madurai Gross Development Value in super metros of Rs. 45,547 Cr. Developing 23.9 mn sq. ft. residential development across the country More than 95% of our projects (by value) are in high value supermetro cities Mumbai Metro Region, National Capital Region (Delhi) and Chennai Credit rating of A+, highest amongst its real estate developers peers 5
6 Area Under Development (Area under construction and Projects Under Approval Process) TOTAL AUD (Region Wise Area in msft) REGION COMMERCIAL RESIDENTIAL TOTAL PERCENTAGE GREATER MUMBAI & MMR % NCR % CHENNAI % OTHERS % GRAND TOTAL % Focus Geographies of Mumbai, NCR and Chennai constitute ~95% of AUD and ~99% of value of AUD All land acquisition and development effort focus is concentrated on these three centers 6

7 Approved Projects Area Under Construction* million sq. ft. Regional Breakup of Area Under Construction % % % % Super Premium Premium Mid Income Mumbai MMR NCR Chennai Rest of India Total Saleable Area Under Construction Mn. Sq. ft. as on 31 st March *All construction work being executed through 100% IBREL subsidiaries by Grade A contractors like Shapoorji Pallonji, Ahluwalia etc. 7
8 Approval Status of Major Projects Environmental Clearance Building Plan Approval Airport NOC Fire NOC Indiabulls Greens Panvel Golf City Savrolli NA Indiabulls Blu Worli One Indiabulls Worli Centrum Park Enigma Chennai Greens NA NA Sky Sky Forest Sky Suites 8
9 Ongoing Projects Handover Schedule Project City Month Towers Units Indiabulls Centrum Block 18,19, Ahmedabad Ahmedabad Apr Indiabulls Centrum B tower, Hyderabad Hyderabad May Centrum Phase 1, Gurgaon NCR Jun Indiabulls Centrum Block 24 Ahmedabad Aug Indiabulls City, Sonepat NCR Sep MegaMall Phase 2, Vadodara Vadodara Nov Indiabulls Centrum C tower, Hyderabad Hyderabad Jan Indiabulls Greens Phase 1 LRH, Panvel Mumbai Mar ,942 Indiabulls Centrum Block 20, Ahmedabad Ahmedabad Apr Centrum Phase 2A, Gurgaon NCR Mar 15 to May Sky, Lower Parel Mumbai Jul Mega Mall, Jodhpur Jodhpur Aug Indiabulls Greens Phase 1 Sec 2,Sec 3, Panvel Mumbai Aug Centrum Phase 2B,3A, Gurgaon NCR Jun 15 to Aug Enigma Phase 1A (T A,E,F), Gurgaon NCR Aug 15 to Sep Indiabulls Golf City Phase 1A, Savroli Mumbai Oct Centrum Phase 3B, Gurgaon NCR Sep 15 to Nov Indiabulls Greens Phase 1 Sec 5, Panvel Mumbai Nov Enigma Phase 1A (T B,C,G,H,I,J), Gurgaon NCR Oct 15 to Dec Enigma Phase 2, Gurgaon NCR Mar Indiabulls Greens F2, Chennai Chennai May Indiabulls Greens Phase 1 Sec 4, Panvel Mumbai Jul ,342 Blu Tower A, Worli Mumbai Jul Blu Tower B,C, Worli Mumbai Oct Indiabulls Greens (D1,D2,D3,E1,E2,E3,E4,E5), Chennai Chennai Aug 16 to Oct One Indiabulls Vadodara Vadodara Dec Indiabulls Greens Phase 1 Sec 1, Panvel Mumbai Feb Sky Forest Tower, Lower Parel Mumbai Mar Indiabulls Greens (E6,F1), Chennai Chennai Feb 17 to Apr Sky Suites Tower, Lower Parel Mumbai Nov Total 14,890 Over 14,800 units to be handed over by
 = Rs 625 Cr Construction cost (including IDC and all fees) = Rs 1,200 Cr Cash")

10 Indiabulls Blu, Worli Project launched at Rs. 36,000 psft in June Already achieved residential sale rate of Rs. 66,158 psft. Office 250,000 sq ft x sale rate Rs 25,000 (already contracted) = Rs 625 Cr Construction cost (including IDC and all fees) = Rs 1,200 Cr Cash flow (after all costs) = Rs 4,800 Cr. Construction Status All approvals in place Construction is in full swing Complete civil construction by Dec 15 Shapoorji Pallonji has been awarded civil construction contract. 49% saleable area already sold in Blu Rs. 4,800 pre tax cashflows over next 3 years. 10
11 Key Projects New Launch Launch Pipeline for FY15 1. One Indiabulls Sec 104, Gurgaon lac sq ft of residential development Ultra premium residential township consisting of town houses, low rise apartments and high rise towers spread over 34 acres Gross development value of Rs. 3,710 Cr. 2. Indiabulls Mint Sec 104, Gurgaon Iconic commercial tower of 2.11 lac sq ft Gross development value of Rs. 189 Cr. 3. Indiabulls Imperial Sec 106, Gurgaon lac sq ft of commercial and residential development Integrated township with high end residential apartments, villa s, luxury retail and commercial spread over acres Gross development value of Rs. 2,903 Cr. 4. Indiabulls Commercial Centre Sec 109, Gurgaon 5.84 lac sq ft of commercial development Gross development value of Rs. 526 Cr. 5. Indiabulls Sierra, Vizag 7.86 lac sq ft of residential development 13 residential towers spread over 4.8 acres Gross development value of Rs. 252 Cr. 6. Indiabulls Kalina, Mumbai 2.12 lac sq ft of ultra premium residential development Gross development value of Rs. 585 Cr. 11
12 Debt Profile Rs in Cr Bank Debt March'14 December'13 March'13 Gross Debt 2,783 2,589 1,633 Net Debt* 2,414 2,113 1,195 * Net Debt = Gross Debt Cash and Cash Equivalents IBREL retains its A+ rating for long term debt and A1+ (highest possible) for short term debt. IBREL purchased the entire stake of FIM Ltd. and its affiliates for Rs. 1, Crores in 7 projects comprising area of acres in NCR and Chennai. Dividend distributed during FY is Rs. 4 per share totaling to Rs crores (including CDT thereof). During the FY this includes distribution of Interim dividend of Rs. 2 per share for Q4 FY and interim dividend of Re. 1 each for Q1 and Q2 of the current FY
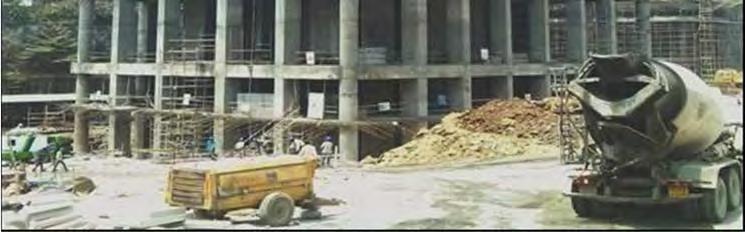
13 Project Progress Indiabulls Greens, Panvel 13
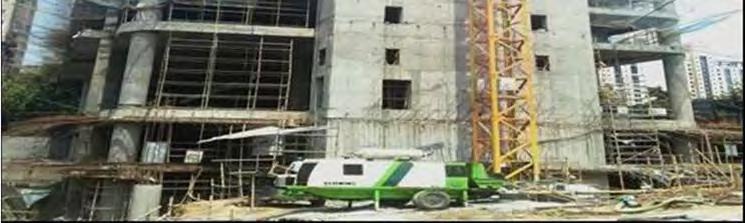
14 Project Progress Centrum Park Sec 103, Gurgaon 14
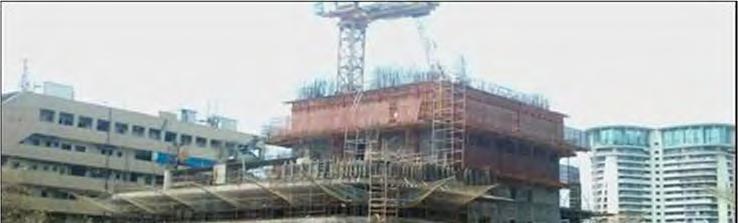
15 Project Progress Enigma Sec 110, Gurgaon 15
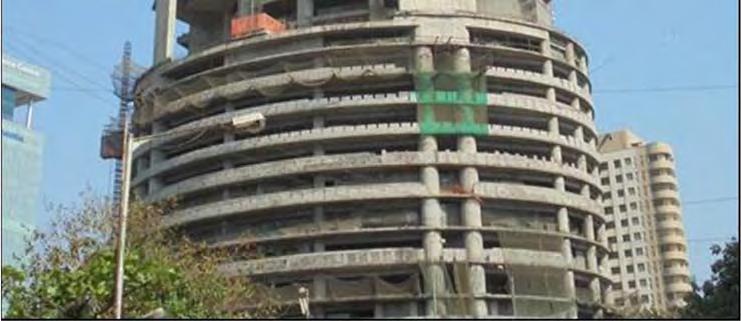
16 Project Progress Indiabulls Greens Phase 2, Chennai 16


17 Project Progress Tower - A Tower - B Tower - C Indiabulls Blu, Worli Tower - D 17
18 Project Progress Golf City, Savroli 18
19 Project Progress Sky Forest, Mumbai 19


20 Project Progress Sky, Mumbai 20
21 Consolidated Balance Sheet Statement of Assets and Liabilities (Consolidated) (Rs. Crore) Particulars As at As at March 31, 2014 March 31, 2013 (Audited) (Audited) EQUITY AND LIABILITIES Shareholders' Fund Share Capital Reserves and Surplus 6, , , , Minority Interest Preference Share Capital of Subsidiary Companies Non Current Liabilities Non Current Borrow ings Term Loans / NCDs f rom Banks 2, Against OCDs/CCDs Deferred Tax Liabilities Other Long term liabilities Long-term provisions , , Curre nt Liabilitie s Short-term borrow ings Trade Payables Other current liabilities 3, , Short-term provisions , , TOTAL - EQUITY AND LIABILITIES 13, , ASSETS Non-current assets Fixed Assets Tangible assets Intangible assets Capital w ork in progress Non-current investments 5, , Deferred Tax Assets Long-term loans and advances Other non-current assets , , Current Assets Current Investments Inventories 4, , Trade Receivables 1, Cash and bank balances Short-term loans and advances 1, Other current assets , , TOTAL - ASSETS 13, ,
22 Consolidated Income Statement Statement of Profit & Loss (Consolidated) (Rs. Crore) Year ended Particulars (Audited) (Audited) 1 Income from Operations a) Net Sales/ Income from Operations 1, , b) Other Operating Income Total Income from Operations (Net) 1, , Expenses a) Cost of Land, Plots, Constructed Properties and Others b) Employee benefits expense c) Depreciation and Amortisation Expense d) Other Expenses Total expenses 1, Profit/(Loss) from Operations before Other Income, Finance Costs and Exceptional Items (1-2) Other Income Profit/(Loss) from ordinary activities before Finance Costs and Exceptional Items (3+4) Finance Costs Profit/(Loss) from Ordinary Activities after Finance Costs but before Exceptional Items (5-6) Exceptional items Profit/(Loss) from Ordinary Activities before tax (7-8) Tax expense (Including Deferred Tax) Net Profit/(Loss) from Ordinary Activities after tax (9-10) Extraordinary Items (net of tax expense Rs. Nil) Net Profit/(Loss) for the period / year (11-12) Share of Profit/(Loss) of Associates (27.80) (19.53) 15 Minority Interest Net Profit after Taxes, Minority Interest and Share of Profit / (Loss) of Associates ( ) Paid-up Equity Share Capital (Face Value of Rs.2 per Equity Share) Reserves excluding Revaluation Reserves as per Balance Sheet of previous accounting year 6, , Earnings per Share before extraordinary items (Face Value of Rs.2 per Equity Share) (EPS for the quarter is not annualised) -Basic (Rs) Diluted (Rs) Earnings per Share after extraordinary items (Face Value of Rs.2 per Equity Share) (EPS for the quarter is not annualised) -Basic (Rs) Diluted (Rs)
23 Thank You 23
DLF Ltd. Q1 Analyst Presentation
 DLF Ltd. Q1 Analyst Presentation 1 Results at a Glance Q1 Sl.No. Consolidated Financials 1Q FY08 Rs. In Crores A) 1 Sales and Other Receipts 3074 2 Other Income 47 Percentage of Total Revenue Margins(%)
JET AIRWAYS (I) LTD. Presentation on Financial Results Q3 2012
 LTD. Presentation on Financial Results Q3 2012") JET AIRWAYS (I) LTD Presentation on Financial Results Q3 2012 20.01.2012 1 1 1 Domestic operating environment 2 2 2 Domestic industry. 8.00 7.00 6.00 5.00 4.00 3.00 Q3 12 vs Q3 11 Industry capacity 17%
JET AIRWAYS (I) LTD Presentation on Financial Results Q3 2012 20.01.2012 1 1 1 Domestic operating environment 2 2 2 Domestic industry. 8.00 7.00 6.00 5.00 4.00 3.00 Q3 12 vs Q3 11 Industry capacity 17%
JET AIRWAYS (I) LTD. Presentation on Financial Results Q July 24, 2009
 LTD. Presentation on Financial Results Q July 24, 2009") JET AIRWAYS (I) LTD Presentation on Financial Results Q1 2010 July 24, 2009 1 1 1 Agenda Domestic operating environment Jet Airways performance highlights JetLite performance highlights Outlook 2 2 2 Domestic
JET AIRWAYS (I) LTD Presentation on Financial Results Q1 2010 July 24, 2009 1 1 1 Agenda Domestic operating environment Jet Airways performance highlights JetLite performance highlights Outlook 2 2 2 Domestic
Presentation on Results for the 2nd Quarter FY Idemitsu Kosan Co.,Ltd. November 14, 2018
 Presentation on Results for the 2nd Quarter FY 2018 Idemitsu Kosan Co.,Ltd. November 14, 2018 Table of Contents 1. FY 2018 2nd Quarter Financials (1) Overview (2) Segment Information 2. Reference Materials
Brigade Group. Investor Presentation Q2 FY
 Brigade Group Investor Presentation Q2 FY 2014 15 Q2 FY 15 Key Highlights Standalone Q2 FY 2014 15 Revenue of Rs. 3.29 Bn (82% Y o Y increase) and PAT of Rs. 0.22 Bn (13% Y o Y increase) Standalone YTD
JET AIRWAYS (I) LTD. Presentation on Financial Results Q2 FY10
 LTD. Presentation on Financial Results Q2 FY10") JET AIRWAYS (I) LTD Presentation on Financial Results Q2 FY10 October 27, 2009 1 1 1 Agenda Domestic operating environment Jet Airways performance highlights JetLite performance highlights Outlook 2 2
JET AIRWAYS (I) LTD Presentation on Financial Results Q2 FY10 October 27, 2009 1 1 1 Agenda Domestic operating environment Jet Airways performance highlights JetLite performance highlights Outlook 2 2
Q4 & FULL YEAR FY15 RESULTS UPDATE MAY 2015
 Q4 & FULL YEAR FY15 RESULTS UPDATE MAY 2015 DISCUSSION SUMMARY Q4 & FY15 RESULTS HIGHLIGHTS OUR PORTFOLIO UPDATE AMUSEMENT PARK, BANGALORE RESORT, BANGALORE AMUSEMENT PARK, KOCHI AMUSEMENT PARK, HYDERABAD
DLF Limited. Q2 Analyst Presentation
 DLF Limited Q2 Analyst Presentation 1 Results at a Glance Q2 Q2 FY08 Percentage Sl.No. Consolidated Financials Rs. Crs. of Total Revenue Rs. Crs A) 1 Sales and Other Receipts 3,250 3,074 2 Other Income
JET AIRWAYS (I) LTD. Presentation on Financial Results Q4 FY08
 LTD. Presentation on Financial Results Q4 FY08") JET AIRWAYS (I) LTD Presentation on Financial Results Q4 FY08 June 24, 2008 1 1 1 Agenda Domestic operating environment Jet Airways performance highlights JetLite performance highlights Consolidated Jet
JET AIRWAYS (I) LTD Presentation on Financial Results Q4 FY08 June 24, 2008 1 1 1 Agenda Domestic operating environment Jet Airways performance highlights JetLite performance highlights Consolidated Jet
Presentation on Results for the 1st Quarter FY Idemitsu Kosan Co.,Ltd. August 14, 2017
 Presentation on Results for the 1st Quarter FY 2017 Idemitsu Kosan Co.,Ltd. August 14, 2017 Table of Contents 1. FY 2017 1st Quarter Financials (1) Overview (2) Segment Information 2. Reference Materials
Jet Airways (India) Ltd. Presentation on Annual Results FY06. May 2006
 Ltd. Presentation on Annual Results FY06. May 2006") Jet Airways (India) Ltd. Presentation on Annual Results FY06 May 2006 1 Agenda 1. Performance Highlights 2. Sahara Acquisition Update 3. Outlook 2 Performance Highlights 3 Domestic landscape capacity growth
Jet Airways (India) Ltd. Presentation on Annual Results FY06 May 2006 1 Agenda 1. Performance Highlights 2. Sahara Acquisition Update 3. Outlook 2 Performance Highlights 3 Domestic landscape capacity growth
Presentation on Results for the 2nd Quarter FY Idemitsu Kosan Co.,Ltd. November 1, 2016
 Presentation on Results for the 2nd Quarter FY 2016 Idemitsu Kosan Co.,Ltd. November 1, 2016 Table of Contents 1. 2nd Quarter FY 2016 Financials (1) Overview (2) Segment Information 2. Reference Materials
Financial Results Q1 FY September 2017
 Financial Results Q1 FY18 12 September 2017 2 Key Highlights Q1FY18 Net profit after tax of INR 58cr Ninth successive profitable quarter for the Group Gross debt reduced by INR 398cr and net debt almost
PRELIMINARY ACCOUNTS FOR 2012
 INTERIM REPORT FOR Q4 2012 AND INTERIM REPORT FOR Q4 2012 AND PRELIMINARY ACCOUNTS FOR 2012 HIGHLIGHTS Q4 with growth in volume and improved normalized EBITDA MNOK 261 improvement in normalized EBITDA
Presentation on Results for the 3rd Quarter FY Idemitsu Kosan Co.,Ltd. February 14, 2019
 Presentation on Results for the 3rd Quarter FY 2018 Idemitsu Kosan Co.,Ltd. February 14, 2019 Table of Contents 1. FY 2018 3rd Quarter Results (1) Overview (2) Segment Information 2. Forecast for FY 2018
31 December 2006 Half Year Results Announcement to the ASX. Regional Express Holdings Limited. ACN (ASX Code: Rex)
") 31 December 2006 Half Year Results Announcement to the ASX ACN 099 547 270 (ASX Code: Rex) ASX APPENDIX 4D Results for announcement to the market 31 Dec 2006 31 Dec 2005 Change Change $m $m $m % Revenue
31 December 2006 Half Year Results Announcement to the ASX ACN 099 547 270 (ASX Code: Rex) ASX APPENDIX 4D Results for announcement to the market 31 Dec 2006 31 Dec 2005 Change Change $m $m $m % Revenue
Interim Report 3m Bilfinger Berger SE, Mannheim May 10, 2012 Joachim Müller, CFO
 Interim Report 3m 2012 Bilfinger Berger SE, Mannheim May 10, 2012 Joachim Müller, CFO Bilfinger Berger SE Interim report 3m 2012 May 10, 2012 Page 1 3m 2012: Highlights Growth in output volume and orders
INVESTOR PRESENTATION DECEMBER 2013
 INVESTOR PRESENTATION DECEMBER 2013 Particulars Q3-14 Q2-14 Q3-13 YTD Q3 14 YTD Q3 13 Rs. Mn Rs. Mn Rs. Mn Rs. Mn Rs. Mn Q3 14 on Q2 14 YTD Q3 Q3 14 14 on on Q3 13 YTD Q3 13 Turnover 1,835 1,808 1,591
Cairo, May 21, TMG Holding reports EGP BN consolidated revenue, EGP 161 MN consolidated net profit
 First Quarter ending Earning Release Cairo, May 21, - reports EGP 1.139 BN consolidated revenue, EGP 161 MN consolidated net profit after minority and EGP 2.2 BN of new sales value for the first quarter
PROPINSIGHT A Detailed Property Analysis Report
 PROPINSIGHT A Detailed Property Analysis Report 40,000+ Projects 10,000+ Builders 1,200+ Localities Report Created On - 7 Oct, 2015 Price Insight This section aims to show the detailed price of a project
FIRST QUARTER RESULTS 2017
 FIRST QUARTER RESULTS 2017 KEY RESULTS In the 1Q17 Interjet total revenues added $4,421.5 million pesos that represented an increase of 14.8% over the income generated in the 1Q16. In the 1Q17, operating
Brigade Group Investor Presentation Q1 FY
 Brigade Group Investor Presentation Q1 FY 2015 16 (CIN: L85110KA1995PLC019126) Q1 FY 16 Key Highlights Consolidated Q1 FY 2015 16 Revenue was Rs. 3,537 Mn (83% increase over Q1 FY15; 9% decrease over Q4
PROPINSIGHT A Detailed Property Analysis Report
 PROPINSIGHT A Detailed Property Analysis Report 40,000+ Projects 10,000+ Builders 1,200+ Localities Report Created On - 17 Aug, 2016 Price Insight This section aims to show the detailed price of a project
MGM Resorts International Reports Second Quarter Financial Results
 NEWS RELEASE MGM Resorts International Reports Second Quarter Financial Results 8/5/2014 Consolidated Adjusted EBITDA Increased 8%, Led By 10% Growth In Wholly Owned Domestic Resorts MGM China Declares
Cairo, November 15, 2016 TMG holding reports EGP 3.9 BN consolidated revenues, EGP 616 MN consolidated net profit
 Nine Months and Third Quarter ending September 30, Earning Release Cairo, November 15, TMG holding reports EGP 3.9 BN consolidated revenues, EGP 616 MN consolidated net profit after minority and EGP 5.5
PROPINSIGHT A Detailed Property Analysis Report
 PROPINSIGHT A Detailed Property Analysis Report 40,000+ Projects 10,000+ Builders 1,200+ Localities Report Created On - 7 Oct, 2015 Price Insight This section aims to show the detailed price of a project
Highlights from the Annual Results December 2007
 Highlights from the Annual Results December 2007 Disclaimer The information in this document is taken from the BAA 2007 Annual Results ( the Results ) which were published on 11 March 2008 and other public
Jet Airways (India) Ltd. Presentation on Financial Results Q3 FY th January 2008
 Ltd. Presentation on Financial Results Q3 FY th January 2008") Jet Airways (India) Ltd. Presentation on Financial Results Q3 FY08 28 th January 2008 1 1 1 Agenda Performance highlights Q3 FY08 Apr - Dec FY08 Outlook JetLite performance highlights 2 2 2 Performance
Jet Airways (India) Ltd. Presentation on Financial Results Q3 FY08 28 th January 2008 1 1 1 Agenda Performance highlights Q3 FY08 Apr - Dec FY08 Outlook JetLite performance highlights 2 2 2 Performance
January 2018 Air Traffic Activity Summary
 January 2018 Air Traffic Activity Summary Jan-2018 Jan-2017 CY-2018 CY-2017 Passengers 528,947 505,421 4.7% 528,947 505,421 4.7% Passengers 537,332 515,787 4.2% 537,332 515,787 4.2% Passengers 1,066,279
Management Presentation. March 2016
 Management Presentation March 2016 Forward looking statements This presentation as well as oral statements made by officers or directors of Allegiant Travel Company, its advisors and affiliates (collectively
Golden Ocean Group Limited Q results March 1, 2007
 Golden Ocean Group Limited Q4 2006 results March 1, 2007 PROFIT & LOSS 2005 2006 (in thousands of $) 2006 2005 Oct-Dec Oct-Dec Jan - Dec Jan - Dec Operating Revenues 37 292 91 253 Time charter revenues
Presentation on Results for the 3rd Quarter FY Idemitsu Kosan Co.,Ltd. February 14, 2018
 Presentation on Results for the 3rd Quarter FY 2017 Idemitsu Kosan Co.,Ltd. February 14, 2018 Table of Contents 1. FY 2017 3rd Quarter Results (1) Overview (2) Segment Information 2. Forecast for FY2017
Air China Limited Annual Results. March Under IFRS
 Air China Limited 21 Annual Results Under IFRS March 211 Agenda Part 1 Highlights Part 2 Business Overview Part 3 Financial Overview Part 4 Outlook 2 Part 1 Highlights Steady Economic Growth; Asia Pacific
Talaat Moustafa Group Holding 1Q08 Results Earnings Release
 Talaat Moustafa Group Holding Results Earnings Release Cairo, April 13 th 08 Talaat Moustafa Group Holding ( TMG Holding ) the leading Egyptian community real estate developer with over years of experience,
--- Disclosure A uirements) A~ulatlons October 24, 2018 IGAUSECT / /1 0
 A~ulatlons October 24, 2018 IGAUSECT / /1 0") October 24, 2018 IGAUSECT /1 0-1 8/1 0 To National Stock Exchange of India limited Exchange Plaza, C - 1, Block G Sandra Kurla Complex Sandra - (E) Mumbai - 400 051 Symbol: INDIGO To Department of Corporate
October 24, 2018 IGAUSECT /1 0-1 8/1 0 To National Stock Exchange of India limited Exchange Plaza, C - 1, Block G Sandra Kurla Complex Sandra - (E) Mumbai - 400 051 Symbol: INDIGO To Department of Corporate
Nicco Parks & Resorts Ltd BSE Scrip Code:
 Nicco Parks & Resorts Ltd BSE Scrip Code: 526721 Other Leisure Facilities September 14, 2012 Equity Statistics Current Market Price Rs. 15.9 52 Week High / Low Rs. 24.4/15.2 Market Capitalisation Rs. crores
INVESTOR PRESENTATION. 3 Oct 2018
 INVESTOR PRESENTATION 3 Oct 2018 DISCLAIMER This presentation should be read in conjunction with the unaudited second quarter financial statements of Far East Orchard Limited ( FEOrchard ) for the period
Interim Report 6m 2014
 August 11, 2014 Interim Report 6m 2014 Investors and Analysts Conference Call on August 11, 2014 Joachim Müller, CFO Latest ad-hoc release (August 4, 2014) Reduction of forecast, primarily due to a further
Minor International Public Company Limited
 Minor International Public Company Limited Management Discussion & Analysis MINT s financial performance as of 30th June 2008 Summary of Key Financial Performance 2Q08 Performance Minor International Public
Financial Results Q3 FY16
 Financial Results Q3 FY16 6 February 2016 Agenda Key performance highlights Jet Airways performance highlights JetLite performance highlights 2 Key highlights Highest ever quarterly and period profit Jet
Presentation on Results for the 3rd Quarter FY Idemitsu Kosan Co.,Ltd. February 2, 2016
 Presentation on Results for the 3rd Quarter FY 2015 Idemitsu Kosan Co.,Ltd. February 2, 2016 Table of Contents 1. 3 rd Quarter FY 2015 Financials (1) Overview (2) Segment Information 2. Forecast for FY
Oxley Delivers Stellar Growth of 58% in PATMI to. S$130.9 million for HY2017
 For immediate release Oxley Delivers Stellar Growth of 58% in PATMI to S$130.9 million for HY2017 - Half-year revenue increased by 19% year-on-year to S$732.2 million - Gross profit margin increased from
Jet Airways (India) Ltd. Presentation on Financial Results Q2 FY th October 2007
 Ltd. Presentation on Financial Results Q2 FY th October 2007") Jet Airways (India) Ltd. Presentation on Financial Results Q2 FY08 29 th October 2007 1 1 1 Agenda Performance highlights Q2 FY08 HI FY08 Outlook JetLite performance highlights 2 2 2 Performance highlights
Jet Airways (India) Ltd. Presentation on Financial Results Q2 FY08 29 th October 2007 1 1 1 Agenda Performance highlights Q2 FY08 HI FY08 Outlook JetLite performance highlights 2 2 2 Performance highlights
Consolidated Statement of Financial Position as at December 31, 2017
 86 Key Figures Consolidated Statement of Financial Position as at December 31, 2017 Assets in million December 31, 2017 December 31, 2016 Non-current assets Goodwill 19.3 19.3 Investments in airport operating
Investor update presentation. November 2016
 Investor update presentation November 2016 Content Update on Q3 2016 financial performance 3-8 Recap on ATG Evolution 9-10 Update on hospitality strategic business unit 11-14 Update on online travel and
HATTEN LAND LIMITED. Shaping the Future, Melaka and Beyond. FY2017 Results. Corporate Presentation 17 August 2017
 HATTEN LAND LIMITED Shaping the Future, Melaka and Beyond FY2017 Results Corporate Presentation 17 August 2017 Disclaimer Information in this presentation may contain forward-looking statements that reflect
3rd Quarter Result for Fiscal year ending February 29, 2016
 Last updated: January 12, 2016 3rd Quarter Result for Fiscal year ending February 29, 2016 January 12, 2016 Gulliver International Co., Ltd. (7599) Contents Ⅰ. 3rd Quarter Result for FY 2016 Ⅱ. Status
Financial Results Q3FY February
 Financial Results Q3FY18 14 February Key Highlights Q3FY18 Net profit after tax of INR 186cr Eleven successive profitable quarters for the Group Operating revenue increased by 10.2% and PLF% by 4.4pts
Cathay Pacific Airways Interim Results for the six months ended 30 June 2012
 Cathay Pacific Airways Interim Results for the six months ended 30 June 2012 8 August 2012 1 Interim Result 1H2012 1H2011 Change Group attributable (loss) / profit HK$ million (935) 2,808-133.3% Group
Fourth Quarter and Full Year 2009
 Investor and analyst meeting: Fourth Quarter and Full Year 29 25 th February 21 2 The views expressed here contain some information derived from publicly available sources that have not been independently
Management Presentation. November 2011
 Management Presentation November 2011 Forward looking statements This presentation as well as oral statements made by officers or directors of Allegiant Travel Company, its advisors and affiliates (collectively
KSH HOLDINGS LIMITED. Corporate Presentation May 27, 2014
 KSH HOLDINGS LIMITED Corporate Presentation May 27, 2014 KSH Corporate Presentation OVERVIEW KSH Holdings Limited RESULTS FY2014 UPDATES Corporate Developments OUTLOOK Strategies Moving Forward CONCLUSION
Summary of Results for the First Three Quarters FY2015/3
 Summary of Results for the First Three Quarters FY2015/3 February 10, 2015 Tokyu Corporation (9005) http://www.tokyu.co.jp/ Contents Ⅰ.Executive Summary 2 Ⅱ.Conditions in Each Business 5 Ⅲ.Details of Financial
Financial Results Q3 FY February 2016
 Financial Results Q3 FY17 03 February 2016 2 Agenda Key performance highlights Jet Airways performance highlights 3 Key highlights Net profit after tax of INR 156.3 crores - Seventh successive profitable
More cruise nights and marginally improved result
 INTERIM REPORT FOR Q1 2011 HIGHLIGHTS More cruise nights and marginally improved result Pre-tax result improved by NOK 7 million from Q1 2010 8.6% more cruise nights improved the capacity utilization to
Interim Results for the Six Months ended 28 February 2017
 Interim Results for the Six Months ended 28 February 2017 The Group is pleased to announce its interim results for the six months ended 28 February 2017. Formation Group is focused solely on property development
Preliminary Figures FY 2016
 February 14, 2017 Preliminary Figures FY 2016 Capital Markets Day 2017 Tom Blades (CEO) Disclaimer This presentation has been produced for support of oral information purposes only and contains forwardlooking
PROPINSIGHT A Detailed Property Analysis Report
 PROPINSIGHT A Detailed Property Analysis Report 40,000+ Projects 10,000+ Builders 1,200+ Localities Report Created On - 7 Oct, 2015 Price Insight This section aims to show the detailed price of a project
Tiger Airways Holdings Limited FY11 Results
 Tiger Airways Holdings Limited FY11 Results May 2011 Financial Year Ended 31 March 2011 Disclaimer The information contained in this presentation (the "Information") is provided by Tiger Airways Holdings
Financial Results Q2 FY November 2016
 Financial Results Q2 FY17 11 November 2016 2 Agenda Key performance highlights Jet Airways performance highlights 3 Key highlights Net profit after tax of INR 84.9 crores - Sixth successive profitable
Management Presentation. September 2011
 Management Presentation September 2011 Forward looking statements This presentation as well as oral statements made by officers or directors of Allegiant Travel Company, its advisors and affiliates (collectively
SET Opportunity Day #3/2011
 SET Opportunity Day #3/2011 2Q11 & 1H11 Performance & Outlook 18 August 2011 The views expressed here contain some information derived from publicly available sources that have not been independently verified.
PROPINSIGHT A Detailed Property Analysis Report
 PROPINSIGHT A Detailed Property Analysis Report 40,000+ Projects 10,000+ Builders 1,200+ Localities Report Created On - 7 Oct, 2015 Price Insight This section aims to show the detailed price of a project
ERW. 022/ ACC003/ th February Subject: Management's Discussion and Analysis period ending 31 st December 2012
 ERW. 022/ ACC003/56 26 th February 2013 Subject: Management's Discussion and Analysis period ending 31 st December 2012 Attention: The President, The Stock Exchange of Thailand Dear Sir, The Erawan Group
The Property Franchise Group
 The Property Franchise Group Capital Markets Event 22 October 2015 This afternoon s agenda 2 15:15 Welcome Richard Martin, Chairman 15:20 Introduction to MartinCo PLC Ian Wilson, Chief Executive Officer
JET AIRWAYS (I) LTD. Financial Results Q1 FY09
 LTD. Financial Results Q1 FY09") JET AIRWAYS (I) LTD Presentation on Financial Results Q1 FY09 July 29, 2008 1 1 1 Agenda Domestic operating environment Jet Airways performance highlights JetLite performance highlights Outlook 2 2 2 Domestic
JET AIRWAYS (I) LTD Presentation on Financial Results Q1 FY09 July 29, 2008 1 1 1 Agenda Domestic operating environment Jet Airways performance highlights JetLite performance highlights Outlook 2 2 2 Domestic
PROPINSIGHT A Detailed Property Analysis Report
 PROPINSIGHT A Detailed Property Analysis Report 40,000+ Projects 10,000+ Builders 1,200+ Localities Report Created On - 7 Oct, 2015 Price Insight This section aims to show the detailed price of a project
Financial Results Q2 FY December 2017
 Financial Results Q2 FY18 07 December 2017 2 Key Highlights Q2FY18 Net profit after tax of INR 71cr Ten successive profitable quarters for the Group Net debt reduced during the quarter by INR 194cr Continued
Management Presentation. May 2013
 Management Presentation May 2013 Forward looking statements This presentation as well as oral statements made by officers or directors of Allegiant Travel Company, its advisors and affiliates (collectively
PROPINSIGHT A Detailed Property Analysis Report
 PROPINSIGHT A Detailed Property Analysis Report 40,000+ Projects 10,000+ Builders 1,200+ Localities Report Created On - 7 Oct, 2015 Price Insight This section aims to show the detailed price of a project
Financial Results Q2 FY December 2017
 Financial Results Q2 FY18 07 December 2017 2 Key Highlights Q2FY18 Net profit after tax of INR 71cr Ten successive profitable quarters for the Group Net debt reduced during the quarter by INR 194cr Continued
Q3 & 9M FY16 RESULT UPDATE FEBRUARY 2016
 Q3 & 9M FY16 RESULT UPDATE FEBRUARY 2016 GLOBAL RANKING AND RECOGNITION Wonderla parks were ranked at #1 and #2 in India by Tripadvisor for 2015. Wonderla parks were ranked at #7 and #9 in Asia by TripAdvisor
Key Highlights Q4FY18
 Key Highlights Q4FY18 Net loss after tax of INR 1,040cr Q4FY18 results adversely impacted on account of: Year-on-Year impact of increase in fuel prices of INR 366 crores; Mark-to-market adjustment due
BANYAN TREE HOLDINGS LIMITED (Company Registration Number: H) 1H07 Results Snapshot (in S$million) : 2Q07 Results Snapshot (in S$million) :
 1H07 Results Snapshot (in S$million) : 2Q07 Results Snapshot (in S$million) :") BANYAN TREE HOLDINGS LIMITED (Company Registration Number: 200003108H) BANYAN TREE S HALF YEAR PROFITS UP 55% ON 23% REVENUE GAIN. Highlights: - 1H07 Revenue increased by 23% to S$187.9 million - 1H07
BANYAN TREE HOLDINGS LIMITED (Company Registration Number: 200003108H) BANYAN TREE S HALF YEAR PROFITS UP 55% ON 23% REVENUE GAIN. Highlights: - 1H07 Revenue increased by 23% to S$187.9 million - 1H07
PROPINSIGHT A Detailed Property Analysis Report
 PROPINSIGHT A Detailed Property Analysis Report 40,000+ Projects 10,000+ Builders 1,200+ Localities Report Created On - 17 Aug, 2016 Price Insight This section aims to show the detailed price of a project
GMR Infrastructure Limited, Q1-FY 11 Performance Highlights. Financial Highlights for Q (Rs. Cr.)
") Press release Bangalore, 08 th Aug, 2010 GMR Infrastructure Limited, Q1-FY 11 Performance Highlights Financial Highlights for Q1 2010-11 (Rs. Cr.) Particulars 30th June 10 30th June 09 % change 31st March
Press release Bangalore, 08 th Aug, 2010 GMR Infrastructure Limited, Q1-FY 11 Performance Highlights Financial Highlights for Q1 2010-11 (Rs. Cr.) Particulars 30th June 10 30th June 09 % change 31st March
Executive Directors Review
 Financial Summary Turnover for the year ended 31 December 2011 amounted to HK$571.4 million ( 47.6 million) (2010: HK$706.8 million ( 58.7 million)). The turnover was principally attributable to the recognition
Brigade Group Investor Presentation Q4 FY
 Brigade Group Investor Presentation Q4 FY 2014 15 (CIN: L85110KA1995PLC019126) Q4 FY 15 Key Highlights Consolidated FY 2014 15 Revenue of Rs. 13.31 Bn (38% Y o Y increase) and PAT of Rs. 1.15 Bn (29% Y
PLC. IFRS Summary Financial Statement (excluding Directors Report and Directors Remuneration Report) Year ended November 30, 2006
 Year ended November 30, 2006") C A R N I V A L PLC IFRS Summary Financial Statement (excluding Directors Report and Directors Remuneration Report) Year ended November 30, 2006 Registered number: 4039524 The standalone Carnival plc consolidated
C A R N I V A L PLC IFRS Summary Financial Statement (excluding Directors Report and Directors Remuneration Report) Year ended November 30, 2006 Registered number: 4039524 The standalone Carnival plc consolidated
M2 Group Ltd 2014 Interim Results
 M2 Group Ltd 2014 Interim Results 24 February 2014 Geoff Horth, CEO Presentation Content Record Financial Performance Strong Organic Growth FY14 Priorities and Guidance Slide 2, 24 February 2014 Record
PROPINSIGHT A Detailed Property Analysis Report
 PROPINSIGHT A Detailed Property Analysis Report 40,000+ Projects 10,000+ Builders 1,200+ Localities Report Created On - 7 Oct, 2015 Price Insight This section aims to show the detailed price of a project
FOURTH QUARTER RESULTS 2017
 FOURTH QUARTER RESULTS 2017 KEY RESULTS In the 4Q17 Interjet total revenues added $5,824.8 million pesos that represented an increase of 10.8% over the revenue generated in the 4Q16. In the 4Q17, operating
Year ended December 31, 2012
 Consolidated Earnings Report - Supplementary Information Consolidated Results ( ) 1. Consolidated Financial Highlights 2. Major Sales Sales Volume Data 3. Condensed Consolidated Statements of Income Condensed
SAS AB Analyst meeting
 SAS AB Analyst meeting London, August 9, 2001 2 2nd Quarter a tough Quarter The Marketplace Continued weak world economy Weaker Swedish economy SAS Weaker traffic growth and reduced passenger load factors
Melco International Development Limited (Incorporated in Hong Kong with limited liability) Website : (Stock Code : 200)
 Website : (Stock Code : 200)") Hong Kong Exchanges and Clearing Limited and The Stock Exchange of Hong Kong Limited take no responsibility for the contents of this announcement, make no representation as to its accuracy or completeness
Hong Kong Exchanges and Clearing Limited and The Stock Exchange of Hong Kong Limited take no responsibility for the contents of this announcement, make no representation as to its accuracy or completeness
Copa Holdings Reports Net Income of $136.5 million and EPS of $3.22 for the First Quarter of 2018
 Copa Holdings Reports Net Income of $136.5 million and EPS of $3.22 for the First Quarter of 2018 May 9, 2018 PANAMA CITY, May 9, 2018 /PRNewswire/ -- Copa Holdings, S.A. (NYSE: CPA), today announced financial
Management Presentation. November 2018
 Management Presentation November 2018 Forward looking statements This presentation as well as oral statements made by officers or directors of Allegiant Travel Company, its advisors and affiliates (collectively
Summary of Results for the First Quarter of FY2015/3
 Summary of for the First Quarter of FY2015/3 August 8, 2014 Tokyu Corporation (9005) http://www.tokyu.co.jp/ Contents Ⅰ.Executive Summary 2 Ⅱ.Conditions in Each Business 4 Ⅲ.Details of Financial for the
Q2 & H1 FY17 RESULT UPDATE October 2016
 Q2 & H1 FY17 RESULT UPDATE October 2016 DISCUSSION SUMMARY Q2 & H1 FY17 RESULT HIGHLIGHTS Q2 & H1 FY17 PORTFOLIO UPDATE AMUSEMENT PARK, BANGALORE RESORT, BANGALORE AMUSEMENT PARK, KOCHI AMUSEMENT PARK,
Sunway berhad. Q Results Briefing Pack. 26 February 2016
 Sunway berhad Q4 2015 Results Briefing Pack 26 February 2016 1 Full Year Profitability Maintained Despite SunCon Dilution 1) Full Year Performance PATMI is maintained at RM732.4 million in 2015 (2014:
Melco International Development Limited (Incorporated in Hong Kong with limited liability) Website : (Stock Code : 200)
 Website : (Stock Code : 200)") Hong Kong Exchanges and Clearing Limited and The Stock Exchange of Hong Kong Limited take no responsibility for the contents of this announcement, make no representation as to its accuracy or completeness
Hong Kong Exchanges and Clearing Limited and The Stock Exchange of Hong Kong Limited take no responsibility for the contents of this announcement, make no representation as to its accuracy or completeness
GMR Infrastructure Limited (GIL) FY17 Performance Highlights
 FY17 Performance Highlights") GMR Infrastructure Limited (GIL) FY17 Performance Highlights Gross Debt comes down significantly to INR 19,856 Cr from INR 37,480 Cr Net Debt to EBITDA for FY 17 improves to 4.3 from 10.2 in FY 16 Stellar
GMR Infrastructure Limited (GIL) FY17 Performance Highlights Gross Debt comes down significantly to INR 19,856 Cr from INR 37,480 Cr Net Debt to EBITDA for FY 17 improves to 4.3 from 10.2 in FY 16 Stellar
FIRST QUARTER RESULTS 2016
 FIRST QUARTER RESULTS 2016 KEY RESULTS In 1Q16 Interjet total revenues added $3,850.8 million pesos that represented an increase of 21.9% over the income generated in the 1Q15. In 1Q16 total passengers
Fact Sheet for Q3 and January-September 2017 October 20, 2017
 Fact Sheet for Q3 and January-September 2017 October 20, 2017 Contents Daimler Group Stock Market Information 3 Earnings and Financial Situation 4-12 Information for Divisions Mercedes-Benz Cars 13-16
HATTEN LAND LIMITED. Shaping the Future, Melaka and Beyond. Corporate Presentation 12 October 2017
 HATTEN LAND LIMITED Shaping the Future, Melaka and Beyond Corporate Presentation 12 October 2017 Disclaimer Information in this presentation may contain forward-looking statements that reflect the current
PROPINSIGHT A Detailed Property Analysis Report
 PROPINSIGHT A Detailed Property Analysis Report 40,000+ Projects 10,000+ Builders 1,200+ Localities Report Created On - 7 Oct, 2015 Price Insight This section aims to show the detailed price of a project
JAPAN AIRLINES Co., Ltd. Financial Results 1 st Quarter Mar/2018(FY2017)
") JAPAN AIRLINES Co., Ltd. Financial Results Mar/2018(FY2017) July 31, 2017 Today s Topics P.1 P.2 P.3 P.4 P.6 P.15 Overview of Financial Results for (FY2017) 1 st quarter resulted in an increase in both
JAPAN AIRLINES Co., Ltd. Financial Results Mar/2018(FY2017) July 31, 2017 Today s Topics P.1 P.2 P.3 P.4 P.6 P.15 Overview of Financial Results for (FY2017) 1 st quarter resulted in an increase in both
Flughafen Wien Group Maintains Upward Trend: Passenger Growth and Strong Earnings Improvement in the First Nine Months of 2016
 Flughafen Wien Group Maintains Upward Trend: Passenger Growth and Strong Earnings Improvement in the First Nine Months of 2016 REVENUE increase to 545.4 million (+10.2%), EBITDA rise to 306.5 million (+13.1%
CROWN ANNOUNCES 2018 HALF YEAR RESULTS
 ASX / MEDIA RELEASE FOR IMMEDIATE RELEASE 22 February 2018 CROWN ANNOUNCES 2018 HALF YEAR RESULTS MELBOURNE: Crown Resorts Limited (ASX: CWN) ( Crown ) today announced its results for the half year ended
Copa Holdings Reports Record Earnings of US$41.8 Million for 4Q06 and US$134.2 Million for Full Year 2006
 Copa Holdings Reports Record Earnings of US$41.8 Million for 4Q06 and US$134.2 Million for Full Year 2006 Panama City, Panama --- March 7, 2007. Copa Holdings, S.A. (NYSE: CPA), parent company of Copa