New Zealand Tourism Market Outlook TOTAL EXP FORECAST TO GROW 65% OVER 7 YEARS
|
|
|
- Myron Young
- 5 years ago
- Views:
Transcription
1 FACT BOOK
2 TABLE OF CONTENTS FORECASTS... 1 OVERARCHING STRATEGY & OBJECTIVES PERFORMANCE YED MARCH WEST COAST TOURISM TOTAL EXPENITURE...21 DISTRICT PERFORMANCE BREAKDOWN WEST COAST WESTLAND GREY DISTRICT BULLER DISTRICT INTERNATIONAL EXPENDITURE DOMESTIC EXPENDITURE BACKPACKERS MARKET AIR B&B DOMESTIC VISITOR PROFILES
3 MARKET SHARES ACCOMMODATION ARRIVALS TRANSPORT & MOVEMENT EMPLOYMENT GDP EVENTS TARGET MARKETS MAXIMISING FROM CHINESE VISITORS GATEWAY REGIONS CYCLING/MOUNTAIN BIKE NZ MARKET RESEARCH WEST COAST WILDERNESS TRAIL ECONOMIC IMPACT OF WEST COAST WILDERNESS TRAIL SOCIAL FISHING
4 FORECASTS 1


5 New Zealand Tourism Market Outlook TOTAL EXP FORECAST TO GROW 65% OVER 7 YEARS 2

6 MINISTRY OF BUSINESS, INNOVATION & EMPLOYMENT New Zealand Tourism Forecasts Avg Spend up 7.5% Spend per day up 1.9% Total Visitor Days up 5.4% Length of stay up.3% Visitors up 5.4% Holiday Visitors up 66% 3
7 International tourism forecast - Total Visitor Arrivals (MBIE) 4
8 International tourism forecast - Avg length of stay (MBIE) 5
9 International tourism forecast - Total Visitor Spend (MBIE) China up 360% 6
10 TranzAlpine Forecast from Westbound TranzAlpine Eastbound TranzAlpine Chch to AHP Chch to GM GM to Chch AHP to Chch 60,000 50,000 Capacity constraint 50,000 45,000 40,000 40,000 35,000 30,000 30,000 25,000 20,000 20,000 15,000 10,000 10,000 5, Compound Growth : GM 2%, AHP 5.2% Share change : AHP grew from 21% to 35% Compound Growth : GM 1.5%, AHP 7.3% Share change : AHP grows from 35% to 45% Compound Growth : GM 3.75%, AHP 16.2% Share change : AHP grew from 15% to 22% Compound Growth : GM 1.5%, AHP 2.6% Share change : AHP grows from 22% to 43% 7 Source: TranzAlpine 2016
11 DISTRICT FORECAST Visitors District % Increase Share Westland % 60 55% Grey % 23-26% Buller % 17-19% Visitor: Total visitor numbers exceed 1m by 2018 and reach 1.2m by 2021 Nights Stay District % Increase Share Westland % 60-54% Grey % 23-26% Buller % 17-20% Nights: Grow from 1.9 nights to 2.6 by 2021 creating capacity issues in all districts in the peak December April period Tourism Expenditure District % Increase Share Westland % 64 58% Grey % 23-25% Buller % 13-17% Expenditure: Total expenditure reaches $810m by 2021 and exceeds $1billion by
12 DISTRICT FORECAST Employment FTE District % Increase Share Westland % 57-51% Grey % 30-33% Buller % 13-16% Employment: To year end March 2015 tourism was 14% of total West Coast employees equal with agriculture, forest and fishing. By March 2017 it had increased to 15.7% and expected to exceed 20% by Car/Campervan Movements District % Increase Westland % Grey % Buller % Movements: The growth of visitors to Hokitika Gorge, Punakaiki, Lake Brunner & Oparara Arches impacts on car movements North. GDP Contribution District % Increase Share Westland % 63-57% Grey % 21-23% Buller % 16-20% GDP: To March 2016 tourism represented 5.6% of total GDP and had risen to 6.9% March 2017 and is expected to exceed 10% by
13 Overarching Strategy & Objectives for the West Coast 10


14 OVERARCHING STRATEGY Satellite Icons for all Major icons/attractions Walking Tracks and Cycle Trails Regional Events/ Tactical Promotions 11
15 Objectives Summary Increase Visitor arrivals from 870,000 to 1.1 million (increase by 230,000 visitors) 1. Increase tourism expenditure from $470m to $810m (increase of $340m) 2. Increase visitor nights by increasing average length of stay from 2.0 to 2.7 (increase by 0.7) 3. Increase GDP contribution from $95m to $157m (increase by $62m) 4. Increase tourism employment from (increase of 516 jobs) Enablers DOC is a Key enabler of the Icon Development programme. Growth forecasts are dependent on the icons being developed on schedule Funding to develop and achieve the goals will be dependent on funds being made available by all relevant parties. 12
16 Visitors per Icon or Cycle ways/track Forecast Visitor Growth by Icon Buller Grey Westland Oparara Arches 20,000 66,837 P Punakaiki Pancake Rocks & Blow Holes 448, ,329 P P Lake Brunner 25,000 72,021 P Hokitika Gorge 40,000 76,252 P Glaciers Franz Josef & Fox Glacier 700, ,400 P Haast Te Wáhi Pounamu World Heritage Area 100, ,051 P Lake Brunner Cycle Track - 1,574 P Paparoa Track - 7,813 P P Heaphy Track 7,700 10,014 P Old Ghost Road 10,000 11,593 P W. Coast Wilderness Trail 8,000 20,736 P P TOTAL Visitors to Icons 1,358,700 1,824, Owner of the Asset underwrites the cost of repairs, maintenance and additional capital for upgrades 13

17 STRATEGY RATIONALE Each icon will be developed as a sub-brand of the new West Coast brand, creating an immediate and instantly recognisable link with the region. Each main icon will also have 5 or 6 satellite activities and attractions that further communicate the strengths of the area. This icon selection will help change the tourist flow - see before and after maps BEFORE AFTER Up to % of visitors only went to these two icons. Limiting overnight stays. By % of visitors only go to original icons as disbursement begins and encourages overnight stays. 14
18 PERFORMANCE YEAR ENDING MARCH
19 SUMMARY The TWC strategy and marketing plan was included in the MBIE sponsored growth study action plan. The contributions from central government agencies for the development or feasibility work on the strategy will enable TWC to continue making a positive contribution to the economic growth of the West Coast. The tourism strategy will be a major enabler for a change in social and cultural behaviour as the economy moves from a commodity focus to a service /added value economy, driven by the demands of 1.4m visitors verses a population of only 33,000. This change will not be without its challenges but will be a catalyst for the rise of bespoke businesses, new activities and greater marketing awareness. Any strategic or marketing plan has to be able to tell a story. The story enables visitors and locals to understand the vision so they can share and enjoy the experience. Business failures are in part due to a lack of branding not having the depth of story or essence to deliver on strategy. Failure to invest in telling the story and having consistency of message in the first few years of new products and services will ultimately determine outcomes. Tourism New Zealand forecast to 2022 indicates growth in visitors (up 5.4%) and expenditure (up 7.5%) and a marginal increase in 0.3%). In order for the west coast to achieve expenditure levels and GDP it must take market share from other regions notable Queenstown, Wanaka, Nelson and Tasman. Untamed Natural Wilderness reinforcing that the Coast can offer a unique and outstanding visitor experience. The message and story will be consistent, enabling community groups and promotional groups to grasp the opportunities such messages will bring. The understanding and therefore success comes from having a brand or banner that all Coasters can relate to irrespective of their location on the Coast and can be used in any business situation not just tourism. 16


20 BRAND DEVELOPMENT AND EXECUTION STRATEGY Values and Personality: Unique, rugged, wild, natural, untamed Reasons to Believe: This region of ours is a land of which we can be justifiably proud. No other region in NZ has such a concentrated wealth and diversity of Brand Essence: untamed natural scenic beauty Benefit: Sense of being and feeling of freedom, pioneering & being as one with nature Exploring & reliving how to enjoy nature feeling liberated from suburbia Challenging nature & experiencing how it was for the past pioneers & fortune hunters Discriminator: Experience an unforgettable journey from glaciers, along rugged coastlines, wild rivers and lakes, past natural rock formations to pristine beaches on the most scenic roads and cycle ways Insight: People who want to experience the scale, rugged and wild reality of what nature offers and how past pioneers and adventurers have attempted to tame it Winner of Best Practice Contribution to Local Economic Development - LGNZ Excellence Awards July 2017 Finalist in the Industry Alignment Award - New Zealand Tourism Industry Association Awards - September Competitive Environment: Primary: Queenstown, Wanaka, Canterbury, Fiordland Secondary Bay of Islands, Tasman, Taupo, Kaikoura Third Tier Other NZ, Pacific Islands, Australia Target Market: International adventurers that want to experience 100% Pure NZ. Walkers, hikers & bikers that want to experience the wilderness and nature at its best. Make coasters proud to live and work here. City Kiwis that want to experience how original and real NZ was the good old days
21 MARCH YEAR END IN REVIEW March 2016: A tourism fact book for operators was created for the period 2010/ 16. It identifies all tourism statistics in NZ, on the coast by district and industry. The fact book is updated every quarter and available on the West Coast website. May 2016: ulture and motivational shift within Tourism West Coast. Research acceptance was 91% (the highest Kevin Stratful has ever seen for any new brand) the new branding was tested in all languages to ensure consistency of translation. A brand guidelines book ensures consistency of logo and tagline delivery. June 2016: The West Coast Tourism Strategy was completed. It identifies the issues and created the action plan for growth and change. The strategy was approved by TNZ as being consistent with their own strategy. MBIE Growth Study Governance Group adopted the strategy August 2016 and it was included in the growth study report released September June 2016: TWC identified 6 promotional groups in line with the six icons to execute on the strategy reducing the number from 21. This had the effect of eliminating waste in the marketing spend and created more focus and consistency across branding and execution of strategy June 2016: First use of the logo for promotional purpose. It was used in moving billboards, domestic and international marketing and all Tourism West Coast literature. It has since been adopted by Buller District Council, West Coast Regional Council, more recently Development West Coast and Glacier Country. June 2016: Merchandising launched including T shirts, bags and insect repellent July 2016: The branding was introduced to all domestic and international tour operators with enthusiastic results. September/November 2016: The Visitor Guide layout was changed to incorporate the new branding and icon strategy for the West Coast. For the first time ever Tourism West Coast ran out of the 80,000 Visitor Guides printed within 6 months. January 2017: f the marketing plan has been included in the Growth Study documentation and is also available on the West Coast website. February 2017: The Impact of Tourism on districts from was completed and circulated to operators, the six promotional groups, and presentations made to each council and the mayors and chairs group. All costs to date have been paid from the WCED managers budget. There was no other funding made available for the changes. 18
22 PERFORMANCE REPORT WEST COAST YEAR END MARCH 2017 Action 2016 Actual 2017 Budget 2017 Actual Actual Year Budget Expenditure $469m $512m $522m +11.3% +2% Visitors % +7.9% Night Stay % -3.1% GDP $95m $108m $115m +21.1% +6.4% *Market Share % +0.3% ASB Ranking MBIE Ranking Employment FTE *1% Movement in South Island Market Share = $90m Expenditure and $18.9m GDP 19 Source: MBIE
23 TARGET YEAR END MARCH 2018 Target Increase *Expenditure $598.1m 14.5% Visitors % Night Stay % GDP $129m 9.1% Market Share 6.3% 0.8% ASB Ranking 7 +2 MBIE Rank 1 0 Employment FTE * As of June 2017 expenditure is $540m and run rate to date is +15% 20
24 West Coast Tourism TOTAL EXPENDITURE 21
25 April 2015 to April

26 Total Spend on the West Coast (MBIE) Westland - $340m Grey District - $115m Buller - $67m 2011: $367m 2013: $348m 2015: $418m 2017: $522m 2012: $333m : $370m 2016: $438m
27 District Performance Domestic Expenditure International Expenditure Total Expenditure yr 3yr yr 3yr yr 3yr Buller % -5.0% % 4.1% % -2.1% Grey % 0.2% % 6.6% % 2.2% Westland % -2.3% % 12.4% % 8.5% West Coast % -1.9% % 10.6% % 4.9% 24
28 Performance of West Coast to date South Island Tourism Expenditure +9.2% West Coast Tourism Expenditure +13.1% West Coast Tourism Share Up 0.4% 5.1% to 5.5% West Coast Tourism Expenditure Up $61m Increase expenditure from Market share growth $36m Market share gains are critical in order to increase bed nights and offset any declines in NZ tourism performance 59% of our expenditure growth has come from Market share gains Note: 1% Market Share of South Island Tourism Expenditure =$90.4m 25
29 DISTRICT PERFORMANCE BREAKDOWN 26
30 West Coast 27
31 DISTRICT PERFORMANCE REPORT YEAR END MARCH 2017 Action Westland % increase Grey % increase Buller % increase Expenditure $340m +11.4% $115m +9.5% $67m +17.5% Visitors % % % Nights Stay % % % GDP $71.4m +15.1% $24.1m +9% $19.3m +22.4% *Employment % % % Market Share % % % (West Coast Total) *Incomplete Data Best Estimate 28 Source MBIE
32 29 MRTE Insights Viewer
33 Total Visitor Arrivals West Coast Districts (StatisticsNZ) Axis Title Buller Grey Westland
34 Domestic VS International District Spend April 2016 March 2017 (MBIE) Buller International Buller Domestic Grey International Grey Domestic Westland International Westland Domestic
35 32 MRTE Insights Viewer
36 33 MRTE Insights Viewer
37 Australia Visitor Spend April 16 March 2017 (MBIE) Buller Grey Westland West Coast
38 Visits from all international Origins 35 Source: Regional economic Activity Report
39 Visitor nights from all international origins 36 Source: Regional economic Activity Report
40 180,000 Monthly Occupancy vs Capacity District & Total 160, , , ,000 80,000 60,000 40,000 20,000 0 W/C Monthly Capacity W/C occupancy Westland Capacity Westland occupancy Grey Capacity Grey occupancy Buller Capacity Buller occupancy 37
41 Monthly Occupancy vs Capacity Districts Westland Capacity Westland occupancy Grey Capacity 38 Grey occupancy Buller Capacity Buller occupancy
42 Westland 39
43 40 MRTE Insights Viewer
44 Origin: Total Destination: WESTLAND - Tourism Expenditure MBIE $100m $90m $80m $70m $60m $50m $40m $30m $20m $10m $0m Accommodation services Cultural, recreation, and gambling services Food and beverage serving services Other passenger transport Other tourism products Retail sales - alcohol, food, and beverages Retail sales - fuel and other automotive products Retail sales - other
45 TOURISM SPEND IN WESTLAND Spend $Millions International Domestic Total 42
46 40 Domestic Spend By Product Westland (MBIE) Grouped by Product $ Spend Millions Food & Beverage services Other Passenger Transport Other Tourism Products Retail Sales - Other Accommodation Cultural, recreation & Gambling Retail Sales - Alcohol, Food & Bev Retail Sales - Fuel & Other Automotive
47 44 MRTE Insights Viewer
48 Origin: International Destination: Westland - Tourism Expenditure MBIE Accommodation services Cultural, recreation, and gambling services Food and beverage serving services Other passenger transport Other tourism products Retail sales - alcohol, food, and beverages Retail sales - fuel and other automotive products Retail sales - other
49 46 MRTE Insights Viewer
50 WESTLAND OCCUPANCY VS CAPACITY QUARTERLY MARCH 2015 MARCH Mar-15 Jun-15 Sep-15 Dec-15 Mar-16 Jun-16 Sep-16 Dec-16 Mar-17 Capicity Occ
51 $400m Westland Spend from Oct 2012 Oct 2016 $350m $300m $250m $200m $150m $100m $50m $0m Series1 $189m $196m $237m $268m $304m $340m 48
52 October Visitor Numbers & Visitor Nights International Domestic
53 Grey District 50

54 51 MRTE Insights Viewer
55 Origin: Total Destination: Grey District - Tourism Expenditure MBIE $35m $30m $25m $20m $15m $10m $5m $0m Accommodation services Cultural, recreation, and gambling services Food and beverage serving services Other passenger transport Other tourism products Retail sales - alcohol, food, and beverages Retail sales - fuel and other automotive products Retail sales - other 2012 $13m $3m $8m $15m $5m $12m $22m $20m 2013 $12m $3m $7m $13m $5m $12m $21m $18m 2014 $14m $3m $8m $18m $5m $12m $23m $19m 2015 $14m $3m $9m $17m $5m $13m $24m $19m 2016 $14m $3m $10m $16m $5m $14m $26m $19m 2017 $15m $3m $11m $16m $6m $14m $30m $20m 52
56 Grey District Tourism Expenditure to October Retail Sales: Fuel Accommodation Food & Beverage serving services Retail Sales: Alcohol,food & Beverage Source: MBIE (Data download RTE)
57 TOTAL SPEND GREY DISTRICT OCTOBER 2016 Total Spend Source: MBIE (Data download RTE)
58 Market Share Westland +28.3% - Increase Share to 64.2% West Coast Share Buller +13.6% - Increase Share to 14.5% West Coast Share West Coast +11% - Increase Share to 5.9% South Island Share Grey +8.5% - Decrease Share to 21.3% West Coast Share Accommodation Cultural F&B services Other Passenger Transport Other Tourism Product Alcohol, F&B Fuel Other Sales 55

59 250 Total Tourism Spend Grey District Total Total Spend Domestic International Source: MBIE/TWC forecast
60 GDP Margin Change Growth Driven by % Mix Change in 2020 Grey District Fuel 20 GDP Mix Change GDP Fuel Accommodation Retail Sales Food & Bev Source: MBIE/TWC forecast
61 Domestic Spend By Product Grey District(MBIE) Grouped by Product 14 $ Spend Millions Food & Beverage services Other Passenger Transport Other Tourism Products Retail Sales - Other Accommodation Cultural, recreation & Gambling Retail Sales - Alcohol, Food & Bev Retail Sales - Fuel & Other Automotive
62 59 MRTE Insights Viewer
63 TOURISM SPEND IN GREY District Spend $Millions International Domestic Total
64 Monthly Occupancy vs Capacity QUARTERLY MARCH 2015 MARCH 2017 Grey District 5,000 4,500 4,000 3,500 3,000 2,500 2,000 1,500 1, /03/ /06/ /09/ /12/ /03/ /06/ /09/ /12/ /03/2017 Monthly Capacity 4,369 4,083 4,089 4,366 4,361 4, Occupancy 2,123 1,239 1,472 2,065 2,268 1,
65 Origin: International Destination: Grey District - Tourism Expenditure MBIE Accommodation services Cultural, recreation, and gambling services Food and beverage serving services Other passenger transport Other tourism products Retail sales - alcohol, food, and beverages Retail sales - fuel and other automotive products Retail sales - other
66 63 MRTE Insights Viewer
67 October Visitor Numbers & Visitor Nights International 250, , , , , Grey Visitor number Grey Visitor nights 64
68 October Visitor Numbers & Visitor Nights Domestic Grey Visitor numbers Grey Vistor nights
69 Buller District 66
70 67 MRTE Insights Viewer
71 Origin: Total Destination: BULLER - Tourism Expenditure MBIE $25m $20m $15m $10m $5m $0m Accommodation services Cultural, recreation, and gambling services Food and beverage serving services Other passenger transport Other tourism products Retail sales - alcohol, food, and beverages Retail sales - fuel and other automotive products Retail sales - other 2012 $15m $1m $7m $5m $2m $8m $22m $4m 2013 $14m $1m $7m $12m $2m $8m $17m $5m 2014 $14m $2m $7m $3m $2m $9m $18m $5m 2015 $13m $2m $7m $3m $2m $9m $16m $5m 2016 $14m $2m $8m $1m $2m $10m $17m $5m 2017 $16m $2m $8m $3m $2m $11m $20m $6m 68
72 TOURISM SPEND IN BULLER Spend $Millions International Domestic Total
73 16 Domestic Spend By Product Buller(MBIE) Grouped by Product $ Spend Millions Food & Beverage services Other Passenger Transport Other Tourism Products Retail Sales - Other Accommodation Cultural, recreation & Gambling Retail Sales - Alcohol, Food & Bev Retail Sales - Fuel & Other Automotive
74 71 MRTE Insights Viewer
75 Origin: International Destination: BULLER - Tourism Expenditure MBIE Accommodation services Cultural, recreation, and gambling services Food and beverage serving services Other passenger transport Other tourism products Retail sales - alcohol, food, and beverages Retail sales - fuel and other automotive products Retail sales - other 72
76 73 MRTE Insights Viewer
77 October Visitor Numbers & Visitor Nights International 250, , , , , Buller Visitor numbers 74 Buller Visitor nights
78 October Visitor Numbers & Visitor Nights Domestic Buller Visitor numbers 75 Buller Visitor nights
79 $60,000,000 October Spend $50,000,000 $40,000,000 $30,000,000 $20,000,000 $10,000,000 $ Buller International $23,000,000 $29,000,000 $30,566,000 $32,216,564 $34,149, $36,198, $38,370, $40,672, $43,113, $45,699, Buller Domestic $36,000,000 $39,000,000 $40,092,000 $41,214,576 $42,451, $43,724, $45,036, $46,387, $47,778, $49,212, Buller International Buller Domestic
80 Monthly Occupancy vs Capacity QUARTERLY MARCH 2015 MARCH 2017 Buller District 45,000 40,000 35,000 30,000 25,000 20,000 15,000 10,000 5, /03/ /06/ /09/ /12/ /03/ /03/ /06/ /09/ /12/2016 Monthly Capacity 41,571 39,480 39,840 41,757 41,509 39,930 39, occupancy 16,418 4,674 6,223 14,764 18,273 5,946 7,
81 Buller Spend from Oct 2012 Oct 2016 $80m $70m $60m $50m $40m $30m $20m $10m $0m $65m $65m $58m $56m $59m $68m 78
82 GDP Margin Change Growth Driven by Domestic Mix Change in 2020 Buller District % GDP Retail Food & Bev GDP Fuel Accommodation Retail Food & Bev Source: MBIE/TWC forecast
83 Car & Campervan Movements Buller District Movements Nights Stay Source: NZTA/TWC forecast
84 International EXPENDITURE 81
85 Total NZ & West Coast International Spend April 16 March New Zealand 82 West Coast
86 International Spend increase/decrease % on the West Coast by Product 2016/17 (MBIE) 6.7% 29% 23% 20% -17.9% 31% -4% 25% 83
87 60 International Visitor Spend - West Coast (MBIE) 50 Spend - $millions China Germany UK USA Rest of Asia Australia
88 International Visitor Spend [Europe Combined] - West Coast (MBIE) Spend - $millions China Europe Combined Australia
89 International Spend on the West Coast (MBIE) April 16 March 17 Westland - $238m Grey - $46m Buller - $27m = $265m 2017 = $311m


90 International Spend increase/decrease % on the West Coast by Product 2016/17 (MBIE) Westland - $49 Grey - $6m Buller - $4m 87 Westland - $68m Grey - $20m Buller - $10m

91 International Spend increase/decrease % on the West Coast by Product 2016/17(MBIE) Westland - $46m Grey - $7m Buller - $7m 88 Westland - $17m Grey - $4m Buller - $2m

92 International Spend increase/decrease % on the West Coast by Product 2016/17(MBIE) Westland - $21m Grey - $1m Buller - $1m 89 Westland - $28m Grey - $3m Buller - $1m
 Westland - $41m Grey - $9m")

93 Australia Spend on the West Coast (MBIE) Westland - $41m Grey - $9m Buller -$5m $47m $46m $44m $52m $55m
 Westland - $37m Grey - $6m")

94 China Spend on the West Coast (MBIE) Westland - $37m Grey - $6m Buller - $1m $15m $18m $30m $40m $44m

95 USA spend on the West Coast (MBIE) Westland - $36m Grey - $7m Buller - $4m $15m $23m $26m $38m $47m
 Westland - $26m Grey - $7m")

96 Germany spend on the West Coast (MBIE) Westland - $26m Grey - $7m Buller - $6m $13m $23m $25m $28m $39m


97 UK spend on the West Coast (MBIE) Westland - $29m Grey - $5m Buller - $3m $21m $25m $34m $32m $37m
 Westland - $32m Grey -")

98 Rest Of Europe spend on the West Coast (MBIE) Westland - $32m Grey - $7m Buller - $5m $23m $30m $33m $37m $44m
99 INTERNATIONAL SUMMARY for West Coast Regional Tourism Indicators MBIE Regional Tourism Estimates MBIE Data Retrieved:

100 INTERNATIONAL SPEND ON THE WEST COAST BY PRODUCT Westland - $68m Grey - $20m Buller - $10m Westland - $46m Grey - $7m Buller - $7m 97


101 INTERNATIONAL SPEND ON THE WEST COAST BY PRODUCT Westland - $49m Grey - $6m Buller - $4m Westland - $28m Grey - $3m Buller - $1m 98


102 INTERNATIONAL SPEND ON THE WEST COAST BY PRODUCT Westland - $17m Grey - $4m Buller - $2m Westland - $21m Grey - $1m Buller - $1m 99


103 INTERNATIONAL SPEND ON THE WEST COAST BY PRODUCT Westland - $6m Grey - $4m Buller - $3m Westland - $2m Grey - $2m Buller - $1m 100
104 International Spend By Product West Coast (MBIE) $ Spend Millions Accommodation Food & Beverage services Retail Sales - Other Other Transport Retail Sales - alcohol, food & bev Cultural, recreation & Gambling Other Tourism Products
105 DOMESTIC EXPENDITURE 102
106 Total Domestic Spend on the West Coast Westland - $102m Grey - $69m Buller - $ $ $214m $203m $211m
107 Total NZ & West Coast Domestic Spend April 16 March New Zealand 104 West Coast
108 Domestic Spend increase/decrease % on the West Coast by Product 2016/17 (MBIE) -4% 11.8% 3% 0% 0% 5% 11% 14% 105


109 DOMESTIC SPEND ON THE WEST COAST BY PRODUCT Westland - $33m Grey - $13m Buller - $2m Westland - $17m Grey - $11m Buller - $10m 106

110 DOMESTIC SPEND ON THE WEST COAST BY PRODUCT Westland - $17m Grey - $9m Buller - $9m Westland - $11m Grey - $11m Buller - $8m 107

111 DOMESTIC SPEND ON THE WEST COAST BY PRODUCT Westland - $16m Grey - $4m Buller - $4m Westland - $11m Grey - $5m Buller - $4m 108

112 DOMESTIC SPEND ON THE WEST COAST BY PRODUCT Westland - $7m Grey - $2m Buller - $1m Westland - $3m Grey - $3m Buller - $1m 109
113 60 Domestic Spend By Product West Coast (MBIE) Grouped by Product 50 $ Spend Millions Accommodation Retail Sales -fuel etc Food & Beverage services Retail Sales - Other Other Transport Retail Sales - alcohol, food & bev Cultural, recreation & Gambling Other Tourism Products
114 Domestic Spend By Product West Coast (MBIE) Grouped by Year $ Spend Millions Accommodation Retail Sales -fuel etc Food & Beverage services Retail Sales - Other Other Transport Retail Sales - alcohol, food & bev Cultural, recreation & Gambling Other Tourism Products
115 Domestic Visitor Spend West Coast (Incl. Canterbury & West Coast) - MBIE Spend $M Auckland Bay of Plenty Canterbury Gisborne Hawke's Bay Manawatu-Whanganui Marlborough Nelson Northland Otago Southland Taranaki Tasman Waikato Wellington West Coast
116 Domestic Visitor Spend West Coast (Excl. Canterbury & West Coast) - MBIE 30 Spend $M Auckland Bay of Plenty Gisborne Hawke's Bay Manawatu-Whanganui Marlborough Nelson Northland Otago Southland Taranaki Tasman Waikato Wellington
117 DOMESTIC SUMMARY for West Coast Regional Tourism Indicators MBIE Regional Tourism Estimates MBIE Data Retrieved:
118 Domestic Top 4 regions W/C Spend Breakdown (MBIE) Accommo dation Cultural, Recreation & Gambling Food & Beverage Services Other Passenger Other Tourism Products Retail Sales- Alcohol & Food 2016 Otago Auckland Wellington Canterbury Retail Sales - Fuel & Other Retail Sales - Other
119 Aucklanders Top 5 Domestic Destinations (MBIE) Wellington Waikato Canterbury Bay of Plenty Otago
120 Cantabrians Top 5 Domestic Destinations (MBIE) Canterbury Auckland Wellington Otago Marlborough Waikato
121 Wellingtonians Top 5 Domestic Destinations (MBIE) Auckland Wellington Manawatu-Whanganui Canterbury Waikato Otago
122 Otagoites Top 5 Domestic Destinations (MBIE) Otago Auckland Canterbury Wellington Southland Waikato
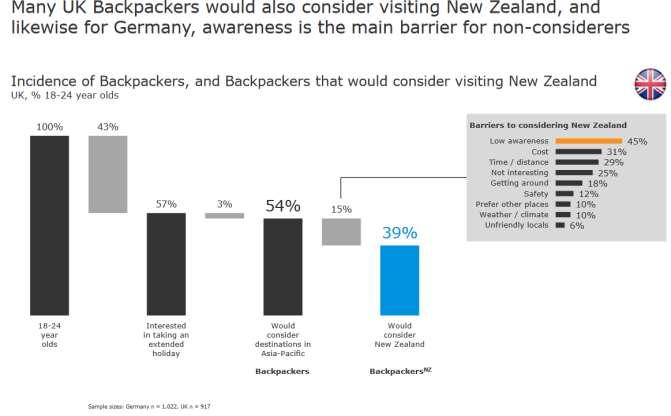
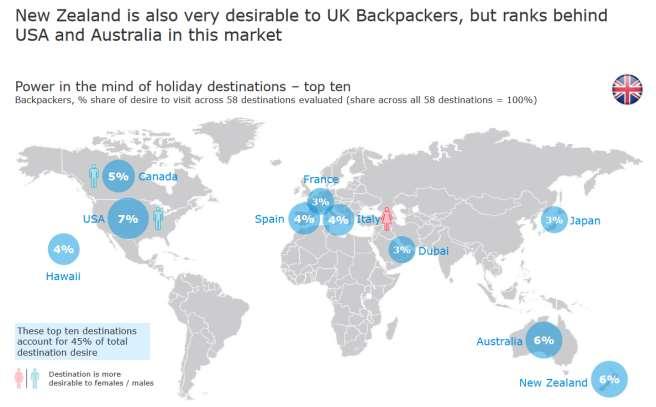
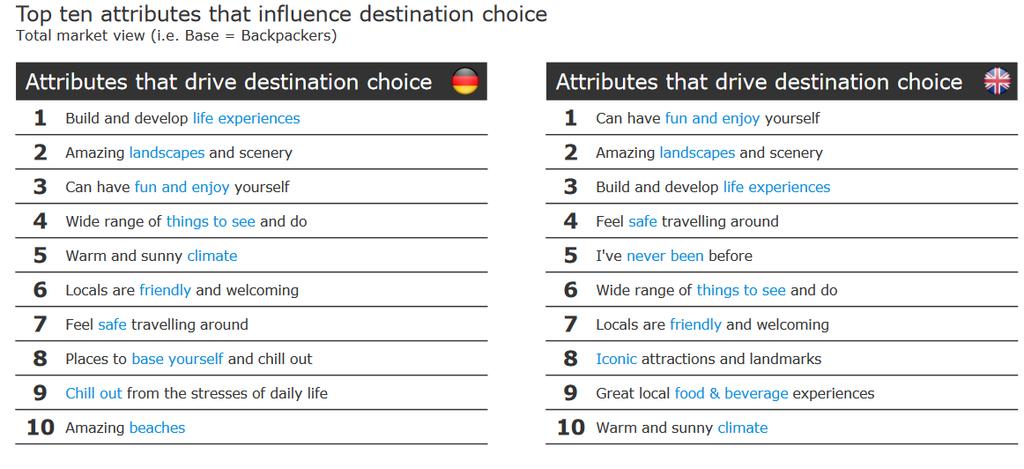
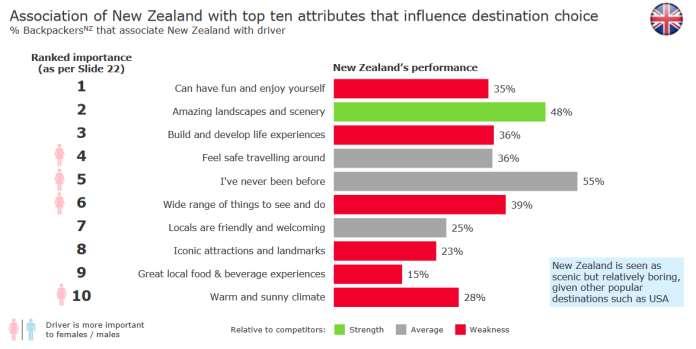
123 BACKPACKERS MARKET UK & GERMANY 120

124 UK & GERMANY BACKPACKERS 121 Source: TNZ

125 122 Source: TNZ

126 123 Source: TNZ

127 124 Source: TNZ

128 125 Source: TNZ

129 126 Source: TNZ

130 127 Source: TNZ

131 128 Source: TNZ
132 129 Source: TNZ
133 AirBnB 130
134 131 Source: TNZ

135 Wellington 132 Source: AirDNZ
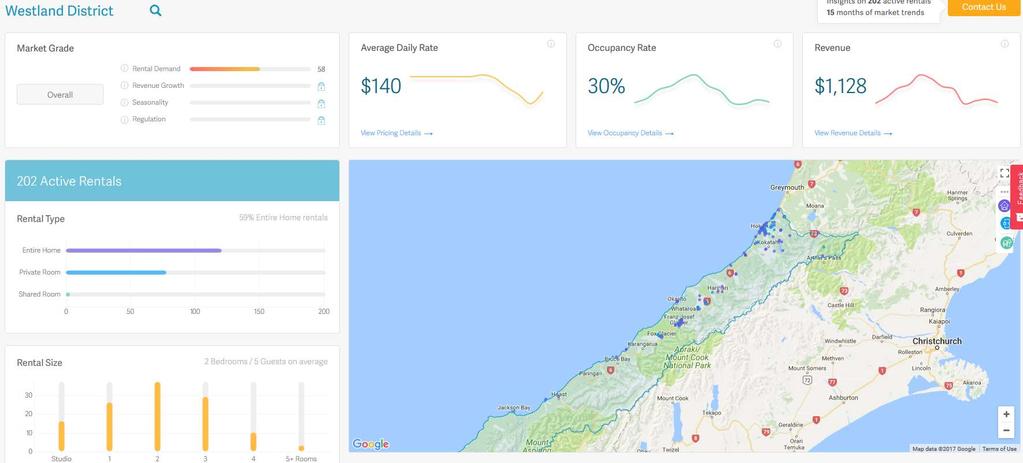
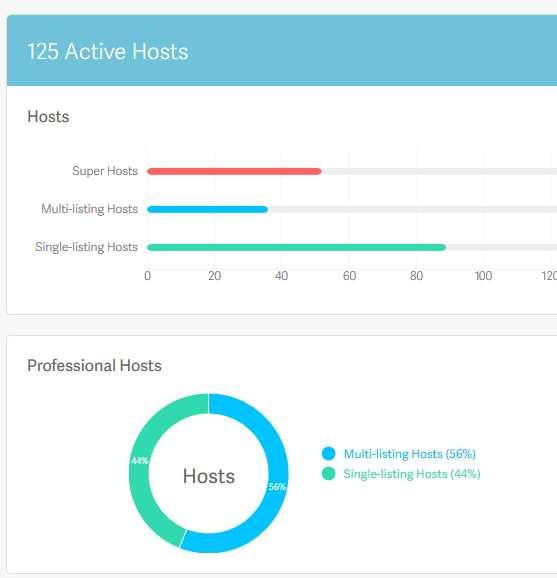
136 West Coast Airbnb information Greymouth 0 shared rooms 22 private - $90 14 entire homes Westport 2 shared - $29 14 private - $91 17 entire homes - $143 0 # of Air BnB Average Cost 133 Source: Airbnb
137 134
138 135
139 136
140 137

141 Grey District 138
142 139
143 140
144 Domestic Visitor Profiles 141


145 Target Destinations Selected Target Markets for West Coast Domestic Market: Canterbury 38.9% Nelson/Tasman 11.1% Auckland 9.7% South Canterbury 4.8% Dunedin 4.3% Wellington 3.7% Central Otago 1.6% 142 source: DGiT (Domestic Growth Insight Tool) website
")
146 Who is interested in the West Coast 143 Source: DGiT (Domestic Growth Insight Tool) website
")
147 What do they want 144 source: DGiT (Domestic Growth Insight Tool) website

148 How do we reach them? 145 source: DGiT (Domestic Growth Insight Tool) website
149 MARKET SHARES 146
150 Total Visitor Spend & NZ Market Share % (MBIE) (2%) (33.9%) (1.91%) (34.47%) (1.88%) (34.94%) (1.82%) (34.00%) (1.83%) (32.71%) (1.97%) (34.41%) West Coast Sth Island NZ
151 Total International Visitor Spend & NZ Market Share (MBIE) (2.44%) (38.38%) Total Domestic Spend South Island (2.51%) (2.50%) (2.24%) (2.11%) (38.33%) (36.20%) (33.69%) (37.89%) (2.65%) (38.36%) West Coast Sth Island NZ Total
152 Total Domestic Visitor Spend & NZ Market Share (MBIE) (1.34%) (1.53%) (1.53%) (1.58%) (1.67%) (31.60%) (32.34%) (33.06%) (32.76%) (32.16%) Total Domestic Spend South Island (1.60%) (32.25%) West Coast Sth Island NZ Total
153 % of Market Share West Coast Market Share % of South Island TOTAL Spend (MBIE) TOTAL INTERNATIONAL DOMESTIC
154 12 West Coast Market Share % of South Island Accommodation Spend (MBIE) TOTAL INTERNATIONAL DOMESTIC 10.2 % of Market Share $$
155 Total Domestic Market Share - % Ak WGTN Cant Waikato Otago BOP Manawatu HB Northland Nelson Southland Taranaki Marl W/C Tasman Gisborne % Market Share 152 UP DOWN STATIC
156 Losing Share in Domestic Growing International(Qrious) 153

157 Monthly Regional Tourism Estimates Regional Summary 2017 (MBIE) Top 5 Regions Month to Month March 2017 Bottom 5 Regions Month to Month March
 Top 10 Regions Year end March")
158 Monthly Regional Tourism Estimates Regional Summary 2017 (MBIE) Top 10 Regions Year end March
159 ACCOMMODATION 156


160 Number of visitors, by main type of accommodation used NZ 2015 (MBIE) 157
161 100 Total Accommodation Spend West Coast (MBIE) Total Domestic Int March 2017 Total: Westland - $63m Grey - $16 Buller - $16 March 2017 International: Westland - $46m Grey - $7 158 Buller - $7 March 2017 Domestic: Westland - $17m Grey - $9m Buller - $9m
162 International Accommodation Spend West Coast (MBIE) Australia China Germany UK USA Rest of Asia Rest of Europe Australia trend China Trend
163 Sth Isl. Domestic Accommodation Spend West Coast (MBIE) Marlb Nelson Otago Sthland Tasman W/C Cant
164 Domestic Accommodation Spend West Coast Incl. Canterbury (MBIE) Auckland Manu/whanganui Otago Sthland Tasman Well Cant Marlb Nelson Waikato
165 Accommodation Capacity - West Coast Accommodation Establishments - West Coast West Coast 315 West Coast Monthly Capacity Actual Numbers YE March 2012 YE March 2013 YE March 2014 YE March 2015 YE March 2016 YE March 2017 West Coast YE March 2012 YE March 2013 YE March 2014 YE March 2015 YE March 2016 YE March 2017 West Coast Commercial Accommodation Monitor - Statistics New Zealand - Data Retrieved:
 Canterbury has seen the most growth in guest nights over the past year largely due to")

166 Change in guest nights of commercial accommodation by region and type, year ended January (MBIE) Canterbury has seen the most growth in guest nights over the past year largely due to repaired and rebuilt hotel accommodation coming back online. Queenstown has also seen a surge in tourist accommodation stays over the January 2016 year, with more than half of that growth in hotel guest nights. 163

167 Number of commercial accommodation establishments by region & type (MBIE) For commercial accommodation, hotels made up approximately 35.5 per cent of all guest nights in New Zealand in the January 2016 year. In smaller cities and regions, motels make up a major part of tourist accommodation. 164

168 Capacity ( stay nights ) of commercial accommodation by region & type (MBIE) Guest capacity, defined by stay nights (or number of nights for rooms available to be occupied), is a useful measure of accommodation supply. Stay nights by region has a similar shape to the number of guest nights, but as there are generally low occupancy rates of holiday parks, there are much higher stay nights for this form of accommodation 165
169 Visitors by accommodation type for international visitors (36 months ended ) 166 Source: International Visitor Survey - MBIE Data Retrieved:
170 Monthly Occupancy vs Capacity West Coast 200, , , ,000 Axis Title 120, ,000 80,000 Monthly Capacity occupancy 60,000 40,000 20,
")
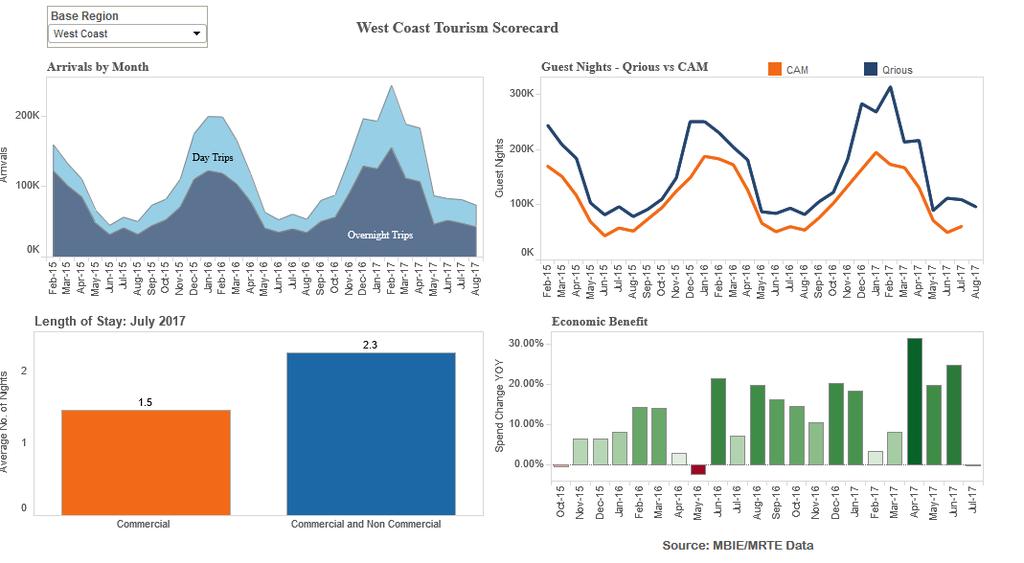
171 West Coast Length of Stay (Qrious) 168
172 West Coast - Guest Nights (Qrious) 169
173 % Backpacker Market Length of Stay NZ total Grouped by Country Avg. W/C NIghts China US AU UK Korean Germany France Japan 170
 Private non-commercial accommodation, such as holiday home rentals, has become increasingly more popular as an alternative to staying in commercial accommodation.")
174 Holidayhouses.co.nz properties, March 2016 (MBIE) Private non-commercial accommodation, such as holiday home rentals, has become increasingly more popular as an alternative to staying in commercial accommodation. Though it remains a relatively small part of the accommodation sector, non-commercial accommodation helps to alleviate demand pressure when commercial providers are close to capacity. This area of the accommodation market is not covered by official tourism statistics. The International Visitor Survey (IVS) shows that private rentals were used as the main form of accommodation by approximately 4.6 per cent of all international visitors in The relatively small amount suggests that, at the moment, private non-commercial accommodation may be more popular among domestic tourists. However, internationally recognised booking systems, such as Airbnb, are becoming more popular and are changing the trends in how people holiday. Therefore, the percentage of international tourists using private rental accommodation appears likely to increase. According to Airbnb, the number of listings in NZ has doubled to more than 15,000 over the last year. Hosts rent out rooms or houses for an average of 26 to 27 nights per year, evenly split between entire houses and single rooms 171
175 ARRIVALS 172

176 VISITS FROM ALL INTERNATIONAL ORIGINS TO WEST COAST 173

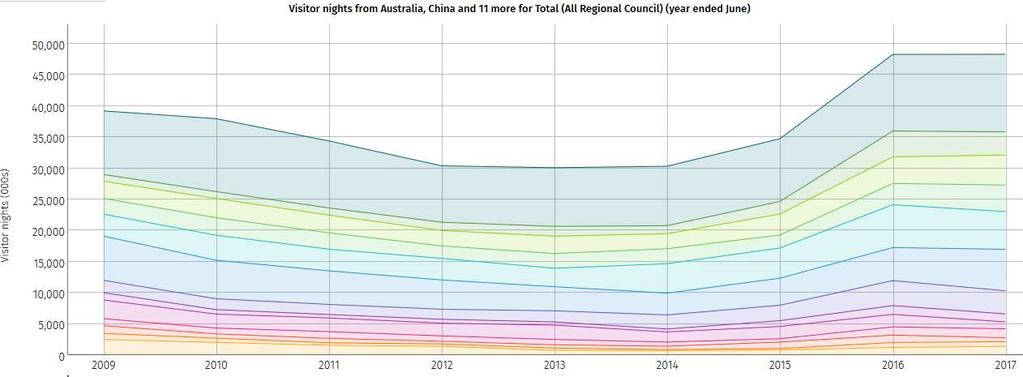
177 Visitor Nights From All International Origins In West Coast 174
178 West Coast Arrivals (Qrious) 175
179 176
180 International Visitor Nights - West Coast July
181 178
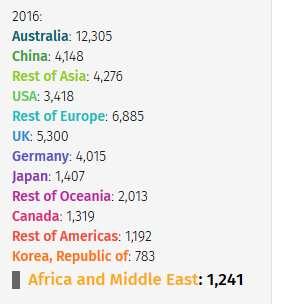
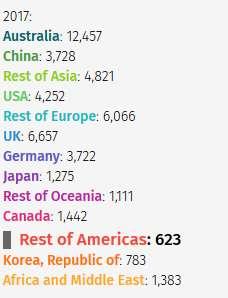
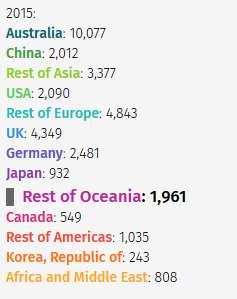
182 International visitors staying 1 night or more on the West Coast. YTD March (Source International Visitor Survey/Tourism New Zealand) Country Difference Australia 105, , ,819 Rest of Europe 66,817 80, ,099 UK 52,758 57,797 +5,039 USA 48,094 47, Rest of Asia 44,980 44, China 28,109 46, ,681 Germany 34,256 45, ,645 Other 31,455 32, Total 425, , ,370 Europe including Germany & UK combined 184,
183 % DIFFERENCE 2015 TO 2016 on the West Coast VISITORS VISITOR NIGHTS AUSTRALIA +22.5% % UK % USA -.6% +7.04% CHINA +66.5% +47% GERMANY +34% +35.4% REST OF EUROPE +21.1% +13.5% REST OF ASIA -1.6% +25% 180
 Paparoa National")

184 International visitor attendance for national parks (MBIE) Paparoa National Park saw a surge of visitors over the year, increasing 20 per cent to 243,
185 Guest Arrivals West Coast (accommodation Monitor cam stats) Guest Arrivals Sept
186 Ratio of annual visitor nights to population and visitor count to population, year ended December 2015 (MBIE) Tourism and population Some regions are more affected by tourism than others. The ratio of visitor nights to population is a useful indicator of how tourism may affect the local infrastructure. A high ratio indicates that the relative number of tourists in relation to local residents is high, which means that the population in the region swells considerably during the high tourist season and there is an increased pressure on local infrastructure over that period. Among regions, the West Coast has the highest ratio, followed by Otago, Nelson, and Marlborough 183
187 Visitor Numbers through Punakaiki Information Centre DOC Numbers Pax

188 Visitor numbers through Pancake Rocks - DOC Not Complete Not Complete
189 TRANSPORT & MOVEMENT 186


.")


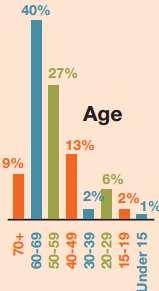
190 Vehicle use by international visitors to NZ, 2015 (MBIE) Overall, around 40 per cent of visitors used rental cars, while another 27 per cent used their own car (whether bought during their trip or borrowed from friends or family). A fifth of international visitors travelled across New Zealand on tour buses. Just under five per cent of visitors used a rental motorhome. 187
191 International Visitors NZ Transport (MBIE) Rental car Car or van owned by you / family / friend(s) / company Plane (within NZ) Bus service between towns / cities Tour bus Train Other bus service Rental campervan / motor-home Motorcycle Bicycle 0 YEDec 2010 YEDec 2011 YEDec 2012 YEDec 2013 YEDec 2014 YEDec

192 Average number of vehicles per day travelling across NZTA measuring sites by region - South Island (MBIE) 189 One way to identify the areas where tourists traffic volumes make a significant impact is to correlate the change in traffic with the volumes of people visiting over the year. Smaller regional areas with high levels of tourism (such as Kaikoura, Westland, Tasman, Southland and Thames-Coromandel) are highly correlated. In these areas, roads are quite clearly more heavily used during peak tourism season
193 Hokitika Airport Arrivals & Departures -Passengers (Hokitika Airport) Pax Tourism Business TOTAL Year 190
194 Visitor spend in Other passenger transport in West Coast International & Domestic (MBIE) $Million International Domestic

195 Scenic Journeys capacity and demand (MBIE) 192 The TranzAlpine service has many more seats than the other two, growing steadily from the low of 13,800 in June 2015 to a high of 22,800 in March The higher percentage of international passengers utilising TranzAlpine during the peak season is driven by two main factors. First, there is a higher number of international tourists visiting NZ during these months, Second, the Northern Explorer and Coastal Pacific have no space to cater to the extra demand during these months. Consequently, tourists wishing to take a train may have to settle for using TranzAlpine instead.
196 TranzAlpine Passenger Movements (Kiwirail) AHP to CHCH CHCH to AHP GM to CHCH 193 CHCH to GM Eastbound Westbound
197 TranzAlpine Growth Rate Arthurs Pass % % % Growth Rate Total 147% Arthurs Pass 258% Greymouth 119% Growth Rate East Arthurs Pass 26% 51% Greymouth 74% 49% TranzAlpine Greymouth Arthurs Pass 194
198 West Coast Rental Car Hires [Trend] - Comparison Avg (local rental car companies) OUT IN OUT vehicles hired out IN - vehicles returned (from any NZ base)

199 Planned road infrastructure spending, National Land Transport Programme (MBIE) Planned road infrastructure spending per capita, National Land Transport Programme (MBIE) 196

200 Regional Impacts of the Kaikoura Earthquakes 197 Source: MBIE
201 The Big Issues Social Licence Infrastructure People and Skills Regional Dispersal Seasonality Funding A Sustainable Tourism Future

202 PAX Passenger trends at Christchurch
203 AIRLINES CHC continues to grow strongly Emirates daily A380 Qantas daily services to MEL, SYD and BNE Launch of seasonal Cathay Pacific Airlines from Hong Kong China Southern increase to five times per week and daily at peak Seasonal double daily services by Singapore Airlines Additional capacity from Air NZ on PER Increased services to Fiji with FJ and NZ Return of China Airlines TPE/MEL services Significant additional domestic services from Air NZ (AKL/CHC) 200
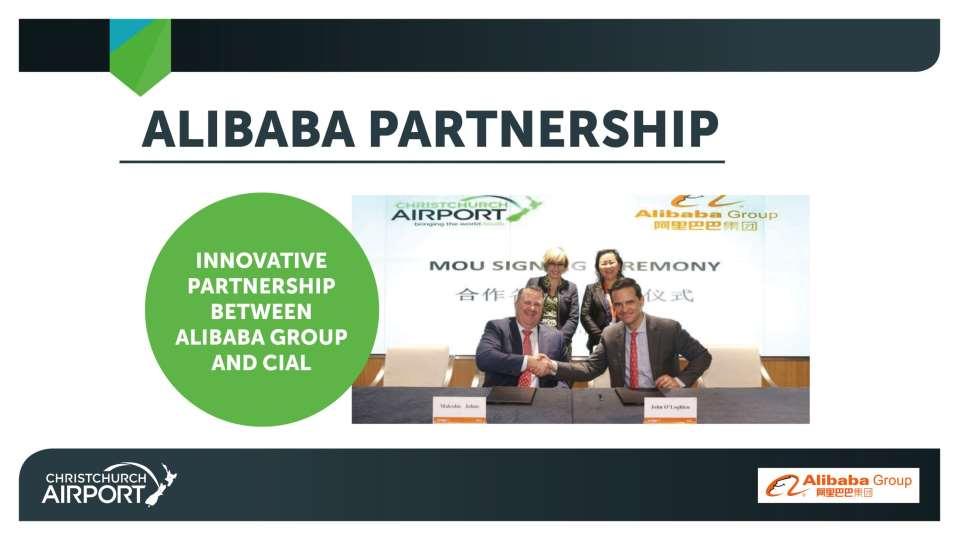
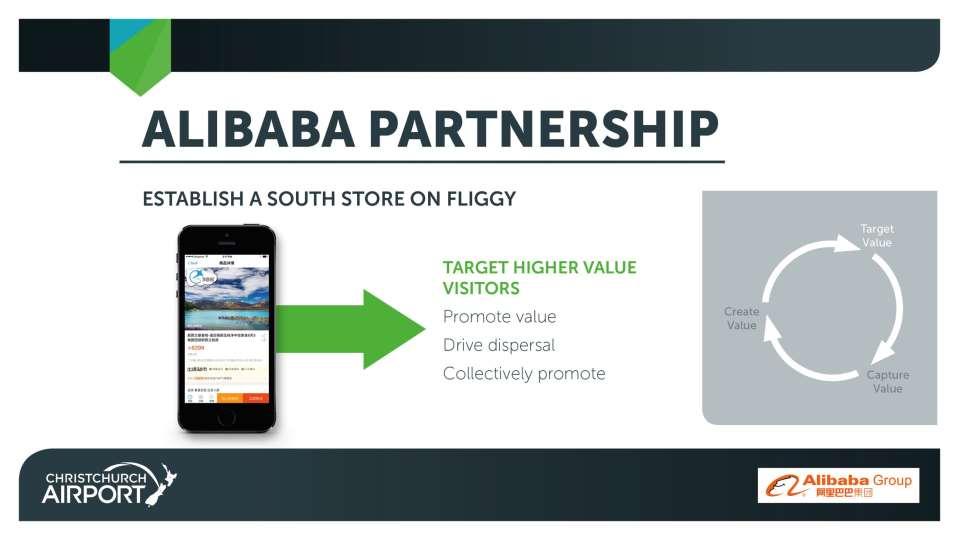
204 SOUTH PARTNERSHIP 13 South Island RTOs Flying in Formation Australia South Island Journeys Campaign (SIRTs) There have been three campaigns commencing early 2015, currently under a JV with TNZ for a three year commitment at $1m annually. This matches CIALs highest priority area, and has contributed to healthy growth in holiday arrivals. China SI direct / Seasonal & Regional dispersal Growing direct arrivals from China into SI has significant impact on improved economic outcomes in terms of quality of visitor, length of stay and regional dispersal. Improved capacity year round with wider regional distribution, and seasonal dispersal (low season traffic) the two primary objectives. Alibaba Project rollout payment platform, develop Fliggy and T-Mall trading sites. SE & N Asia SI direct / Dispersal & New Markets Opportunities for a collective approach to developing markets in SE and N Asia are exploited as they arise, with work in Singapore, Taiwan, India, Indonesia and Korea on-going
205 Tourism No1 Export Earner For 15 of past 20 years $M 18,000 16,000 14,000 12,000 10,000 8,000 6,000 4,000 2,000 0 Annual Export Earnings (YE Mar) Tourism Dairy Meat Wood Fruit

206 Mood of the Nation

207 Mood of the Nation

208 Mood of the Nation
209 EMPLOYMENT GDP 206
210 5.0% 4.5% Grey District Performance 4.6% 4.0% 3.5% 3.4% 3.0% 2.5% 2.0% 1.5% 1.0% 0.5% 0.4% 0.0% Buller Decline from 5.2% growth 2005 to 3.7% decline since 2013 which is 8.7% turnaround Grey Employment decline =179% 207 Buller Employment decline = 451%
211 100 West Coast GDP Tourism (MBIE) $ millions Buller Grey Westland West Coast
212 2000 West Coast Employment in Tourism (MBIE) 1500 People Buller Grey Westland West Coast
213 210
214 8.00% 6.00% Tourism GDP($m) in West Coast Region (Infometrics) 5.80% 6.00% 4.70% 4.00% 3.60% 2.00% 1.50% 0.00% Year % -4.00% -3.70% -6.00% 211
215 0.1 Tourism GDP growth in West Coast Region and New Zealand (Infometrics) West Coast Region New Zealand
216 2,500 Pax Tourism employment in West Coast Region (Infometrics) 2,000 1,500 1, % 4.70% 3.70% % Employees -7.80% -0.70% 213 % Change
217 Tourism employment relative to other industries (Infometrics) Education and Training 8% Mining 6% Agriculture, Forestry and Fishing 14% Health Care and Social Assistance 11% Tourism 14% Accommodation and Food Services 11% Construction 12% Retail Trade 12% 214 Manufacturing 12% West Coast 2015
218 Total tourism spending growth in West Coast Region and New Zealand (Infometrics) 215
219 EVENTS 216
220 Events on the West Coast Kumara Races (Independent) AgFest (Independent) 400, ,000 1 Thousands 300, , , , ,000 50,000 0 Income Expenditure Surplus Axis Title pax Wildfoods Festival (Independent) Pre Party Festival After party Series 1 Series 2 Series 3
221 TARGET MARKETS 218

222 Retail Sales - other Fuel & other automotive products Alcohol & F&B Tourism Product Passenger Transport F&B serving services Cultural, Recreation & Gambling Accommodation Services 219


 aged 25 54 Strategic Role = 65% of arrivals First Time Arrivals aged 25 54")
223 Active Considerers to NZ from AU (TNZ) Local towns Native Bush Beaches Glow Worms Lakes & Rivers Geothermal Activity Potential First Time Arrivals Australians want to see.and do They are.. Previous Visitors Hot Pools Historic Sites Trains & Boats Markets Short Walks Wildlife Cuisine TOURISM NEW ZEALAND ARE TARGETING ACTIVE CONSIDERERS: Independent Professionals (IP s) aged Strategic Role = 65% of arrivals First Time Arrivals aged Strategic Role = 47% yet to visit 220 Active Boomers aged Strategy = 26% of arrivals


224 Social Media and the Back Packer Market United States France Australia China Japan Korea Germany UK 221


225 US Backpacker Market Key Activities Other Accommodation used Transport Used Factors that influenced trip to NZ Purpose of Visit 222


226 US Backpacker Market cont. Demographics Nights spent in regions West Coast is #5 popular region Avg 1.6 nights Expenditure Length of Stay 223

227 UK Backpacker Market Key Activities Other Accommodation used Transport Used Factors that influenced trip to NZ 224 Purpose of Visit

228 UK Backpacker Market Cont. Nights spent in regions Avg -2.8 nights Expenditure Length of Stay 225


229 Australian Backpacker Market Key Activities Other Accommodation used Transport Used Factors that influenced trip to NZ Purpose of Visit 226

230 Aus. Backpacker Market cont. Demographics Nights spent in regions West Coast is #4 popular region Avg 2 nights Length of Stay Expenditure 227

231 Chinese Backpacker Market Key Activities Other Accommodation used Transport Used Factors that influenced trip to NZ Purpose of Visit 228


232 Chinese Backpacker Market cont. Demographics Nights spent in regions West Coast is #4 popular region Avg 2 nights Length of Stay Expenditure 229
233 MAXIMISING VALUE FROM THE CHINESE VISITOR MARKET 230

234 MAXIMISING VALUE FROM THE CHINESE VISITOR MARKET 231
235 MAXIMISING VALUE FROM CHINA 1. China Visitor Market 2. Visitor spend 3. Consumer behaviour 4. Alibaba 232

236 233
237 234
238 235
239 236
240 237
241 238
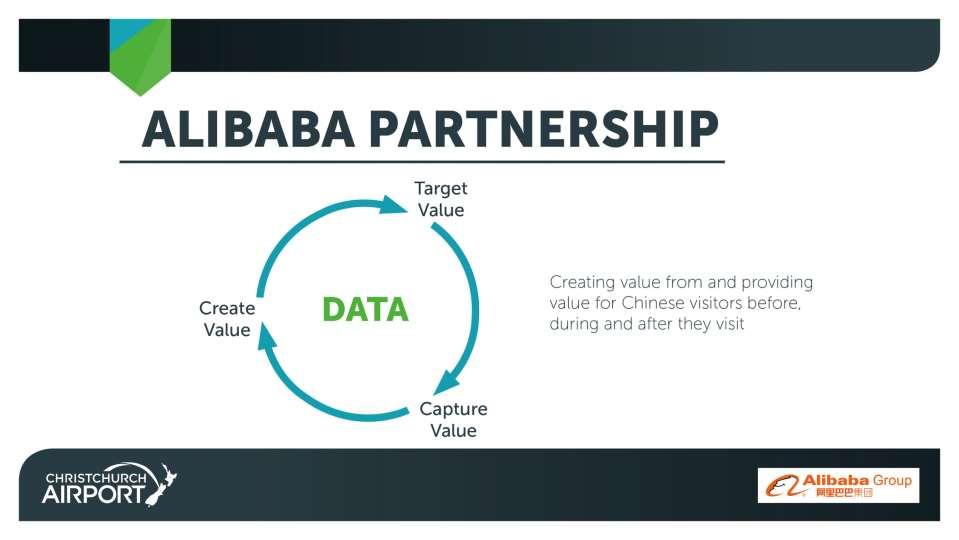
242 MAXIMISING VALUE FROM CHINA We are currently not in the world our Chinese customers are. Therefore we aren t maximising value. Alibaba partnership provides the middleware. 239
243 GATEWAY REGIONS COMPARISON 240


244 Annual spend grouped by region, country of origin, and product category OTAGO compared to WEST COAST CENTRAL OTAGO & QUEENSTOWN DOMESTIC WEST COAST INTERNATIONAL 241


245 Annual spend grouped by region, country of origin, and product category NELSON compared to WEST COAST NELSON DOMESTIC WEST COAST INTERNATIONAL 242
246 Cycling/ Mountain Biking New Zealand 243

247 244 Source: TNZ
248 245 Source: TNZ
249 246 Source: TNZ
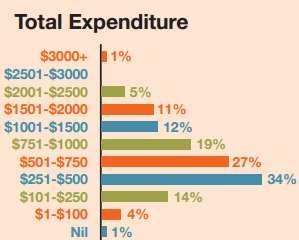
250 Market Research Survey Report for West Coast Wilderness Trail 247
251 Survey Results The following are the results taken from the survey data collected. The number responses given for each question relates to the number of riders that answered the question. 248 Source: West Coast Wilderness Trail
252 Survey Results The following are the results taken from the survey data collected. The number responses given for each question relates to the number of riders that answered the question. 249 Source: West Coast Wilderness Trail
253 Survey Results The following are the results taken from the survey data collected. The number responses given for each question relates to the number of riders that answered the question. 250 Source: West Coast Wilderness Trail
254 Survey Results The following are the results taken from the survey data collected. The number responses given for each question relates to the number of riders that answered the question. 251 Source: West Coast Wilderness Trail
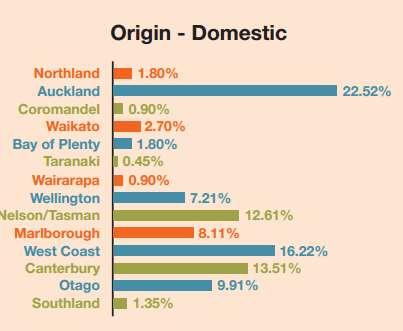
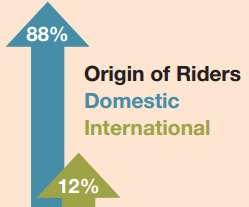
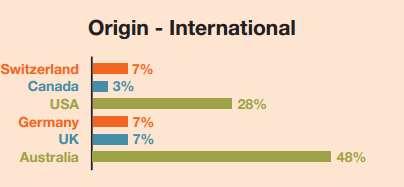
255 Survey Results The following are the results taken from the survey data collected. The number responses given for each question relates to the number of riders that answered the question. Origin of Riders (250 responses) From the total survey respondents 88% of riders reside in New Zealand and 12% were international visitors. 252 Source: West Coast Wilderness Trail

256 Survey Results The following are the results taken from the survey data collected. The number responses given for each question relates to the number of riders that answered the question. 253 Source: West Coast Wilderness Trail

257 Survey Results The following are the results taken from the survey data collected. The number responses given for each question relates to the number of riders that answered the question. 254 Source: West Coast Wilderness Trail
258 Survey Results The following are the results taken from the survey data collected. The number responses given for each question relates to the number of riders that answered the question. 255 Source: West Coast Wilderness Trail
259 Survey Results The following are the results taken from the survey data collected. The number responses given for each question relates to the number of riders that answered the question. 256 Source: West Coast Wilderness Trail
260 Survey Results The following are the results taken from the survey data collected. The number responses given for each question relates to the number of riders that answered the question. 257 Source: West Coast Wilderness Trail

261 Survey Results The following are the results taken from the survey data collected. The number responses given for each question relates to the number of riders that answered the question. 258 Source: West Coast Wilderness Trail
262 Survey Results The following are the results taken from the survey data collected. The number responses given for each question relates to the number of riders that answered the question. 259 Source: West Coast Wilderness Trail

263 Survey Results The following are the results taken from the survey data collected. The number responses given for each question relates to the number of riders that answered the question. 260 Source: West Coast Wilderness Trail
264 Survey Results The following are the results taken from the survey data collected. The number responses given for each question relates to the number of riders that answered the question. 261 Source: West Coast Wilderness Trail
265 Survey Results The following are the results taken from the survey data collected. The number responses given for each question relates to the number of riders that answered the question. 262 Source: West Coast Wilderness Trail


266 Survey Results The following are the results taken from the survey data collected. The number responses given for each question relates to the number of riders that answered the question. 263 Source: West Coast Wilderness Trail

267 Survey Results The following are the results taken from the survey data collected. The number responses given for each question relates to the number of riders that answered the question. 264 Source: West Coast Wilderness Trail

268 Survey Results The following are the results taken from the survey data collected. The number responses given for each question relates to the number of riders that answered the question. 265 Source: West Coast Wilderness Trail

269 Survey Results The following are the results taken from the survey data collected. The number responses given for each question relates to the number of riders that answered the question. 266 Source: West Coast Wilderness Trail

270 Survey Results The following are the results taken from the survey data collected. The number responses given for each question relates to the number of riders that answered the question. 267 Source: West Coast Wilderness Trail
271 Survey Results The following are the results taken from the survey data collected. The number responses given for each question relates to the number of riders that answered the question. 268 Source: West Coast Wilderness Trail
272 The Economic Impact of the West Coast Wilderness Trail 269


273 THE KEY FINDINGS FROM THE INAUGURAL SURVEY OF RIDERS ARE AS FOLLOWS: 270 Source: West Coast Wilderness Trail


274 THE KEY FINDINGS FROM THE INAUGURAL SURVEY OF RIDERS ARE AS FOLLOWS: 271 Source: West Coast Wilderness Trail
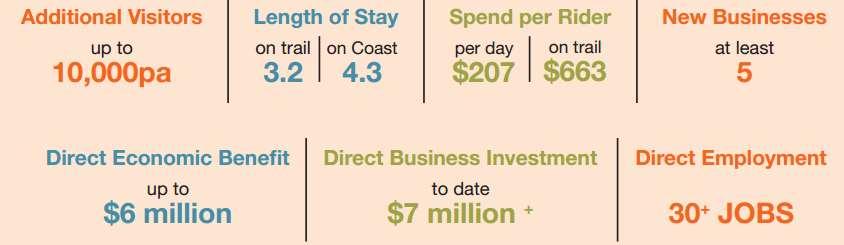
275 THE KEY FINDINGS FROM THE INAUGURAL SURVEY OF RIDERS ARE AS FOLLOWS: Overall Economic Benefit In terms of economic benefits, the West Coast Wilderness Trail contributes the following to the West Coast economy: $207 spend per visitor per day while on the trail Between $4.4 million and $7.7 million additional spend per annum Between 6,631 and 9,000 additional visitors per year Between 21,819 and 38,340 additional day visits per year 272 Source: West Coast Wilderness Trail

276 ECONOMIC BENEFIT FROM THE WEST COAST WILDERNESS TRAIL 273 Source: West Coast Wilderness Trail
277 ECONOMIC BENEFIT FROM THE WEST COAST WILDERNESS TRAIL This information has been used to calculate the following economic impact of the trail to the West Coast economy. Between 6,631 and 9,000 additional visitors per year Between 21,819 and 38,340 additional day visits $207 spend per day per 274 visitor $4.4 - $7.9 million per annum to the regional economy Source: West Coast Wilderness Trail

278 WEST COAST WILDERNESS TRAIL INSIGHTS SUMMARY Source: West Coast Wilderness Trail

279 Comparisons - New Zealand Cycle Trails Vs West Coast Wilderness Trail 276 Source: West Coast Wilderness Trail

280 277 Source: West Coast Wilderness Trail

281 MARKET RESEARCH THE 2017 WILDERNESS TRAIL SURVEY SNAPSHOT 278 Source: Written questionnaire with 254 cyclists

282 MARKET RESEARCH THE 2017 WILDERNESS TRAIL SURVEY SNAPSHOT 279 Source: Written questionnaire with 254 cyclists


283 MARKET RESEARCH THE 2017 WILDERNESS TRAIL SURVEY SNAPSHOT 280 Source: Written questionnaire with 254 cyclists

284 MARKET RESEARCH THE 2017 WILDERNESS TRAIL SURVEY SNAPSHOT 281 Source: Written questionnaire with 254 cyclists


285 MARKET RESEARCH THE 2017 WILDERNESS TRAIL SURVEY SNAPSHOT 4. Riding The Trail 282 Source: Written questionnaire with 254 cyclists


286 MARKET RESEARCH THE 2017 WILDERNESS TRAIL SURVEY SNAPSHOT 283 Source: Written questionnaire with 254 cyclists
287 SOCIAL FISHING 284 Source: Angler usage of New Zealand lake and river fisheries Results from the 2014/15 National Angling Survey July 2016 July 2016

288 57,000 fishing days on the Coast Average length of stay is 2.1 Making 27,000 people a year fishing 285

289 Grey District is the Fishing Capital of the Coast Grey River 13% Lake Brunner 31% Grey District 56% Grey District Lake Brunner Grey River 286
AUCKLAND DESTINATION OVERVIEW
 AUCKLAND DESTINATION OVERVIEW JUNE 218 An in-depth overview of Auckland s visitor economy from the latest arrival, accommodation, spend and cruise data through to past five-year commentary. Prepared July
AUCKLAND DESTINATION OVERVIEW
 AUCKLAND DESTINATION OVERVIEW JULY 218 An in-depth overview of Auckland s visitor economy from the latest arrival, accommodation, spend and cruise data through to past five-year commentary. Prepared August
6 Road infrastructure
 6 Road infrastructure 51 ƨƨsummary New Zealand does not score highly for its road infrastructure when compared to other developed nations. This may partly be due to geography and population size, which
Unravelling regional insight
 Unravelling regional insight By Steve Riley, TIA Insight Specialist (May 2017) Introduction While national-level insight provides a clear picture of how the tourism industry performs in New Zealand, a
AUCKLAND DESTINATION OVERVIEW
 AUCKLAND DESTINATION OVERVIEW AUGUST 218 An in-depth overview of Auckland s visitor economy from the latest arrival, accommodation, spend and cruise data through to past five- commentary. Prepared September
AUCKLAND DESTINATION OVERVIEW
 AUCKLAND DESTINATION OVERVIEW September 218 An in-depth overview of Auckland s visitor economy from the latest arrival, accommodation, spend, cruise and event data through to past five- commentary. Prepared
TOURISM NEW ZEALAND OUR VISITORS UNDERSTANDING HISTORIC VIEW TOTAL ARRIVALS YE JUNE 2016
 TOURISM JAPAN 94K NEW ZEALAND UNDERSTANDING OUR VISITORS GERMANY 91K CHINA 397K 1 UK 214K 7% USA 258K 8% Our market infographics are drawn from two different sources. HISTORIC VIEW: Past Visitor Research
AUCKLAND DESTINATION OVERVIEW
 AUCKLAND DESTINATION OVERVIEW October 218 An in-depth overview of Auckland s visitor economy from the latest arrival, accommodation, spend, cruise and event data through to past five- commentary. Prepared
Commerce Committee. 2015/16 Estimates Examination. Vote Business, Science and Innovation. Tourism Portfolio
 Commerce Committee 2015/16 Estimates Examination Vote Business, Science and Innovation Tourism Portfolio Ministry of Business, Innovation and Employment Responses Supplementary Questions 124-131 June 2015
Milford Sound, Fiordland. newzealand.com. germany. Market information about our Visitors and our Active Considerers
 Milford Sound, Fiordland germany Market information about our Visitors and our Active Considerers newzealand.com PAST VISITORS HISTORIC VIEW TOTAL ARRIVALS YE SEPTEMBER 2017 CHINA 408K 11% JAPAN 102K 3%
Conventions & business events Grow market share of business events from 9% to 10%
 Visitor nights 5% increase of total visitor guest nights vs national Visitor spend 5% increase in visitor spend across the region Conventions & business events Grow market share of business events from
Castlepoint, Wararapa. newzealand.com. japan. Market information about our Visitors and our Active Considerers
 Castlepoint, Wararapa japan Market information about our Visitors and our Active Considerers newzealand.com PAST VISITORS HISTORIC VIEW TOTAL ARRIVALS YE SEPTEMBER 2017 CHINA 408K 1 JAPAN 102K UK 246K
Tourism Export Council New Zealand &
 Tourism Export Council New Zealand & Tourism Distribution Channels February 2015 Tourism Export Council who are we, what do we do? Founded 1971 Private sector 50 Inbound tour operator members (ITOs) 200
Whangaroa Harbour, Northland. newzealand.com. united kingdom. Market information about our Visitors and our Active Considerers
 Whangaroa Harbour, Northland newzealand.com united kingdom Market information about our Visitors and our Active Considerers PAST VISITORS HISTORIC VIEW TOTAL ARRIVALS YE SEPTEMBER 2017 CHINA 408K 11% JAPAN
TOURISM NEW ZEALAND OUR VISITORS UNDERSTANDING HISTORIC VIEW TOTAL ARRIVALS YE SEPTEMBER 2017
 TOURISM NEW ZEALAND UNDERSTANDING OUR VISITORS GERMANY 104K 3% CHINA 408K 11% JAPAN 102K 3% UK 246K 7% USA 320K 9% Our market infographics are drawn from two different sources. HISTORIC VIEW: Past Visitor
NEW ZEALAND REGIONAL TOURISM FORECASTS
 NEW ZEALAND REGIONAL TOURISM FORECASTS 21-216 QUEENSTOWN RTO AUGUST 21 www.tourismresearch.govt.nz Tourism Strategy Group Ministry of Economic Development Contents Introduction 1 1. Summary for Queenstown
Quick quarterly statistics
 Issue 21 tember 218 Quick quarterly statistics page 1 Economic activity quarterly page 2 Employment quarterly page 3 Household welfare quarterly page 4 Tourism activity annual page 5 Spotlight Cruise ship
NEW ZEALAND REGIONAL TOURISM FORECASTS
 NEW ZEALAND REGIONAL TOURISM FORECASTS 21-216 LAKE TAUPO RTO AUGUST 21 www.tourismresearch.govt.nz Tourism Strategy Group Ministry of Economic Development Contents Introduction 1 1. Summary for Lake Taupo
NEW ZEALAND REGIONAL TOURISM FORECASTS
 NEW ZEALAND REGIONAL TOURISM FORECASTS 21-216 NELSON RTO AUGUST 21 www.tourismresearch.govt.nz Tourism Strategy Group Ministry of Economic Development Contents Introduction 1 1. Summary for Nelson RTO
ECONOMIC INDICATORS. The West Coast of NZ
 ECONOMIC INDICATORS The West Coast of NZ 213 WEST COAST AT A GLANCE GDP $ 1.47billion GDP GROWTH 27-12 AVERAGE HOUSEHOLD INCOME $ 86, PER ANNUM Source: REAR 213 1.5%(NZ #2) PER ANNUM Source: BERL 213
NEW ZEALAND REGIONAL TOURISM FORECASTS
 NEW ZEALAND REGIONAL TOURISM FORECASTS 21-216 ROTORUA RTO AUGUST 21 www.tourismresearch.govt.nz Tourism Strategy Group Ministry of Economic Development Contents Introduction 1 1. Summary for Rotorua RTO
Queenstown. newzealand.com. youth. Market information about our Visitors and our Active Considerers
 Queenstown youth Market information about our Visitors and our Active Considerers newzealand.com PAST VISITORS HISTORIC VIEW TOTAL ARRIVALS YE SEPTEMBER 2017 CHINA 408K 11% JAPAN 102K 3% UK 246K 7% Fiordland
Manawatu District Economic Profile
 Manawatu District Economic Profile Our community Population has grown by 1,000 residents since 2014 to reach 29,800. Population is 86.4% European, with Maori 14.3% of the population. This compares with
Mood of the Nation New Zealanders' perceptions of international visitors
 Mood of the Nation New Zealanders' perceptions of international visitors Contents 1 Background and approach 3 2 Key insights 6 3 Detailed insights 10 4 Appendix: measures by region 31 2 1 Background and
Tourism, the Distribution Channel and working with ITOC
 Tourism, the Distribution Channel and working with ITOC 25 August 2011 Presentation Lesley Immink, Chief Executive Inbound Tour Operators Council of New Zealand New name 2012: New Zealand Tourism Export
Megan Williams & Lynn Robinson Sustainability Advocates
 Megan Williams & Lynn Robinson Sustainability Advocates Why care about Sustainability Who s signed up? 700 No. signups 600 500 400 300 200 100 0 Who s signed up? - RTOs Auckland Tourism, Events and
 . Hawke's Bay RTO Area Monthly Guest Nights 200 Guest nights (000) 2013/14 2014/15 2015/16 150 100 50 0 A M J J A S O N D J F M Source: Statistics New Zealand Hawke's Bay RTO Area Monthly Guest Nights
CRUISE TOURISM S CONTRIBUTION TO THE NEW ZEALAND ECONOMY 2017
 CRUISE TOURISM S CONTRIBUTION TO THE NEW ZEALAND ECONOMY 2017 21 August 2017 CRUISE TOURISM S CONTRIBUTION TO THE NEW ZEALAND ECONOMY 2017 Prepared for New Zealand Cruise Association Document reference:
AFTA Travel Trends. July 2017
 AFTA Travel Trends July 2017 AFTA Travel Trends Report 2017 Inbound and Outbound overview Introduction This snapshot provides an overview of the balance of trade between Inbound and Outbound Travel for
 Northland RTO Area Monthly Guest Nights 400 300 Guest nights (000) 2013 2014 2015 200 100 0 J F M A M J J A S O N D Source: Statistics New Zealand 40 30 20 Percent Northland RTO Area Monthly Guest Nights
united states of america
 Split Apple Rock, Nelson Tasman newzealand.com united states of america Market information about our Visitors and our Active Considerers PAST VISITORS HISTORIC VIEW TOTAL ARRIVALS YE SEPTEMBER 2017 CHINA
Annual Business Plan 2017/2018
 Annual Business Plan 2017/2018 Introduction Visitors to Marlborough spent $368 million to the year-end March 2017 up 1% on the previous year. This is a remarkable achievement considering the region was
Air travel projections for the Transport Outlook An overview. Haobo Wang, Ministry of Transport
 Air travel projections for the Transport Outlook An overview Haobo Wang, Ministry of Transport Four projection models for air transport Domestic O&D based regional air passenger flows (Number of domestic
Commercial Accommodation Monitor: April 2017
 Commercial Accommodation Monitor: April 2017 Hawke s Bay i Reproduction of material Material in this report may be reproduced and published, provided that it does not purport to be published under government
TOURISM DUNEDIN TOURISM GROWTH FRAMEWORK DRAFT TARGET: $1.6 BILLION BY 2025 DEVELOPED BY WITH SUPPORT FROM
 TOURISM 2025 DUNEDIN TOURISM GROWTH FRAMEWORK TARGET: $1.6 BILLION BY 2025 DRAFT DEVELOPED BY WITH SUPPORT FROM DUNEDIN TOURISM S ASPIRATIONAL GOAL $1.6 BILLION total tourism revenue in 2025 Tē tōia, tē
VISITOR ECONOMY STRATEGY
 ECONOMY STRATEGY WESTERN 6 6% GDP 3.5M NIGHTS 3.5m The Western Bay of Plenty subregion incorporates the Western Bay of Plenty District and Tauranga City. The Western Bay of Plenty District covers 212,000
Who s Staying in Our Parks?
 1 Who s Staying in Our Parks? VicParks Annual Conference 22/08/2017 Presented by Peter Clay GM for Research & Advocacy 2 WORKING COLLABORATIVELY WITH STATE ASSOCIATIONS Our research is undertaken in partnership
Commercial Accommodation Monitor: October 2017
 Commercial Accommodation Monitor: October 2017 Hawke s Bay i Reproduction of material Material in this report may be reproduced and published, provided that it does not purport to be published under government
Commercial Accommodation Monitor: December 2017
 Commercial Accommodation Monitor: December 2017 Queenstown i Reproduction of material Material in this report may be reproduced and published, provided that it does not purport to be published under government
WEST COAST REGION KEY ECONOMIC INDICATORS & FACT BOOK JULY 2018
 1 WEST COAST REGION KEY ECONOMIC INDICATORS & FACT BOOK JULY 2018 Contents Section About This Fact Book Overarching Vision and Strategies Key Economic Indicators Performance 2012-2017 Key Economic Indicators
Southland Tourism Key Indicators. October Venture Southland is a Joint-Committee of Council. Regional Tourism Organisation
 Southland Tourism Key Indicators October 2018 Regional Tourism Organisation Venture Southland is a Joint-Committee of Council About these statistics All figures are annual year end to the latest month
CLICK TO EDIT SUPPORTING TEXT TITLES CAMPAIGN, GO HERE PR & EVENTS UPDATE
 TITLES CAMPAIGN, GO HERE PR & EVENTS UPDATE WELCOME Your speakers today: Rebecca Ingram, GM PR and Major Events Kate Necklen, GM Global Marketing Communications (Campaign) WHAT WE LL COVER TODAY 1. Overview
TOURISM IN WESTLAND MARCH 2012
 TOURISM IN WESTLAND MARCH 2012 Tourism in Westland The Westland District Council co-ordinated three tourism industry related meetings during February 2012. These were held in Haast, Fox Glacier and Hokitika.
Source: Statistics New Zealand International Visitor Arrivals. Aug Visitors aged year old.
 1 2 Source: Statistics New Zealand International Visitor Arrivals. Aug 2015. Visitors aged 18-29 year old. 3 4 Desktop Research (IVA) Who are our current Youth visitors? Arrivals (k) Stay Days (m) Expenditure
QCB Report Q
 Q 8-9 October to 3 December 8 Market Overview & Insights The following report outlines the key activity and results of the Queenstown Convention Bureau for Q (Oct, Nov, Dec) of 8-9 financial year. This
Queensland Tourism Aviation Blueprint to 2016
 Queensland Tourism Aviation Blueprint to 2016 tq.com.au Blueprint outline The purpose of the Queensland Tourism Aviation Blueprint to 2016 is to develop the strategic framework that will guide aviation
June TEQ Marketing Strategy 2025 Executive Summary
 June 2018 TEQ Marketing Strategy 2025 Executive Summary Vision and The Opportunity Tourism and Events Queensland s (TEQ) Marketing Strategy 2025 provides a platform to realise the TEQ vision of inspiring
USING SPECIAL INTERESTS TO DRIVE TRAVEL. Chris Atkinson TNZ Marketing Communications Manager Sectors Wednesday 12 March, 9am
 USING SPECIAL INTERESTS TO DRIVE TRAVEL Chris Atkinson TNZ Marketing Communications Manager Sectors Wednesday 12 March, 9am Agenda 1. Introduction 2. Special Interest (SI) overview and definition 3. Recap:
Franz Josef Glacier. newzealand.com. visitor experience. Market information about our Visitors and our Active Considerers
 Franz Josef Glacier newzealand.com visitor experience Market information about our Visitors and our Active Considerers PAST VISITORS HISTORIC VIEW TOTAL ARRIVALS YE SEPTEMBER 2017 CHINA 408K 11% JAPAN
AFTA Travel Trends. June 2017
 AFTA Travel Trends June 2017 AFTA Travel Trends Report 2017 Inbound and Outbound overview Introduction This snapshot provides an overview of the balance of trade between Inbound and Outbound Travel for
New Zealand. Tourism in the economy. Tourism governance and funding
 New Zealand Tourism in the economy Tourism directly accounted for NZD 8.3 billion or 4% of New Zealand s GDP in the year ended March 2014, and indirectly contributed an additional NZD 6.5 billion or 3.1%
June TEQ Marketing Strategy 2025 Executive Summary
 June 2017 TEQ Marketing Strategy 2025 Executive Summary Vision and The Opportunity Tourism and Events Queensland s (TEQ) Marketing Strategy 2025 provides a platform to realise the TEQ vision of inspiring
International Tourism Snapshot
 Australia on a high International visitors to Australia Australia welcomed 7.8m international visitors in the year ending June International visitor expenditure in Australia 2017, more than any previous
Common Assessment Task
 Common Assessment Task Unit Standard 24731 Demonstrate knowledge of destination New Zealand Level: 2 Credit: 4 Version: 2 School: Student Name: Date of Assessment: Demonstrate knowledge of destination
ROTORUA REGIONAL AIRPORT
 ROTORUA REGIONAL AIRPORT TRANS-TASMAN DEMAND AND ECONOMIC IMPACT ASSESSMENT PREPARED FOR ROTORUA DISTRICT COUNCIL BY APR CONSULTANTS SEPTEMBER 2005 EXECUTIVE SUMMARY This report presents information on
Queenstown Airport International Passenger Profile Update
 Queenstown Airport International Passenger Profile Update 12 months to 31 y 1 tember This report, based on data from Statistics NZ, shows the profile of passengers arriving or departing on TransTasman
RE: PROPOSED STRATEGIC ALLIANCE AGREEMENT BETWEEN AIR NEW ZEALAND AND SINGAPORE AIRLINES
 28 February 2014 Richard Cross Senior Adviser Ministry of Transport Dear Richard RE: PROPOSED STRATEGIC ALLIANCE AGREEMENT BETWEEN AIR NEW ZEALAND AND SINGAPORE AIRLINES Christchurch International Airport
BEFORE THE QUEENSTOWN LAKES DISTRICT COUNCIL HEARINGS PANEL. UNDER the Resource Management Act 1991
 BEFORE THE QUEENSTOWN LAKES DISTRICT COUNCIL HEARINGS PANEL UNDER the Resource Management Act 1991 IN THE MATTER of the review of parts of the Queenstown Lakes District Council s District Plan under the
Tourism at the glaciers
 Tourism at the glaciers Hokitika, August 28, 2014 Heather Purdie Stephen Espiner Jude Wilson Purdie, H., Anderson, B., Chinn, T., Owens, I., Mackintosh, A. and Lawson, W. (2014): Global and Planetary Change,
Mood of the Nation New Zealanders' perceptions of international visitors. March 2018
 Mood of the Nation New Zealanders' perceptions of international visitors March 2018 Contents 1 Background and approach 3 2 Key insights 6 3 Detailed insights 10 4 Appendix: measures by region 31 2 1 Background
Modelled Territorial Authority Gross Domestic Product (MTAGDP)
") RESEARCH EVALUATION ANALYTICS UNCLASSIFIED Modelled Territorial Authority Gross Domestic Product (MTAGDP) 2018 Methodology Table of Contents 1. Summary... 3 1.1 Caveats and disclaimers... 3 2. Methodology...
RESEARCH EVALUATION ANALYTICS UNCLASSIFIED Modelled Territorial Authority Gross Domestic Product (MTAGDP) 2018 Methodology Table of Contents 1. Summary... 3 1.1 Caveats and disclaimers... 3 2. Methodology...
International Visitation to the Northern Territory. Year ending March 2017
 International Visitation to the Northern Territory Year ending March 217 The following is a summary of information relevant to the Northern Territory tourism industry including visitation results from
Industry Consultation Day 21 st April Tim Hunter Chief Executive
 Industry Consultation Day 21 st April 2015 Tim Hunter Chief Executive A long hot summer + rise in inbound demand To New Zealand 2,900,000 2,800,000 International Visitor Growth to NZ +5% 2,700,000 +6%
Series title: State of the tourism industry (previously, State of the tourism sector) Series URL:
 Series URL:") The State of the Industry Reports are an annual series produced by Jude Wilson and David Simmons (Lincoln University) with data input and support from Bernie Hanratty (Statistics New Zealand), Steve Riley
The State of the Industry Reports are an annual series produced by Jude Wilson and David Simmons (Lincoln University) with data input and support from Bernie Hanratty (Statistics New Zealand), Steve Riley
Freight Movements in the Upper North Island
 Freight Movements in the Upper North Island Presentation 4 September 2009 Freight Key driver supporting economic growth Planning and management of freight Good information Role of NFDS Current patterns
Tourism Statistics RTO 1
 Tourism Statistics RTO 1 Tourism Research Unit Spring 2012 1 1 Ontario Tourism 2 2 Ontario Tourism Indicators 2011* Visits increased by 1.3% to 104.4 million. Visits from Ontario and overseas countries
Tim Hunter Christchurch & Canterbury Tourism Steve Clarke Canterbury Earthquake Recovery Authority (CERA) Disaster & Rebuild 16 January 2015
 Disaster & Rebuild 16 January 2015") Tim Hunter Christchurch & Canterbury Tourism Steve Clarke Canterbury Earthquake Recovery Authority (CERA) Disaster & Rebuild 16 January 2015 Every country has a disaster paradigm Flood Tropical Storm Bush
Tim Hunter Christchurch & Canterbury Tourism Steve Clarke Canterbury Earthquake Recovery Authority (CERA) Disaster & Rebuild 16 January 2015 Every country has a disaster paradigm Flood Tropical Storm Bush
JUNE 2017 AUCKLAND ECONOMIC INSIGHTS SERIES ENGAGING GLOBALLY AUCKLAND S TRADING LINKAGES. aucklandnz.com/business nzier.org.nz
 AUCKLAND ECONOMIC INSIGHTS SERIES ENGAGING GLOBALLY AUCKLAND S TRADING LINKAGES aucklandnz.com/business nzier.org.nz JUNE 2017 4 AUCKLAND ECONOMIC INSIGHTS SERIES 1 2 3 4 Advanced Industries Auckland s
Benchmarking Travel & Tourism in United Arab Emirates
 Benchmarking Travel & Tourism in United Arab Emirates How does Travel & Tourism compare to other sectors? Summary of Findings, November 2013 Sponsored by: Outline Introduction... 3 UAE summary...... 8
Tim Hunter Chief Executive. CCT Business Partner Update 3 March 2015
 Tim Hunter Chief Executive CCT Business Partner Update 3 March 2015 A Great Summer Strong international arrival growth More flights and more beds Great weather = more visitors doing more Jan-10 Feb-10
Commerce Committee 2010/11 financial review of the New Zealand Tourism Board Additional written questions
 Commerce Committee 2010/11 financial review of the New Zealand Tourism Board Additional written questions 103 114 Q103. What action has been taken or is planned to address the Auditor-General s recommended
Airport forecasting is used in master planning to guide future development of the Airport.
 Airport Forecasts Airport forecasting is used in master planning to guide future development of the Airport. 4.1 INTRODUCTION Airport forecasting ensures development is appropriate for passengers, ground
AFTA Travel Trends. August 2017
 AFTA Travel Trends August 2017 AFTA Travel Trends Report 2017 Inbound and Outbound overview Introduction This snapshot provides an overview of the balance of trade between Inbound and Outbound Travel for
D R O N E T R A C K E R. making your world possible
 D R O N E T R A C K E R 2 0 1 8 1 C O N T E N T S Background 3 Number of responses recreational vs commercial operators Profile of a recreational operator 5 Profile of a commercial operator 9 Business
KICKING FOR 22. BOPRU Strategy July 2017
 KICKING FOR 22 Strategy July 2017 11.5k Registered players in 2017 Highest number of Maori players in NZ OVERVIEW # 1 The Bay of Plenty Rugby Sevens Strategy was first developed in 2013 in partnership
AFTA Travel Trends. May 2018
 AFTA Travel Trends May AFTA Travel Trends Report Inbound and Outbound overview Introduction This snapshot provides an overview of the balance of trade between Inbound and Outbound Travel for Year end of
Produced by: Destination Research Sergi Jarques, Director
 Produced by: Destination Research Sergi Jarques, Director Economic Impact of Tourism North Norfolk District - 2016 Contents Page Summary Results 2 Contextual analysis 4 Volume of Tourism 7 Staying Visitors
Produced by: Destination Research Sergi Jarques, Director
 Produced by: Destination Research Sergi Jarques, Director Economic Impact of Tourism Norfolk - 2016 Contents Page Summary Results 2 Contextual analysis 4 Volume of Tourism 7 Staying Visitors - Accommodation
International Tourism Snapshot
 International visitors to Australia Total holiday 4,447,000 5.0% 18.9-0.7% NZ 490,000-1.4% 7.5-9.4% Asia 2,292,000 8.6% 15.5-5.3% North America 496,000 4.6% 15.2-7.1% Europe 554,000 0.2% 38.5 8.3% UK 400,000
Hokitika Gorge, West Coast. newzealand.com INDIA. Market information about our Visitors and our Active Considerers
 Hokitika Gorge, West Coast INDIA Market information about our Visitors and our Active Considerers newzealand.com PAST VISITORS HISTORIC VIEW TOTAL ARRIVALS YE MARCH 2018 AUS 1,495K 39% INDIA 63K 2% USA
THE COROMANDEL: beyond
 THE COROMANDEL: beyond 2025 Cover: Whiritoa Beach This page: Cornish Pumphouse. EXECUTIVE summary The Coromandel was recently voted New Zealand s number one holiday destination *, which is exactly where
Produced by: Destination Research Sergi Jarques, Director
 Produced by: Destination Research Sergi Jarques, Director Economic Impact of Tourism Norfolk - 2017 Contents Page Summary Results 2 Contextual analysis 4 Volume of Tourism 7 Staying Visitors - Accommodation
AFTA Travel Trends. December 2018
 AFTA Travel Trends December 2018 AFTA Travel Trends Report 2018 Inbound and Outbound overview Introduction This snapshot provides an overview of the balance of trade between Inbound and Outbound Travel
China 17% Foreign overnight stays 31% Domestic overnight stays 69% 8.3 MILLION FOREIGN VISITORS IN FINLAND IN 2017
 TOURISM IS A GROWING SOURCE OF EXPORT REVENUE AND A SIGNIFICANT EMPLOYMENT PROVIDER IN FINLAND TOURISM HAS A MULTIPLIER EFFECT ON OTHER SECTORS. 1 EURO IN TOURISM ADDS 56 CENTS VALUE TO THE OTHER SECTORS.
36% 64% 57% 43% Base: Total Sample - Excluding Residents (n=2,433) Base: Total Sample (n=2,480)
 Base: Total Sample (n=2,480)") Angus & Associates Ltd. 2017 The majority of the domestic travel market (87%) have visited, with one in four having visited within the past 12 months. Unsurprisingly, attracts a high proportion of visitors
Angus & Associates Ltd. 2017 The majority of the domestic travel market (87%) have visited, with one in four having visited within the past 12 months. Unsurprisingly, attracts a high proportion of visitors
Produced by: Destination Research Sergi Jarques, Director
 Produced by: Destination Research Sergi Jarques, Director Economic Impact of Tourism Oxfordshire - 2016 Economic Impact of Tourism Headline Figures Oxfordshire - 2016 number of trips (day & staying) 27,592,106
International Tourism Snapshot
 International visitors to Australia International visits continue to grow Australia hosted a record number of international visitors in the year ending International visitor expenditure in Australia September
International Visitation to the Northern Territory. Year ending September 2017
 International Visitation to the Northern Territory Year ending September 2017 The following is a summary of information relevant to the Northern Territory (NT) tourism industry including visitation results
A rising ELICOS tide lifts all international education ships. So how do we navigate for future success?
 A rising ELICOS tide lifts all international education ships. So how do we navigate for future success? Brett Blacker English Australia AIEC 2015 1 The rising tide. Global context Data and trends Policy
Otago Economic Overview 2013
 Final report May 2014 www.berl.co.nz Background Author(s): Mark Cox, Hugh Dixon and Masrur Alam Khan DISCLAIMER All work is done, and services rendered at the request of, and for the purposes of the client
Tourism Snapshot A focus on the markets in which the CTC and its partners are active
 Tourism Snapshot A focus on the markets in which the CTC and its partners are active www.canada.travel/corporate January 214 Volume 1, Issue 1 Key highlights Total arrivals from CTC s international markets
Tourism Statistics RTO 11
 Tourism Statistics RTO 11 Tourism Research Unit Spring 2012 1 1 Tourism 2 2 Tourism Indicators 2011* Visits increased by 1.3% to 104.4 million. Visits from and overseas countries increased, while visits
AFTA Travel Trends. April 2018
 AFTA Travel Trends April 2018 AFTA Travel Trends Report 2018 Inbound and Outbound overview Introduction This snapshot provides an overview of the balance of trade between Inbound and Outbound Travel for
Tourism Snapshot A focus on the markets that the CTC and its partners are active in Ontario June 2011 Volume 7, Issue 6
 Tourism Snapshot Ontario A focus on the markets that the CTC and its partners are active in www.canada.travel/corporate June 2011 Volume 7, Issue 6 Key highlights In June 2011, overnight travel to Canada
Project Manager: Neil Beckett. Prepared by: Gerald Wen. Reviewed by: Neil Beckett. Approved for issue by: Neil Beckett
 Traffic Volumes Monthly Report May 2009 This report has been prepared for the benefit of the NZ Transport Agency (NZTA). No liability is accepted by this company or any employee or sub-consultant of this
From: OECD Tourism Trends and Policies Access the complete publication at:
 From: OECD Tourism Trends and Policies 2014 Access the complete publication at: http://dx.doi.org/10.1787/tour-2014-en New Zealand Please cite this chapter as: OECD (2014), New Zealand, in OECD Tourism
Tourism satellite account: 2017
 The contribution made by tourism to the New Zealand economy Crown copyright See Copyright and terms of use for our copyright, attribution, and liability statements. Citation Stats NZ (2017). Tourism satellite
Tourism Statistics Region 1
 Tourism Statistics Region 1 Tourism Research Unit Winter 2011 1 Summary In 2008, there were 101.0 million visits in and visitors spent $17.6 billion residents account for the majority of visits and spending
Regional delivery in the ITP sector
 Regional delivery in the ITP sector This document provides an overview of the institutes of technology and polytechnics (ITP) sector delivery by region, and highlights key changes since 212. Number of
New Zealand Education. New Adventure Every Day
 A New Zealand Education New Adventure Every Day A WARM WELCOME Welcome to New Zealand, where you can gain a world-class education, make lifelong friendships, have unbeatable experiences and learn new ways