VISITOR ECONOMY STRATEGY
|
|
|
- Brenda Sutton
- 5 years ago
- Views:
Transcription

1 ECONOMY STRATEGY


2 WESTERN 6 6% GDP 3.5M NIGHTS 3.5m The Western Bay of Plenty subregion incorporates the Western Bay of Plenty District and Tauranga City. The Western Bay of Plenty District covers 212,000 hectares of coastal, rural, and urban areas between Bowentown/Waihi Beach to Otamarakau and surrounds Tauranga City. The main urban centres outside Tauranga City include Waihi Beach, Katikati, Omokoroa, Te Puna and Maketu. Tauranga City sits in the middle of the subregion, surrounded by the Western Bay of Plenty District. The 2013 Census showed 114,789 people lived in Tauranga City, but Statistics NZ now estimate the population is 128,000, making it the fifth largest city in New Zealand % GROWTH P.A. 4.8% 78% ARE S 39 ECONOMY Visitor spend in the Western Bay of Plenty subregion was $802M in the 2016 calendar year, up from $733m in Domestic visitors accounting for 78% of the spend, although this varies seasonally, with international visitor spend as high as 29 % during the high season, and dropping to 15% in the low season. However, the region has had a major upsurge in international visitation with over 12% growth. The Western Bay of Plenty experienced growth in Monthly Regional Tourism Estimate spend of 39% between 2009 and 2016, a compound growth rate of 4.8%, the second highest in the wider region after Rotorua. The subregion s market share has remained stable at around 35%. Visitor spend provides direct employment for 7,920 people. Retail trade is the largest employer, followed by the other tourism related sectors. The accommodation sector makes up a smaller proportion. ECONOMY STRATEGY

, the Waikato River that flows from the lake, and the Tongariro River which flows from Tongariro")

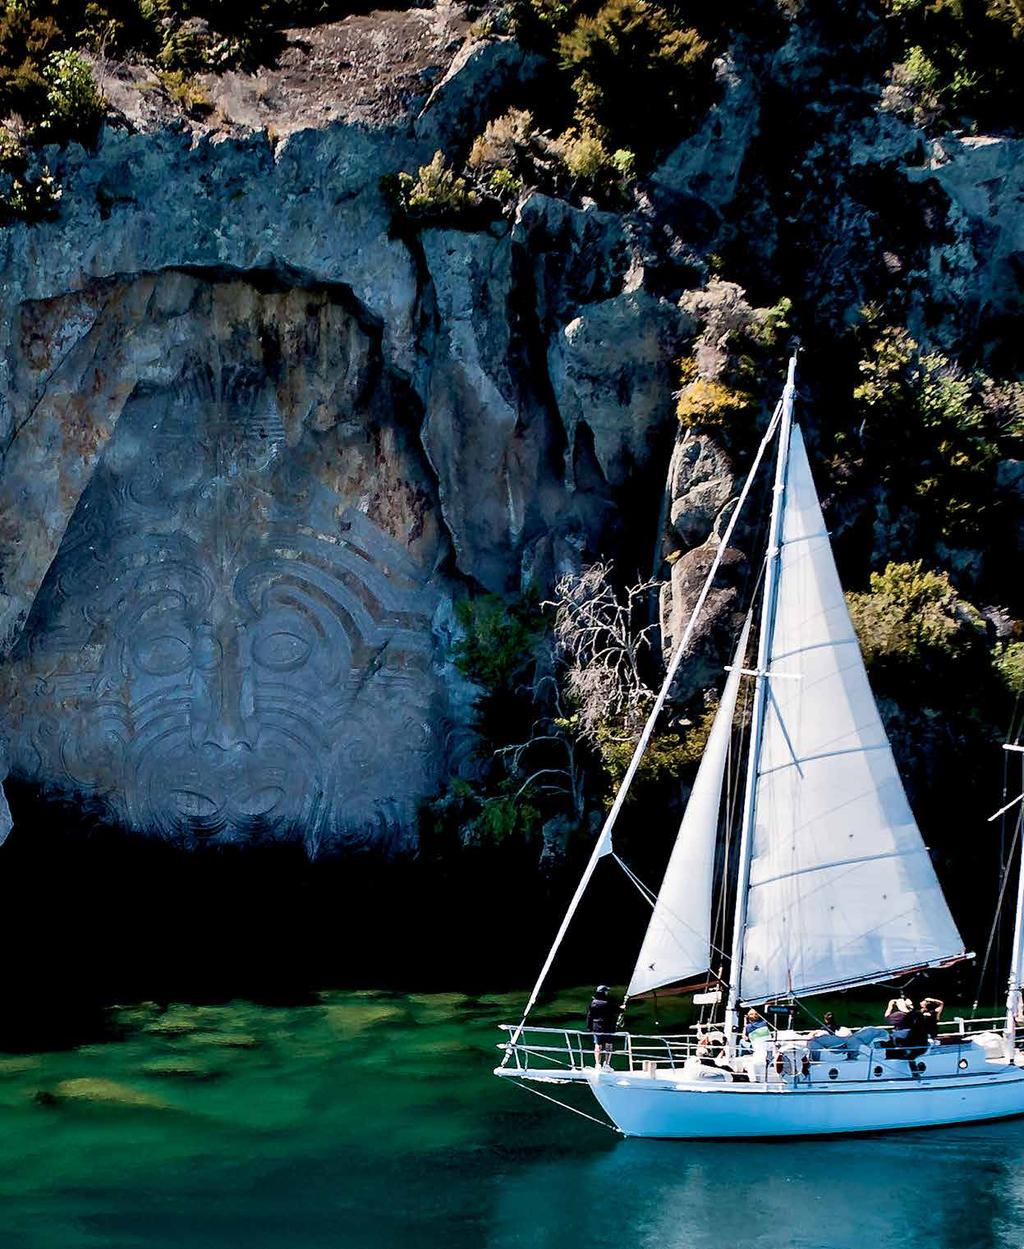
3 TAUPO 28 28% GDP >3M NIGHTS >3m 2/3 18% GROWTH P.A. 2.4% 18 2/3 ARE S Great Lake Taupō is the southernmost subregion in the wider Bay of Plenty region. It has long been a highly desirable domestic tourism destination and has an international reputation based around the Tongariro Alpine Crossing, adventure activities, its trout fishing, and luxury lodge accommodation. The visitor experiences largely relate to Lake Taupō (a 616km2 lake in the middle of the district), the Waikato River that flows from the lake, and the Tongariro River which flows from Tongariro National Park. Approximately half of Tongariro National Park sits within the Taupō District. Taupō is the main township, and alongside Turangi are the main visitor destinations. However, there are many other smaller lakeside settlements around Lake Taupō and the hydro lakes on the Waikato River, which are important domestic tourism destinations. ECONOMY Domestic visitors comprise around 66% of the total visitor nights to the district and are mainly from Auckland, Wellington and the surrounding areas. International visitors are predominantly from Australia, UK, Europe and the USA, although Chinese visitor numbers are growing. Total direct visitor spend in the region is estimated at $600m which, when combined with indirect expenditure, comprises around 28% of regional GDP.


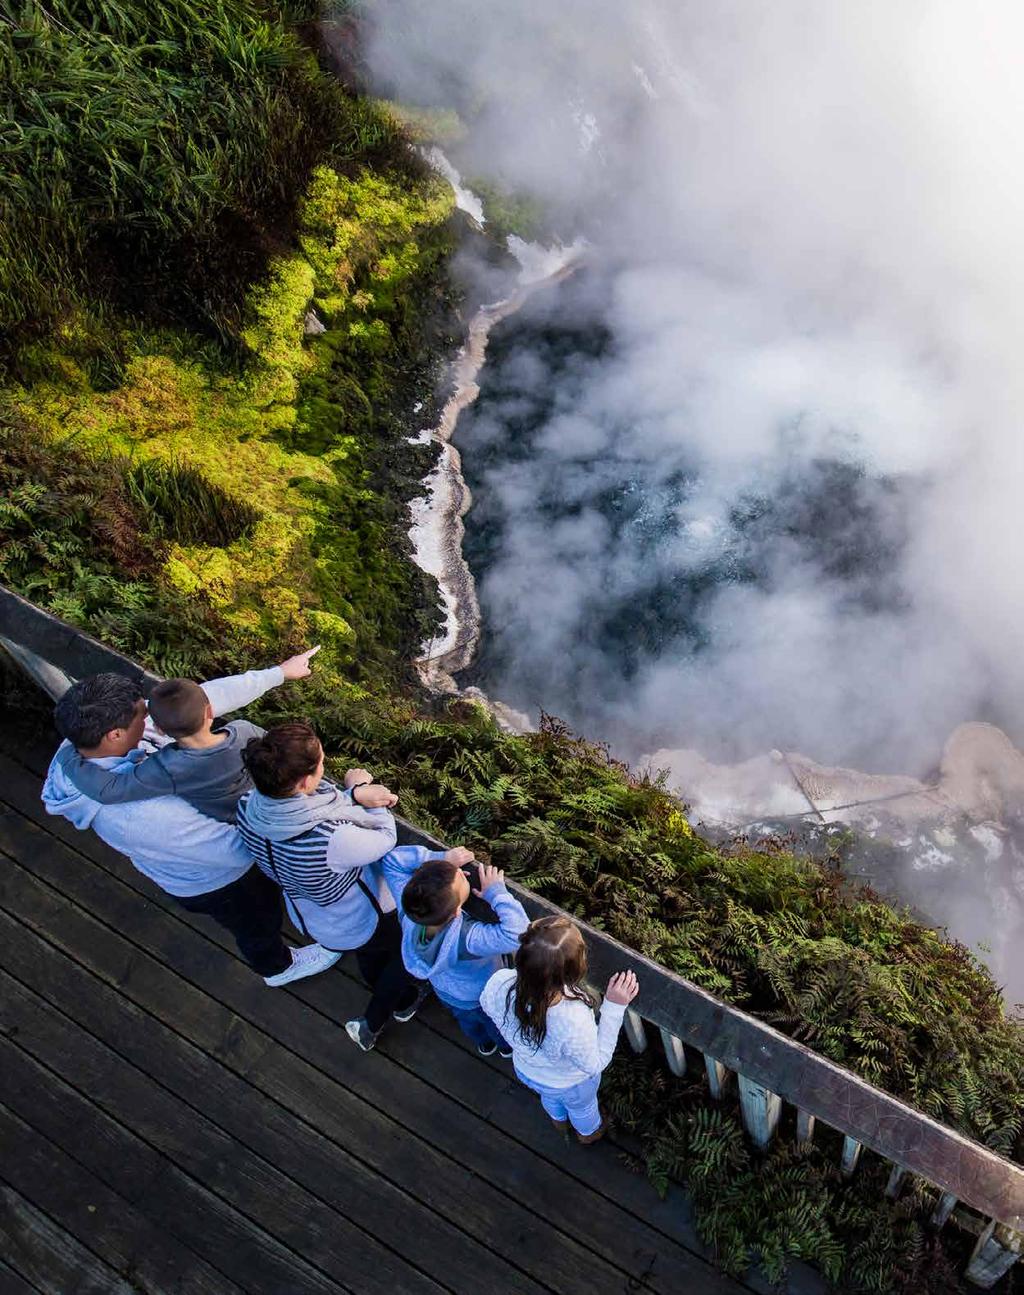
4 ROTORUA 28 28% GDP 3.5M NIGHTS 3.5m 50 62% GROWTH P.A. 7.1% 62 50% ARE S Rotorua sits in the centre of the Bay of Plenty Region, an hour from Taupo, 90 minutes from Whakatane and 80 minutes from Tauranga. The region is situated around Lake Rotorua, which is nearly 300m above sea level and is the centre of an ancient caldera that stretches 20km at its widest point. Rotorua is famous for its geothermal activity, with seven geothermal fields with hot pools and spectacular steam eruptions which attract over 3 million visitors per year. Volcanic activity has also shaped the wider landscape with significant features including Mt Tarawera, Rainbow Mountain, Mt Ngongotaha and Mokoia Island. The region includes 18 lakes, three major rivers and 100,000 hectares of native and exotic forests. There are 120 wetlands and hundreds of kilometres of walking, cycling and mountain bike tracks. Rotorua is a well-established visitor destination, attracting visitors for more than 150 years to experience its unique geothermal and cultural offerings. The region covers the Rotorua district area surrounding Lake Rotorua and the other lakes within the region. The region continues to attract significant numbers of international visitors for cultural and geothermal experiences. Among domestic visitors, the region has become known as a hub for mountain biking and other adventure activities. ECONOMY The Rotorua subregion receives around 3.7 million visitor nights per annum $773m was spent by visitors in the local economy to the year ending January Visitor spend is split almost equally between international and domestic visitors. Between 2009 and 2017 annual visitor spend grew by 87%. The compound annual growth rate was 7.2%. The growth in visitor numbers and spend is occurring largely through international visitors (from $196 million to $370 million between 2009 and 2016), with the share of visitor spend from international visitors rising from 41% to 48% over the same period. Domestic visitor numbers are also growing, albeit at a slower pace, at approximately 4-5% per annum. Overall, the Rotorua subregion has the strongest growth rate in the wider region at 7.1%. This high growth rate partially reflects the very strong rebound in international visitor stay in Rotorua and the very strong growth in the China visitor market over the same period.


5 EASTERN <5 500K NIGHTS 80 <5% GDP 500K 80% ARE S The Eastern Bay of Plenty subregion incorporates the Whakatāne District, the Opotiki District and the Kawerau District. The region covers an area of 7,528km2 and has a total population of 51,000. Whakatāne District is the largest with an area of 4,400km2 and a population of 35,000. Opotiki has an area of 3104km2 and a population of 9,000. Kawerau covers 22km2 and has a population of 6,800. The landscape of the district is diverse, with unspoiled coastline featuring white sand beaches and surf along the coast, the Raukumara mountain range and Te Urewera in the interior, and rugged hills and rockier beaches to the east. There are a number of offshore islands in this subregion, the largest being Moutohora/Whale Island which dominates the view out to sea from Whakatāne. As well, the iconic marine volcano Whakaari / White Island is an important feature of the region. About 50% of the population identify as Maori, and culture and heritage form a very strong feature of the subregion with many historic sites and authentic visitor experiences on offer. 25% GROWTH P.A. 3.2% 25 ECONOMY Visitor spend in the Eastern Bay or Plenty subregion reached $155m in calendar year 2016, up from $142m in Domestic visitors accounted for 77% of this spending, down slightly from 78% in The region captures 7% of all visitor spend in the wider Bay of Plenty region. The annual spend in the subregion has grown 25% since 2009, a compound annual growth rate of 3.2%, however, compared to other destinations in the wider Bay of Plenty region this represents a declining market share. Spending patterns in the subregion are highly seasonal with prominent peaks in December and January, during the longer period of elevated demand between October and April. May and August are the two months with the lowest spend. ECONOMY STRATEGY
6 The wider Bay of Plenty region has significant potential as a premier visitor destination. It currently attracts significant numbers of domestic and international visitors. Total visitor spend within the region makes up 9% of national tourism spend, with the opportunity to increase this percentage by strategic investment in the region, combined with effective marketing of the destination. Greater involvement of the tourism industry is required with the agencies responsible for planning and funding core infrastructure. Long-term planning is involved, and the early inclusion of tourism requirements will assist in supporting tourism economy growth. The wider region will require significant additional product development if it is to remain a destination of choice for both domestic and international visitors. The industry is expected to respond to future demand by developing new attractions and activities across the wider region. Key tourism projects have been identified at the sub-regional level which have the potential to act as catalysts for the further growth of the tourism economy A more coordinated and cohesive marketing approach is warranted which factors in the options of touring routes as well as hub and spoke models of visitor behaviours. To achieve these changes, new approaches to marketing the destination and promoting the diversity of experiences on offer will be required. The Bay of Plenty growth ambition will only be realised if there is a significant improvement in the quality and quantity of key infrastructure to support existing visitation and enable further growth. This will be achieved by increased investment by both the public and private sector. BACKGROUND The 2015 Toi Moana Bay of Plenty Regional Growth Study identified the need for central and local government, iwi, industry and the community to work together to identify the regional priority actions for tourism, with the goal of growing the visitor economy to $2.5b by Subsequent growth in the visitor economy has resulted in expenditure in the wider Bay of Plenty already reaching $2.34b in This growth reflects improved visitor spending, as well as rapid increases in visitor expenditure at tourism hot spots in the region. Continued growth in the visitor economy will see a need for investment in infrastructure to enable growth to be achieved. The wider Bay of Plenty region covers a large triangle of the eastern and central North Island. It stretches from Waihi Beach in the north, down to the peak of Mt Ruapehu, and east to Opotiki. The region spans from mountain to sea, with everything in between. The resident population of the region is 268,000, with Tauranga and Rotorua the two main cities. Tauranga has experienced significant population growth in recent years and is now New Zealand s fifth largest city. There has been some population increase in Taupo and other centres, but the long- term population forecast for the rest of the region is static and smaller centres are forecast to decline. In addition, major population growth is a contributor to increased business travel and provides additional demand for tourism services. ECONOMY Visitor spend in the wider Bay of Plenty region was $2.304b in the 2016 calendar year, up from $2.131b in This represents around 9% of the total national tourism spend and is comparable to the tourism spend in the Wellington region, 1.5 times the visitor spend in Queenstown or around one-third of the total tourism spend in Auckland. Domestic visitors accounted for 66% of the visitor spend in the region. This spend represents around 10% of the total domestic sector tourism spend in New Zealand. The region has significant domestic visitation. It has a peak season during December and January and good visitation over the other summer months of February and March, especially to beach locations such as Waihi Beach, Mt Maunganui and Ohope. Visitation then falls over the winter with peaks during school holiday periods. International visitors generally follow the same seasonal pattern. ECONOMY STRATEGY
WIDER BAY OF PLENTY Regional Tourism Strategy
 WIDER BAY OF PLENTY Regional Tourism Strategy Final Report February 2018 SUMMARY BACKGROUND The Toi Moana Bay of Plenty Regional Growth Study 2015, identified the need for central and local government,
$244 $45 OVERVIEW National Land Transport Programme Bay of Plenty BAY OF PLENTY REGIONAL SUMMARY
 2015 18 National Land Transport Programme Bay of Plenty BAY OF PLENTY REGIONAL SUMMARY OVERVIEW Transport investment in the Bay of Plenty is targeted to support significant residential growth, new industrial
Quick quarterly statistics
 Issue 21 tember 218 Quick quarterly statistics page 1 Economic activity quarterly page 2 Employment quarterly page 3 Household welfare quarterly page 4 Tourism activity annual page 5 Spotlight Cruise ship
ROTORUA REGIONAL AIRPORT
 ROTORUA REGIONAL AIRPORT TRANS-TASMAN DEMAND AND ECONOMIC IMPACT ASSESSMENT PREPARED FOR ROTORUA DISTRICT COUNCIL BY APR CONSULTANTS SEPTEMBER 2005 EXECUTIVE SUMMARY This report presents information on
KICKING FOR 22. BOPRU Strategy July 2017
 KICKING FOR 22 Strategy July 2017 11.5k Registered players in 2017 Highest number of Maori players in NZ OVERVIEW # 1 The Bay of Plenty Rugby Sevens Strategy was first developed in 2013 in partnership
Candidate Info Pack Kawerau District Council
 Candidate Info Pack Kawerau District Council Chief Executive Officer July 2017 Contents Page Number Background 3 The District & Getting There 4 Community Profile 5 Mayor & Councillors 6 The Council 7 2
AUCKLAND DESTINATION OVERVIEW
 AUCKLAND DESTINATION OVERVIEW JUNE 218 An in-depth overview of Auckland s visitor economy from the latest arrival, accommodation, spend and cruise data through to past five-year commentary. Prepared July
6 Road infrastructure
 6 Road infrastructure 51 ƨƨsummary New Zealand does not score highly for its road infrastructure when compared to other developed nations. This may partly be due to geography and population size, which
Economic Impact of Tourism in South Dakota, December 2018
 Economic Impact of Tourism in South Dakota, 2018 December 2018 1) Key Findings Growth rebounds in 2018 as a strong hunting season drives tourism growth Key facts about South Dakota s tourism sector Key
Section 2a. District profile
 Section 2a District profile District Profile The Hauraki District contains a diversity of land, communities and economies. Our location puts us in the golden triangle between Auckland, Tauranga and Hamilton,
AUCKLAND DESTINATION OVERVIEW
 AUCKLAND DESTINATION OVERVIEW September 218 An in-depth overview of Auckland s visitor economy from the latest arrival, accommodation, spend, cruise and event data through to past five- commentary. Prepared
AUCKLAND DESTINATION OVERVIEW
 AUCKLAND DESTINATION OVERVIEW October 218 An in-depth overview of Auckland s visitor economy from the latest arrival, accommodation, spend, cruise and event data through to past five- commentary. Prepared
AUCKLAND DESTINATION OVERVIEW
 AUCKLAND DESTINATION OVERVIEW JULY 218 An in-depth overview of Auckland s visitor economy from the latest arrival, accommodation, spend and cruise data through to past five-year commentary. Prepared August
NEW ZEALAND REGIONAL TOURISM FORECASTS
 NEW ZEALAND REGIONAL TOURISM FORECASTS 21-216 LAKE TAUPO RTO AUGUST 21 www.tourismresearch.govt.nz Tourism Strategy Group Ministry of Economic Development Contents Introduction 1 1. Summary for Lake Taupo
NEW ZEALAND REGIONAL TOURISM FORECASTS
 NEW ZEALAND REGIONAL TOURISM FORECASTS 21-216 ROTORUA RTO AUGUST 21 www.tourismresearch.govt.nz Tourism Strategy Group Ministry of Economic Development Contents Introduction 1 1. Summary for Rotorua RTO
NEW ZEALAND REGIONAL TOURISM FORECASTS
 NEW ZEALAND REGIONAL TOURISM FORECASTS 21-216 QUEENSTOWN RTO AUGUST 21 www.tourismresearch.govt.nz Tourism Strategy Group Ministry of Economic Development Contents Introduction 1 1. Summary for Queenstown
Waikato Plan. A SUMMARY Building champion communities, together. August 2017
 Waikato Plan A SUMMARY Building champion communities, together August 2017 The mighty Waikato region is a place of powerful possibilities. Forged by a proud history and shared excitement about the future,
NEW ZEALAND REGIONAL TOURISM FORECASTS
 NEW ZEALAND REGIONAL TOURISM FORECASTS 21-216 NELSON RTO AUGUST 21 www.tourismresearch.govt.nz Tourism Strategy Group Ministry of Economic Development Contents Introduction 1 1. Summary for Nelson RTO
Commerce Committee. 2015/16 Estimates Examination. Vote Business, Science and Innovation. Tourism Portfolio
 Commerce Committee 2015/16 Estimates Examination Vote Business, Science and Innovation Tourism Portfolio Ministry of Business, Innovation and Employment Responses Supplementary Questions 124-131 June 2015
Unravelling regional insight
 Unravelling regional insight By Steve Riley, TIA Insight Specialist (May 2017) Introduction While national-level insight provides a clear picture of how the tourism industry performs in New Zealand, a
AUCKLAND DESTINATION OVERVIEW
 AUCKLAND DESTINATION OVERVIEW AUGUST 218 An in-depth overview of Auckland s visitor economy from the latest arrival, accommodation, spend and cruise data through to past five- commentary. Prepared September
Tourism, the Distribution Channel and working with ITOC
 Tourism, the Distribution Channel and working with ITOC 25 August 2011 Presentation Lesley Immink, Chief Executive Inbound Tour Operators Council of New Zealand New name 2012: New Zealand Tourism Export
BEFORE THE QUEENSTOWN LAKES DISTRICT COUNCIL HEARINGS PANEL. UNDER the Resource Management Act 1991
 BEFORE THE QUEENSTOWN LAKES DISTRICT COUNCIL HEARINGS PANEL UNDER the Resource Management Act 1991 IN THE MATTER of the review of parts of the Queenstown Lakes District Council s District Plan under the
The Economic Impact of Tourism in Walworth County, Wisconsin. July 2013
 The Economic Impact of Tourism in Walworth County, Wisconsin July 2013 Key themes for 2012 The Walworth County, Wisconsin visitor economy continued its brisk growth in 2012. Visitor spending rose 11% after
Puhoi to Pakiri Area Visitor Strategy Research Programme:
 SUMMARY OF FINDINGS Puhoi to Pakiri Area Visitor Strategy Research Programme: Visitor, Business and Community Surveys The New Zealand Tourism Research Institute AUT University, Auckland, New Zealand www.nztri.org
Convention Centre Proposal. Have your say before we make a final decision later this year.
 Convention Centre Proposal Have your say before we make a final decision later this year. Conventions are important to cities because of the economic benefits they bring. Page 2 CONTENTS Introduction...3
Case study: outbound tourism from New Zealand
 66 related crime, less concerned about the stability and certainty offered by booking a package holiday, and may choose to be independent travellers, organizing their travel and itinerary themselves. Tourists
HOW SAFE ARE OUR ROADS? Tracking the safety performance of New Zealand s state highway network
 WAIKATO AND BAY OF PLENTY Regional results 0 What is KiwiRAP? KiwiRAP analyses the road safety ratings of New Zealand s (0+km/h) rural state highway network. KiwiRAP is part of an international family
1. FORECAST VISITATION FOR GREAT OCEAN ROAD
 1. FORECAST VISITATION FOR GREAT OCEAN ROAD 1.1. INTRODUCTION This section provides a 20-year forecast of visitation to the Great Ocean Road Region, modelled from Australian Tourism Forecast Committee
The Economic Impact of Tourism in Jacksonville, FL. June 2016
 The Economic Impact of Tourism in Jacksonville, FL June 2016 Highlights Visitor spending surpassed $2.0 billion in 2015, growing 4.4%. As this money flowed through Duval County, the $2.0 billion in visitor
The Economic Impact of Tourism in: Dane County & Madison, Wisconsin. April 2017
 The Economic Impact of Tourism in: Dane County & Madison, Wisconsin April 2017 Key themes for 2016 Visitor spending continued growing in Dane County, Wisconsin in 2016, growing 5.2% to surpass $1.2 billion.
Economic Contribution of Tourism to NSW
 Economic Contribution of Tourism to NSW 2015-16 Tourism is a significant part of the NSW economy. In 2015-16, tourism contributed $38.1 billion (Tourism Consumption) to the NSW economy and employed 261,100
Produced by: Destination Research Sergi Jarques, Director
 Produced by: Destination Research Sergi Jarques, Director Economic Impact of Tourism North Norfolk District - 2016 Contents Page Summary Results 2 Contextual analysis 4 Volume of Tourism 7 Staying Visitors
Produced by: Destination Research Sergi Jarques, Director
 Produced by: Destination Research Sergi Jarques, Director Economic Impact of Tourism Norfolk - 2016 Contents Page Summary Results 2 Contextual analysis 4 Volume of Tourism 7 Staying Visitors - Accommodation
Transport Indicators Report June 2018
 Transport Indicators Report June 2018 Board Meeting 21 August 2018 Recommendation That the Board: i. Receives this report. Executive summary 1. The attached Monthly and Quarterly Indicator Reports provide
Mood of the Nation New Zealanders' perceptions of international visitors. March 2018
 Mood of the Nation New Zealanders' perceptions of international visitors March 2018 Contents 1 Background and approach 3 2 Key insights 6 3 Detailed insights 10 4 Appendix: measures by region 31 2 1 Background
Tourism Export Council New Zealand &
 Tourism Export Council New Zealand & Tourism Distribution Channels February 2015 Tourism Export Council who are we, what do we do? Founded 1971 Private sector 50 Inbound tour operator members (ITOs) 200
2016 Waikato and Bay of Plenty Airspace Review v1.1
 2016 Waikato and Bay of Plenty Airspace Review v1.1 Civil Aviation Authority Table of Contents 1. 2016 Waikato and Bay of Plenty airspace review... 1 2. Review Process... 1 Scope of review... 1 a) Airways
PUHOI TO PAKIRI VISITOR SURVEY UPDATE. ( Simon Milne New Zealand Tourism Research Institute
 PUHOI TO PAKIRI VISITOR SURVEY UPDATE (www.regionalsurveys.co.nz) Simon Milne New Zealand Tourism Research Institute 1 There are three partners in this research - all contributing time, money, energy and
Common Assessment Task
 Common Assessment Task Unit Standard 24731 Demonstrate knowledge of destination New Zealand Level: 2 Credit: 4 Version: 2 School: Student Name: Date of Assessment: Demonstrate knowledge of destination
Quick Start Track 1: Hokianga to Opua/Russell
 Quick Start Track 1: Hokianga to Opua/Russell Kaikohe to Okaihau section PROJECT DESCRIPTION The overall opportunity is to develop a 90-kilometre trail from the Hokianga Harbour on the West coast through
Strong Demand Pushing Hotels to Choking Point
 New Zealand, H1 2017 Strong Demand Pushing Hotels to Choking Point OCCUPANCY 0.4 p.p. ADR 11.8% y-o-y RevPAR 12.4% y-o-y International Arrivals 10.2% y-o-y Chart 1: International Visitor Arrivals 3,800,000
STRATEGIC INVESTMENT IN MANCHESTER AIRPORT
 Report To: EXECUTIVE CABINET Date: 7 February 2018 Cabinet Deputy/Reporting Officer: Subject: Report Summary: Cllr Bill Fairfoull Executive Member (Finance & Performance) Tom Wilkinson, Assistant Director
ROTORUA INTEGRATED NETWORK STRATEGY
 ROTORUA INTEGRATED NETWORK STRATEGY 2012-2042 May 2013 This photo provided by RDC Cover photos provided by RDC and BOPRC Contents Context Issues for the Strategy to Address Outcomes and Interventions Implementation
Hamilton s Business Economy
 Hamilton s Business Economy Growth Indicator Report August 2017 hamilton.govt.nz/growth Contents 3. Introduction 4. New Commercial and Industrial Building Consents 6. Retail 8. Employment 9. Unemployment
CRUISE TOURISM S CONTRIBUTION TO THE NEW ZEALAND ECONOMY 2017
 CRUISE TOURISM S CONTRIBUTION TO THE NEW ZEALAND ECONOMY 2017 21 August 2017 CRUISE TOURISM S CONTRIBUTION TO THE NEW ZEALAND ECONOMY 2017 Prepared for New Zealand Cruise Association Document reference:
THE COROMANDEL: beyond
 THE COROMANDEL: beyond 2025 Cover: Whiritoa Beach This page: Cornish Pumphouse. EXECUTIVE summary The Coromandel was recently voted New Zealand s number one holiday destination *, which is exactly where
Queenstown Airport International Passenger Profile Update
 Queenstown Airport International Passenger Profile Update 12 months to 31 January 2017 Published at 6 March 2017 This report, based on data from Statistics NZ, shows the profile of passengers on trans-tasman
NZ price index relative to peak
 Media release 10 February Property value growth rate slows The latest monthly property value index shows that nationwide residential values for January have increased 9.6% over the past year, and 2.2 over
Air passenger travel projection models. Haobo Wang, Ministry of Transport
 Air passenger travel projection models Haobo Wang, Ministry of Transport Contents Background Origin and destination based air passenger projections Leg-based air passenger projections Summary and implications
2016/17 Annual review of the New Zealand Tourism Board
 2016/17 Annual review of the New Zealand Tourism Board Report of the Economic Development, Science and Innovation Committee March 2018 Contents Recommendation... 2 Introduction... 2 Financial and performance
Queenstown. newzealand.com. youth. Market information about our Visitors and our Active Considerers
 Queenstown youth Market information about our Visitors and our Active Considerers newzealand.com PAST VISITORS HISTORIC VIEW TOTAL ARRIVALS YE SEPTEMBER 2017 CHINA 408K 11% JAPAN 102K 3% UK 246K 7% Fiordland
Castlepoint, Wararapa. newzealand.com. japan. Market information about our Visitors and our Active Considerers
 Castlepoint, Wararapa japan Market information about our Visitors and our Active Considerers newzealand.com PAST VISITORS HISTORIC VIEW TOTAL ARRIVALS YE SEPTEMBER 2017 CHINA 408K 1 JAPAN 102K UK 246K
Economic Contribution of Tourism to NSW
 Economic Contribution of Tourism to NSW 2013-14 Tourism is a significant part of the NSW economy. In 2013-14, tourism contributed $34.9 billion (Tourism Consumption) to the NSW economy and employed 272,000
Economic Impact of Tourism in South Dakota, December 2017
 Economic Impact of Tourism in South Dakota, 2017 December 2017 1) Key findings 1) Growth continues in 2017 but pales against the event driven years of 2015 and 2016 in South Dakota Key facts about South
Tourism Satellite Account Calendar Year 2010
 The Economic Impact of Tourism in Georgia Tourism Satellite Account Calendar Year 2010 Highlights The Georgia visitor economy rebounded in 2010, recovering 98% of the losses experienced during the recession
Produced by: Destination Research Sergi Jarques, Director
 Produced by: Destination Research Sergi Jarques, Director Economic Impact of Tourism Norfolk - 2017 Contents Page Summary Results 2 Contextual analysis 4 Volume of Tourism 7 Staying Visitors - Accommodation
4NIGHTS NORTHERN ESCAPE NEW ZEALAND GV2 SIC
 4NIGHTS NORTHERN ESCAPE NEW ZEALAND GV2 SIC DAY 1 - ARRIVE AUCKLAND On arrival, guests will be met and privately transferred to hotel. DAY 2 - AUCKLAND BAY OF ISLANDS (B) Travel north ever Auckland s Harbor
The Economic Impact of Tourism in North Carolina. Tourism Satellite Account Calendar Year 2015
 The Economic Impact of Tourism in North Carolina Tourism Satellite Account Calendar Year 2015 Key results 2 Total tourism demand tallied $28.3 billion in 2015, expanding 3.6%. This marks another new high
Palmerston North Retailing
 Palmerston North Retailing Introduction and General Experience My name is Peter Crawford and I am the Economic Policy Advisor for Palmerston North City Council. My qualifications include a BA (geography
Tourism Statistics
 Tourism Statistics 2006-2010 TABLE OF CONTENTS FOREWORD 4 DEFINITIONS 5 STATISTICAL SUMMARY FOR 2010 6 INTERNATIONAL TOURIST ARRIVALS 7 International Tourist Arrivals: 1994-2010 7 International Tourist
BERL Regional Rankings 2011
 BERL Regional Rankings 2011 Jason Leung-Wai Kelly Dustow Wilma Molano BERL #5214 BERL Regional Rankings 2011 1 Summary... 2 2 Introduction... 3 3 The Economic Context... 5 3.1 International... 5 3.2 National...
Produced by: Destination Research Sergi Jarques, Director
 Produced by: Destination Research Sergi Jarques, Director Economic Impact of Tourism Oxfordshire - 2016 Economic Impact of Tourism Headline Figures Oxfordshire - 2016 number of trips (day & staying) 27,592,106
Department of Conservation National Survey Report 1: Quintessentially Kiwi
 Department of Conservation National Survey Report 1: Quintessentially Kiwi Survey conducted: June 2011 Reporting produced: September 2011 Contents 1.0 Methodology... 3 2.0 Findings... 5 2.1 Places... 5
Values increasing throughout most of the country. NZ price index relative to peak
 Media release 11 th February Values increasing throughout most of the country The latest monthly property value index shows that nationwide residential values increased further in January. Values are up
International Tourism Snapshot
 Australia on a high International visitors to Australia Australia welcomed 7.8m international visitors in the year ending June International visitor expenditure in Australia 2017, more than any previous
2. Recommendations 2.1 Board members are asked to: i. note the content of the May 2018 Renfrewshire Economic Profile.
 To: Leadership Board On: 20 June 2018 Report by: Director of Development and Housing Services Heading: Renfrewshire Economic Profile May 2018 1. Summary 1.1 This report is the second edition of a revised
Produced by: Destination Research Sergi Jarques, Director
 Produced by: Destination Research Sergi Jarques, Director Economic Impact of Tourism Oxfordshire - 2015 Economic Impact of Tourism Headline Figures Oxfordshire - 2015 Total number of trips (day & staying)
Grampians Tourism Strategic Plan
 Grampians Tourism 2016-20 Strategic Plan Grampians Tourism Board Inc. June 2016 BACKGROUND Grampians Tourism Board Inc. has developed a new four-year strategic plan to develop the Visitor Economy in the
March Future Capacity Requirements in Greater Copenhagen
 March 2019 Future Capacity Requirements in Greater Copenhagen Table of contents 1: Introduction 3 2: Accommodation Demand Forecasts 11 3: Accommodation Capacity Forecasts 27 4: Alternative Demand Assumptions
TOURISM: SUPERCHARGING AUSTRALIA S FUTURE
 TOURISM: SUPERCHARGING AUSTRALIA S FUTURE In partnership with ABOUT TTF The Tourism & Transport Forum (TTF) is the peak industry group for the Australian tourism, transport, aviation and investment sectors.
Conventions & business events Grow market share of business events from 9% to 10%
 Visitor nights 5% increase of total visitor guest nights vs national Visitor spend 5% increase in visitor spend across the region Conventions & business events Grow market share of business events from
Domestic Youth Visitors to NSW
 Domestic Youth Visitors to NSW Year Ended June 2017 INTRODUCTION Destination NSW defines Youth or Millennials as persons aged 15 to 29. In partnership with Tourism Research Australia, qualitative research
Commercial Accommodation Monitor: April 2017
 Commercial Accommodation Monitor: April 2017 Hawke s Bay i Reproduction of material Material in this report may be reproduced and published, provided that it does not purport to be published under government
The Great New Zealand River Ride
 The Great New Zealand Overview River Ride The concept of the national cycleway was proposed at the Employment Summit in February 2009 by the newly elected National government. Objectives for the Cycleway
NZ price index relative to peak
 Media release 7 April, 2014 Residential property value growth plateaus The latest monthly property value index shows that nationwide residential values for March have increased 8.8% over the past year,
Waikato Regional Economic Development Strategy
 Waikato Regional Economic Development Strategy 1 TO FROM Economic Development Committee Ben Dunbar-Smith - Economic Development Programme Manager DATE 6 April 2016 SUBJECT Waikato Regional Economic Development
Commercial Accommodation Monitor: December 2017
 Commercial Accommodation Monitor: December 2017 Queenstown i Reproduction of material Material in this report may be reproduced and published, provided that it does not purport to be published under government
Economic Impact of Tourism. Norfolk
 Economic Impact of Tourism Norfolk - 2009 Produced by: East of England Tourism Dettingen House Dettingen Way, Bury St Edmunds Suffolk IP33 3TU Tel. 01284 727480 Contextual analysis Regional Economic Trends
Mood of the Nation New Zealanders' perceptions of international visitors
 Mood of the Nation New Zealanders' perceptions of international visitors Contents 1 Background and approach 3 2 Key insights 6 3 Detailed insights 10 4 Appendix: measures by region 31 2 1 Background and
Produced by: Destination Research Sergi Jarques, Director
 Produced by: Destination Research Sergi Jarques, Director Economic Impact of Tourism Epping Forest - 2014 Economic Impact of Tourism Headline Figures Epping Forest - 2014 Total number of trips (day & staying)
ABOUT HOSPITALITY NEW ZEALAND
 Election Manifesto ABOUT HOSPITALITY NEW ZEALAND Hospitality New Zealand (HNZ) is a member-led, not-forprofit organisation representing the largest membership group in our tourism industry. With approximately
Chart 2. International Student Nights in NSW
 International Student Visitors to NSW Year Ended March 2017 INTRODUCTION The International Education segment in Australia and NSW has had a resurgence and is growing. According to the Department of Education
The Economic Impact of Tourism on Guam. Tourism Satellite Account Calendar Year 2016
 The Economic Impact of Tourism on Guam Tourism Satellite Account Calendar Year 2016 Highlights! 2016 was a banner year for tourism on Guam, with visitation to Guam surpassing 1.5 million and visitor spending
The performance of Scotland s high growth companies
 The performance of Scotland s high growth companies Viktoria Bachtler Fraser of Allander Institute Abstract The process of establishing and growing a strong business base is an important hallmark of any
Minister of Tourism Kelvin Davis - TRENZ speech to media 10 May 2018
 1 Minister of Tourism Kelvin Davis - TRENZ speech to media 10 May 2018 Introduction Tourism is an economic bedrock. It s our biggest export earner, employs hundreds of thousands of people, and the industry
Commercial Accommodation Monitor: October 2017
 Commercial Accommodation Monitor: October 2017 Hawke s Bay i Reproduction of material Material in this report may be reproduced and published, provided that it does not purport to be published under government
The Economic Impact of Tourism in Hillsborough County. July 2017
 The Economic Impact of Tourism in Hillsborough County July 2017 Table of contents 1) Key Findings for 2016 3 2) Local Tourism Trends 7 3) Trends in Visits and Spending 12 4) The Domestic Market 19 5) The
Risk Maps. Risk Maps how the sections were identified
 2007-2011 Risk Maps Risk Maps how the sections were identified For the purpose of comparing the level of risk of crashes between different parts of the network, the state highway network was broken up
Economic Impact of Tourism in Hillsborough County September 2016
 Economic Impact of Tourism in Hillsborough County - 2015 September 2016 Key findings for 2015 Almost 22 million people visited Hillsborough County in 2015. Visits to Hillsborough County increased 4.5%
Te Awa is a shared cycle/walkway travelling 70 kms along the banks of New Zealand s largest & longest river the Mighty Waikato.
 Te Awa is a shared cycle/walkway travelling 70 kms along the banks of New Zealand s largest & longest river the Mighty Waikato. Project completion date 2013 Ngaruwahia - Hamilton Completion Early 2012
The Economic Impact of Travel in Minnesota Analysis
 The Economic Impact of Travel in Minnesota 2013 Analysis Overview 2013 Highlights Traveler Spending Traveler spending of $10.3 billion generated $17.6 billion in total business sales in 2013 as travel
Cultural and Heritage Tourism to NSW
 Cultural and Heritage Tourism to NSW Year Ended December 2017 This snapshot provides a profile of cultural and heritage 1 to New South Wales in the year ended (YE) December 2017. 2 VISITOR MARKET SIZE
New Zealand Transport Outlook. Leg-Based Air Passenger Model. November 2017
 New Zealand Transport Outlook Leg-Based Air Passenger Model November 2017 Short name Leg-Based Air Passenger Model Purpose of the model The Transport Outlook Leg-Based Air Passenger Model projects domestic
NZ price index relative to peak
 Media release 13 th March 2012 Nationwide values continue to increase Nationwide residential property values have continued to gradually increase according to the QV index for February. Values are up 1.1%
TOURISM NEW ZEALAND OUR VISITORS UNDERSTANDING HISTORIC VIEW TOTAL ARRIVALS YE JUNE 2016
 TOURISM JAPAN 94K NEW ZEALAND UNDERSTANDING OUR VISITORS GERMANY 91K CHINA 397K 1 UK 214K 7% USA 258K 8% Our market infographics are drawn from two different sources. HISTORIC VIEW: Past Visitor Research
Australia & New Zealand
 Strategy Management Consultancy Australia & New Zealand Regional Analysis k n o w l e d g e c e n t e r 2017 linesight.com/knowledge Contents Australia Australia Market Review 3 Macro indicators 4 Australia
1 INFORMATION REQUIREMENTS
 1 INFORMATION REQUIREMENTS 1.1 BACKGROUND 2 1.2 WHAT IS THE DISTRICT PLAN 3 1.3 DISTRICT PLAN STRUCTURE 4 1.4 HOW TO USE THE DISTRICT PLAN 5 1.5 STRATEGIC FRAMEWORK 6 Whanganui District Plan (15 January
Queensland Tourism Aviation Blueprint to 2016
 Queensland Tourism Aviation Blueprint to 2016 tq.com.au Blueprint outline The purpose of the Queensland Tourism Aviation Blueprint to 2016 is to develop the strategic framework that will guide aviation
The Economic Impact of Tourism in North Carolina. Tourism Satellite Account Calendar Year 2013
 The Economic Impact of Tourism in North Carolina Tourism Satellite Account Calendar Year 2013 Key results 2 Total tourism demand tallied $26 billion in 2013, expanding 3.9%. This marks another new high