Source: Statistics New Zealand International Visitor Arrivals. Aug Visitors aged year old.
|
|
|
- Tamsyn Smith
- 6 years ago
- Views:
Transcription
1 1

2 2 Source: Statistics New Zealand International Visitor Arrivals. Aug Visitors aged year old.
3 3

4 4 Desktop Research (IVA) Who are our current Youth visitors?
5 Arrivals (k) Stay Days (m) Expenditure $m Total Visitors 2,991k ,152.0m Youth Visitors 603k 18.7 $1,794.6m % Youth 20% 32% 22% Purpose of Visit Arrivals (k) Stay Days (m) Expenditure $m Holiday 323.7k 8.4m $1,129.6m Education 30.1k 3.5m VFR 161.9k 3.3m $300.3m Business 36.1k 0.8m Other 51.0k 2.7m Total 602.9k 18.7 $1,794.6m 5 Source: Statistics New Zealand International Travel and Migration June 2015; MBIE International Visitor Survey March 2015 Where cells are blank sample size is insufficient, expenditure is ages 15-29
6 Arrivals (k) Stay Days (m) Expenditure $m Total Holiday Visitors 1, $5,014.9m Youth Holiday Visitors m $1,129.6m % Youth 22% 36% 23% 6 Source: Statistics New Zealand International Travel and Migration June 2015; MBIE International Visitor Survey March 2015 Where cells are blank sample size is insufficient, expenditure is ages 15-29
7 7 Source: Statistics New Zealand International Travel and Migration June 2015
8 8 Source: Statistics New Zealand International Travel and Migration June 2015
9 9 Source: Statistics New Zealand International Travel and Migration June 2015
10 Youth All ages Youth Holiday Arrivals by Season Youth Youth excl. AU All Ages 45,000 40,000 35,000 30,000 25,000 20,000 15,000 10,000 5, , , , ,000 50, Source: Statistics New Zealand International Travel and Migration Mar 2015
11 Holiday Arrivals Oct 14- Mar 15 variance vs. April -Sep 14 49% 84% Youth Variance Total Variance Holiday Arrivals excl. AU Oct 14- Mar 15 variance vs. April -Sep 14 98% 134% Youth Variance Total Variance Source: Statistics New Zealand International Travel and Migration Mar
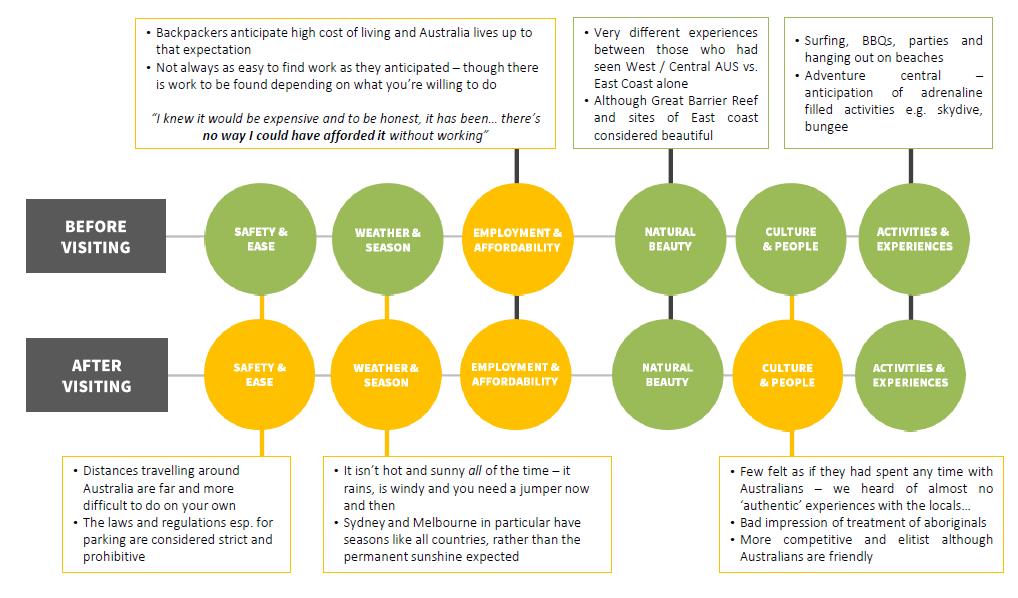
12 Australia drives 40% of Youth holiday arrivals. China, USA, Germany and the UK are equal second to Australia, each driving approximately 25,000 Youth holiday arrivals. Youth holiday arrivals are important to the European markets driving 40%+ of total holiday arrivals and 60%+ of total stay days in Germany and France. While Youth follow the same seasonal trend and total holiday arrivals, the seasonal curve is flatter with skiing out of Australia a key opportunity to drive spikes of arrivals in winter. 12
13 13
14 Below are the key visitor profiles based travel behaviour, demographics and type of holiday. Backpackers Key travel behaviour: Long length of stay. Stays in New Zealand for over 4 weeks Stays in low cost accommodation Bus as key form of transport Significantly profiles at the younger end of the Youth sector years-old Young Independent Professionals Key travel behaviour: Length of stay within annual leave. Stays in New Zealand for 2 weeks or less Stays primarily in hotels and motels Participates in a self-drive holiday Significantly profiles at the older end of the Youth sector years-old Backpackers Young Independent Professionals
15 The two sub-segments are of approximate equal value. 15
16 Backpackers represent a valuable, distinct segment that requires a unique product set and messaging. Therefore we need to specifically target this segment with highly relevant intervention. Value of Backpackers Arrivals (k) Stay Days (m) Expenditure $m Total Holiday Visitors 1,460, m $5,014.9m Youth Holiday Visitors 323, m $1,129.6m Backpacker Holiday Visitors 159, m 593.0m % Backpacker of Total 10.8% 21.2% 11.8% 16
17 Market Pop. (18-24) ACs (18-24) AC Pool Arrivals (18-24) Conversion Rate YOY Growth 1 Australia 2.2m 25.6% 0.6 m 59.7k ski! 10.3% 12% 2 Germany 6.5m 14.4% 0.9m 15.5k 1.6% 7% 3 USA 31.4m 10.1% 3.1m 13.1k 0.4% 9% 4 UK 5.9m 11.9% 0.7m 12.8k 1.8% 15% 5 China n/a 53.4% n/a 9.1k 28% 6 Japan (20-24) 6.2m 3.5% 0.2m 4.3k 1.9% 16% 7 France 5.3m n/a 3.9k 16% 8 Canada 3.4m n/a 3.6k 4% 9 Korea n/a n/a 3.0k 26% 10 Sweden (20-24) 0.26m n/a 2.9k -3% * The AC pool in each market is populated by the percentage of ACs in each market applied to the year old population. 17 Sources: Stats NZ International Travel and Migration YE June 2015, TNS AC Monitor June 2015; Tourism Research Australia
18 18-24 Arrivals by Market Size, Growth and Mix Size of bubble = holiday arrivals 18 Source: Statistics New Zealand International Travel and Migration June 2015
19 18-24 Year Length of Stay Breakdown Up to 1 Week 1-2 Weeks 2-3 Weeks 3-4 weeks 4+ weeks 100% 90% 80% 70% 60% 28% 42% 6% 49% 67% 57% 54% 60% 49% 26% 32% 31% 31% 36% 50% 40% 30% 20% 10% 0% All Markets All Markets excl. AU Australia UK Germany France Aust-Swtiz Benelux Northern Europe China Japan India USA Canada 19 Sources: Stats NZ International Travel and Migration YE June 2015
20 Market Backpacker Arrivals into the Market Transient Arrivals into NZ Conversion Rate YOY Growth Australia 0.59m 23.3k* 4%* n/a Singapore k* Note: Singapore is the next largest destination visited by year olds prior to New Zealand. Best transient backpacker definition using IVS: Holiday Arrival Aged 15-24* Not Australian Visited Australia Prior to New Zealand Change in IVS Survey means we only have three quarters (Dec 14, Mar 15, Jun 15) of this measure with small sample sizes (38 in Dec 14 and 30 in Mar 15). Seasonal factors will apply with full data not available until Sep 15 IVS (released in Nov 15). Sample size is too low to drill into transient backpacker arrivals by market (home country). * Data is based off of only three quarters of data.
21 There are two key segments within Youth holiday arrivals Backpackers and Independent Professionals. Backpackers are a distinct segment unique to the Youth sector - providing 11% of the total holiday arrivals and expenditure. The key Backpacker opportunities appear to be Europe and European Backpackers in Australia based on their volume, share of arrivals from the market and stay days they provide. 21
22 22 Qualitative Research Understanding Backpackers

23 23
24 The dream of true discover that backpacker seek when they travel underpins why they backpacker and where they choose to go to fulfil their desires. No two journeys are the same unpredictable, spontaneous, easily swayed Now or never last opportunity for total freedom; a rite of passage Financially naïve avoiding the bank of mum and dad is key Sociability is key interact with another culture AND like-minded travellers Backpacking is an investment 24
25 25
26 26
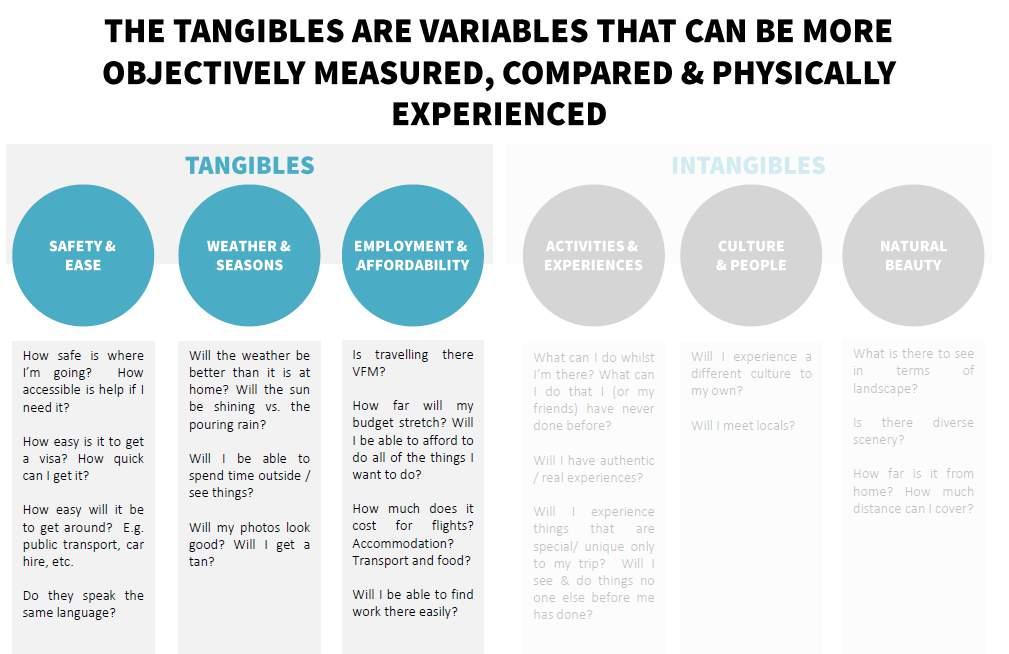
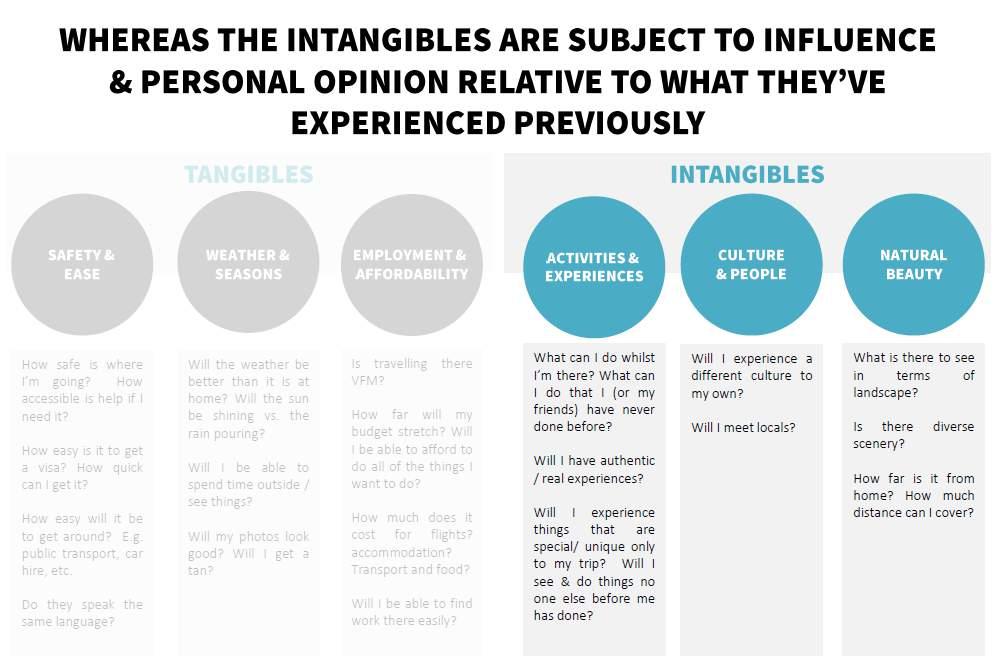
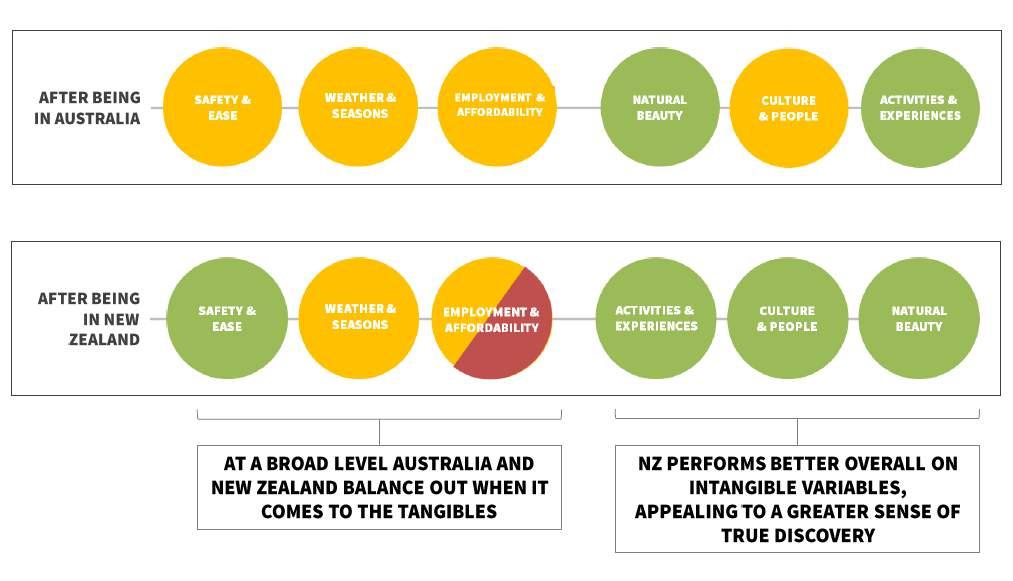
27 27
28 28
29 29


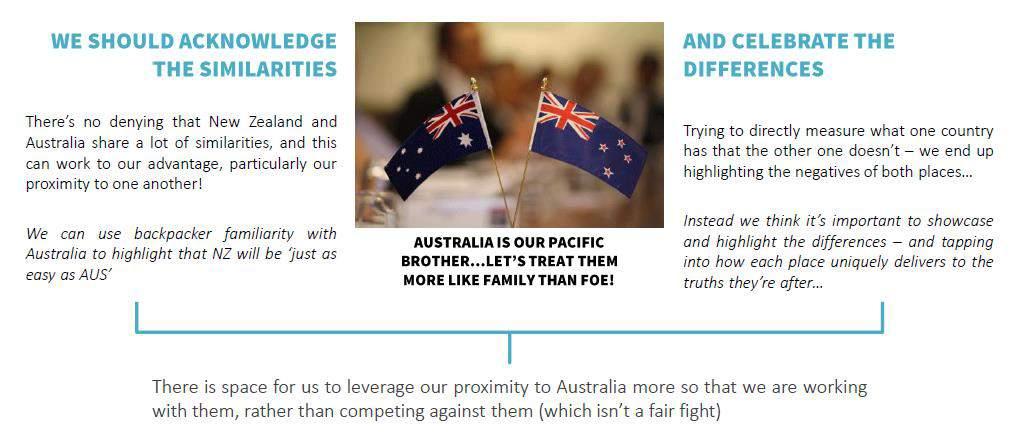
30
31 31
32 32


33 33
34 Insights 1. Make it or break it Being a Backpacker is a life phase Backpacking is a rite of passage only available at a certain point in their life It helps them to discover themselves and the world Proving that they are adults to both themselves and their parents Implications/Actions Focus on the age demographic where this life stage primarily sits. 2. Diving into the unknown Safety, ease and money are key travel planning factors Backpackers are typically inexperienced - with this being their first long-haul travel on their own They have a significant focus on the tangible variables (ease, safety, weather, affordability) in the destination decision-making process to help them feel in control Test propositions that include tangible messages (but not to the detriment of New Zealand s compelling emotional proposition). 34
35 Insights 1. Australia is awesome Australia is the iconic destination for backpackers. 2. I need a plan B A working holiday visa and employment provides the necessary safety net to make it on their own However, New Zealand is significantly overshadowed by Australia as a working holiday destination due to the popularity and perceived ease of obtaining the Australian Working Holiday Visa Implications/Actions Don t make backpackers choose between Australia or New Zealand. Activity will need to leverage the sale of Australian working holiday experiences to ensure NZ is an option and/or an extension. 3. Just get me there The typical backpacker organises flights and visas in their home country and purchases tours once they arrive in their destination. Flights and visas will likely be the most successful offer.
36 Insights 1. Backpacker travel is flexible and spontaneous The typical backpacker has only a confirmed start and proposed end date to their travel Everything else is planned along the way based on people they meet and their recommendations. Implications/Actions The opportunity to drive backpackers from Australia to New Zealand is strong. 2. Book before its gone! Key experiences and tours are booked shortly upon arrival in Australia to ensure they are locked in before they run out of money. Activity will need to leverage backpacker travel sellers to ensure New Zealand bookings are an extension of backpacker s Australian bookings. 3. Better than Oz? Backpackers in Australia consider New Zealand because it s close and they likely won t return; However, perceptions of New Zealand aside from being beautiful are that it is cold, has a low minimum wage and only offers adventure activities. They are hesitant to leave (amazing) Australia for somewhere that may not be as good therefore something truly unique will be required to pull them away. In order to drive travellers FOMO, product will need to be differentiated from Australia. 36
37 Backpacking is a life phase and rite of passage with true discovery being the motivator. For these relatively inexperienced travellers, the tangible travel factors are key to providing assurances and, with perceptions of these tangible elements greater for Australia than New Zealand, we need to find ways to address these via messaging and product. However, the New Zealand experience delivers a very positive true discovery experience. In order to successfully promote this positive New Zealand experience, we need to promote messages and product differentiated from Australia and that truly drive their FOMO whilst in this region of the world without trying to compete with Australia. The messaging and product requirements differ in Europe from Australia. 37
38 38 Questions?
Queenstown. newzealand.com. youth. Market information about our Visitors and our Active Considerers
 Queenstown youth Market information about our Visitors and our Active Considerers newzealand.com PAST VISITORS HISTORIC VIEW TOTAL ARRIVALS YE SEPTEMBER 2017 CHINA 408K 11% JAPAN 102K 3% UK 246K 7% Fiordland
TOURISM NEW ZEALAND OUR VISITORS UNDERSTANDING <1% <1% <1% HISTORIC VIEW TOTAL ARRIVALS YE APRIL 2017
 TOURISM JAPAN 102K 3% NEW ZEALAND UNDERSTANDING OUR VISITORS Our market infographics are drawn from two different sources. HISTORIC VIEW: Past Visitor Research This is information collected about those
Hokitika Gorge, West Coast. newzealand.com INDIA. Market information about our Visitors and our Active Considerers
 Hokitika Gorge, West Coast INDIA Market information about our Visitors and our Active Considerers newzealand.com PAST VISITORS HISTORIC VIEW TOTAL ARRIVALS YE MARCH 2018 AUS 1,495K 39% INDIA 63K 2% USA
Rotorua. newzealand.com. argentina. Market information about our Visitors and our Active Considerers
 Rotorua argentina Market information about our Visitors and our Active Considerers newzealand.com PAST VISITORS HISTORIC VIEW TOTAL ARRIVALS YE MARCH 2018 AUS 1,495K 39% INDIA 63K 2% USA 340K 9% GERMAN
AUCKLAND DESTINATION OVERVIEW
 AUCKLAND DESTINATION OVERVIEW JULY 218 An in-depth overview of Auckland s visitor economy from the latest arrival, accommodation, spend and cruise data through to past five-year commentary. Prepared August
AUCKLAND DESTINATION OVERVIEW
 AUCKLAND DESTINATION OVERVIEW JUNE 218 An in-depth overview of Auckland s visitor economy from the latest arrival, accommodation, spend and cruise data through to past five-year commentary. Prepared July
AUCKLAND DESTINATION OVERVIEW
 AUCKLAND DESTINATION OVERVIEW September 218 An in-depth overview of Auckland s visitor economy from the latest arrival, accommodation, spend, cruise and event data through to past five- commentary. Prepared
Youth/Backpacker Visitation to the Northern Territory. Year ending June 2017
 Youth/Backpacker Visitation to the Northern Territory Year ending June 2017 2 The following is a summary of information relevant to the Northern Territory tourism industry using visitation results from
AUCKLAND DESTINATION OVERVIEW
 AUCKLAND DESTINATION OVERVIEW AUGUST 218 An in-depth overview of Auckland s visitor economy from the latest arrival, accommodation, spend and cruise data through to past five- commentary. Prepared September
Latest Tourism Trends. Humphrey Walwyn Head of VisitEngland Research
 Latest Tourism Trends Humphrey Walwyn Head of VisitEngland Research 1 Inbound Tourism 2 2003 2004 2005 2006 2007 2008 2009 2010 2011 2012 2013 2014 2015 2016 2017 UK inbound long term trend Spend per visit
Queenstown Airport International Passenger Profile Update
 Queenstown Airport International Passenger Profile Update 12 months to 31 y 1 tember This report, based on data from Statistics NZ, shows the profile of passengers arriving or departing on TransTasman
Who s Staying in Our Parks?
 1 Who s Staying in Our Parks? VicParks Annual Conference 22/08/2017 Presented by Peter Clay GM for Research & Advocacy 2 WORKING COLLABORATIVELY WITH STATE ASSOCIATIONS Our research is undertaken in partnership
USING SPECIAL INTERESTS TO DRIVE TRAVEL. Chris Atkinson TNZ Marketing Communications Manager Sectors Wednesday 12 March, 9am
 USING SPECIAL INTERESTS TO DRIVE TRAVEL Chris Atkinson TNZ Marketing Communications Manager Sectors Wednesday 12 March, 9am Agenda 1. Introduction 2. Special Interest (SI) overview and definition 3. Recap:
AFTA Travel Trends. July 2017
 AFTA Travel Trends July 2017 AFTA Travel Trends Report 2017 Inbound and Outbound overview Introduction This snapshot provides an overview of the balance of trade between Inbound and Outbound Travel for
Blue Mountains Visitors. International overnight, domestic overnight and domestic daytrip visitors. Sep-11. Jun-11. Sep-10. Dec-10. Dec-11.
 Dec-08 Mar-09 Jun-09 Sep-09 Dec-09 Mar-10 Jun-10 Sep-10 Dec-10 Mar-11 Jun-11 Sep-11 Dec-11 Mar-12 Jun-12 Sep-12 Dec-12 Mar-13 Jun-13 Sep-13 Dec-13 Mar-14 Jun-14 Sep-14 Visitors (000's) OVERVIEW LGA PROFILE
OVERVIEW Four year annual average to the year ending September 2014
 Dec-08 Mar-09 Jun-09 Sep-09 Dec-09 Mar-10 Jun-10 Sep-10 Dec-10 Mar-11 Jun-11 Sep-11 Dec-11 Mar-12 Jun-12 Sep-12 Dec-12 Mar-13 Jun-13 Sep-13 Dec-13 Mar-14 Jun-14 Sep-14 Visitors (000's) LGA PROFILE - Tenterfield
OVERVIEW Four year annual average to the year ending September 2014
 Dec-08 Mar-09 Jun-09 Sep-09 Dec-09 Mar-10 Jun-10 Sep-10 Dec-10 Mar-11 Jun-11 Sep-11 Dec-11 Mar-12 Jun-12 Sep-12 Dec-12 Mar-13 Jun-13 Sep-13 Dec-13 Mar-14 Jun-14 Sep-14 Visitors (000's) LGA PROFILE - Newcastle
OVERVIEW Four year annual average to the year ending September 2014
 LGA PROFILE - OVERVIEW Total Visitors (overnight and domestic daytrip) (000's) 1,453 80,316 Total Overnight Visitors (000's) 749 28,105 Total Nights (000's) 2,728 154,563 Total Spend (overnight and domestic
OVERVIEW Four year annual average to the year ending September 2014
 Dec-08 Mar-09 Jun-09 Sep-09 Dec-09 Mar-10 Jun-10 Sep-10 Dec-10 Mar-11 Jun-11 Sep-11 Dec-11 Mar-12 Jun-12 Sep-12 Dec-12 Mar-13 Jun-13 Sep-13 Dec-13 Mar-14 Jun-14 Sep-14 Visitors (000's) LGA PROFILE - Orange
AUCKLAND DESTINATION OVERVIEW
 AUCKLAND DESTINATION OVERVIEW October 218 An in-depth overview of Auckland s visitor economy from the latest arrival, accommodation, spend, cruise and event data through to past five- commentary. Prepared
OVERVIEW Four year annual average to the year ending September 2014
 Dec-08 Mar-09 Jun-09 Sep-09 Dec-09 Mar-10 Jun-10 Sep-10 Dec-10 Mar-11 Jun-11 Sep-11 Dec-11 Mar-12 Jun-12 Sep-12 Dec-12 Mar-13 Jun-13 Sep-13 Dec-13 Mar-14 Jun-14 Sep-14 Visitors (000's) LGA PROFILE - Port
Japan 3% Foreign overnight stays 31% Domestic overnight stays 69% 8.3 MILLION FOREIGN VISITORS IN FINLAND IN 2017
 TOURISM IS A GROWING SOURCE OF EXPORT REVENUE AND A SIGNIFICANT EMPLOYMENT PROVIDER IN FINLAND TOURISM HAS A MULTIPLIER EFFECT ON OTHER SECTORS. 1 EURO IN TOURISM ADDS 56 CENTS VALUE TO THE OTHER SECTORS.
AFTA Travel Trends. June 2017
 AFTA Travel Trends June 2017 AFTA Travel Trends Report 2017 Inbound and Outbound overview Introduction This snapshot provides an overview of the balance of trade between Inbound and Outbound Travel for
OVERVIEW Four year annual average to the year ending September 2014
 Dec-08 Mar-09 Jun-09 Sep-09 Dec-09 Mar-10 Jun-10 Sep-10 Dec-10 Mar-11 Jun-11 Sep-11 Dec-11 Mar-12 Jun-12 Sep-12 Dec-12 Mar-13 Jun-13 Sep-13 Dec-13 Mar-14 Jun-14 Sep-14 Visitors (000's) LGA PROFILE - Great
OVERVIEW. Currently South Australia contributes $6.3 billion to the Australian tourism economy.
 OVERVIEW Currently contributes $6.3 billion to the Australian tourism economy. has achieved 79 per cent of its $8.0 billion maximum potential by 2020. $6.3b $6.5b $8b 2016 2017 2020 Annual Visitor Summary
OVERVIEW Four year annual average to the year ending September 2014
 Dec-08 Mar-09 Jun-09 Sep-09 Dec-09 Mar-10 Jun-10 Sep-10 Dec-10 Mar-11 Jun-11 Sep-11 Dec-11 Mar-12 Jun-12 Sep-12 Dec-12 Mar-13 Jun-13 Sep-13 Dec-13 Mar-14 Jun-14 Sep-14 Visitors (000's) LGA PROFILE - Snowy
Milford Sound, Fiordland. newzealand.com. germany. Market information about our Visitors and our Active Considerers
 Milford Sound, Fiordland germany Market information about our Visitors and our Active Considerers newzealand.com PAST VISITORS HISTORIC VIEW TOTAL ARRIVALS YE SEPTEMBER 2017 CHINA 408K 11% JAPAN 102K 3%
International Visitation to the Northern Territory. Year ending September 2017
 International Visitation to the Northern Territory Year ending September 2017 The following is a summary of information relevant to the Northern Territory (NT) tourism industry including visitation results
Whangaroa Harbour, Northland. newzealand.com. united kingdom. Market information about our Visitors and our Active Considerers
 Whangaroa Harbour, Northland newzealand.com united kingdom Market information about our Visitors and our Active Considerers PAST VISITORS HISTORIC VIEW TOTAL ARRIVALS YE SEPTEMBER 2017 CHINA 408K 11% JAPAN
Castlepoint, Wararapa. newzealand.com. japan. Market information about our Visitors and our Active Considerers
 Castlepoint, Wararapa japan Market information about our Visitors and our Active Considerers newzealand.com PAST VISITORS HISTORIC VIEW TOTAL ARRIVALS YE SEPTEMBER 2017 CHINA 408K 1 JAPAN 102K UK 246K
America 6% Russia 12%
 TOURISM IS A GROWING SOURCE OF EXPORT REVENUE AND A SIGNIFICANT EMPLOYMENT PROVIDER IN FINLAND TOURISM HAS A MULTIPLIER EFFECT ON OTHER SECTORS. 1 EURO IN TOURISM ADDS 56 CENTS VALUE TO THE OTHER SECTORS.
OVERVIEW Four year annual average to the year ending September 2014
 Dec-08 Mar-09 Jun-09 Sep-09 Dec-09 Mar-10 Jun-10 Sep-10 Dec-10 Mar-11 Jun-11 Sep-11 Dec-11 Mar-12 Jun-12 Sep-12 Dec-12 Mar-13 Jun-13 Sep-13 Dec-13 Mar-14 Jun-14 Sep-14 Visitors (000's) LGA PROFILE - Eurobodalla
OVERVIEW Four year annual average to the year ending September 2014
 LGA PROFILE - Tweed OVERVIEW Total Visitors (overnight and domestic daytrip) (000's) 1,444 80,316 Total Overnight Visitors (000's) 534 28,105 Total Nights (000's) 2,054 154,563 Total Spend (overnight and
China 17% Foreign overnight stays 31% Domestic overnight stays 69% 8.3 MILLION FOREIGN VISITORS IN FINLAND IN 2017
 TOURISM IS A GROWING SOURCE OF EXPORT REVENUE AND A SIGNIFICANT EMPLOYMENT PROVIDER IN FINLAND TOURISM HAS A MULTIPLIER EFFECT ON OTHER SECTORS. 1 EURO IN TOURISM ADDS 56 CENTS VALUE TO THE OTHER SECTORS.
I T N E T R E N R A N T A I T ON O AL A L A R A R R I R VA V L A S L S A N A D N D D E D PA
 INTERNATIONAL ARRIVALS AND DEPARTURES July 2015 Government of Tonga SD18M-36 Statistical Bulletin Month of Change from Change from July 2015 Number previous month previous year All Arrivals 8,252-28.0
International Visitation to the Northern Territory. Year ending March 2017
 International Visitation to the Northern Territory Year ending March 217 The following is a summary of information relevant to the Northern Territory tourism industry including visitation results from
International Visitation to the Northern Territory. Year ending June 2017
 International Visitation to the Northern Territory Year ending June 217 The following is a summary of information relevant to the Northern Territory tourism industry including visitation results from Tourism
Commerce Committee. 2015/16 Estimates Examination. Vote Business, Science and Innovation. Tourism Portfolio
 Commerce Committee 2015/16 Estimates Examination Vote Business, Science and Innovation Tourism Portfolio Ministry of Business, Innovation and Employment Responses Supplementary Questions 124-131 June 2015
TOURISM NEW ZEALAND OUR VISITORS UNDERSTANDING HISTORIC VIEW TOTAL ARRIVALS YE JUNE 2016
 TOURISM JAPAN 94K NEW ZEALAND UNDERSTANDING OUR VISITORS GERMANY 91K CHINA 397K 1 UK 214K 7% USA 258K 8% Our market infographics are drawn from two different sources. HISTORIC VIEW: Past Visitor Research
TripAdvisor Workshop Christchurch 7 June 2016
 TripAdvisor Workshop Christchurch 7 June 2016 TripAdvisor: The World s Largest Travel Site 1 M I L L I O N Reviews & Opinions 3402005 MILLION 2000 Unique visitors a month M I L L I O N 350 r e vie w s
Conventions & business events Grow market share of business events from 9% to 10%
 Visitor nights 5% increase of total visitor guest nights vs national Visitor spend 5% increase in visitor spend across the region Conventions & business events Grow market share of business events from
Cooma-Monaro Visitors. International overnight, domestic overnight and domestic daytrip visitors. Sep-11. Sep-10. Jun-11. Dec-11. Dec-10.
 OVERVIEW LGA PROFILE - Cooma-Monaro Key Measures Cooma- Monaro NSW Total Visitors (overnight and domestic daytrip) (000's) 301 80,316 Total Overnight Visitors (000's) 119 28,105 Total Nights (000's) 346
PATA Global Insights Conference 2017
 www. f o r w a r d k e y s. c o m PATA Global Insights Conference 2017 September 2017 Know tomorrow s travellers ABOUT FORWARDKEYS ForwardKeys predicts future travel patterns by crunching and analysing
SHORT BREAKS TO NSW INTRODUCTION
 SHORT BREAKS TO NSW March 2016 INTRODUCTION This document provides demographic profile of domestic and international short break 1 visitors to NSW, and their travel behaviour. It makes comparisons in terms
Franz Josef Glacier. newzealand.com. visitor experience. Market information about our Visitors and our Active Considerers
 Franz Josef Glacier newzealand.com visitor experience Market information about our Visitors and our Active Considerers PAST VISITORS HISTORIC VIEW TOTAL ARRIVALS YE SEPTEMBER 2017 CHINA 408K 11% JAPAN
International Tourism Snapshot
 International visitors to Australia Total holiday 4,447,000 5.0% 18.9-0.7% NZ 490,000-1.4% 7.5-9.4% Asia 2,292,000 8.6% 15.5-5.3% North America 496,000 4.6% 15.2-7.1% Europe 554,000 0.2% 38.5 8.3% UK 400,000
Understanding Business Visits
 Understanding Business Visits Foresight issue 153 VisitBritain Research 1 Contents Introduction Summary and Highlights Business Visits in Context UK Business visits and spend Averages Duration of stay
Backpackers to the Northern Territory DEPARTMENT OF TOURISM AND CULTURE. Executive Summary June 2018
 Backpackers to the Northern Territory DEPARTMENT OF Executive Summary June 2018 Background and Objectives DEPARTMENT OF There has been a continuous decline in international backpacker numbers since the
Tourism to the Regions of Wales 2008
 Tourism to the Regions of Wales 28 Key Facts on UK Domestic Tourism North Wales North Wales accounts for 37% of all trips and 35% of all spend in Wales 87% of visits to North Wales are for holiday purposes
OVERVIEW Four year annual average to the year ending September 2014
 LGA PROFILE - Mid-Western Regional OVERVIEW Key Measures Mid-Western Regional NSW Total Visitors (overnight and domestic daytrip) (000's) 524 80,316 Total Overnight Visitors (000's) 298 28,105 Total Nights
2017 VISITOR STATISTICS WASHINGTON, DC
 2017 VISITOR STATISTICS WASHINGTON, DC TOTAL VISITATION TO WASHINGTON, DC WASHINGTON, DC (DISTRICT OF COLUMBIA) VISITORS (IN MILLIONS) 20 15 10 5 Overseas Domestic 14.9 1.0 13.9 15.9 1.1 16.6 16.3 1.4
Foreign overnight stays 31% Domestic overnight stays 69% 8.3 MILLION FOREIGN VISITORS IN FINLAND IN 2017
 TOURISM IS A GROWING SOURCE OF EXPORT REVENUE AND A SIGNIFICANT EMPLOYMENT PROVIDER IN FINLAND TOURISM HAS A MULTIPLIER EFFECT ON OTHER SECTORS. 1 EURO IN TOURISM ADDS 56 CENTS VALUE TO THE OTHER SECTORS.
OVERVIEW Four year annual average to the year ending September 2014
 Dec-08 Mar-09 Jun-09 Sep-09 Dec-09 Mar-10 Jun-10 Sep-10 Dec-10 Mar-11 Jun-11 Sep-11 Dec-11 Mar-12 Jun-12 Sep-12 Dec-12 Mar-13 Jun-13 Sep-13 Dec-13 Mar-14 Jun-14 Sep-14 Visitors (000's) LGA PROFILE - Oberon
Identifying the potential for the Australia VFR market to grow New Zealand tourism. Full report May 2018
 Identifying the potential for the Australia VFR market to grow New Zealand tourism Full report May 2018 1 Introduction Context Background Business issue 40-50% of Australian arrivals into Auckland cite
Insight Department: Scotland The key facts on tourism in 2016
 Insight Department: Scotland The key facts on tourism in 2016 September 2017 Executive Summary & Background Information In 2016 just under 14.5 million overnight tourism trips were undertaken in Scotland.
Russia 12% Russia 24% Foreign overnight stays 31% Domestic overnight stays 69% 8.3 MILLION FOREIGN VISITORS IN FINLAND IN 2017
 TOURISM IS A GROWING SOURCE OF EXPORT REVENUE AND A SIGNIFICANT EMPLOYMENT PROVIDER IN FINLAND TOURISM HAS A MULTIPLIER EFFECT ON OTHER SECTORS. 1 EURO IN TOURISM ADDS 56 CENTS VALUE TO THE OTHER SECTORS.
Domestic tourism in 2017
 Domestic tourism in 2017 1 2017 was a good year for domestic holidays in England Holiday trip volume equalled the record previously set in 2009 Holiday trip expenditure equalled the record previously set
Insight Department: Scotland The key facts on tourism in 2016
 Insight Department: Scotland The key facts on tourism in 2016 September 2017 Executive Summary & Background Information In 2016 just under 14.5 million overnight tourism trips were undertaken in Scotland.
June TEQ Marketing Strategy 2025 Executive Summary
 June 2018 TEQ Marketing Strategy 2025 Executive Summary Vision and The Opportunity Tourism and Events Queensland s (TEQ) Marketing Strategy 2025 provides a platform to realise the TEQ vision of inspiring
Chart 2. International Student Nights in NSW
 International Student Visitors to NSW Year Ended March 2017 INTRODUCTION The International Education segment in Australia and NSW has had a resurgence and is growing. According to the Department of Education
International Visitation to the Northern Territory. Year ending December 2017
 International Visitation to the Northern Territory Year ending December 2017 The following is a summary of information relevant to the Northern Territory (NT) tourism industry including visitation results
QCB Report Q
 Q 8-9 October to 3 December 8 Market Overview & Insights The following report outlines the key activity and results of the Queenstown Convention Bureau for Q (Oct, Nov, Dec) of 8-9 financial year. This
TOURISM NEW ZEALAND OUR VISITORS UNDERSTANDING HISTORIC VIEW TOTAL ARRIVALS YE SEPTEMBER 2017
 TOURISM NEW ZEALAND UNDERSTANDING OUR VISITORS GERMANY 104K 3% CHINA 408K 11% JAPAN 102K 3% UK 246K 7% USA 320K 9% Our market infographics are drawn from two different sources. HISTORIC VIEW: Past Visitor
Booking a holiday. Foresight issue 151. VisitBritain Research
 Booking a holiday Foresight issue 151 VisitBritain Research 1 Contents 1. Introduction 2. Summary 3. How are travel and accommodation booked? 1. Booked separately or together 2. Booked direct with provider
2012 Coach & Charter Seminar. 21 February 2012 Presented by Amanda Coghlan Strategic Insights Analyst
 2012 Coach & Charter Seminar 21 February 2012 Presented by Amanda Coghlan Strategic Insights Analyst Destination NSW Lead Government agency for the NSW tourism and events sectors Established as a statutory
Visa Inbound Spend Report
 Visa Inbound Spend Report Visa Insights 2017 Visa Public Disclaimer Case studies, statistics, research and recommendations are provided "AS IS" and intended for informational purposes only and should not
Tourism Snapshot A Monthly Monitor of the Performance of Canada s Tourism Industry
 Tourism Snapshot A Monthly Monitor of the Performance of Canada s Tourism Industry January 2017 Volume 13, Issue 1 Edmonton Tourism www.destinationcanada.com Tourism Snapshot January 2017 1 KEY HIGHLIGHTS
Tourism Statistics Region 1
 Tourism Statistics Region 1 Tourism Research Unit Winter 2011 1 Summary In 2008, there were 101.0 million visits in and visitors spent $17.6 billion residents account for the majority of visits and spending
Tourism Snapshot. June 2015 Volume 11, Issue 6. A focus on the markets in which Destination Canada (DC) and its partners are active.
 and its partners are active.") Tourism Snapshot Tourism PEI / Paul Baglole A focus on the markets in which Destination Canada (DC) and its partners are active. www.destinationcanada.com June Volume 11, Issue 6 Key highlights Over the
Tourism Snapshot Tourism PEI / Paul Baglole A focus on the markets in which Destination Canada (DC) and its partners are active. www.destinationcanada.com June Volume 11, Issue 6 Key highlights Over the
VisitBritain Decisions and Influences. December 2016
 VisitBritain Decisions and Influences December 2016 RESEARCH BACKGROUND Contents 1. Research Background 2. Britain & Competitors 3. Holiday Research and Planning 4. Holiday Booking 5. Appendix 2 Research
Tourism Snapshot. A focus on the markets in which the CTC and its partners are active. February 2015 Volume 11, Issue 2.
 Tourism Snapshot Tourism Whistler/Mike Crane A focus on the markets in which the CTC and its partners are active www.canada.travel/corporate February Volume 11, Issue 2 Key highlights The strong beginning
Measures & Projections October 31, GoToBermuda.com
 Measures & Projections October 31, 2015 GoToBermuda.com October Total Vacation Visitor Arrivals Vacation Arrivals Oct-14 Oct-15 2015 Air Vacation 9,203 10,344 1,141 12.40 126,842 127,044 202 0.16 Cruise
Tourism Performance and Trends. Sharon Orrell November 2017
 Tourism Performance and Trends Sharon Orrell November 2017 1 The last decade in domestic overnight tourism Trips (m) 55 50 45 40 35 30 25 20 15 10 5 Domestic Overnight Tourism in England Rolling 12 Month
International Tourism Snapshot
 Australia on a high International visitors to Australia Australia welcomed 7.8m international visitors in the year ending June International visitor expenditure in Australia 2017, more than any previous
India Market Statistics
 India Market Statistics August 2017 Welcome India: Market Statistics factsheet provides the latest data and trends on the volume and value of visitors from India to Scotland from the International Passenger
Regional Spread of Inbound Tourism. VisitBritain Research, August 2018
 Regional Spread of Inbound Tourism VisitBritain Research, August 218 1 Contents Introduction Summary Key metrics by UK area Analysis by UK area Summary of growth by UK area Scotland Wales North East North
 THE UNITED KINGDOM AND EUROPE TEAM Regional Marketing Communications Manager UK & Europe Vanessa Healey Vanessa.Healey@tnz.govt.nz +44 207 389 0153/07880201828 Favourite place in NZ: Kayaking on the Queen
Drive Preference Focus Higher Value Visitors Partner To Extend Reach
 KEY ISSUE OR OPPORTUNITY: Convert strong consumer aspiration to visit through to driving off peak (spring and autumn) travel OUR STRATEGY: Develop a fully integrated campaign for core targets to focus
Who we spoke to. Long haul travellers across 15 of Australia s key tourism markets
 Who we spoke to Long haul travellers across 15 of Australia s key tourism markets Importance factors for destination choice Read as: 16% of respondents rate exciting events, local festivals and celebrations
REGION DEFINITION. Karlu Karlu / Devils Marbles Conservation Reserve. Tourismnt.com.au Page 1 of 9
 Year ending June 2015 122,000 Year ending June 2016 135,000 Year ending June 2017 161,000 x TOURISM NT REGIONAL PROFILE Barkly Report Period: Three year averages Year Ending June 2015 2017 Pink Palace
Queenstown Airport International Passenger Profile Update
 Queenstown Airport International Passenger Profile Update 12 months to 31 January 2017 Published at 6 March 2017 This report, based on data from Statistics NZ, shows the profile of passengers on trans-tasman
International Visitation to the Northern Territory. Year ending March 2018
 International Visitation to the Northern Territory Year ending March 2018 The following is a summary of information relevant to the Northern Territory (NT) tourism industry including visitation results
Year ending June ,000 REGION DEFINITION
 Year ending June 2015 406,000 Year ending June 2016 447,000 Year ending June 2017 484,000 x TOURISM NT REGIONAL PROFILE Alice Springs and MacDonnell Report Period: Year Ending June 2017 Annual overnight
Tourism in Eastern Scotland 2010 Edinburgh & Lothian's, Angus & Dundee, Perthshire and the Kingdom of Fife
 Tourism in Eastern 2010 Edinburgh & Lothian's, Angus & Dundee, Perthshire and the Kingdom of Fife Edinburgh & Lothians Summary It is estimated that in 2010, UK residents made 2.31m trips to Edinburgh and
A competitive future for destination Australia
 A competitive future for destination Australia Tourism Futures Conference, October 4 2005 Scott Morrison, Managing Director A changing environment Increased Competition Technological Change Evolving Consumer
BUSINESS BAROMETER December 2018
 Credit: Chris Orange BUSINESS BAROMETER December Credit: Nigel Moore 1 Contents Summary of findings 3 Annual monthly performance: visitor attractions..4 Visit Herts Team update 5 National context.8 Visitor
% change vs. Dec ALL VISITS (000) 2,410 12% 7,550 5% 31,148 1% Spend ( million) 1,490 15% 4,370-1% 18,710 4%
 2,410 12% 7,550 5% 31,148 1% Spend ( million) 1,490 15% 4,370-1% 18,710 4%") HEADLINES FULL YEAR 2012 (PROVISIONAL) 1 Overall visits 31.148 million visits making 2012 the best year for inbound tourism since 2008 but not a record. 1% increase in visits on 2011 (30.798 visits) slightly
HEADLINES FULL YEAR 2012 (PROVISIONAL) 1 Overall visits 31.148 million visits making 2012 the best year for inbound tourism since 2008 but not a record. 1% increase in visits on 2011 (30.798 visits) slightly
International Visitation to the Northern Territory. Year ending September 2018
 International Visitation to the Northern Territory Year ending September 2018 INTERNATIONAL VISITORS IN THE NORTHERN TERRITORY YEAR ENDING SEPTEMBER 2018 VISITORS 289,000-1.1% NIGHTS 3.6 MILLION EXPENDITURE
Sweden Market Statistics
 Sweden Market Statistics August 2017 Welcome Sweden: Market Statistics factsheet provides the latest data and trends on the volume and value of visitors from Sweden to Scotland from the International Passenger
Queensland s International Education Tourism Paper
 July 2018 Queensland s International Education Tourism Paper 2025 Executive Summary International education is a high value market to Queensland s tourism and events industry due to international students
International Tourism Snapshot
 International visitors to Australia International visits continue to grow Australia hosted a record number of international visitors in the year ending International visitor expenditure in Australia September
AFTA s 2017 Foreign Policy White Paper Submission
 AFTA s 2017 Foreign Policy White Paper Submission Page 1 of 10 About AFTA Ltd (AFTA) was founded in 1957 to: establish professional standards for travel agents; stimulate and promote travel; bring together
STATISTICAL BULLETIN ON MONTHLY MIGRATION STATISTICS DECEMBER 2016 SERIES NO. SDT: 39-M 55. Government of Tonga
 SERIES NO. SDT: 39-M 55 Government of Tonga STATISTICAL BULLETIN ON MONTHLY MIGRATION STATISTICS DECEMBER 2016 Statistics Department P.O. Box 149, Nuku alofa, Kingdom of Tonga Website: www.spc.int/prism/tonga/
2016 VISITOR STATISTICS WASHINGTON, DC
 2016 VISITOR STATISTICS WASHINGTON, DC TOTAL VISITATION TO WASHINGTON, DC WASHINGTON, DC (DISTRICT OF COLUMBIA) VISITORS (IN MILLIONS) 20 15 10 Overseas Domestic 15.1 14.9 1.0 1.0 14.1 13.9 18.3 19.0 17.8
STATISTICAL BULLETIN ON INTERNATIONAL ARRIVALS, DEPARTURES AND MIGRATION 2011 SERIES NO. SDT: Government of Tonga
 SERIES NO. SDT: 38-13 Government of Tonga STATISTICAL BULLETIN ON INTERNATIONAL ARRIVALS, DEPARTURES AND MIGRATION 2011 Statistics Department, P.O. Box 149, Nuku alofa, Kingdom of Tonga Website: www.spc.int/prism/tonga/
THE GROWTH OF THE HOSPITALITY INDUSTRY IN DUBAI
 THE GROWTH OF THE HOSPITALITY INDUSTRY IN DUBAI THE DEFINITION OF TOURISM Tourism is travel for recreational, leisure or business purposes. The World Tourism Organization defines tourists as people "traveling
Tourism Snapshot A Monthly Monitor of the Performance of Canada s Tourism Industry
 Tourism Snapshot A Monthly Monitor of the Performance of Canada s Tourism Industry December Volume 12, Issue 12 Michelle Valberg www.destinationcanada.com Tourism Snapshot December 1 KEY HIGHLIGHTS With
Western Sydney Visitor Profile
 Western Sydney Visitor Profile Year Ended June 2017 This snapshot provides a profile of, and Daytrip who visited Western 1,2 VISITOR MARKET SIZE AND EXPENDITURE In the year ended (YE) June 17, the total
Washington, DC 2013 Visitor Statistics
 Washington, DC 2013 Visitor Statistics Washington, DC 2013 Visitor Statistics TOTAL VISITATION TO WASHINGTON, DC In Millions 20 18 16 14 15.8 15.4 1.0 0.8 14.8 15.1 14.9 1.0 1.0 1.0 15.9 1.1 16.6 1.4 16.3
AFTA Travel Trends. December 2018
 AFTA Travel Trends December 2018 AFTA Travel Trends Report 2018 Inbound and Outbound overview Introduction This snapshot provides an overview of the balance of trade between Inbound and Outbound Travel