A rising ELICOS tide lifts all international education ships. So how do we navigate for future success?
|
|
|
- Evan Simon
- 5 years ago
- Views:
Transcription


1 A rising ELICOS tide lifts all international education ships. So how do we navigate for future success? Brett Blacker English Australia AIEC


2 The rising tide. Global context Data and trends Policy impacts Agents perspectives Scenario planning Initiatives and directions


3 Growth starts with a sead..
4 ELICOS Industry Data global English Language Training industry 2013 & 2014 data competitor overview 2014 agent perspectives Australia 2014 PRISMS data student visa holders all sectors English Australia all visa holders ELICOS pathways data 2013/2014 Australia YTD 2015 YTD July 2015 PRISMS data student visa commencements 4
5 Global Context
6 The global ELT industry which countries are our key competitors? UK, USA, Canada, Ireland, New Zealand, Malta, South Africa how many students travel to these 7 countries + Australia to learn English? in 2013 over 1.5 million what is Australia s share of the global ELT market in students? in % what is Australia s share of the global ELT market in student weeks? in % 6

7 The Global Market for ELT trends in students 800, , , , , , , , UK USA Canada Australia Ireland Malta NZ S.Africa Source: Study Travel Magazine Dec

8 The Global Market for ELT trends in weeks 4,000,000 3,500,000 3,000,000 2,500,000 2,000,000 1,500,000 1,000, , USA UK Australia Canada Ireland NZ Malta S.Africa Source: Study Travel Magazine Dec
9 The Global Market for ELT ranking UK continued to record the greatest market share of students (50%), however the USA had the greatest market share of weeks (30%) Australia #4after UK, USA and Canada with 9.5% of students(up from 8.3%) Australia #3after USA and UK with 16.5% of student weeks(up from 13.3%) top 4 countries = 85% of all English language students and 89% of all weeks Source: Study Travel Magazine Dec

10 The Global Market for ELT trends in weeks Australia - back to peak market share 100% 90% 80% 70% 60% 50% 40% 30% 20% 10% 3.6% 3.5% 3.8% 3.7% 3.3% 2.7% 2.4% 2.3% 2.5% 3.1% 3.4% 4.2% 5.1% 5.3% 8.4% 8.9% 19% 19% 20% 16% 16% 18% 17% 17% 13% 16% 14% 13% 17% 13% 17% 14% 28% 31% 29% 32% 28% 31% 30% 30% 33% 24% 23% 24% 27% 26% 28% 29% S.Africa Malta NZ Ireland Canada Australia UK USA 0% Source: Study Travel Magazine, Dec
11 Average length of study (weeks) USA Australia Canada NZ S. Africa Ireland UK Malta average Source: Study Travel Magazine Dec

12 2014 ELT % growth or decline in students 12% 10% 8% 6% 4% 2% 0% -2%?? UK USA Canada Australia Ireland NZ Malta S. Africa -4% 12
13 Industry Statistics Australia 2014
14 International education in Australia which is the biggest sector of international education in Australia??? 14

15 2014 ELICOS Commencements student visa commencements all visa commencements Non-award 8% Higher Education 31% Non-award 7% Higher Education 27% ELICOS 30% ELICOS 40% Schools 3% VET 28% Schools 2% VET 24% Data: DIBP 2014 Industry Statistics and 2014 English Australia Survey of major regional markets 15
16 Commencements student visa holders 120, ,000 80,000-32% +48% Higher Ed. VET 60,000 ELICOS 40,000 Schools 20,000 Other


17 ELICOS commencements(all visa types) 160, ,000 students weeks +107% -23% +31% 2,400,000 2,100, ,000 1,800, ,000 1,500,000 80,000 1,200,000 60,000-29% 900,000 40, ,000 20, ,


18 ELICOS commencements all visa types 160, , ,000 other* 100,000 80,000 60,000 working holiday* visitor 40,000 student 20, * prior to 2009, working holiday and other visas were combined together 18
19 Trends by visa type 100,000 80,000 student 60,000 visitor 40,000 wh & other 20,000 working holiday* other* * prior to 2009, working holiday and other visas were combined together 19
20 Growth/decline by visa type / - student 103,715 83,583 72,429 75,392 91, ,610 16,212 18% visitor 27,325 32,710 32,866 25,159 28,319 30,897 2,578 9% working holiday 17,615 18,527 18,734 17,239 21,542 17,840-3,702-17% other 6,958 5,281 10,411 6,813 6,569 7, % total 155, , , , , ,542 15,714 11% 20
21 Policy impacts on ELICOS

22 Austrade analysis of SVP impact on ELICOS explores ELICOS enrolment trends at providers listed as eligible for Streamlined Visa Processing (SVP), including universities and business partners figures in this analysis do not represent actual SVP enrolments or commencements but are the total ELICOS enrolments or commencements at education providers this report only includes education providers with more than 80 student enrolments/commencements in 2013 or 2014 KEY FINDINGS in 2014, two-thirds of the total 137,000 ELICOS enrolments were at SVP-eligible providers (89,000) overall, ELICOS commencements increased 17% in 2014 SVP-eligible providers grew by +20% non-svp providers grew by +11% a higher proportion of SVP-eligible providers (74%) experienced growth compared to non-svp providers (68%) 22

23 Austrade analysis of SVP impact on ELICOS A comparison of the top 15 markets for the ELICOS sector overall with SVP-eligible providers and non- SVP providers show similar markets but different rankings. For example: Thailand is the third-largest ELICOS market for the sector overall, fifth-largest for SVP-eligible providers and the top source market for non- SVP providers for non-svp providers, Malaysia is the 11thlargest market and Czech Republic is 12th, although these markets are not in the top 15 markets for the ELICOS sector overall the list of top markets for non-svp providers highlight nationalities that come to Australia for standalone English courses rather than packaged courses 23

24 Austrade analysis of SVP impact on ELICOS In all states and territories, SVP-eligible providers enrol larger numbers of students compared to non-svp providers. Stronger growth rates were experienced by SVP-eligible providers in New South Wales, Victoria, South Australia, ACT and Tasmania. In contrast, Queensland and Western Australia saw stronger growth rates at non-svp providers. This reflects the importance of non-pathway English study in these two states. While ELICOS commencements at SVP-eligible providers across all states and territories are growing, two states saw declining commencements for non-svp providers. In these cases, the number of commencements was relatively small, with 37 in the ACT and 394 in South Australia. 24
25 2014 key statistics 163,542 students (+11%) +15,714 more students average length of course 12.9 weeks same as ,104,832 student weeks (+10%) +192,819 more weeks 66% (107,610) student visas (growth +18%) 19% (30,897) visitor visas (growth +9%) 11% (17,840) working holiday visas (decline-17%) 4% (7,195) other visas (growth +10%) $2.075 billion in export earnings (+12%) +$230 million 25
26 2014 different perspectives Austrade / DET (student visa perspective) +17% growth in commencements 107,548 commencing ELICOS students 15,796 more ELICOS students than 2013 growth from 9 countries in top 10 (except S. Korea) top 10 remains the same (India replaced Spain in 2013) (Spain replaced Indonesia in 2012) (Indonesia replaced India in 2011) China #1 source country, #2 Thailand, #3 Brazil, #4 Colombia, #5 India, #6 Vietnam English Australia (all visa perspective) +11% growth in commencements 163,542 commencing ELICOS students 15,714more ELICOS students than 2013 growth from 9 countries in top 10 (except S. Korea) India replaced S. Arabia in top 10 (S. Arabia replaced Switzerland in 2013) (Italy replaced S. Arabia in 2012) (Vietnam replaced France in 2011) China #1 source country, #2 Japan, #3 Korea, #4 Thailand, #5 Brazil, #6 Colombia 26
27 Pathways data (2013/2014) The pathways data is for students completing ELICOS in 2013 and commencing courses in other sectors in the majorityof international students undertake study in more than one educational sector. 27
28 Pathways data (2013/2014) 35% of student visa holders finishing ELICOS in 2013 studied onlyin the ELICOS sector 65% of student visa holders finishing ELICOS in 2013 were pathway students applying these proportions to the 2014 data would indicate that: 43% of ELICOS students on allvisas in 2014 were pathway students approx69,947elicos students commencing in 2014 have or will transition through to other sectors approx 93,596 ELICOS students studied only in the ELICOS sector 28

29 1st sector enrolled after completing ELICOS 100% 90% 80% 70% 60% 50% 40% 30% 20% 10% 0% 31% 34% 35% 37% 35% 5% 4% 6% 5% 5% 4% 5% 4% 5% 3% 33% 20% 20% 21% 23% 27% 35% 36% 34% 34% 2009/ / / / /2014 ELICOS only Other Schools VET Higher Ed 29
30 Sector enrolled in before commencing Higher Ed 100% 90% 80% 70% 60% 50% 40% 30% 20% 10% 0% 40% 40% 47% 52% 54% 6% 3% 11% 7% 5% 9% 5% 8% 7% 14% 4% 3% 11% 9% 7% 43% 30% 28% 28% 29% 2009/ / / / /2014 Higher Ed only Other Schools VET ELICOS 30

31 Sector enrolled in before commencing VET 100% 90% 80% 70% 60% 50% 40% 30% 20% 2% 4% 9% 46% 39% 43% 45% 45% 46% 2% 4% 2% 2% 3% 2% 1% 12% 14% 15% 16% 39% 36% 36% 36% VET only Other Schools Higher Ed ELICOS 10% 0% 2009/ / / / /

32 Top 10 ELICOS nationalities (student visas) 32

33 Non Student Visa ELICOS
34 Tourism Visitor Visas 3,556,230 tourism Visitor visas granted in 2013/2014 total number of tourism Visitor visas granted showed strong growth of +8.2% in 2013/ months July to December 2014 up by a further +5.9% 467,748 tourism Visitor visa holders in Australia at 31 December
35 Analysis of Visitor visas (ELICOS) top 5 source countries /- Japan 9,293 9, % China 2,221 2, % Switzerland 2,882 2, % South Korea 2,822 2, % Thailand 957 1, % Other than top 5 9,794 11,421 +1, % total 28,319 30,897 +2,578 +9% 35
36 Analysis of WH visas (ELICOS) top 5 source countries /- South Korea 7,861 5,180-2,680-34% Japan 4,243 3, % Taiwan 3,611 2, % Italy 2,579 2, % France 1,769 1, % Other than top 5 1,478 1, % total 21,542 17,840-3,702-17% 36
37 Analysis of WH Visas 2013/2014 whvisas granted # 2014 wh ELICOS # whvisas granted growth/ decline wh ELICOS growth/ decline whelicos as % of total whvisas #2 Taiwan 29,366 2,824-18% -22% 14% 20% 15% 9% 10% 10% #3 Korea 26,893 5,180-24% -34% 18% 24% 26% 20% 22% 19% #4 Germany 26, % 16% 6% 4% 4% 3% 3% 3% #5 France 25,734 1,728 4% -2% 12% 11% 8% 6% 7% 7% #6 Italy 16,045 2,618 1% 1% 18% 20% 24% 20% 16% 16% #9 Japan 10,579 3,761 6% -11% 41% 42% 51% 45% 43% 36% 37
38 Onshore transition between visas visa held before onshore application for ELICOS student visa 2011/ / /14 13/14 vs 12/13 wh 16% other 1% student 6,330 6,603 5, % visitor 1,764 2,428 2, % wh 521 1,264 1, % other % TOTAL 8,699 10,349 9, % visitor 23% student 60% 38


39 Trends by visa type -students 100% 90% 80% 70% 60% 14% 37% 21% 30% 14% 27% 4% 4% 20% 11% 13% 18% 19% 23% 8% 5% 4% 4% 14% 15% 11% 14% 19% 20% 19% 24% other* working holiday* 50% visitor 40% 30% 20% 49% 49% 59% 61% 67% 60% 54% 61% 62% 66% student 10% 0% * prior to 2009, working holiday and other visas were combined together 39


40 2014 Visa type by region 100% 90% 80% 70% 4% 5% 5% 11% 9% 22% 18% 11% 9% other 60% 50% 31% wh 40% 30% 67% 85% 80% visitor student 20% 43% 10% 0% Asia Pacific Europe Americas M.East & N.Africa 40

41 Agent perspectives and impact on ELICOS
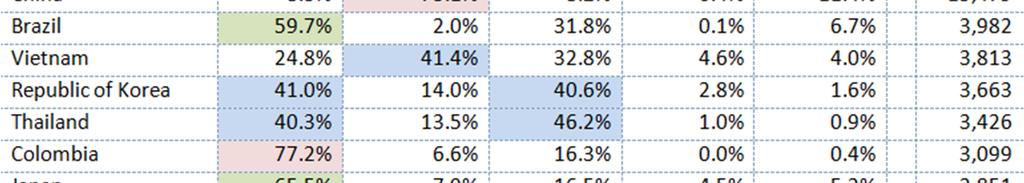
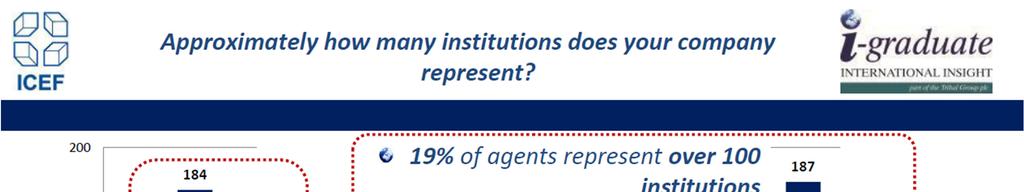
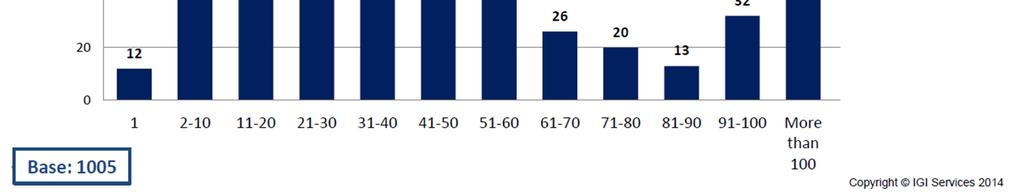
42 Agent Perspectives i-graduate ICEF Agent Barometer October 2014 online survey developed in partnership by i-graduate & ICEF -now in its 8 th year launched in 2007, the Agent Barometer tracks and reports perceptions and expectations of education agents worldwide 1,065 responses were received from agents in 104 countries in 2014 (7,565 responses over 7 years) provides a global perspective on demand trends however some key countries not represented: South Korea, Japan, Thailand, Taiwan 42


43
44

45

46


47

48 was 42% was 28% was 54% was 48%


49
50
51 Industry Statistics Australia YTD 2015
52 Department of Education & Training data YTD May


53 Department of Education & Training data YTD July
54 Sources of growth & decline (YTD March 2015) 5 countries best growth 5 countries worst decline / /- China 6,277 7, % Vietnam 2,478 1, % India 1,454 1, % S. Korea 1,966 1, % Taiwan 765 1, % Thailand 2,462 2, % S. Arabia 1,207 1, % Turkey % Brazil 2,623 2, % Russia % 54
55 Key messages on Statistics a total of 163,542 international students commenced English language programs in Australia in 2014, surpassing the previous peak year of 2008 to record a new high in the number of ELICOS students numbers of English language students in Australia doubled in the five years between 2003 and 2008, then declined by 23% over the four year period saw a strong return to growth with +19% and 2014 building on this with further growth of +11% growth not driven by one region or visa type or by a narrow range of countries remember the monthly government data for student visa holders is not the whole picture remember each state has a distinct ELICOS profile benchmark your performance against the state profile rather than the national picture 55

56 English Australia Scenario Planning

57 Scenario Planning 57
58 Scenario Planning Scenario 1: Drowning, not Waving The lack of a commonly held strategic vision and plan for the international education industry results in uncoordinated and contradictory policy settings, a focus on managing risk that removes all incentive and capacity to innovate and an industry that is focused internally rather than on external opportunities and on survival rather than growth. The industry gradually shrinks to a small number of providers who are all delivering the same types of programs to a narrow profile of students. The Australian educational offering is small, stale and unexciting. 58
59 Scenario Planning Scenario 2: Sink or Swim A focus on international education as business and allowing the market to drive success leads to the development of a highly competitive international education industry, both globally and domestically. The focus on competition and market forces leads to the formation of highly successful consortia that drive smaller education providers out of business. Peak bodies become less effective advocates for the industry as the large consortia gain the ear of government and others. Commercial imperatives drive an industry that becomes focused on its own success rather than the broader national agenda. 59
60 Scenario Planning Scenario 3: Missed the Boat The Australian government and industry focus successfully on achieving strong alignment across international education, however an overly bureaucratic approach to achieving consensus combines with other factors to distract from action and compromise the responsiveness of the industry. Competitor countries act quicker than Australia to meet international students rapidly changing demands and needs. Real innovation doesn t happen fast enough and Australia loses much of its market share. 60
61 Scenario Planning Scenario 4: Smooth Sailing The ELICOS sector contributes to and operates within a context of strong alignment across all international education stakeholders supported by a focus on best practice in all aspects of business and academic practice that provides a framework that facilitates a flexible approach to innovate and capitalise on opportunities resulting in strong overall growth across the Australian international education sector. 61
62 Projects and future initiatives Lead advocacy priorities addressing key ELICOS/member issues ELT Barometer 2015 new Best Practice Guide Moderating & Validating Learning Outcomes Connect working with peaks bodies in relation to the Agents Quality Assurance programs Joint lobbying for policy/ regulatory changes to support students and members ASQA/ TEQSA/ TPS engagement Gov t agencies. Grow seeking out collaborative/ consortium arrangements to access international opportunities global digital marketing campaign around The Biggest English English Lesson in the World 62
63 Navigating the Future Questions and Comments 63
64 64
The Global market for ELT
 Leading Trend Indicators an ELICOS sector perspective Sue Blundell English Australia AIEC October 2006 The Global market for ELT Precise size unknown, however estimated value of US$9.2 billion in 2005
Queensland s International Education Tourism Paper
 July 2018 Queensland s International Education Tourism Paper 2025 Executive Summary International education is a high value market to Queensland s tourism and events industry due to international students
English Australia. National ELICOS Market Report 2017: Executive Summary
 English Australia National ELICOS Market Report 2017: Executive Summary June 2018 A report prepared for English Australia by StudentMarketing, Ltd. June 2018 English Australia contact: Brett Blacker StudentMarkerketing
August YTD : All sectors. Enrolments by country
 South American Market Update Tony Crooks Director International, University of Melbourne South American headlines ¾ August YTD enrolments over 3 years 24-27 up 17% ¾ Commencements up 191% same period ¾
International Tourism Snapshot
 International visitors to Australia Total holiday 4,447,000 5.0% 18.9-0.7% NZ 490,000-1.4% 7.5-9.4% Asia 2,292,000 8.6% 15.5-5.3% North America 496,000 4.6% 15.2-7.1% Europe 554,000 0.2% 38.5 8.3% UK 400,000
Outlook for air travel markets
 Outlook for air travel markets June 2016 Brian Pearce Chief Economist International Air Transport Association Extended period of strong air travel market growth 30% 25% 20% 15% 10% 5% 0% -5% -10% -15%
Introduction to IATA
 Introduction to IATA Founded in 1945 Travel Agency Community of 90,000 offices Plays a vital and central in airline product distribution IATA Mission: to represent, lead and serve the airline industry
International Tourism Snapshot
 International visitors to Australia International visits continue to grow Australia hosted a record number of international visitors in the year ending International visitor expenditure in Australia September
International Tourism Snapshot
 Australia on a high International visitors to Australia Australia welcomed 7.8m international visitors in the year ending June International visitor expenditure in Australia 2017, more than any previous
Tourism Snapshot A focus on the markets that the CTC and its partners are active in
 Tourism Snapshot A focus on the markets that the CTC and its partners are active in www.canada.travel/corporate February 2011 Volume 7, Issue 2 Key highlights In the first two months of 2011 overnight
% change vs. Dec ALL VISITS (000) 2,410 12% 7,550 5% 31,148 1% Spend ( million) 1,490 15% 4,370-1% 18,710 4%
 2,410 12% 7,550 5% 31,148 1% Spend ( million) 1,490 15% 4,370-1% 18,710 4%") HEADLINES FULL YEAR 2012 (PROVISIONAL) 1 Overall visits 31.148 million visits making 2012 the best year for inbound tourism since 2008 but not a record. 1% increase in visits on 2011 (30.798 visits) slightly
HEADLINES FULL YEAR 2012 (PROVISIONAL) 1 Overall visits 31.148 million visits making 2012 the best year for inbound tourism since 2008 but not a record. 1% increase in visits on 2011 (30.798 visits) slightly
June TEQ Marketing Strategy 2025 Executive Summary
 June 2018 TEQ Marketing Strategy 2025 Executive Summary Vision and The Opportunity Tourism and Events Queensland s (TEQ) Marketing Strategy 2025 provides a platform to realise the TEQ vision of inspiring
TripAdvisor Workshop Christchurch 7 June 2016
 TripAdvisor Workshop Christchurch 7 June 2016 TripAdvisor: The World s Largest Travel Site 1 M I L L I O N Reviews & Opinions 3402005 MILLION 2000 Unique visitors a month M I L L I O N 350 r e vie w s
Inbound Tourism Prague, 2014 Overall Assessment
 Inbound Tourism Prague, 2014 Overall Assessment Facts and Figures: Total visitors: 6,096,015 foreign: 5,315,054 (87.2%) domestic: 780,961 (12.8%) Total visitor growth in Prague: 3.3% foreign growth: 5.3%
Intra-African Air Services Liberalization
 Intra-African Air Services Liberalization James Wiltshire Senior Economist, www.iata.org/economics To represent, lead and serve the airline industry Aviation connects African businesses to world markets
AQUATIC AND COASTAL CAMPAIGN. Overview page 1. Research page 2. Objectives page 3. Audience page 3. Creative idea page 3. Campaign pillars page 4
 AQUATIC AND COASTAL CAMPAIGN Overview page 1 Research page 2 Objectives page 3 Audience page 3 Creative idea page 3 Campaign pillars page 4 Creative delivery page 4 Campaign overview 'There s nothing like
Latest Hotels.com research reveals Chinese travellers want more of everything more time travelling, more locations and more exotic experiences
 Life in the FIRST lane Chinese travellers swap old habits for new first time experiences July 25, 2017 Latest Hotels.com research reveals Chinese travellers want more of everything more time travelling,
June TEQ Marketing Strategy 2025 Executive Summary
 June 2017 TEQ Marketing Strategy 2025 Executive Summary Vision and The Opportunity Tourism and Events Queensland s (TEQ) Marketing Strategy 2025 provides a platform to realise the TEQ vision of inspiring
CULTURAL & HERITAGE TOURISM IN AUSTRALIA APRIL 2016
 CULTURAL & HERITAGE TOURISM IN AUSTRALIA APRIL 2016 For further information, please contact: Russell Goss Director Policy & Research rgoss@ttf.org.au (02) 9240 2015 Cultural & heritage tourism in Australia
AFTA Travel Trends. April 2018
 AFTA Travel Trends April 2018 AFTA Travel Trends Report 2018 Inbound and Outbound overview Introduction This snapshot provides an overview of the balance of trade between Inbound and Outbound Travel for
2013 Research Agenda: Australian Universities International Directors Forum
 2013 Research Agenda: Australian Universities International Directors Forum Alan Olsen www.spre.com.au 9 October 2013 AUIDF Benchmarking Australian Universities International Directors Forum: 38 members
SOUTHERN AFRICA TRAVEL AND TOURISM BAROMETER REPORT 2015
 SOUTHERN AFRICA TRAVEL AND TOURISM BAROMETER REPORT 2015 1 Contents 1. TOURISM TRENDS: GLOBAL AND SOUTHERN AFRICA S MARKET SHARE IN AFRICA... 4 1.1. TOURIST ARRIVALS... 4 1.1.1. Global Tourist Arrivals
Sprint Real Solutions VPN SDS International Rates from the U.S. Mainland, Hawaii, Puerto Rico, and the U.S. Virgin Islands 1*
 1* The international rates below apply to calls from the U.S. Mainland, Hawaii, Puerto Rico, and the U.S. Virgin Islands where available. The rates, which are shown below in full minute increments, are
Global robot installations: high double digit growth rates
 ' of units Global robot installations: high double digit growth rates 5 45 4 35 3 25 2 15 1 5 113 6 Estimated annual worldwide supply of industrial robots 28-216 and 217-22* +15% on average per year 121
U.S. Travel and Tourism Report
 2014/TWG44/010 Agenda Item: 18 U.S. Travel and Tourism Report Purpose: Information Submitted by: United States 44 th Tourism Working Group Meeting Cusco, Peru 9-10 April 2014 U.S. Travel and Tourism Report
Benchmarking Travel & Tourism in United Arab Emirates
 Benchmarking Travel & Tourism in United Arab Emirates How does Travel & Tourism compare to other sectors? Summary of Findings, November 2013 Sponsored by: Outline Introduction... 3 UAE summary...... 8
An overview of Tallinn tourism trends
 An overview of Tallinn tourism trends August 2015 The data is collected from Statistics Estonia, Tallinn Airport and Port of Tallinn. In August 2015, 179,338 stayed overnight in Tallinn s accommodation
Prague Tourism Developments in Q1 2018
 Prague Tourism Developments in Q1 2018 Facts and Figures: Total visitors: 1,499,044 foreign: 1,239,848 (82.7%) domestic: 259,196 (17.3%) Total visitor growth in Prague: 121,224 visitors (8.8%) foreign
Latest Tourism Trends. Humphrey Walwyn Head of VisitEngland Research
 Latest Tourism Trends Humphrey Walwyn Head of VisitEngland Research 1 Inbound Tourism 2 2003 2004 2005 2006 2007 2008 2009 2010 2011 2012 2013 2014 2015 2016 2017 UK inbound long term trend Spend per visit
Global economy and aviation do we have room to grow?
 Global economy and aviation do we have room to grow? 18 January 2017 Brian Pearce Chief Economist, IATA Airline Industry Economics Advisory Workshop 2016 1 Room to grow? Looking through the cycle Potential
The Nordic Countries in an International Comparison. Helga Kristjánsdóttir 20. apríl 2012
 The Nordic Countries in an International Comparison Helga Kristjánsdóttir 20. apríl 2012 15 Figure 1. World Bank, GDP growth (annual %) 10 5 0 1961 1963 1965 1967 1969 1971 1973 1975 1977 1979 1981 1983
2012 Coach & Charter Seminar. 21 February 2012 Presented by Amanda Coghlan Strategic Insights Analyst
 2012 Coach & Charter Seminar 21 February 2012 Presented by Amanda Coghlan Strategic Insights Analyst Destination NSW Lead Government agency for the NSW tourism and events sectors Established as a statutory
AFTA Travel Trends. October 2017
 AFTA Travel Trends October AFTA Travel Trends Report Inbound and Outbound overview Introduction This snapshot provides an overview of the balance of trade between Inbound and Outbound Travel for Year end
Benchmarking Travel & Tourism in Russia
 Benchmarking Travel & Tourism in Russia How does Travel & Tourism compare to other sectors? Sponsored by: Summary of Findings, November 2013 Outline Introduction... 3 Russia summary..... 8 Data sources
Tourism Snapshot A focus on the markets that the CTC and its partners are active in
 Tourism Snapshot A focus on the markets that the CTC and its partners are active in Nahanni National Park, NWT www.canada.travel/corporate February 2012 Volume 8, Issue 2 Key highlights Following through
SWEDEN & AUSTRALIA 100+ YEARS OF DOING BUSINESS
 SWEDEN & AUSTRALIA 100+ YEARS OF DOING BUSINESS Sweden and Australia s history of doing business dates back to the late 19 th century. The Swedish Australian Chamber of Commerce was established over 100
AFTA Travel Trends. May 2018
 AFTA Travel Trends May AFTA Travel Trends Report Inbound and Outbound overview Introduction This snapshot provides an overview of the balance of trade between Inbound and Outbound Travel for Year end of
International Tourism Snapshot
 2007 2008 2009 2010 2011 2012 2013 2014 International Tourism Snapshot International to Australia Avg Stay 2 1 Holiday 3,291,000 8.7% 22.1 (-5.6%) NZ 449,000 6.1% 9 (-6.3%) Asia 3 1,482,000 9. 19.2 (-1.)
Sprint Real Solutions Option A SDS International Outbound Rates from the U.S. Mainland, Hawaii, Puerto Rico, and the U.S.
 1* The international rates below apply to calls from the U.S. Mainland, Hawaii, Puerto Rico, and the U.S. Virgin Islands. For additional termination poinst for some countries, see International Termination
AIR PASSENGER MARKET ANALYSIS
 Monthly RPK (Billions) Monthly FTK (Billions) Index of business confidence % change over year AIR PASSENGER MARKET ANALYSIS JANUARY 2014 KEY POINTS Air travel markets commenced 2014 with a strong increase
MONTHLY NATURAL GAS SURVEY. November 2009
 MONTHLY NATURAL GAS SURVEY November 2009 INTERNATIONAL ENERGY AGENCY INTERNATIONAL ENERGY AGENCY Next Release: 12 March 2010 MONTHLY NATURAL GAS SURVEY - 1 CONTENTS TABLE 1 Natural Gas Balances in OECD
IMD World Talent Report Factor 1 : Investment and Development
 THAILAND 2012 2013 2014 2015 2016 Overall Investment & Development Appeal Rank 2016 37 42 24 Readiness 49 of 61 Factor 1 : Investment and Development Total Public Expenditure on Education Percentage of
Life in the FIRST lane Chinese travellers swap old habits for new first time experiences
 Life in the FIRST lane Chinese travellers swap old habits for new first time experiences July 25, 2017 Life in the FIRST lane Chinese travellers swap old habits for new first time experiences Latest Hotels.com
III. TRADE IN COMMERCIAL SERVICES BY CATEGORY
 .. TRADE IN COMMERCIAL SERVICES BY CATEGORY Transportation services China records impressive growth Exports of world transportation services reached $750 billion in 2007, an increase of 19 per cent, following
ENGAGING ALUMNI WORLDWIDE
 ENGAGING ALUMNI WORLDWIDE COLUMBIA GLOBAL CENTERS and COLUMBIA ALUMNI ASSOCIATION Columbia University Senate Feb. 27, 2015 Mission Statement: Columbia Global Centers Columbia Global Centers promote and
Benchmarking Travel & Tourism in Colombia
 Benchmarking Travel & Tourism in Colombia How does Travel & Tourism compare to other sectors? Summary of Findings, November 2013 Sponsored by: Outline Introduction... 3 Colombia summary..... 8 Data sources
Tourism Trends, Outlook and Issues. John G.C. Kester. 6th UNWTO/PATA Forum on Tourism Trends and Outlook. Guilin, China October 2012 day 1
 Tourism Trends, Outlook and Issues 6th UNWTO/PATA Forum on Tourism Trends and Outlook Guilin, China 11-13 October 212 day 1 John G.C. Kester Programme Manager, Tourism Trends and Marketing Strategies World
Tourism Towards 2030 Preview of findings
 Tourism Towards 23 Preview of findings 54th meeting of the UNWTO Commission for the Americas 11 September 212 Quito, Ecuador Carlos Vogeler Regional Director for the Americas World Tourism Organization
FINLAND. Table 1. FDI flows in the host economy, by geographical origin. (Millions of US dollars)
") Table 1. FDI flows in the host economy, by geographical origin World 3 732 8 046 3 319 2 823 4 750 7 652 12 451-1 144 718 7 359 2 550 4 158 Developed economies 3 638 8 003 2 382 2 863 4 934 7 258 12 450-855
Table 1. FDI flows in the host economy, by geographical origin World 3 732 8 046 3 319 2 823 4 750 7 652 12 451-1 144 718 7 359 2 550 4 158 Developed economies 3 638 8 003 2 382 2 863 4 934 7 258 12 450-855
Tourism Snapshot. June 2015 Volume 11, Issue 6. A focus on the markets in which Destination Canada (DC) and its partners are active.
 and its partners are active.") Tourism Snapshot Tourism PEI / Paul Baglole A focus on the markets in which Destination Canada (DC) and its partners are active. www.destinationcanada.com June Volume 11, Issue 6 Key highlights Over the
Tourism Snapshot Tourism PEI / Paul Baglole A focus on the markets in which Destination Canada (DC) and its partners are active. www.destinationcanada.com June Volume 11, Issue 6 Key highlights Over the
EXPORT PERFORMANCE MONITOR
 India s Exports Recorded High Growth Provisional figures available for April, 2007 show that India s merchandise exports during April 2007 are valued at US $ 10575.11 million ($ 10.57 billion) which is
The most innovative knowledge platform for hoteliers
 The most innovative knowledge platform for hoteliers WHAT IS / Hotelier Academy Hotelier Academy is the new web platform created to spread knowledge and inspiration to global hoteliers. The platform provides
Sprint Real Solutions Switched Data Service International Rates from the U.S. Mainland, Hawaii, Puerto Rico, and the U.S.
 1* The international rates below apply to calls from the U.S. Mainland, Hawaii, Puerto Rico, and the U.S. Virgin Islands. The usage rates below reflex the discount found in Section 6.4 of Schedule No.
International Visitation to the Northern Territory. Year ending March 2017
 International Visitation to the Northern Territory Year ending March 217 The following is a summary of information relevant to the Northern Territory tourism industry including visitation results from
Queenstown. newzealand.com. youth. Market information about our Visitors and our Active Considerers
 Queenstown youth Market information about our Visitors and our Active Considerers newzealand.com PAST VISITORS HISTORIC VIEW TOTAL ARRIVALS YE SEPTEMBER 2017 CHINA 408K 11% JAPAN 102K 3% UK 246K 7% Fiordland
TRADE IN SERVICES: NEW GROWTH OPPORTUNITIES TOURISM AS AN INTERNATIONALLY TRADED SERVICE
 DOHA, QATAR, 19 APRIL 212 TRADE IN SERVICES: NEW GROWTH OPPORTUNITIES TOURISM AS AN INTERNATIONALLY TRADED SERVICE Marcio Favilla L. de Paula Executive Director for Competitiveness, External Relations
Tourism Snapshot. A focus on the markets in which the CTC and its partners are active. February 2015 Volume 11, Issue 2.
 Tourism Snapshot Tourism Whistler/Mike Crane A focus on the markets in which the CTC and its partners are active www.canada.travel/corporate February Volume 11, Issue 2 Key highlights The strong beginning
Example report: numbers are for illustration purposes only
 www.iata.org/pax-forecast Example report: numbers are for illustration purposes only Country Report - United States Page Table of Contents 1 Market Overview 2 Top Country Pairs 3 Annual Market Regional
Airline financial performance and longterm developments in air travel markets
 Airline financial performance and longterm developments in air travel markets March 2018 Brian Pearce, Chief Economist, IATA www.iata.org/economics % of invested capital Investor returns falling but above
Tourism Snapshot A focus on the markets in which the CTC and its partners are active
 Tourism Snapshot A focus on the markets in which the CTC and its partners are active www.canada.travel/corporate January 214 Volume 1, Issue 1 Key highlights Total arrivals from CTC s international markets
NICKI KENYON GENERAL MANAGER CONSUMER MARKETS VISIT VICTORIA. VICTORIAN TOURISM CONFERENCE 25 July 2017
 NICKI KENYON GENERAL MANAGER CONSUMER MARKETS VISIT VICTORIA VICTORIAN TOURISM CONFERENCE 25 July 2017 OVERVIEW Victoria s Visitor Economy Strategy & Targets Victoria s tourism performance Priorities for
1.0 Introduction Zambia s Major Trading Partners Zambia s Major Export Markets... 4
 Bank of Zambia CONTENTS 1.0 Introduction... 3 2.0 Zambia s Major Trading Partners... 3 3.0 Zambia s Major Export Markets... 4 4.0 Major Source Countries Of Zambia s Imports... 5 5.0 Direction Of Trade
Tourism Snapshot. A focus on the markets in which the CTC and its partners are active. January 2013 Volume 9, Issue 1.
 Tourism Snapshot Nathan Phillips Square Skating Rink at City Hall Francisco Pardo A focus on the markets in which the CTC and its partners are active www.canada.travel/corporate January 2013 Volume 9,
THE GROWTH OF THE HOSPITALITY INDUSTRY IN DUBAI
 THE GROWTH OF THE HOSPITALITY INDUSTRY IN DUBAI THE DEFINITION OF TOURISM Tourism is travel for recreational, leisure or business purposes. The World Tourism Organization defines tourists as people "traveling
Victoria s International Tourism Performance
 Victoria s International Tourism Performance Results from International Visitor Survey (IVS) for the year ending December 2018 Data Source: Tourism Research Australia, released March 2019 To note: This
JUNE 2017 AUCKLAND ECONOMIC INSIGHTS SERIES ENGAGING GLOBALLY AUCKLAND S TRADING LINKAGES. aucklandnz.com/business nzier.org.nz
 AUCKLAND ECONOMIC INSIGHTS SERIES ENGAGING GLOBALLY AUCKLAND S TRADING LINKAGES aucklandnz.com/business nzier.org.nz JUNE 2017 4 AUCKLAND ECONOMIC INSIGHTS SERIES 1 2 3 4 Advanced Industries Auckland s
III. TRADE IN COMMERCIAL SERVICES BY CATEGORY
 .. TRADE IN COMMERCIAL SERVICES BY CATEGORY Transportation services China records impressive growth of world transportation services reached $750 billion in 2007, an increase of 19 per cent, following
International Visitation to the Northern Territory. Year ending June 2017
 International Visitation to the Northern Territory Year ending June 217 The following is a summary of information relevant to the Northern Territory tourism industry including visitation results from Tourism
Education as an Export for Australia: Green Shoots, First Swallows, but Not Quite Out of the Woods Yet Stephen Connelly and Alan Olsen
 Education as an Export for Australia: Green Shoots, First Swallows, but Not Quite Out of the Woods Yet Stephen Connelly and Alan Olsen (This is the paper behind the presentation at the Australian International
GOLDEN OPPORTUNITY: Timeshare Meets Asia A T H O C C O N F E R E N C E
 GOLDEN OPPORTUNITY: Timeshare Meets Asia A T H O C C O N F E R E N C E 2 0 1 8 1 Jonathan Mills Managing Director, RCI APAC & DAE Global Jonathan Mills is the Managing Director for RCI s Asia Pacific and
VISIT MALAYSIA YEAR. Successful Promotion: UNWTO CONFERENCE MAINSTREAMING TOURISM IN THE MEDIA. Datuk Dr. Victor Wee Chairman, Tourism Malaysia
 UNWTO CONFERENCE MAINSTREAMING TOURISM IN THE MEDIA Successful Promotion: VISIT MALAYSIA YEAR 2007 Datuk Dr. Victor Wee Chairman, Tourism Malaysia 24 March 2011, Colombo, Sri Lanka WHY VISIT MALAYSIA YEAR
Domestic Tourism. in Asia and the Pacific
 Domestic Tourism in Asia and the Pacific Table of Contents Foreword 9 Acknowledgement 11 Executive Summary 13 Introduction 41 1 Australia 51 1.1 Domestic Tourism in Australia 51 1.1.1 Introduction 51 1.1.2
Tourism Snapshot A focus on the markets that the CTC and its partners are active in Ontario June 2011 Volume 7, Issue 6
 Tourism Snapshot Ontario A focus on the markets that the CTC and its partners are active in www.canada.travel/corporate June 2011 Volume 7, Issue 6 Key highlights In June 2011, overnight travel to Canada
Mexico. How does Travel & Tourism compare to other sectors? GDP. Size. Share. Mexico GDP Impact by Industry. Mexico GDP Impact by Industry
 Mexico Chapultepec Castle in Mexico City Agriculture Automotive Manufacturing Banking Chemicals Manufacturing Communications Education Financial Services Mining Other Service Exports Retail (without wholesale)
Tourism Snapshot A Monthly Monitor of the Performance of Canada s Tourism Industry
 Tourism Snapshot A Monthly Monitor of the Performance of Canada s Tourism Industry January 2017 Volume 13, Issue 1 Edmonton Tourism www.destinationcanada.com Tourism Snapshot January 2017 1 KEY HIGHLIGHTS
Chart 2. International Student Nights in NSW
 International Student Visitors to NSW Year Ended March 2017 INTRODUCTION The International Education segment in Australia and NSW has had a resurgence and is growing. According to the Department of Education
Sprint Real Solutions Switched Data Service International Rates from the U.S. Mainland, Hawaii, Puerto Rico, and the U.S.
 1* The international rates below apply to calls from the U.S. Mainland, Hawaii, Puerto Rico, and the U.S. Virgin Islands. The usage rates below reflex the discount found in Section 6.4 of Schedule No.
Tourism Snapshot A focus on the markets that the CTC and its partners are active in
 Tourism Snapshot A focus on the markets that the CTC and its partners are active in Newfoundland and Labrador www.canada.travel/corporate October 2011 Volume 7, Issue 10 Key highlights In October 2011,
AFTA Travel Trends. July 2017
 AFTA Travel Trends July 2017 AFTA Travel Trends Report 2017 Inbound and Outbound overview Introduction This snapshot provides an overview of the balance of trade between Inbound and Outbound Travel for
KINGDOM OF CAMBODIA NATION RELIGION KING 3
 KINGDOM OF CAMBODIA NATION RELIGION KING 3 TOURISM STATISTICS REPORT March 2014 MINISTRY OF TOURISM Statistics and Tourism Information Department No. A3, Street 169, Sangkat Veal Vong, Khan 7 Makara, Phnom
AUCKLAND DESTINATION OVERVIEW
 AUCKLAND DESTINATION OVERVIEW JUNE 218 An in-depth overview of Auckland s visitor economy from the latest arrival, accommodation, spend and cruise data through to past five-year commentary. Prepared July
Austrade: Global connections for the ELT industry. Peter Mackey Senior Industry Adviser Education & Training
 Austrade: Global connections for the ELT industry Peter Mackey Senior Industry Adviser Education & Training What will I cover? Who are we? Austrade Services The Austrade Education network Value of Education
Strong outbound tourism demand from both traditional and emerging markets in 2017
 Strong outbound tourism demand from both traditional and emerging markets in 2017 Virtually all source markets reported higher tourism spending in 2017, reflecting continued strong demand for international
ICCA & the International Association Meetings ICCA-JNTO-JTA Bid Workshop 2013
 ICCA & the International Association Meetings ICCA-JNTO-JTA Bid Workshop 2013 Asia continues to be one of the most dynamic meetings regions in the world, and has continued to grow and develop throughout
Sprint Real Solutions Switched Data Service International Rates from the U.S. Mainland, Hawaii, Puerto Rico, and the U.S.
 1* The international rates below apply to calls from the U.S. Mainland, Hawaii, Puerto Rico, and the U.S. Virgin Islands. The usage rates below reflex the discount found in Section 6.4 of Schedule No.
KINGDOM OF CAMBODIA NATION RELIGION KING 3
 KINGDOM OF CAMBODIA NATION RELIGION KING 3 TOURISM STATISTICS REPORT June 2014 MINISTRY OF TOURISM Statistics and Tourism Information Department No. A3, Street 169, Sangkat Veal Vong, Khan 7 Makara, Phnom
Premier Vision. April 2017
 Premier Vision April 2017 Contents Tax Free Trends Summary 03 Tax Free Sales Trends 05 Feature: 2017 Evidences a Resurgence in Tourism to Italy 07 Tax Free Sales by Destination and Source 08 Top 5 Visitor
Prospects for international tourism
 Prospects for international tourism Project LINK UN DESA Expert Group Meeting on the World Economy, NYC, USA 24-26 October 211 John G.C. Kester Programme Manager, Tourism Trends and Marketing Strategies
AFTA s 2017 Foreign Policy White Paper Submission
 AFTA s 2017 Foreign Policy White Paper Submission Page 1 of 10 About AFTA Ltd (AFTA) was founded in 1957 to: establish professional standards for travel agents; stimulate and promote travel; bring together
Who we spoke to. Long haul travellers across 15 of Australia s key tourism markets
 Who we spoke to Long haul travellers across 15 of Australia s key tourism markets Importance factors for destination choice Read as: 16% of respondents rate exciting events, local festivals and celebrations
Backpackers to the Northern Territory DEPARTMENT OF TOURISM AND CULTURE. Executive Summary June 2018
 Backpackers to the Northern Territory DEPARTMENT OF Executive Summary June 2018 Background and Objectives DEPARTMENT OF There has been a continuous decline in international backpacker numbers since the
WHAT ARE THE TRENDS TO LOOK OUT FOR?
 WHAT ARE THE TO LOOK OUT FOR? Prepared by IPK International on behalf of ITB Berlin, The World s Leading Travel Trade Show INTRODUCTION The global tourism industry continues its success story with another
EUROPEAN CENTRE FOR DISEASE PREVENTION AND CONTROLInfluenza A(H1N1)v
v") Table 1: Reported new confirmed cases and cumulative number of influenza A(H1N1)v and cumulative deaths among confirmed cases by country as of August, 1: hours (CEST) in the EU and EFTA countries Confirmed
Table 1: Reported new confirmed cases and cumulative number of influenza A(H1N1)v and cumulative deaths among confirmed cases by country as of August, 1: hours (CEST) in the EU and EFTA countries Confirmed
Working with partners How collaboration helped build one of the world s greatest international student cities
 Working with partners How collaboration helped build one of the world s greatest international student cities 20 October 2016 Tim Ada Deputy Secretary (A/g) Department of Economic Development, Jobs, Transport
Economic Benefits of Air Transport in El Salvador
 Economic Benefits of Air Transport in El Salvador Economic Benefits of Air Transport in El Salvador Acknowledgements Oxford Economics acknowledges the assistance from the International Air Transport Association
Tourism Snapshot A Monthly Monitor of the Performance of Canada s Tourism Industry
 Tourism Snapshot A Monthly Monitor of the Performance of Canada s Tourism Industry December Volume 12, Issue 12 Michelle Valberg www.destinationcanada.com Tourism Snapshot December 1 KEY HIGHLIGHTS With
United Kingdom. How does Travel & Tourism compare to other sectors? GDP. Size. Share. UK GDP Impact by Industry. UK GDP Impact by Industry
 United Kingdom Stonehenge in Wiltshire Agriculture Automotive Banking Chemicals Communications Education Financial Mining Other Service Manufacturing Manufacturing Services Exports Retail (without wholesale)
Global travel patterns: an overview
 Journal of Travel Medicine, 2017, 1 5 doi: 10.1093/jtm/tax007 Perspective Perspective Global travel patterns: an overview Dirk Glaesser*, John Kester, Hanna Paulose, Abbas Alizadeh, and Birka Valentin
Economic Benefits of Air Transport in Panama
 Economic Benefits of Air Transport in Panama Economic Benefits of Air Transport in Panama Acknowledgements Oxford Economics acknowledges the assistance from the International Air Transport Association
1.0 Introduction Zambia s Major Trading Partners Zambia s Major Export Markets... 4
 Bank of Zambia CONTENTS 1.0 Introduction... 3 2.0 Zambia s Major Trading Partners... 3 3.0 Zambia s Major Export Markets... 4 4.0 Major Source Countries Of Zambia s Imports... 5 5.0 Direction Of Trade