Optimization of Airspace and Procedures in the Metroplex (OAPM) Study Team Final Report Southern California Metroplex
|
|
|
- Leonard Morrison
- 5 years ago
- Views:
Transcription
 Study Team Final Report Southern California Metroplex")
1 Federal Aviation Administration Optimization of Airspace and Procedures in the Metroplex (OAPM) Study Team Final Report Southern California Metroplex
2 Table of Contents 1 Background 1 2 Purpose of Southern California Team Effort 2 3 Southern California OAPM Study Team Analysis Process Five Step Process Southern California Study Area Scope Assumptions and Constraints Assessment Methodology Track Data Selected for Analyses Analysis Tools Determining the Number of Operations and Modeled Fleet Mix Determining Percent of RNAV Capable Operations by Airport Profile Analyses Cost to Carry (CTC) Benefits Metrics Key Considerations for Evaluation of Impacts and Risks 13 4 Identified Issues and Proposed Solutions Design Concepts Southern California Departures LAX Departures SAN Departures LGB Departures SNA Departures BUR and VNY Departures ONT Departures Satellite Airport Departures Summary of Southern California Departure Benefits Southern California Arrivals LAX Arrivals SAN Arrivals LGB and SNA Arrivals ONT Arrivals BUR and VNY Arrivals Satellite Airport Arrivals 95 i
3 4.3.7 Summary of Southern California Arrival Benefits Other Southern California Issues SMO/LAX Interactions T-Routes RNP Approaches Southern California OAPM Issues Not Addressed or Requiring Additional Input Issues for Consideration during Design and Implementation Issues Outside of the Scope of OAPM Limits of Design Process Summary of Benefits Qualitative Benefits Near-Term Impacts Long-Term Impacts to Industry Quantitative Benefits 119 ii
4 List of Figures Figure 1. Sample Analysis: Lateral and Vertical Baselines 12 Figure 2. Benefits, Impacts, and Risks of the Departure Proposals 16 Figure 3. Current and Proposed LAX CASTA SID 17 Figure 4. Current and Proposed LAX HOLTZ SID 19 Figure 5. Current and Proposed LAX KARVR SID 21 Figure 6. TRM MIT Restrictions 22 Figure 7. Current and Proposed LAX OSHNN SID 24 Figure 8. LAX LOOP and OSHNN Departures 26 Figure 9. Proposed LAX VTU Departure 28 Figure 10. Current and Proposed LAX GABRE SID 29 Figure 11. Current and Proposed SAN PEBLE SID 31 Figure 12. Current SAN POGGI Jump Zone Interactions 33 Figure 13. Current and Proposed SAN POGGI SID 34 Figure 14. Proposed SAN LNSAY SID 35 Figure 15. Proposed LGB NELLY SID 36 Figure 16. Current and Proposed LGB SENIC SID 38 Figure 17. Current and Proposed SNA CHANL SID 39 Figure 18. Current and Proposed BUR VNY9 SID 41 Figure 19. Proposed VNY CANOG/NUAL SID 43 Figure 20. Current and Proposed ONT POM SID 44 Figure 21. Current and Proposed ONT PRADO SID 46 Figure 22. Proposed CRQ TRM SID 47 Figure 23. Proposed FUL SID 48 Figure 24. Current and Proposed SBA SIDs 49 Figure 25. Benefits, Impacts, and Risks of the Arrival Proposals 51 Figure 26. Current and Proposed LAX RIIVR and SEAVU STARs 52 Figure 27. Restrictions over HEC/MLF by Cause 53 Figure 28. Restrictions over HEC/MLF by MIT Value 53 Figure 29. Restrictions over PGS/TBC by Cause 54 Figure 30. Restrictions over PGS/TBC by MIT Value 54 Figure 31. Restrictions over TNP/DRK/J4 by Cause 55 Figure 32. Restrictions over TNP/DRK/J4 by MIT Value 55 iii
5 Figure 33. TAAM-Modeled Vectoring Patterns on RIIVR and SEAVU, With and Without Airspace Constraint 58 Figure 34. Proposed LAX OLDEE STAR 60 Figure 35. Proposed LAX OLDEE, RIIVR, and SEAVU STARs 61 Figure 36. Current and Proposed LAX VISTA STAR 63 Figure 37. Current and Proposed LAX KEACH STAR 65 Figure 38. Current and Proposed LAX SYMON STAR 67 Figure 39. Proposed LAX BUFIE STAR 69 Figure 40. Current and Proposed LAX KIMMO STAR 71 Figure 41. Proposed LAX BASET and HOUND STARs 72 Figure 42. Proposed LAX MOOR STAR 74 Figure 43. Proposed LAX FICKY STAR 75 Figure 44. Current and Proposed SAN BAYVU STAR 76 Figure 45. Proposed SAN LYNDI STAR 78 Figure 46. Current LGB and SNA KAYOH STAR and Proposed LGB and SNA KEFFR STAR 79 Figure 47. Current LGB and SNA TANDY STAR and Proposed LGB and SNA QMARK STAR 81 Figure 48. Current and Proposed ONT SETER STAR 83 Figure 49. Proposed ONT, LGB/SNA, and LAX Vertical Paths 84 Figure 50. Current and Proposed ONT ZIGGY STAR 85 Figure 51. Current and Proposed ONT BLKMN STAR 87 Figure 52. Current and Proposed BUR and VNY JANNY STAR 88 Figure 53. Proposed BUR and LAX STARs from the North 90 Figure 54. Current and Proposed VNY AALLL STAR 92 Figure 55. Proposed BUR, VNY, and SMO Small Prop STAR 93 Figure 56. BUR, VNY, SMO, CMA, and OXR New East STAR 94 Figure 57. Current and Proposed NZY and SDM BARET STAR 95 Figure 58. Current and Proposed CRQ FODDR STAR 96 Figure 59. Proposed SBA KWANG STAR 97 Figure 60. Proposed CMA, OXR, and NTD New GUERA and NLMAN STARs 98 Figure 61. Proposed SMO Runway 03 RNAV Approach 101 Figure 62. Proposed SMO Runway 03 RNAV SID 102 Figure 63. Proposed SMO Runway 21 RNAV Approach 103 Figure 64. Proposed SMO Runway 03 RNAV Approach 104 Figure 65. Current V186 and Proposed T-Route 106 iv
6 Figure 66. Current V66 and Proposed T-Route 107 Figure 67. Current LAS Routing and Proposed T-Route 108 Figure 68. RNP AR Approach to Runway 24R at LAX 109 Figure 69. RNP AR Approach to Runway 30 at LGB 110 Figure 70. RNP AR Approach to Runway 15 at BUR 111 Figure 71. RNP AR Approach to Runway 27 at SAN 112 Figure 72. RNP AR Approach to Runway 16 at VNY 113 Figure 73. RNP AR Approach to Runways 10 and 28 at UDD 114 Figure 74. RNP AR Approach to Runways 17 and 35 at TRM 115 v
7 List of Tables Table 1. Radar Track Data Analysis Days 6 Table 2. Modeled Runway Configurations at Southern California Airports 7 Table 3. Southern California Modeled Fleet Mixes 9 Table 4. RNAV Equipage by Airport 10 Table 5. Proposed LAX CASTA SID Annual Benefits 18 Table 6. Proposed LAX HOLTZ SID Annual Benefits 20 Table 7. Proposed LAX KARVR SID Annual Benefits 23 Table 8. Proposed LAX OSHNN SID Annual Benefits 25 Table 9. Proposed LAX LOOP SID Annual Benefits 27 Table 10. Proposed SAN PEBLE SID Annual Benefits 32 Table 11. Proposed LGB NELLY SID Annual Benefits 37 Table 12. Proposed SNA CHANL SID Annual Benefits 40 Table 13. Proposed BUR VNY9 SID Annual Benefits 42 Table 14. Proposed ONT POM SID Annual Benefits 45 Table 15. Total Annual Fuel Burn Benefits for Southern California Departures 50 Table 16. Proposed LAX RIIVR STAR Annual Benefits (Profile and Filed Mile Changes Only) 57 Table 17. Proposed LAX SEAVU STAR Annual Benefits (Profile and Filed Mile Changes Only) 57 Table 18. Proposed LAX RIIVR and SEAVU STARs Annual Benefits (Delay Vectoring Mitigation) 59 Table 19. Proposed LAX OLDEE STAR Annual Benefits 62 Table 20. Proposed LAX VISTA STAR Annual Benefits 64 Table 21. Proposed LAX KEACH STAR Annual Benefits 66 Table 22. Proposed LAX SYMON STAR Annual Benefits 68 Table 23. Proposed LAX BUFIE STAR Annual Benefits 70 Table 24. Proposed SAN BAYVU STAR Annual Benefits 77 Table 25. Proposed LGB and SNA KEFFR STAR Annual Benefits 80 Table 26. Proposed LGB and SNA QMARK STAR Annual Benefits 82 Table 27. Proposed ONT SETER STAR Annual Benefits 84 Table 28. Proposed ONT ZIGGY STAR Annual Benefits 86 Table 29. Proposed BUR JANNY STAR Annual Benefits 89 Table 30. Proposed BUR CANYN STAR Annual Benefits 91 Table 31. Total Annual Fuel Burn Benefits for Southern California Arrivals 99 vi
8 Table 32. Total Annual Fuel Benefits Associated with Distance, Profile, and Filed Mile Changes 119 Table 33. Total Annual ADOC Benefits for Proposed RIIVR and SEAVU STARs 120 Table 34. Total Annual Fuel Benefits Associated with LAX and SMO Interactions 120 Table 35. Total Annual Benefits 120 vii
9 1 Background In September 2009, the Federal Aviation Administration (FAA) received the RTCA s Task Force 5 Final Report on Mid-Term NextGen Implementation containing recommendations concerning the top priorities for the implementation of NextGen initiatives. A key component of the RTCA recommendations is the formation of teams leveraging FAA and Industry Performance Based Navigation (PBN) expertise and experience to expedite implementation of optimized airspace and procedures. Optimization of Airspace and Procedures in the Metroplex (OAPM) is a systematic, integrated, and expedited approach to implementing PBN procedures and associated airspace changes. OAPM was developed in direct response to the recommendations from RTCA s Task Force 5 on the quality, timeliness, and scope of metroplex solutions. OAPM focuses on a geographic area, rather than a single airport. This approach considers multiple airports and the airspace surrounding a metropolitan area, including all types of operations, as well as connectivity with other metroplexes. OAPM projects will have an expedited life-cycle of approximately three years from planning to implementation. The expedited timeline of OAPM projects centers on two types of collaborative teams: OAPM Study Teams (OSTs) provide a comprehensive but expeditious front-end strategic look at each major metroplex. Using the results of the OSTs, Design and Implementation (D&I) Teams provide a systematic, effective approach to the design, evaluation and implementation of PBN-optimized airspace and procedures. 1
10 2 Purpose of Southern California Team Effort The principle objective of the Southern California OST is to identify operational issues and propose PBN procedures and/or airspace modifications in order to address them. This OAPM project for the Southern California Metroplex seeks to optimize and add efficiency to the operations of the area. These efficiencies include making better use of existing aircraft equipage by adding Area Navigation (RNAV) procedures, optimizing descent and climb profiles to eliminate or reduce level-offs, creating diverging departure paths that will get aircraft off the ground and on course to their destination faster, and adding more direct high-altitude RNAV routes between two or more metroplexes, among others. The OST effort is intended as a scoping function. The products of the OST will be used to scope future detailed design efforts and to inform FAA decision-making processes concerning commencement of those design efforts. 2
11 3 Southern California OAPM Study Team Analysis Process 3.1 Five Step Process The Southern California OST followed a five step analysis process: 1. Collaboratively identify and characterize existing issues: a) Review current operations b) Solicit input to obtain an understanding of the broad view of operational challenges in the metroplex 2. Propose conceptual procedure designs and airspace changes that will address the issues and optimize the operation: a) Use an integrated airspace and PBN toolbox (Appendix C) b) Obtain technical input from operational stakeholders c) Explore potential solutions to the identified issues 3. Identify expected benefit, quantitatively and qualitatively, of the conceptual designs: a) Assess the Rough Order of Magnitude (ROM) impacts of conceptual designs b) To the extent possible, use objective and quantitative assessments 4. Identify considerations and risks associated with proposed changes: a) Describe, at a high-level, considerations (e.g., if additional feasibility assessments are needed) and/or risks (e.g., if waivers may be needed) 5. Document the results from the above steps Steps 1 and 2 are worked collaboratively with local facilities and operators through a series of outreach meetings. Step 3 is supported by the OAPM National Analysis Team (NAT). The methodology used for the quantitative analysis is described in Section 3.4. The NAT is a centralized analysis and modeling capability that is responsible for data collection, visualization, analysis, simulation, and modeling. Step 4 is conducted with the support of the OAPM Specialized Expertise Cadre (SEC). The SEC provides on-call expertise from multiple FAA lines of business, including environmental, safety, airports, and specific programs like Traffic Management Advisor (TMA). The Southern California OST process and schedule are shown below: Kickoff meeting: August 11(at Los Angeles Regional Office) Discuss concepts and proposed schedules Establish facility points of contact 3
12 Make data requests Administrative week: August First Outreach: Existing Operations and Planning FAA Facilities: August at Los Angeles ARTCC (ZLA) and Southern California TRACON (SCT) Stakeholders: August 30 (at Los Angeles Regional Office) OST work (focus on operational challenges): August 29 September 18 Second Outreach: Enhancement Opportunities FAA Facilities: September (at SCT) Stakeholders: September 27 (at Los Angeles Regional Office) OST work (focus on solutions, costs, and benefits): September 28 October 28 Final Outreach: Summary of Recommendations FAA Facilities: November 1 (at Los Angeles Regional Office) Stakeholders: November 3 (at Los Angeles Regional Office) Documentation: Final report, briefing, and D&I Team package OST work (completing documentation): November 7 17 Report due November 18 There were three rounds of outreach to local facilities, industry, and other stakeholders, including Department of Defense, airlines, business and general aviation, airports, and others. The first outreach focused on issue identification, the second on conceptual solutions, and the third on summarizing the analyses of benefits, impacts, and risks. Assessments at this stage in the OAPM process are expected to be high-level, as detailed specific designs (procedural and/or airspace) have not yet been developed. More detailed assessments of benefits, impacts, costs and risks are expected after the D&I phase has been completed. 3.2 Southern California Study Area Scope The Southern California Metroplex consists of airspace delegated to the SCT and ZLA. Operations at eight airports within the lateral confines of SCT s airspace were examined closely due to the complexity of the interactions between these airports: Los Angeles International Airport (LAX) San Diego International Airport (SAN) Bob Hope Airport (BUR) Ontario International Airport (ONT) 4
13 John Wayne Airport Orange County (SNA) Long Beach/Daugherty Field (LGB) Santa Monica Municipal Airport (SMO) Van Nuys Airport (VNY) Fuel burn modeling was performed for all of the above airports except VNY and SMO. VNY and SMO were excluded due to low instrument flight rules (IFR) jet traffic counts. Other satellite airports operations and issues were also examined, as appropriate, including Fullerton (FUL), Carlsbad (CRQ), Santa Barbara (SBA), Bermuda Dunes (UDD), Camarillo (CMA), Pt. Mugu Naval Air Station (NTD), Oxnard (OXR), Palm Springs (PSP), North Island Naval Air Station (NZY), Brown Field (SDM), and Thermal (TRM), among others. 3.3 Assumptions and Constraints OAPM is an optimized approach to integrated airspace and procedures projects; thus, the proposed solutions center on PBN procedures and airspace redesign. The OST is expected to document those issues that cannot or should not be addressed by airspace and procedures solutions, as these will be shared with other appropriate program offices. These issues are described in Sections 4.5 and 4.6 of this report. The OAPM expedited timeline and focused scope bound airspace and procedures solutions to those that can be achieved without requiring an Environmental Impact Statement (EIS) (e.g., only requiring an Environmental Assessment [EA] or qualifying for a Categorical Exclusion [CATEX]) and are within current infrastructure and operating criteria. The OST may also identify airspace and procedures solutions that do not fit within the environmental and criteria boundaries of an OAPM project. These other recommendations then become candidates for other integrated airspace and procedures efforts. 3.4 Assessment Methodology Both qualitative and quantitative assessments were made to gauge the potential benefits of proposed solutions. The qualitative assessments are those that the OST could not measure but would result from the implementation of the proposed solution. These assessments included: Impact on air traffic control (ATC) task complexity Ability to apply procedural separation (e.g., laterally or vertically segregated flows) National Airspace System (NAS) impacts of flow deconfliction Ability to enhance safety Improved connectivity to en route structure 5
14 Reduction in transmissions (flight deck and controller) and related reduction in frequency congestion Improved track predictability and repeatability, with associated more accurate fuel planning Reduced reliance on ground-based navigational aids (NAVAIDs) Increased throughput Task complexity, for example, can be lessened through the application of structured PBN procedures versus the use of radar vectors, but quantifying that impact is difficult. Reduced communications between pilot and controller, as well as reduced potential for operational errors, are examples of metrics associated with controller task complexity that were not quantified. For the quantitative assessments, the OST relied on identifying changes in track lengths, flight times, and fuel burn. Most of these potential benefits were measured by comparing a baseline case with a proposed change using both fuel burn tables based on the European Organization for the Safety of Air Navigation (EUROCONTROL) Base of Aircraft Data (BADA) fuel burn model and a flight simulator, which was used to establish a relationship between simulator fuel burn results and BADA tables. The quantitative analyses compared full-time use of current procedures under baseline conditions with full-time use of the procedures proposed by the OST Track Data Selected for Analyses During the study process, a representative set of radar traffic data was utilized in order to maintain a standardized operational reference point. For determining the number, length, and location of level-offs for the baseline of operational traffic, radar track data from 30 high-volume (70 th -90 th percentile) days, operating under Visual Meteorological Conditions (VMC) in 2010 and 2011, were utilized. These days were selected using the Airport Specific Performance Metrics (ASPM) operational counts and weather data. Table 1 shows the analysis days utilized by the Southern California OST and the NAT. Table 1. Radar Track Data Analysis Days 05/07/ /12/ /13/ / /14/ /15/ /16/ /19/ /20/ /29/ /27/ /01/ /03/ /04/ /05/ /12/ /02/ /03/ /13/ /03/ /04/ /11/ /28/ /09/ /10/ /11/ /18/ /15/ /27/ /28/2011 The historical radar track data were used to visualize the flows and identify where short-cuts were routinely applied, as well as where flight planned routes were more rigorously followed. 6
15 The track data were also used as a baseline for the development of several conceptual solutions, including PBN routes and procedures. In many cases, the OST overlaid the historical radar tracks with PBN routes or procedures to minimize the risk of significant noise impact and an associated EIS. Due to the compressed schedule associated with this study effort, there was not sufficient time to model all Southern California airports. Fuel burn modeling was performed at the six airports with the most IFR jet operations. The characteristics of the Southern California Metroplex are unique in that most of the airports have a predominant runway configuration (see Table 2). Historically, Southern California airports are in a west flow operation approximately 95% of the time or higher as shown Table 2. The OST focused their benefits analyses on these heavily-used runway configurations. Table 2. Modeled Runway Configurations at Southern California Airports 1 Airport Arrival Runways Departure Runways % Time in Flow % Ops in Flow Comments LAX 24L/R, 25L/R 24L/R, 25L/R 98% 98% 24R and 25L typically used for arrivals, 24L and 25R for departures SNA 19L/R 19L/R 96% 97% SAN % 96% BUR 08, 15 08, 15 96% 96% LGB % 96% ONT 26L/R 26L/R 95% 96% Analysis Tools The following tools were employed by the OST and the NAT in the process of studying the Southern California Metroplex: Performance Data Analysis and Reporting System (PDARS) Historical traffic flow analysis using merged datasets to analyze multi-facility operations (SCT and ZLA) 1 Source: Aviation System Performance Metrics, 5/19/2010 5/18/2011 7
16 Customized reports to measure performance and air traffic operations (i.e., fix loading, hourly breakdowns, origin-destination counts, etc.) Identification and analysis of level flight segments for SCT arrivals and departures Graphical replays to understand and visualize air traffic operations Verification of level-offs in ZLA and SCT airspace Terminal Area Route Generation Evaluation and Traffic Simulation (TARGETS) Comparison of actual flown routes to proposed routes when developing cost/benefit estimates Conceptual airspace and procedure design Total Airport and Airspace Model (TAAM) Airport and airspace flow modeling Integrated Terminal Research, Analysis, and Evaluation Capabilities (itraec) Identification of location, altitude and magnitude of level-off segments Air Traffic Airspace Lab (ATALAB) National Offload Program (NOP) data queries Quantification of traffic demand over time for specific segments of airspace Identification of runway usage over time National Traffic Management Log (NTML) Identification of occurrence and magnitude of TMIs Enhanced Traffic Management System (ETMS) Traffic counts by aircraft group categories for annualizing benefits Examination of filed flight plans to determine impact of significant re-routes Determining the Number of Operations and Modeled Fleet Mix Due to the compressed schedule associated with this study effort, there was not sufficient time to model the entire fleet mix for each airport. A representative fleet mix was developed for each airport that consisted of the primary aircraft types that service that airport. The analysis determined annual operations for these airports by examining one year of FAA s ETMS arrivals and assuming the same number of departures. Fleet mixes for these airports are shown in Table 3. 8
17 Table 3. Southern California Modeled Fleet Mixes Arrival Counts, 5/19/2010 5/18/211 LAX SNA SAN BUR ONT LGB Jets 262,074 54,504 86,502 34,864 33,991 20,003 Non-jets/Unidentified 28,233 13,025 7,438 8,767 7,002 9,016 Total 290,307 67,529 93,940 43,631 40,993 29,019 Modeled AC Type 1 B73s B73s B73s B73s B73s A320s Modeled AC Type 2 B75s B75s B75s CRJs B75s CRJs Modeled AC Type 3 B74s CRJs CRJs LJ35 CRJs LJ35 Modeled AC Type 4 CRJs LJ MD Determining Percent of RNAV Capable Operations by Airport The principal objective of the Southern California OST was to identify operational issues and propose PBN procedures and airspace modifications in order to address them. The PBN Dashboard was used to determine the percent of operations at each airport that would benefit from these new procedures. The PBN Dashboard is an online tool that reports this percentage through analysis of two sources: the equipment suffix of instrument flight rules (IFR) flight planned operations from ETMS and the percentage of PBN-equipped aircraft by type from a Part 121 avionics database maintained by The MITRE Corporation s Center for Advanced Aviation System Development (CAASD). Due to the incomplete nature of the data sources used, the percentages of RNAV-equipped operations are assumed to be conservative. Table 4 lists the RNAV equipage percentages assumed for the modeled Southern California airports. 9
18 Table 4. RNAV Equipage by Airport Airport % of Total Operations RNAVequipped LAX 90% SNA 89% SAN 93% LGB 90% BUR 83% ONT 89% Profile Analyses To determine the current level-offs of arrivals in the Southern California Metroplex, the OST examined track data from the 30 days discussed previously. Using CAASD s itraec toolset, the OST identified the altitudes where level-offs occurred and the average length in nautical miles (NM) that aircraft were in level flight at each altitude. The OST also used TARGETS to calculate the length of the proposed routes compared to the current published routes and actual flown tracks. The reduction in level-offs and the distance savings were then converted into fuel savings by using the BADA fuel flow model, taking into account the modeled aircraft fleet mixes at the metroplex airports. The fuel savings were then annualized, assuming a fuel price per gallon of $2.92, based on fuel costs for May 2011 from Research and Innovative Technology Administration (RITA) Bureau of Transportation Statistics. The resulting benefit numbers were the basis for the minimum potential fuel benefit. Flight simulations were run on a current arrival procedure as well as the corresponding conceptual design during the Washington D.C. Metroplex prototype OST effort. The flight simulator values were obtained through a US Airways A320 flight simulator fuel burn analysis for two transitions on a proposed versus baseline arrival procedure. Derived values for fuel burn per minute in level flight, idle descent, and less-efficient descent were then used to determine and validate the relationship between the flight simulator fuel saving estimates and the BADAbased fuel burn estimates (calculated in gallons per NM). Essentially, this effort allowed for a determination of the difference between BADA s conservative aircraft performance numbers and what could be achieved with an actual pilot flying the plane. This method was applied to Southern California OST results to determine a maximum fuel savings per flight. Applying both the BADA and flight simulator methods provides for a range of potential benefits: Lower bound potential benefit: BADA speed/fuel burn Upper bound potential benefit: Flight simulation speed/fuel burn 10
19 3.4.6 Cost to Carry (CTC) Aircraft fuel loading is based on the planned flight distance and known level-offs. Furthermore, airlines must carry extra fuel to compensate for the weight of the total fuel required to fly a route. This extra fuel is known as the Cost to Carry (CTC). CTC can vary widely among airlines, generally ranging from about 2% to about 15%. For this analysis, based on feedback from multiple industry representatives, CTC was assumed to be 10% at LAX and 6% at all other Southern California modeled airports. This means that for every 100 gallons of fuel loaded, CTC is 6 or 10 gallons. CTC is included in all of the fuel burn estimates presented in this report, reflecting the benefits of developing procedures that more closely align with existing aircraft flight paths Benefits Metrics The benefits metrics were generated using the following process: 1. The radar track data from the 30 high-traffic days were parsed into flows into and out of Southern California. These flows were then analyzed to determine geographic location, altitude, and length of level-offs in the airspace. The average overall track flow length was also estimated. 2. Baseline routes were developed that mimic the average vertical and lateral path of the tracks in the flows. 3. Proposed conceptual routes were designed by the OST. 4. The impacts of the proposed conceptual routes were estimated as compared to the current published procedure for the flow, if any, and the baseline route. a) Vertical savings: Compare the baseline vertical path with its associated level-offs with the proposed vertical path, which ideally has fewer and/or shorter level-offs. b) Lateral filed miles savings: Compare the length of the published procedure or route to the length of the proposed procedure of route. c) Lateral distance savings: Compare the length of the baseline procedure or route to the length of the proposed procedure of route. 5. The fuel and cost savings were then estimated based on the above impacts. a) Vertical profile savings accrue both fuel savings and CTC savings. b) Lateral filed miles savings accrue CTC savings only. c) Lateral distance savings accrue both fuel savings and CTC savings. 11

20 Figure 1 shows published, baseline, and proposed routes for a flow, with the comparisons for lateral savings highlighted, and sample vertical profiles as well. Published procedure Baseline route Proposed route Filed mile savings Distance savings Actual Tracks Vertical Profiles Baseline Level-offs Proposal Level-offs mitigated Figure 1. Sample Analysis: Lateral and Vertical Baselines 12
21 3.5 Key Considerations for Evaluation of Impacts and Risks In addition to the quantitative and qualitative benefits assessments described in Section 3.4, the Southern California OST was tasked with identifying the impacts and risks from the FAA operational and safety perspective, as well as from the airspace user perspective. For each individual issue and proposed solution throughout Section 4 of this report, specific impacts and risks are identified. However, there are a number of impacts and risks that generally apply to many proposed solutions, as described below: Controller and pilot training: With the increased focus on PBN and the proposed changes in airspace and procedures, controller and pilot training will be a key consideration for nearly all proposals. Descend via procedure issues: The proposed use of descend via clearances will similarly require controller and pilot training, and agreement must be reached during D&I on exactly how procedures will be requested, assigned, and utilized from both the FAA and user perspectives. Aircraft equipage: There are challenges with working in a mixed equipage environment, and these risks must be considered during D&I. While procedures have been designed to take advantage of PBN efficiencies, procedures and processes must be developed for conventional operations as well. Safety Risk Management (SRM): Safety is always the primary concern, and all of the proposed solutions will require an SRM assessment, which will occur during the Operational and Environmental Review phase. Environmental issues: All proposed solutions are subject to environmental review, and the OAPM schedule limits that review to a CATEX or EA rather than an EIS. The OST worked with environmental specialists to determine whether any of the proposed solutions has the potential for significant environmental impacts, and developed mitigation alternatives if necessary. 13
22 4 Identified Issues and Proposed Solutions This section presents the findings and results of the Southern California OST analysis. It reviews identified issues, proposed solutions, benefits/impacts/risks, and analysis results. During the first industry and facility interface meetings, approximately 170 issues were identified. ZLA identified 43 of these issues, SCT and the Air Traffic Control Tower (ATCTs) identified 83 issues, and 44 issues were identified by various industry stakeholders. Similar issues raised by all involved parties were consolidated and categorized by the OST to determine potential solutions: Design concepts (see Section 4.1) Southern California departure issues (see Section 4.2) Southern California arrival issues (see Section 4.3) Other Southern California Issues (see Section 4.4) SMO and LAX interactions T-Routes Required Navigation Performance (RNP) approaches Some issues required additional coordination and input and could not be addressed within the time constraints of the OST process. In addition to those issues that were addressed by the Southern California OST and those that require additional coordination, the OST identified a number of issues that were outside of the OAPM scope. These issues are described in Section 4.6 of this report. 4.1 Design Concepts The primary goals used by the Southern California OST throughout the conceptual design phase were to use RNAV everywhere and RNP where beneficial. The use of PBN procedures will allow efficiency gains through optimized profile climbs/descents and enhanced lateral paths not reliant on ground based navigation while allowing predictability and repeatability and reducing ATC task complexity and frequency congestion. The OST removed unused transitions to reduce chart clutter and the potential for improper flight planning. Runway transitions were used where practical, while limiting environmental risks during the D&I phase. The OST recommended the use of transitional separation (3 NM increasing to 5 NM) that may increase airspace throughput for departures. 14
23 4.2 Southern California Departures ZLA and SCT controllers rely on an assortment of conventional and RNAV departure procedures. The facilities use both vectors and route structure where necessary to maintain separation and expedite aircraft climbs into en route airspace. Historical departure tracks demonstrated efficiency when allowed unrestricted climbs. The proposed departure procedures attempt to maintain unrestricted climbs as much as possible, while providing procedural separation where practical from other Standard Instrument Departures (SIDs) and Standard Terminal Arrival Routes (STARs). It is fully expected that ATC will continue to tactically enable shorter routings and remove climb restrictions, further increasing operator benefits. Additionally, the recommended use of transitional separation by SCT and ZLA may increase throughput at Southern California airports. Transitional separation will allow terminal facilities to provide 3 NM in-trail separation increasing to 5 NM in the en route environment. Any airspace modifications that enable procedural efficiencies will also be considered during D&I. One of the major issues in the Southern California metroplex area is level-offs from LAX and LGB airports. These level-offs can range from 10 NM to 25 NM, with LGB experiencing the longest of the level-offs. Many of the Southern California SIDs have unused transitions where actual flight tracks do not overfly the current published procedure. Another major issued raised by both ATC and industry stakeholders is the inefficiency of using the OSHNN SID between 2100 and 0700, which adds between 14 NM to 23 NM to the route compared to the LOOP SID. OST analysis and initial noise screens support continuous use of the LOOP SID. RNAV procedures were designed for repeatable, predictable paths. Independent SIDs were developed for both east and west flows. The OST recognizes that RNAV off-the-ground procedures may create a disbenefit in track miles flown in certain circumstances. The D&I Team may elect to further evaluate the combination of radar vectors and RNAV off-the-ground SIDs to determine the most beneficial method of departing from Southern California airports. With respect to the conceptual departure proposals, Figure 2 depicts benefits, impacts, and risks for the FAA and airspace users, as well as environmental considerations. 15

24 Figure 2. Benefits, Impacts, and Risks of the Departure Proposals LAX Departures This section describes the operational issues, recommendations, and derived benefits the OST has identified for LAX departures LAX CASTA Departure The CASTA accounts for approximately 12% of all jet LAX departures. Issues There is a long level-off at 9,000 feet as the departure flow passes beneath the LAX SADDE arrival flow. Actual flight tracks do not follow the current departure procedure. 16

25 Recommendations The conceptual CASTA SID (see Figure 3) provides for a modified departure flow over GMN to segregate the GMN and COREZ departure flows. The proposed en route transitions closely follow the actual flight tracks. The AVE transition was removed due to lack of usage. An earlier initial turn off LAX will minimize or eliminate the level-off and reduce track miles. Figure 3. Current and Proposed LAX CASTA SID 17
26 Benefits Projected annual savings for the CASTA SID are estimated in Table 5. Table 5. Proposed LAX CASTA SID Annual Benefits LAX HOLTZ Departure The HOLTZ accounts for approximately 26% of all LAX jet departures. Issues The current airspace configuration between SCT and ZLA requires excessive coordination. Runways 24L/R transitions are excessively long and aircraft rarely fly the published route over the DOCAG intersection. 18


27 Recommendations As shown in Figure 4, the OST shortened the transitions from Runways 24L/R by eliminating the DOCAG waypoint from the procedure, thus reducing filed miles by approximately 3 NM. An additional transition fix prior to TRM was added for early turns to PKE when available. Figure 4. Current and Proposed LAX HOLTZ SID 19
28 Benefits Estimated savings from modifications to the HOLTZ departure are derived from the track mile reduction for aircraft departing Runways 24L/R at LAX. Aircraft departing Runways 25L/R will see no changes. Projected annual savings for the HOLTZ SID are estimated in Table 6. Table 6. Proposed LAX HOLTZ SID Annual Benefits LAX KARVR Departure The KARVR accounts for approximately 8% of all LAX jet departures. Issues There are inefficient lateral paths as aircraft are generally vectored to various fixes prior to the KARVR intersection on the current published route. Runways 24L/R transitions are excessively long, and aircraft rarely fly the published route over the DOCAG intersection. The IPL en route transition on the current published procedure is unused. Heavy traffic congestion over TRM Very High Frequency (VHF) Omnidirectional Range (VOR) creates vectored BLH offloads. 20

29 Recommendations As shown in Figure 5, the Runways 24L/R transitions have been shortened to align the procedure with current flight tracks and the IPL transition has been removed from the procedure due to lack of use, but a transitional fix for PILLO has been added to the procedure to allow aircraft a more direct routing to the southeast. A ZLA requested offload route over BLH has been added to shorten overall track miles and to alleviate congestion over TRM. The traffic over TRM was identified as an issue during the outreach meetings. Numerous restrictions are imposed during peak periods to help mitigate the flows. The restrictions, dictated by ZLA, are given to SCT, which in turn are passed along to LAX, LGB, and SNA. The supporting data was obtained from the NTML Miles-In-Trail (MIT) log for the 2010 calendar year. Restrictions were primarily due to volume (VOL), weather (WX), or equipment/frequency failure (EQ); however, pass-back restrictions from beyond TRM were excluded. The metric used is minute-miles. This is calculated by multiplying the total minutes the restriction was in effect by the imposed MIT value (spacing in miles). Over TRM, the total minute-miles in 2010 were 135,281, with restrictions in place on 129 days. On average, restrictions were in place two days a week. The supporting data is shown in Figure 6. Figure 5. Current and Proposed LAX KARVR SID 21

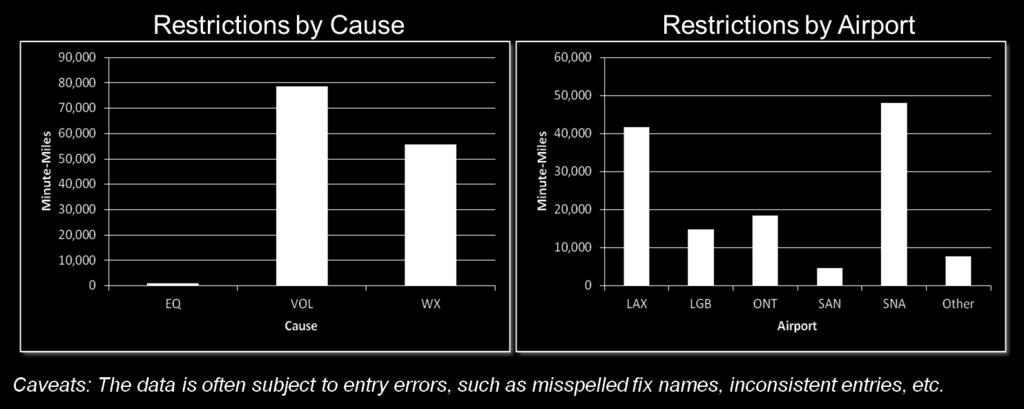
30 Figure 6. TRM MIT Restrictions 22
31 Benefits Since ATC clears aircraft direct to a point along the filed route, the estimated annual fuel savings indicate a disbenefit. This disbenefit could be reduced or mitigated if ATC continues the current practice of providing more direct routings when feasible. With the shortened runway transition, and the addition of the offload route over BLH, this procedure will provide greater flexibility for aircraft flow management. Projected annual savings for the KARVR SID are estimated in Table 7. Table 7. Proposed LAX KARVR SID Annual Benefits LAX OSHNN Departure The OSHNN accounts for approximately 6% of all LAX jet departures. Issues The OSHNN departure from LAX is an RNAV SID that is primarily used from 2100 to 0700 local, when aircraft are not assigned the LOOP departure. Runways 24L/R transitions are excessively long and aircraft rarely fly the published route over the DOCAG intersection. 23
32 The current routing follows the same path as the HOLTZ and KARVR SIDs from the departure runways via the PEVEE waypoint to the HOLTZ waypoint. The OSHNN procedure then transitions to the DAG VOR, which is also where the LOOP SID terminates. Recommendations The OST shortened the transitions from Runways 24L/R by eliminating the DOCAG waypoint from the procedure, thus reducing filed miles by approximately 3 NM as shown in Figure 7. It is envisioned by the OST that the OSHNN would be utilized by those aircraft which would have difficulty meeting the LOOP departure restrictions, such as heavy aircraft with impeded performance capabilities. All other aircraft would be assigned the new LOOP departure. Figure 7. Current and Proposed LAX OSHNN SID Benefits Estimated savings from modifications to the OSHNN departure are derived from the track mile reduction for aircraft departing Runways 24L/R at LAX. Aircraft departing Runways 25L/R will see no changes. 24
33 Projected annual savings for the OSHNN SID are estimated in Table 8. This accounts only for aircraft expected to fly the OSHNN between 0700 and to 2100; aircraft that fly the OSHNN between 2100 and 0700 currently are addressed in the next section. Table 8. Proposed LAX OSHNN SID Annual Benefits LAX LOOP Departure The LOOP accounts for approximately 19% of all LAX jet departures. Issues The LOOP SID is a conventional procedure relying upon ground based navigation and radar vectors. Use of the LOOP SID is not authorized between 2100 and 0700 local. Both ATC and stakeholders have requested to utilize this procedure without restriction. Alternate routes that must be used when the LOOP SID is unavailable result in excessive track mileage. Additionally, departure delays are encountered at all Los Angeles Basin airports due to this configuration. LOOP SID traffic is normally shortcut through R2502E when this airspace is released from military use. Assignable RNAV routing has been requested to accommodate a more efficient route when this airspace is available. Figure 8 shows the current LOOP and OSHNN SID flight tracks. 25

34 Figure 8. LAX LOOP and OSHNN Departures Recommendations The proposed replacement for the LOOP SID is designed as a PBN procedure. Floating waypoints will allow ATC an assignable route through R2502E when the airspace is inactive. The OST recommends 24-hour usage of the RNAV LOOP SID. Initial noise screening supports continuous use of the LOOP. A route reduction of between 14 NM and 23 NM per flight will be realized with unrestricted LOOP availability. Approximately 35 aircraft per day would benefit from this usage. 26

35 Benefits Projected annual savings for the continuous use of the LOOP SID are estimated in Table 9. Table 9. Proposed LAX LOOP SID Annual Benefits LAX VTU Departure The VTU SID accounts for approximately 20% of all LAX jet departures. Issues The VTU SID is a conventional procedure relying on ground based navigational equipment and radar vectors. Because of new separation requirements regarding R2519, the conventional VTU procedure is too close to the restricted area. 27

36 Recommendations The proposed replacement for the VTU SID is designed as a PBN procedure as shown in Figure 9 as the dashed black line. The OST recommends the proposed VTU departure as a replacement for the FIXIT SID, which is expected to be published in February From the runway transitions to FIXIT, the proposed SID follows current flight tracks. After FIXIT, the route proceeds to IKAYE to provide clearance from R2519 when it is active. When R2519 is active, aircraft will fly the full length of the route, approximately 54 NM from FIXIT to RZS. When R2519 is not active, aircraft will be sent direct RZS after FIXIT, approximately 50 NM. Figure 9. Proposed LAX VTU Departure Benefits The flight paths of the proposed RNAV VTU SID mimic the current conventional procedure. Thus, projected annual savings were not modeled. 28

37 LAX GABRE Departure The GABRE is an east flow departure that accounts for less than 1% of all LAX jet departures. Issues The GABRE SID is a conventional procedure relying on ground based navigation and radar vectors. Actual flight tracks do not follow the current departure procedure. Recommendations The proposed replacement for the GABRE SID is designed as a PBN procedure as shown in Figure 10. The proposed procedure will eliminate a sharp S turn and replace it with a more optimal route that closely follows current flight tracks. This will reduce filed and flown miles between 8 and 13 NM. The OST design procedurally deconflicts the proposed procedure from other east flow traffic procedures. Figure 10. Current and Proposed LAX GABRE SID Benefits Due to low traffic counts, no modeling was done for this procedure. 29
38 4.2.2 SAN Departures This section describes the operational issues, recommendations, and derived benefits the OST has identified for departures from SAN SAN PEBLE Departure The PEBLE accounts for approximately 33% of all SAN jet departures. Issues The PEBLE departure is a conventional SID relying on ground based navigation and radar vectors. Actual flight tracks do not follow the current departure procedure. SAN departures to LAS are required to file the SXC transition, direct LAX, direct DAG, resulting in excessive filed miles. Although there are currently two transitions on this SID, the SLI transition is infrequently filed or assigned. Recommendations The proposed replacement for the PEBLE SID is designed as a PBN procedure. Additional transitions were added to closely mimic where aircraft routinely fly. The OST recommends changes to the PEBLE SID that allow for a more direct route to the PEBLE intersection thence transitions to LAX, POM, and RZS (via IKAYE waypoint). This will reduce filed miles significantly, but it is expected aircraft will still be cleared direct DAG when able. Figure 11 shows the current and proposed PEBLE SIDs. 30

39 Figure 11. Current and Proposed SAN PEBLE SID 31
40 Benefits Estimated annual fuel savings indicate a disbenefit. This is mainly due to the fact that, when traffic allows, aircraft are cleared direct to a point along their filed route. With conflicting arrival flows in the area south of Long Beach, it is impossible to mimic what ATC does routinely, i.e., going direct POM and then direct DAG. The new procedure will still allow aircraft to be given direct to DAG when possible and it is significantly shorter than the current filed route over SXC. Projected annual savings for the PEBLE SID are estimated in Table 10. Table 10. Proposed SAN PEBLE SID Annual Benefits 32

41 SAN POGGI Departure The POGGI accounts for approximately 52% of all SAN departures. Issues There are jump zone interactions on a daily basis, which may constrain aircraft operations eastbound as shown in Figure 12. There are speed restrictions of 230 knots or less over the JETTI and LOWMA intersections. Figure 12. Current SAN POGGI Jump Zone Interactions 33

42 Recommendations A new waypoint has been added to the procedure approximately 1.5 NM east of the PGY VOR before turning to BROWS intersection. As shown in Figure 13, this will ensure clearance from the jump zones enhancing the safety of the proposed procedure.. Figure 13. Current and Proposed SAN POGGI SID Benefits Although the speed restrictions over JETTI and LOWMA could not be lifted due to criteria constraints, aircraft now departing on the POGGI will be separated from parachuting activity in both jump zones SAN LNSAY Departure The LNSAY accounts for less than 1% of all SAN jet departures. Issues The LNSAY departure is a conventional SID relying on ground based navigation and radar vectors. The current LNSAY SID is typically used in an east or Runways 09/27 flows, and few aircraft actually follow the current procedure as published. 34
43 Recommendations The proposed replacement for the LNSAY SID is designed as a PBN procedure as shown in Figure 14. Changes include a more direct flight path to the FALCC intersection and thence transitions to SLI and LAX, resulting in a reduction of filed miles. The RNAV route will ensure that aircraft remain within the confines of Class B airspace. Figure 14. Proposed SAN LNSAY SID Benefits Due to low traffic counts on the LNSAY, no modeling was done for this procedure LGB Departures This section describes the operational issues, recommendations, and derived benefits the OST has identified for departures from LGB LGB New NELLY Departure The proposed NELLY accounts for approximately 28% of all LGB jet departures. Issues There is currently no published procedure for north- and northwest-bound departures from LGB. Departure aircraft must rely on radar vectors, and there is a level-off of approximately 22 NM at 9,000 feet. 35
44 The current procedure for LGB north departures requires aircraft to be sequenced with LAX CASTA departures, thereby creating ground delays. Recommendations As shown in Figure 15, the PBN NELLY procedure was designed as a replacement for the radar vector departure procedure used today. The NELLY eliminates the average 22 NM level-off at 9,000 feet by optimizing the route, both vertically and laterally. Compared to the current flight tracks, the proposed NELLY SID significantly reduces the number of track miles flown. The proposed NELLY SID merges with other Los Angeles Basin airport departure flows to the north. Figure 15. Proposed LGB NELLY SID 36
45 Benefits Initial flight simulations indicate that the NELLY will significantly reduce flight times for these departures. Projected annual savings for the NELLY SID are estimated in Table 11. Table 11. Proposed LGB NELLY SID Annual Benefits LGB SENIC Departure The SENIC SID accounts for approximately 53% of all LGB jet departures. Issues The SENIC SID is a conventional procedure relying on ground based navigation and radar vectors The current SENIC procedure has an unused en route transition to IPL. There is heavy congestion over TRM due to Los Angeles Basin traffic, creating departure delays. 37
46 Recommendations The proposed replacement for the SENIC SID is designed as a PBN procedure as shown in Figure 16. There is an added BLH transition that will be an offload route for aircraft departing over TRM. The new transition will join the KARVR BLH offload flow. The proposed SENIC eliminates the unused IPL transition. Flight track miles on the TRM transition are reduced due to the shortcut after MOXIE. Figure 16. Current and Proposed LGB SENIC SID Benefits Initial modeling did not indicate significant savings SNA Departures This section describes the operational issues, recommendations, and derived benefits the OST has identified for SNA departures SNA CHANL Departure The CHANL accounts for approximately 37% of all SNA jet departures. Issues 38

47 The CHANL SID is a conventional procedure relying on ground based navigation and radar vectors. There are unused transitions on the current procedure. Due to changes in separation criteria from restricted airspace, the current procedural separation from R2519 is no longer sufficient. Recommendations The proposed replacement for the CHANL SID is designed as a PBN procedure. The conceptual CHANL departure reduces filed track miles by mimicking current flight tracks. The proposed CHANL SID provides increased separation from R2519 by routing aircraft over a newly created fix (IKAYE). The proposed CHANL SID will provide dual departure flows to the north over GMN. The current and proposed procedures are shown in Figure 17. Figure 17. Current and Proposed SNA CHANL SID 39
48 Benefits Projected annual savings for the CHANL SID are estimated in Table 12. Table 12. Proposed SNA CHANL SID Annual Benefits BUR and VNY Departures This section describes the operational issues, recommendations, and derived benefits the OST has identified for departures from BUR and VNY BUR VNY9 Departure The VNY9 accounts for approximately 81% of all BUR jet departures. Issues The BUR VNY9 STAR is a conventional SID relying on ground based navigation and radar vectors. Current flight paths do not fly the initial part of the published procedure, resulting in additional filed miles. Prop aircraft over DAG constrain the route and delay jet aircraft on the same flow. 40

49 Recommendations The proposed replacement for the BUR VNY9 SID is designed as a PBN procedure. The conceptual VNY9 departure optimizes lateral paths, reduces flight track miles, and merges with other GMN area flows. An offload prop route to DAG has been added to alleviate traffic congestion over PMD. The current and proposed procedures are shown in Figure 18. Figure 18. Current and Proposed BUR VNY9 SID 41
50 Benefits The total estimated savings can be attributed to reduced filed miles over the current published procedure. Projected annual savings for the BUR VNY9 SID are estimated in Table 13. Table 13. Proposed BUR VNY9 SID Annual Benefits VNY CANOG and NUAL Departures The CANOG and NUAL SIDs account for approximately 37% of all VNY jet departures. Issues The CANOG and NUAL are conventional procedures relying on ground based navigation and radar vectors. Actual flight paths do not overfly current procedure and there are unused transitions on the procedures. Prop aircraft over DAG constrain the route and delay jet aircraft on the same flow. 42

51 Recommendations The proposed replacement for the CANOG and NUAL, combines two SIDs and is designed as a PBN procedure. The proposed procedure reduces filed miles, provides a dual stream northbound, and merges with other GMN area flows. An offload prop route to DAG has been added to alleviate traffic congestion over PMD. The current and proposed procedures are shown in Figure 19. Figure 19. Proposed VNY CANOG/NUAL SID Benefits This route was not modeled as VNY was designated as a satellite airport ONT Departures This section describes the operational issues, recommendations, and derived benefits the OST has identified for departures from ONT ONT POM Departure The POM SID accounts for approximately 55% of ONT jet departures. Issues The POM SID is a conventional procedure relying upon ground based navigation and radar vectors. 43

52 The POM SID has inefficient vertical and lateral paths, and flight paths do not overfly the current procedure. Recommendations The proposed replacement for the POM SID is designed as a PBN procedure. The proposed POM SID reduces the filed flight miles by shortening the procedure between POM and FROUN. The current and proposed procedures are shown in Figure 20. Figure 20. Current and Proposed ONT POM SID 44
53 Benefits Projected annual savings for the ONT POM SID are estimated in Table 14. Table 14. Proposed ONT POM SID Annual Benefits ONT PRADO SID The PRADO SID accounts for approximately 26% of ONT jet departures. Issues The PRADO SID is a conventional procedure relying upon ground based navigation and radar vectors. The PRADO SID has inefficient vertical and lateral paths. Flight paths do not overfly the current procedure to MZB. There is no SXC transition on the PRADO SID; therefore, aircraft filed on this route must fly excessive miles from ONT to SXC. 45
54 Recommendations The proposed replacement for the PRADO is designed as a PBN procedure. Runway transitions were developed, and at the stakeholder s request, the OST created a SXC transition. The current and proposed procedures are shown in Figure 21. Figure 21. Current and Proposed ONT PRADO SID Benefits There are no significant savings on the TRM and MZB transitions. Departing over SXC, UPS currently files PRADO7-MZB-OCN-SXC. By filing the proposed SXC transition, UPS alone could save an estimated $30,000 a week on oceanic flights. This is based on 25 MD11 flights per week filed on the above route (provided by UPS) assumed to be now fly the proposed routing Satellite Airport Departures This section describes the operational issues and recommendations the OST has identified for departures from other Southern California satellite airports. 46
55 CRQ TRM Departure Issues Currently, all departures from CRQ over TRM are radar vectored, resulting in inefficient vertical and lateral paths. Recommendations The OST created an RNAV SID off of CRQ that mimics where aircraft fly today. The proposed procedure has one en route transition ending at TRM as shown in Figure 22. Figure 22. Proposed CRQ TRM SID Benefits Due to low traffic volume this route was not modeled FUL SID Issues Currently, all departures from FUL are radar vectored, resulting in inefficient vertical and lateral paths. There are concerns relating to the Disneyland TFR and the ability to fly through it. 47
56 Recommendations The proposed replacement is designed as a PBN procedure and the proposed SID addresses Disneyland TFR concerns as shown in Figure 23. Figure 23. Proposed FUL SID Benefits Due to low traffic counts, no modeling was done for this procedure SBA HARPO SID Issues Current eastbound SIDs consist of multiple conventional procedures relying on ground based navigation and radar vectors. There are no published en route transitions. This creates inconsistent flight paths to DAG and TRM. 48

57 Recommendations The proposed HARPO SID is designed as a PBN procedure. The HARPO departure adds en route transitions to both TRM and DAG. These new en route transitions follow current flight tracks. The current and proposed procedures are shown in Figure 24. Figure 24. Current and Proposed SBA SIDs Benefits Due to a low volume of traffic, this procedure was not modeled Summary of Southern California Departure Benefits In general, the issues associated with the current departures from Southern California airports were related to level-offs and other lateral and vertical path inefficiencies. To address these concerns, the Southern California OST focused on PBN solutions. The OST conceptual proposals for departures included a combination of RNAV off the ground procedures and radar vector procedures to join RNAV routes. Table 15 shows the total departure benefits for the Southern California proposals as described throughout Section 4.2. Southern California SIDs are expected to provide between $2.5 million and $2.9 million annually in fuel savings. Existing departure tracks are generally efficient when they permit unrestricted climbs. The proposed departure procedures are designed to facilitate unrestricted climbs by removing or mitigating existing level-offs, while providing procedural separation, where practical, from other SIDs and STARs. It is fully expected that ATC will 49

58 continue to offer shorter routings and remove climb restrictions when feasible, further increasing operator benefits. The majority of savings for LAX departures are attributed to the unrestricted availability of the LOOP SID. No delay analysis was performed on the impacts of this change on other area airports. The OST believes that continuous use of the LOOP will reduce departure delays over TRM and DAG for these airports. The D&I team may elect to further evaluate the mixture of radar vectors and RNAV off-theground SIDs to determine the most beneficial method of departing from Southern California airports. Table 15. Total Annual Fuel Burn Benefits for Southern California Departures 4.3 Southern California Arrivals In general, the issues associated with the current STARs to Southern California were related to inefficient lateral and vertical paths, unused en route transitions, and the lack of dual independent finals to Runways 24L/R and 25L/R at LAX. The OST design concept for arrivals focused on RNAV STARs with Optimized Profile Descents (OPDs). Level-offs result in non-optimal fuel burn and excessive carbon emissions, particularly during flows requiring downwind legs. In addition to optimizing vertical profiles, lateral paths were shortened where practical; routes were segregated where practical; unused en route transitions were removed; and new runway transitions were proposed. D&I will assess the location of fixes to allow additional transitions to 50

59 the STARs. STARs at all major and several satellite airports in Southern California were modified. These new STARs are procedurally deconflicted from SIDs and other STARs where possible. STARs were developed with airport, runway or approach transitions. Where approach transitions were developed the OST proposes potential development of RNP Authorization Required (AR) Instrument Approach Procedures (IAPs) at several of the airports. Current conventional (non-rnav) STARs may need modification during the D&I process. Any airspace modifications that enable procedural efficiencies will also be considered during D&I. In addition, D&I team members may consider combining flow-specific STARs where it is determined to be advantageous. Figure 25 depicts benefits, impacts, and risks for the FAA and Airspace users and procedural environmental considerations. Figure 25. Benefits, Impacts, and Risks of the Arrival Proposals LAX Arrivals This section describes the operational issues, recommendations, and expected benefits the OST has identified for arrivals to LAX LAX RIIVR and SEAVU Arrivals The RIIVR and the SEAVU STARs account for 47% of all LAX jet arrival traffic. 51

60 Issues The RIIVR and SEAVU STARs are arrival procedures with level-offs over the GRAMM and KONZL intersections. These level-offs were specifically identified by the facilities as an issue for these two arrivals. The interaction of these STARs creates a single, dependent flow situation approximately 45 miles east of LAX. Procedural requirements necessitate that traffic on the RIIVR and SEAVU STARs be in trail and delivered as a single flow to SCT. This single flow requirement creates a constraint that is responsible for excessive delay vectors, multiple traffic management restrictions, reduced throughput, and an inability to meet the LAX airport acceptance rate (AAR). Arrival fix congestion analysis The RIIVR and SEAVU STARs terminate approximately 45 nautical miles from LAX, as can be seen in Figure 26. Laterally, the termination fixes for these STARs are approximately 4 miles apart, which necessitates a single dependent feed into SCT s airspace from ZLA. This procedural requirement to treat the RIIVR and SEAVU as a single flow creates a complex and inefficient east arrival flow into LAX. This situation was the highest priority challenge identified by both facilities for OST consideration. To alleviate the congestion at this bottleneck, MIT restrictions and other constraints are introduced into the NAS by ZLA. The OST analyzed MIT restrictions placed upon east LAX arrival fixes to assess the scope of this issue. In particular, HEC, PGS, and TNP were identified as fixes with frequent restrictions attributable to this single flow constraint. Current RIIVR / SEAVU Proposed Current RIIVR Proposed SEAVU Figure 26. Current and Proposed LAX RIIVR and SEAVU STARs The supporting data was obtained from the NTML MIT log for calendar year Restrictions were primarily due to volume (VOL), weather (WX), or equipment/frequency failure (EQ); however, pass-back restrictions caused by constraints closer to the airport were not considered. The metric used is minutemiles. This is calculated by multiplying the total minutes the restriction was in effect by the imposed MIT value (spacing in miles). 52
61 Minute-Miles Minute-Miles Over HEC and MLF the sum of LAX minute-mile restrictions for calendar year 2010 was approximately 110,000. During 2010, restrictions were issued on 106 days, or approximately two days a week. Restrictions by cause and airport can be found in Figures 27 and BUR LAX SMO VNY OTHER RWY VOL WX Cause Figure 27. Restrictions over HEC/MLF by Cause BUR LAX SMO VNY MIT Value Figure 28. Restrictions over HEC/MLF by MIT Value 53
62 Minute-Miles Minute-Miles Over PGS and TBC the sum of LAX minute-mile restrictions for calendar year 2010 was approximately 940,000. In 2010, restrictions were issued on 336 days, or approximately 6.5 days a week. Restrictions by cause and airport can be found in Figures 29 and LAX SAN 0 OTHER RWY VOL WX Cause Figure 29. Restrictions over PGS/TBC by Cause LAX SAN MIT Value Figure 30. Restrictions over PGS/TBC by MIT Value 54
63 Minute-Miles Minute-Miles Over TNP, DRK, and on J4, the sum of LAX minute-mile restrictions for calendar year 2010 was approximately 2,500,000. In 2010, restrictions were issued on 362 days, which is essentially an everyday MIT restriction. Restrictions by cause and airport can be found in Figures 31 and LAX SAN EQ OTHER RWY TM Initiatives VOL WX Cause Figure 31. Restrictions over TNP/DRK/J4 by Cause LAX SAN MIT Value Figure 32. Restrictions over TNP/DRK/J4 by MIT Value 55
64 Recommendations The proposed replacements for the RIIVR and SEAVU STARs are designed as PBN procedures with OPD benefits that operate as dual independent arrivals and maintain procedural separation as shown in Figure 26. These STARs are procedurally deconflicted laterally within ZLA s and SCT s airspace, allowing for deconflicted operations and the subsequent allowance of dual independent final operations. The current RIIVR and SEAVU STARs terminate at waypoints RIIVR and SEAVU. The proposed RIIVR and SEAVU STARs will terminate approximately 15 NM from the airport. The STARs remain laterally deconflicted until inside of the Precision Radar Monitor (PRM) areas. As these procedures turn to join their respective final approach courses, vertical separation will be maintained until the aircraft are established on a charted approach and are under precision monitor control. Current operations dictate that the Runways 25L/R approaches are 1,000 feet higher than the Runways 24L/R approaches. The proposed RNAV STARs will reverse this altitude configuration, as Runways 24L/R approaches incorporate a longer flight distance to the runway threshold than Runways 25L/R. These STARs will include runway transitions to all runways, enabling the seamless transition of aircraft between Runways 24L/R and Runways 25L/R at LAX, which will facilitate the ability to balance the runway demands. The introduction of the dual independent final design in these STARs will reduce the need for extensive delay vectoring caused by sequencing to a single dependent feed. Benefits Analysis indicates that significant vertical savings are realized on both proposed procedures when considering current usage. Since the proposed STARs essentially overlay current paths, no measurable lateral gain is achieved. Projected annual savings for the RIIVR and SEAVU STARs are estimated in Tables 16 and 17. These savings do not include any associated reduction in delay vectoring due to the dual independent arrival concept. 56
65 Table 16. Proposed LAX RIIVR STAR Annual Benefits (Profile and Filed Mile Changes Only) Table 17. Proposed LAX SEAVU STAR Annual Benefits (Profile and Filed Mile Changes Only) 57

66 Modeling the airspace constraint It is assumed that allowing dual independent arrivals into LAX would mitigate the need for MIT restrictions and reduce delay vectoring close to the airport. To estimate the possible annual delay savings associated with the proposed dual independent arrivals, a TAAM model was developed to simulate the flows with an average day 2 of traffic both with and without the current procedural constraint. In Figure 33, the white line indicates the western termination point of the modeled area. Procedural constraints were measured for aircraft crossing this white line from the east with and without constraints currently required by today s procedures. To model current traffic patterns, one minute of separation was required between all RIIVR or SEAVU aircraft crossing this line. This is comparable to 5.6 MIT at 280 knots Indicated Air Speed (IAS). Dual independent arrivals were then simulated without the one-minute constraint in place. Figure 33. TAAM-Modeled Vectoring Patterns on RIIVR and SEAVU, With and Without Airspace Constraint 2 Calendar year 2010 data was used to estimate the traffic for an average day at LAX. 58

67 The delay metrics associated with having to require one minute of separation between all RIIVR/SEAVU aircraft is approximately 20 to 25 seconds of delay time per aircraft. This translates into a total delay time of approximately five hours per day. Using the FAA s current aircraft direct operating cost (ADOC) value of $36 per minute, the potential savings realized by the proposed RIIVR and SEAVU STARs is estimated at $4 million, as shown in Table 18. Table 18. Proposed LAX RIIVR and SEAVU STARs Annual Benefits (Delay Vectoring Mitigation) This model also measures the effect single flow constraints have on peak throughput into LAX. On the simulated day, the maximum throughput per hour was 68 aircraft; with the introduction of dual independent arrivals, the throughput could be as high as 72 aircraft per hour LAX OLDEE Arrival The OLDEE STAR accounts for approximately 2% of all LAX jet arrivals. Issues The OLDEE STAR is a conventional procedure relying upon ground based navigation. There are inefficient lateral and vertical paths. Arrivals are typically offloaded from the OLDEE onto the VISTA STAR. SCT and ZLA would like the OLDEE to merge with the SEAVU and have runway transitions. 59
68 Recommendations The proposed replacement for the OLDEE STAR is designed as a PBN procedure that closely follows the arrival tracks as currently flown; see Figure 34. The proposed procedure will mimic the current OLDEE STAR from JLI to SEAVU, at which point it merges with the RIIVR and SEAVU proposed by the OST as shown in Figure 35. This will allow flexibility in accommodating multiple runway assignments. It is expected that these changes to the OLDEE will result in increased usage of this RNAV procedure. Figure 34. Proposed LAX OLDEE STAR 60
69 Mimics proposed RIIVR and SEAVU Proposed RIIVR Proposed SEAVU Proposed OLDEE Figure 35. Proposed LAX OLDEE, RIIVR, and SEAVU STARs 61
70 Benefits Projected annual savings for the OLDEE STAR are estimated in Table 19. The vertical savings expected for this procedure are significant considering its minimal usage. Since the proposed STAR overlays current paths, no measurable lateral gain is achieved. Table 19. Proposed LAX OLDEE STAR Annual Benefits LAX VISTA Arrival The VISTA STAR accounts for approximately 4% of all LAX jet arrivals. Issues The VISTA STAR is a conventional procedure relying upon ground based navigation. The lateral path of the published procedure is currently not flown as depicted on the arrival. Most traffic utilizing this procedure is shortcut direct to either the MADOW intersection or SLI once the traffic is laterally clear of R2503B. Additionally, there are significant level-offs, including one at 12,000 feet. The current VISTA is utilized as an offload STAR during peak traffic demand on the RIIVR and SEAVU arrivals. 62
71 Recommendations The proposed replacement for the VISTA STAR is designed as a PBN procedure as shown in Figure 36. The lateral path of the proposed RNAV STAR closely mimics current arrival tracks and will provide more direct routing as well as a predictable, repeatable path. Arrival windows were used in the vicinity of OCN to procedurally deconflict the arrival from R2503 and to significantly mitigate level-offs. Per SCT request, a holding pattern will be developed at MADOW during the D&I process. Current Proposed Figure 36. Current and Proposed LAX VISTA STAR 63
72 Benefits Projected annual savings for the VISTA STAR are estimated in Table 20. The vertical savings expected for this procedure are significant considering its minimal usage. Table 20. Proposed LAX VISTA STAR Annual Benefits LAX KEACH Arrival The LAX KEACH STAR is an RNAV procedure that is designed to replace the existing LAX SADDE STAR. The KEACH is expected to be published in July The KEACH as currently designed is an RNAV overlay of the western part of the SADDE STAR, and since it is scheduled to be operational within the Southern California OAPM timeframe, the OST elected to study this future procedure as a baseline as opposed to the current SADDE STAR. The KEACH will account for 6% of LAX arrival traffic. Issues This proposed arrival does not address the increased use of R2519 and conflicts with departure traffic in the VTU area. The OST identified no gain in efficiency between the KEACH and the SADDE and expects no change in operations due to its implementation. The OST identified long level-offs in current tracks filed on this flow. 64
73 Recommendations The lateral path of the OST s proposed RNAV KEACH STAR mimics current arrival tracks, which will provide more direct routing and will define a predictable, repeatable path as shown in Figure 37. The OST s proposed KEACH procedure will have optimized lateral and vertical profiles that will successfully mitigate level-offs seen in current flight tracks. R2519 separation is assured by the incorporation of a waypoint fix abeam. Routing was developed to leverage the opportunity for an ELKEY transition when restricted airspace is inactive. Figure 37. Current and Proposed LAX KEACH STAR Current Proposed 65
74 Benefits Table 21 shows the annual savings of the OST s proposed KEACH compared to flight tracks flying the SADDE arrival. Table 21. Proposed LAX KEACH STAR Annual Benefits LAX SYMON Arrival The LAX SYMON STAR is an RNAV procedure that is designed to replace the existing LAX SADDE STAR. The SYMON is expected to be published in July The SYMON as currently designed is an RNAV overlay of the northern part of the SADDE STAR, and since it is scheduled to be operational within the Southern California OAPM timeframe, the OST elected to study this future procedure as a baseline as opposed to the current SADDE STAR. The SYMON will account for 26% of LAX arrival traffic. Issues The OST has identified significant level-offs on the current tracks filed on this arrival due to conflicts with FIM area traffic and LAX departure traffic. Conflicts were also identified with the CASTA and GMN traffic, causing long level-offs. This arrival also procedurally shares lateral and vertical airspace with BUR, VNY, LGB, and SNA arrival traffic, which adversely affects the efficiency of all flows in this area. 66

75 This arrival has been identified by facilities and stakeholders as complex, requiring several transmissions and inputs to control/fly. This is due in part to the congestion in the FIM area. Recommendations The lateral path of the OST s proposed RNAV STAR, as shown in Figure 38, mimics the current arrival tracks, and defines a predictable, repeatable path. The OST elected not to laterally change the soon-to-be published procedure. Arrival windows were incorporated at waypoints on the OST s proposed SYMON STAR to reduce level-offs. The OST acknowledges that there may still be a level-off at 10,000 feet in the vicinity of the BAYST intersection. The OST has proposed segregation of this arrival from BUR, VNY, LGB, and SNA traffic by shifting these flows to the west, deconflicting SYMON arrivals from all these flows. Current Proposed Figure 38. Current and Proposed LAX SYMON STAR 67
76 Benefits Since this arrival is an RNAV overlay of the northern part of the SADDE arrival, vertical savings were derived relative to current SADDE STAR traffic. Projected annual savings for the SYMON STAR are estimated in Table 22. Table 22. Proposed LAX SYMON STAR Annual Benefits LAX BUFIE Arrival The BUFIE accounts for approximately 2% of all LAX jet arrivals. Issues The BUFIE today consists of a conventional procedure relying on ground based navigation. There are inefficient lateral and vertical paths on this procedure. There is a level-off of approximately 24 NM at 12,000 feet, 75 NM away from LAX. A confliction with the SNA CHANL SID in the vicinity of SXC was identified by the FAA as an issue. The lack of accessibility to use the current BUFIE procedure was noted by the stakeholders. Due to design inefficiencies, currently ZLA consistently reroutes traffic from the BUFIE to the current SADDE STAR adding track miles. 68
77 Recommendations Altitude windows are used to enhance efficiency on the arrival and to reduce leveloffs. The GOATZ level-off is eliminated due to the creation of an OPD. Procedural deconfliction from the CHANL departure traffic is accomplished with waypoint restrictions on each procedure. The lateral path of the proposed STAR adjusts this arrival to the north of SXC, which will provide routing that will define a predictable, repeatable path as shown in Figure 39. Figure 39. Proposed LAX BUFIE STAR 69
78 Benefits This proposal will have optimized lateral and vertical profiles with significant savings associated with fuel burn reductions due to the removal of level-offs. Projected annual savings for the BUFIE STAR are estimated in Table 23. Table 23. Proposed LAX BUFIE STAR Annual Benefits LAX KIMMO Arrival Issues The KIMMO STAR is a conventional turboprop procedure relying upon ground based navigation. The arrival currently has inefficient lateral paths, and actual flight tracks do not follow the current arrival procedure. There is currently a dogleg on the EHF transition that proceeds to AMONT intersection, but aircraft are typically routed direct to the LHS VOR. 70

79 Recommendations As shown in Figure 40, the proposed replacement for the KIMMO STAR is designed as a PBN procedure for turboprops. The proposed KIMMO will have OPD benefits and lateral paths. The OST removed the EHF-AMONT dogleg and replaced it with a route from EHF direct LHS to mimic current flows, resulting in reduced filed miles. The dogleg at the end of the procedure was removed as aircraft rarely flew over the PURMS intersection after DARTS. Figure 40. Current and Proposed LAX KIMMO STAR Benefits With an improved vertical profile and a repeatable, predictable RNAV path, this procedure will enhance efficiencies for turboprop arrivals to LAX. Due to low traffic counts, no modeling was done for this procedure. 71

80 LAX BASET and HOUND Arrivals Issues The current BASET and REDEYE STARs are conventional procedures relying on ground based navigation. These procedures are used for east traffic or midnight operations only and are not aligned with west configurations. The current procedures do not accommodate independent flows. There are currently inefficient vertical and lateral paths on these procedures. Recommendations The proposed replacements for the BASET and REDEYE (HOUND) as shown in Figure 41 are designed as PBN procedures, with OPD benefits and optimized lateral paths. The procedures mimic the RIIVR and SEAVU STARs, which have been modified into dual, independent flows, with the caveat that the altitudes will be higher to accommodate the longer downwinds. Figure 41. Proposed LAX BASET and HOUND STARs 72
81 Benefits Due to low traffic counts, no modeling was done for this procedure LAX MOOR Arrival Issues The MOOR arrival is a conventional procedure relying upon ground based navigation. The MOOR is an east flow procedure that is lightly used and contains inefficient vertical and lateral paths. Recommendations As shown in Figure 42, the proposed replacement for the MOOR STAR is designed as a PBN procedure with OPD benefits. By deconflicting the LAX flows from the BUR, VNY, LGB, and SNA flows, the MOOR arrivals will not have to compete with other procedures for the airspace over FIM. The new RZS transition provides a significant decrease in filed flight miles. The proposed MOOR eliminates the long en route transition through the control extension. 73

82 Figure 42. Proposed LAX MOOR STAR Benefits Due to low traffic counts, no modeling was done for this procedure LAX FICKY Arrival Issues A request was made for a new east flow procedure for overnight oceanic operations. 74

83 Recommendations The proposed FICKY (see Figure 43) is designed as a PBN procedure with OPD benefits. This procedure merges with current existing approach procedures. Figure 43. Proposed LAX FICKY STAR Benefits This is a new procedure with no baseline; therefore, no modeling was done SAN Arrivals This section describes the operational issues, recommendations, and expected benefits the OST has identified for arrivals to SAN. 75

84 SAN BAYVU Arrival The BAYVU will account for 39% of all SAN jet arrival traffic. Issues Inefficient lateral paths exist as aircraft are forced over the LAX VOR due to traffic congestion. ZLA indicated a need for an OTISS transition that would lie northeast of the LAX VOR. Recommendations The proposed BAYVU is designed as a PBN procedure with OPD benefits. An OTISS transition was designed to mimic the current arrival tracks. It defines a predictable, repeatable path, and alleviates much of the congestion over LAX (see Figure 44). Current Proposed Figure 44. Current and Proposed SAN BAYVU STAR 76
85 Benefits Projected annual savings for the SAN BAYVU STAR are estimated in Table 24. Table 24. Proposed SAN BAYVU STAR Annual Benefits SAN LYNDI Arrival The LYNDI will account for 39% of all SAN jet arrival traffic. Issues The IPL flow on the LYNDI arrival often conflicts with eastbound departures. 77

86 Recommendations In order to mitigate conflicts on the IPL flow of the LYNDI arrival, an offload route was built from BZA to the north as shown in Figure 45. Figure 45. Proposed SAN LYNDI STAR Benefits Due to little change in the proposed procedure compared to the current operation, the LYNDI was not modeled LGB and SNA Arrivals This section describes the operational issues, recommendations, and expected benefits the OST has identified for arrivals to LGB and SNA LGB and SNA KEFFR Arrival Approximately 54% of SNA jet arrivals and 49% of LGB jet arrivals use the conventional KAYOH STAR. The KEFFR STAR will be an RNAV procedure that serves the same flows as the KAYOH; it is expected to be published in February Issues The soon to be published KEFFR arrival has inefficient vertical and lateral paths. 78

87 The altitude restriction at BANDS intersection is overly restrictive as aircraft are currently forced down below LAX arrival flows. Recommendations The proposed KEFFR STAR is designed as a PBN procedure with OPD benefits. The OST proposed KEFFR optimizes the HEC transition, shortening the lateral path and providing a more direct routing via LUCER to HUMPS. The JOLAR transition procedurally deconflicts the KEFFR from the LAX and ONT arrivals. The current and proposed KEFFR procedures as well as the current KAYOH are shown in Figure 46. Current Proposed Figure 46. Current LGB and SNA KAYOH STAR and Proposed LGB and SNA KEFFR STAR 79
88 Benefits Projected annual savings for the KEFFR STAR are estimated in Table 25. Table 25. Proposed LGB and SNA KEFFR STAR Annual Benefits LGB and SNA QMARK Arrival Approximately 33% of SNA jet arrivals and 36% of LGB jet arrivals use the conventional TANDY STAR. The QMARK STAR will be an RNAV procedure that serves the same flows as the TANDY; it is expected to be published in July Issues The TANDY STAR is a conventional procedure relying on ground based navigation. The soon to be published QMARK arrival has inefficient vertical and lateral paths. This arrival also procedurally shares lateral and vertical airspace with BUR, VNY, and LAX arrival traffic, which adversely affects the efficiency of all FIM flows. 80

89 Recommendations The OST proposed QMARK arrival is designed as a PBN procedure with OPD benefits. The OST procedurally deconflicted the QMARK from the LAX SYMON arrival by shifting the route to the west. The QMARK arrival removes extra filed track miles that relate to a dogleg to SXC. LGB RNP approach transitions are also tied into the QMARK arrival. The current and proposed procedures are shown in Figure 47. Current TANDY Proposed QMARK Figure 47. Current LGB and SNA TANDY STAR and Proposed LGB and SNA QMARK STAR 81
90 Benefits Projected annual savings for the QMARK STAR are estimated in Table 26. Table 26. Proposed LGB and SNA QMARK STAR Annual Benefits ONT Arrivals This section describes the operational issues, recommendations, and expected benefits the OST has identified for arrivals to ONT ONT SETER Arrival The SETER accounts for approximately 29% of all ONT jet arrivals. Issues The SETER STAR is a conventional procedure relying on ground based navigation. The current SETER STAR has an altitude restriction at 14,000 feet at the BANDS intersection that results in level-offs. This restriction causes aircraft to be higher than optimal during their approach. There are currently inefficient vertical and lateral paths on these procedures. 82

91 Recommendations The proposed replacement for the SETER STAR is designed as a PBN procedure with OPD benefits. The proposed SETER STAR would mimic current lateral flight tracks as shown in Figure 48. The proposed SETER STAR will utilize vertical windows to reduce level-offs while allowing aircraft to fly a more optimal profile. Vertical profiles to ONT, LGB/SNA and LAX are shown in Figure 49. Flights from the northeast are descended to cross below LAX arrivals and join laterally with LGB and SNA KEFFR arrivals while remaining vertically deconflicted. An unused JLI transition was removed. Current Proposed Figure 48. Current and Proposed ONT SETER STAR 83
92 ONT Proposed SNA / LGB Proposed LAX Proposed Figure 49. Proposed ONT, LGB/SNA, and LAX Vertical Paths Benefits Projected annual savings for the SETER STAR are estimated in Table 27. Table 27. Proposed ONT SETER STAR Annual Benefits 84
93 ONT ZIGGY Arrival The ZIGGY accounts for approximately 22% of all ONT jet arrivals. Issues The ZIGGY STAR is a conventional procedure relying on ground based navigation. Currently the ZIGGY STAR has inefficient speed restrictions at MAJEK and DAWNA. Inefficient vertical paths have arrival aircraft descending at a steeper than optimal rate. Recommendations The proposed replacement for the ZIGGY STAR is designed as a PBN procedure with OPD benefits as shown in Figure 50. Northeast arrivals over HEC are deconflicted from the LGB and SNA KEFFR flows at DAWNA intersection. Terrain issues to the north limit the possibility for creating an optimal procedure. Current Proposed Figure 50. Current and Proposed ONT ZIGGY STAR 85
94 Benefits Projected annual savings for the ZIGGY STAR are estimated in Table 28. Table 28. Proposed ONT ZIGGY STAR Annual Benefits ONT New BLKMN Arrival Issues There is currently no arrival procedure to ONT from the west. Aircraft today are routed north over PMD via the ZIGGY STAR resulting in excessive track miles, fuel burn, and carbon emissions. 86
95 Recommendations The proposed BLKMN STAR, shown in Figure 51, is designed as a PBN procedure with OPD benefits. The proposed BLKMN STAR will mimic the proposed BUFIE STAR to BUFIE intersection then continue north to a new fix where it will terminate. Figure 51. Current and Proposed ONT BLKMN STAR Benefits This is a new procedure with no baseline; therefore, no modeling was done BUR and VNY Arrivals This section describes the operational issues, recommendations, and expected benefits the OST has identified for arrivals to BUR and VNY. 87
96 BUR and VNY JANNY Arrival The JANNY accounts for approximately 44% of all BUR jet arrivals and 42% of all VNY jet arrivals. Issues The current JANNY STAR conflicts with LAX, VNY, and BUR departures that fly east over DAG. There is high traffic congestion over PMD with arrival, departure, and overflight flows. Recommendations The proposed JANNY STAR would shift the initial fix northeast of DAG reducing conflicts and allowing for OPD benefits as shown in Figure 52. Airport transitions were added to both BUR and VNY. Figure 52. Current and Proposed BUR and VNY JANNY STAR 88
97 Benefits Terrain issues and military airspace limited the amount of savings and procedural deconfliction that could be achieved over PMD. Projected annual savings for the JANNY STAR are estimated in Table 29. These savings are for BUR traffic only as VNY was not modeled. Table 29. Proposed BUR JANNY STAR Annual Benefits BUR CANYN Arrival The CANYN accounts for approximately 45% of all BUR jet arrivals. Issues Currently flights utilize the CEEME STAR, which is a conventional procedure relying on ground based navigation. The current CEEME STAR has altitude restrictions which result in level-offs. Arriving flights into the Los Angeles Basin are stacked from AVE to FIM. There are excessive speed restrictions at the DERBB intersection due to heavy traffic congestion. 89
98 Recommendations The proposed replacement for the CEEME STAR, shown in Figure 53, is designed as a PBN procedure with OPD benefits. The proposed CANYN arrival would offset BUR arrivals to the west and procedurally deconflict them from the LAX SYMON arrivals while reducing leveloffs. Excessive restrictions at DERBB would be alleviated by offsetting the route to the west. BUR Proposed LAX Proposed Figure 53. Proposed BUR and LAX STARs from the North 90
99 Benefits Projected annual savings for the CANYN STAR are estimated in Table 30. The CANYN arrivals will see significant profile improvements on the proposed procedure. However, to deconflict the CANYN from LAX arrivals, additional track distance was necessary. The deconfliction from LAX arrivals will reduce delay for both flows. This impact could not be modeled or estimated at this time by the OST. Table 30. Proposed BUR CANYN STAR Annual Benefits VNY AALLL Arrival Current flights utilize the FERN5 STAR and account for approximately 42% of VNY jet arrivals. Issues The FERN5 STAR is a conventional procedure relying on ground based navigation. The current FERN5 has inefficient vertical paths that result in level-offs. The current procedure has conflictions in the FIM area with other Los Angeles Basin traffic. This arrival also procedurally shares lateral and vertical airspace with BUR and LAX arrival traffic, which adversely affects the efficiency of all FIM flows. 91
100 Recommendations The proposed replacement for the FERN5 is designed as a PBN procedure with OPD benefits, as shown in Figure 54. The proposed AALLL arrival would offset VNY arrivals to the west and procedurally deconflict them from LAX SYMON arrivals while reducing level-off and filed miles. The procedure is designed for arrivals to Runways 16L/R. Excessive restrictions at DERBB would also be alleviated by offsetting flights to the west. Current Proposed Figure 54. Current and Proposed VNY AALLL STAR Benefits With improved profiles and segregated flows from the LAX arrival stream, this procedure will enhance safety and efficiency for arrivals to VNY. As this was a procedure to a satellite airport, no modeling was done. 92
101 BUR, VNY, and SMO Small Prop Arrival Issues There are inefficient vertical and lateral paths on the current procedure. Prop aircraft are typically forced to lower altitudes early due to conflictions with other Los Angeles area flows. This arrival also procedurally shares lateral and vertical airspace with LAX arrival traffic, which adversely affects the efficiency of all FIM flows Recommendations The proposed replacement, as shown in Figure 55, is designed as a PBN procedure. This STAR would be procedurally deconflicted from the LAX SYMON arrivals and would offer airport transitions to BUR, VNY, and SMO with improved vertical profiles. The procedure would take existing turboprop and small prop flights and mimic the proposed CANYN and AALL STARs into BUR and VNY. Figure 55. Proposed BUR, VNY, and SMO Small Prop STAR 93

102 Benefits With improved profiles and segregated flows from the LAX arrival stream, this procedure will enhance safety and efficiency for small props to BUR, VNY, and SMO. Due to low traffic counts, no modeling was done for this procedure BUR, VNY, SMO, CMA, and OXR New East Arrival Issues Due to the lack of a published route, SCT requested an arrival procedure from the PSP area for BUR, VNY, SMO, CMA, and OXR airports. Currently, arrivals are routed north to the DAG VOR, then join current STARs or are vectored in the vicinity of PSP. Recommendations The OST developed an RNAV STAR that mimics the ONT SETER STAR to PETIS then terminates at a waypoint south of DARTS. The proposed route as shown in Figure 56 would significantly reduce flight track miles and allow for OPD benefits. Figure 56. BUR, VNY, SMO, CMA, and OXR New East STAR Benefits With improved profiles and a repeatable, predictable path separated from other Los Angeles Basin airports, this procedure will enhance efficiency for arrivals from the PSP area to the BUR, VNY, SMO, CMA, and OXR airports. This is a new proposed procedure with no baseline; therefore no modeling was done. 94

103 4.3.6 Satellite Airport Arrivals This section describes the operational issues, recommendations, and any derived benefits the OST has identified for satellite airport arrivals NZY and SDM BARET Arrival Issues The San Diego area at SCT requested a modified BARET STAR for SDM and NZY airports. The current procedure conflicts with the LYNDI STAR to SAN. The BARET STAR is a conventional procedure relying upon ground based navigation. There are currently inefficient vertical and lateral paths on this procedure. Recommendations The proposed BARET, shown in Figure 57, is designed as a PBN procedure with OPD benefits. This arrival is an independent procedure for NZY and SDM. It mimics the SAN LYNDI STAR arrival from the northeast until SALTN and is then segregated east of the LYNDI. From IPL, the proposed procedure overlays V317 to remain south of the LYNDI. Current Proposed Figure 57. Current and Proposed NZY and SDM BARET STAR 95
104 Benefits With improved profiles and a repeatable, predictable RNAV path deconflicted from the primary SAN east arrival flow, this procedure will enhance safety and efficiency for arrivals to SDM and NZY airports. Due to low traffic counts, no modeling was done CRQ FODDR Arrival Issues There are inefficient vertical and lateral paths on the current procedure and actual flight tracks do not overfly the current procedure. The current CRQ FODDR STAR conflicts with several other major Southern California flows in the vicinity of EHF. Recommendations The proposed FODDR is designed as a PBN procedure with OPD benefits. The proposed procedure was moved west of the current route to deconflict from the EHF flows, as shown in Figure 58. Current Proposed Figure 58. Current and Proposed CRQ FODDR STAR 96
105 Benefits Improving the vertical profile of the FODDR and relocating the route west to segregate from other Southern California flows will enhance safety and efficiency for arrivals to CRQ. Due to low traffic counts, no modeling was done SBA KWANG Arrival Issues Currently there is no published STAR to SBA. ZLA requested a route for SBA arrivals from the PMD area. Recommendations The proposed KWANG, shown in Figure 59, is designed as a PBN procedure with OPD benefits. The STAR begins over PMD and terminates at the beginning of the approach transition. Figure 59. Proposed SBA KWANG STAR 97
106 Benefits This is a new proposed procedure with no baseline; therefore, no modeling was done CMA, OXR, and NTD New GUERA and NLMAN Arrivals Issues Currently the route through ZLA s airspace from over PMD to CMA, OXR, and NTD is complicated and relies upon conventional radials, DMEs, and fixes. Frequency congestion was identified as a concern by the ZLA sectors that work the traffic through this area. Standardized routing was requested to alleviate this congestion. Recommendations The OST developed a PBN STAR for props to OXR, CMA, and NTD (GUERA) and a PBN STAR to NTD for jet aircraft (NLMAN) as shown in Figure 60. These procedures will reduce ATC workload by creating a standardized route, reducing frequency congestion, and taking advantage of automation to produce preferential arrival routes. Figure 60. Proposed CMA, OXR, and NTD New GUERA and NLMAN STARs 98

107 Benefits This is a new proposed procedure with no baseline; therefore, no modeling was done Summary of Southern California Arrival Benefits In general, the issues associated with the current arrivals to Southern California were related to inefficient lateral and vertical paths, unused en route transitions, and a lack of dual independent arrivals to Runways 24L/R and 25L/R at LAX. To address these concerns, the Southern California OST focused on PBN solutions. The OST conceptual proposals for arrivals included the following: RNAV STARs with OPDs Removal of unused en route transitions and development of runway transitions Dual independent arrivals to Runways 24L/R and 25L/R at LAX incorporated into a redesign of the RIVVR, SEAVU, and OLDEE STARs More efficient lateral paths created by removing doglegs and adjusting terminal entry points. The OST recognizes that these new procedures may require Letter of Agreements (LOAs) and Standard Operating Procedure (SOP) changes in order to facilitate OPDs. Table 31shows the total arrival fuel burn benefits for the Southern California proposals as described throughout Section 4.3. Table 31. Total Annual Fuel Burn Benefits for Southern California Arrivals 99
108 4.4 Other Southern California Issues SMO/LAX Interactions Issues Current SMO procedures inhibit independent operations with LAX departures. Limiting factors include runway configurations and the proximity of the airports (4 NM). Excessive ground delays occur at SMO due to LAX departure demand. LAX operations are also adversely affected since Runways 24L/R departures are held until the SMO departures are separated from the LAX departure paths. Similarly, SMO departures from Runway 21 must be held until LAX departures are separated from the SMO departure areas. Interactions between SMO and LAX also create complex ATC coordination. Three facilities are involved in the coordination of a SMO departure, as LAX ATCT, SMO ATCT, and SCT are all involved in the release process. If SMO procedures were deconflicted from LAX departures, verbal coordination between facilities could be minimized. Recommendations The OST and SCT developed PBN procedures to and from SMO that would deconflict the flows from Runways 06L/R and 24L/R at LAX Runway 03 RNAV Approach Concept Recommendations The OST developed an RNAV straight in approach to SMO Runway 03 as shown Figure 61. The RNAV approach is designed to maintain vertical deconfliction from the LAX Runway 07 final approach course. The courses of the RNAV approach to SMO Runway 03 and the Runway 06 approach to LAX will diverge by more than the minimum separation requirement of 15 degrees after crossing the LAX final. 100

109 Figure 61. Proposed SMO Runway 03 RNAV Approach Benefits This approach enables greater independent operations. A straight-in RNAV Runway 03 approach creates a previously unavailable option. 101
110 Runway 03 RNAV SID Recommendations The OST modified the original EDDYO SID design that SCT had developed for Runway 03. Multiple transitions were added to mimic current traffic paths. The proposed SMO Runway 03 SID procedure is shown in Figure 62. Figure 62. Proposed SMO Runway 03 RNAV SID 102
111 Runway 21 RNAV Approach Concept Recommendations The OST developed a straight-in RNAV approach to Runway 21, as shown in Figure 63. The missed approach procedure will mimic the proposed RNAV SID off SMO Runway 21. RNAV criteria will be used to procedurally deconflict from LAX Runways 24L/R departures. Figure 63. Proposed SMO Runway 21 RNAV Approach 103

112 Runway 21 RNAV SID Recommendations The OST designed an RNAV SID with multiple transitions as shown in Figure 64 that is procedurally deconflicted from LAX Runways 24L/R departures. The proposed SMO Runway 21 SID is procedurally deconflicted from LAX departures by approximately 3.25 miles, which meets minimum separation requirements. Figure 64. Proposed SMO Runway 03 RNAV Approach Benefits The deconfliction of the SMO and LAX procedures will result in reduced vectoring, improved fuel planning, reduced departure and arrival delays, and minimized interfacility coordination. The new procedures will allow for simultaneous operations at both airports with the sole constraint being limitations to the 270 degree heading that is used for prop aircraft from LAX Runways 24L/R. 104
113 CAASD completed a study in 2009 estimating the delay impacts of SMO/LAX interactions 3. This report details fuel and operating costs associated with delays at SMO and LAX interactions between LAX Runways 24L/R and SMO Runway 21. The delay estimates were recently updated to reflect current fuel costs. The updated delay savings due to deconflicted procedures are detailed below T-Routes Issues Analysis Assumptions Only jets will use the new SID 96% of jet operations RNAV capable 20 IFR jet departures per day Average SMO IFR delay for release for jets: 5.4 min/departure 2 LAX departures delayed for each SMO departure First departure delayed 2-3 minutes Second departure delayed minutes 60% of SMO IFR departures impact LAX departures Annual cost savings associated with new SMO SID for fuel savings alone (not including other ADOC) LAX impact: $110,000 $160,000 SMO impact: $100,000 Total: $210,000 $260,000 Facilities and stakeholders identified concerns with the current Victor route system within SCT airspace, specifically, that the existing routings limit throughput and conflict with high volume procedures. The lack of flexibility inherent with legacy Victor airway design limits opportunities to take advantage of routings that could produce system benefits. Recommendations As a result of specific requests through the outreach process, three T-Routes were designed by the OST. 3 Canales, R., et al., September 2009, Identification and Evaluation of Airspace Issues Affecting the Southern California and Denver Metropolitan Areas, MTR090313, The MITRE Corporation, McLean, VA. 105
114 V186 T-Route Issues BUR and VNY departure traffic was identified as conflicting with V186 traffic, causing excessive vectoring and level-offs. Recommendations An RNAV T-Route was developed to deconflict V186 traffic from BUR and VNY departures as shown in Figure 65. The T-Route was moved south of present day V186 to allow for this segregation. This T-Route is 2.6 NM longer than the present day V186 from FIM to PURMS. Efficiency and safety enhancements realized by development of this T-Route justify the longer route, as the BUR and VNY area has been identified as an area experiencing high levels of Traffic Collision and Avoidance System (TCAS) resolution advisories. Current Proposed Figure 65. Current V186 and Proposed T-Route 106
115 V66 T-Route Issues SAN arrival traffic was identified conflicting with V66 traffic, causing excessive vectoring and level-offs. Recommendations An RNAV T-Route was developed to deconflict V66 traffic from SAN arrivals, as shown in Figure 66. The T-Route was moved north of present day V66 to allow for this segregation. This T-Route is 3.3 NM longer than the present day V66 route from MZB to IPL. Efficiency and safety enhancements realized by deconflicting this traffic from SAN LYNDI arrival flows justify the longer route. Current Proposed Figure 66. Current V66 and Proposed T-Route 107
116 Los Angeles Basin to LAS T-Route Issues Stakeholders expressed a desire for an RNAV T-Route to the LAS area rather than the currently assigned V394/V363/V442 routings. Recommendations An RNAV T-Route was developed from POXKU to APLES (see Figure 67). This T- Route may conflict with ONT and LAX flows, which will require further evaluation before final implementation. The proposed T-Route compared to the V363 and V394 routing saves 3.6 NM. This route as compared to the V442 routing saves 3.2 NM. Standardized routing will increase efficiency and provide a reliable RNAV route out of the Southern California area to LAS. The Southern California D&I team should validate that this proposed T-Route would not conflicted with routings associated with the LAS Optimization Project. Current Proposed Figure 67. Current LAS Routing and Proposed T-Route 108
117 4.4.3 RNP Approaches One issue that stakeholders identified was that at many Southern California airports, there are long downwinds and runway transitions that require extra flying miles and unnecessary fuel loading. To help address this issue, the OST developed conceptual RNP AR approaches to runways at these identified airports for stabilized and efficient approach operations. The RNP AR approach transitions are connected to the proposed RNAV STARs where available to ensure maximum efficiency, both laterally and vertically. During the D&I process, additional RNP AR approaches may be considered for other runways or airports. Although there are indeed many benefits to be realized using RNP AR approaches (i.e., optimum profiles, cost to carry, efficient flight paths in IFR conditions etc.), quantifying these benefits is very difficult and the OST opted not to calculate benefits that were not supported by accepted data RNP Approaches into LAX The OST designed an RNP approach that seamlessly connects to the SYMON and KEACH STARs, which both have an altitude restriction of 7,000 feet at SMO (see Figure 68). Figure 68. RNP AR Approach to Runway 24R at LAX 109
118 RNP Approaches into LGB The OST designed an RNP Runway 30 approach with two approach transitions connecting to the QMARK and KEFFR STARs. Both approach transitions closely follow the historic flight paths into LGB (see Figure 69). Figure 69. RNP AR Approach to Runway 30 at LGB 110
119 RNP Approaches into BUR An RNP Runway 15 approach was designed with transitions connecting to the JANNY, CANYN, and PETIS STARs. Both approach transitions closely follow the historic flight paths into BUR (see Figure 70). Figure 70. RNP AR Approach to Runway 15 at BUR 111
. Figure 71. RNP AR Approach to Runway 27 at SAN 112")
120 RNP Approaches into SAN The OST designed an RNP Runway 27 approach with transitions connecting to the BAYVU and LYNDI STARs. Both approach transitions closely follow the historic flight paths into SAN (see Figure 71). Figure 71. RNP AR Approach to Runway 27 at SAN 112

121 RNP Approaches into VNY An RNP Runway 16R approach was designed with transitions connecting to the AALLL, JANNY, and the proposed East STARs. Both approach transitions closely follow the historic flight paths into VNY (see Figure 72). Figure 72. RNP AR Approach to Runway 16 at VNY 113
122 RNP Approaches into UDD Stakeholders requested that the OST analyze the possibility of designing RNP approaches into UDD. The terrain surrounding UDD adds challenges to the ability to design RNPs from each direction. The OST was able to design two RNPs using historic flight paths as a basis for the lateral tracks to Runways 10 and 28 (see Figure 73). Figure 73. RNP AR Approach to Runways 10 and 28 at UDD 114
123 RNP Approaches into TRM Stakeholders requested the OST to analyze the possibility of designing RNP approaches into TRM. The terrain surrounding TRM adds challenges to the ability to design RNPs from each direction. The OST was able to design two RNPs using historic flight paths as a basis for the lateral tracks to Runways 17 and 35 (see Figure 74). Figure 74. RNP AR Approach to Runways 17 and 35 at TRM 4.5 Southern California OAPM Issues Not Addressed or Requiring Additional Input The Southern California OST identified and characterized a range of problems and developed a number of conceptual solutions; however, some issues require additional coordination and input and could not be addressed within the time constraints of the OST process. These issues may be explored further during the D&I process. Other issues were simply beyond the scope of OAPM, and should be considered outside this process. 115
124 4.5.1 Issues for Consideration during Design and Implementation There were issues identified that are designated for further consideration during the D&I phase of the Southern California OAPM process. These issues were identified and recorded and are summarized below: Conventional procedures may require development at various airports throughout the Southern California Metroplex to accommodate those aircraft that are not RNAV/RNP equipped. Certain airspace sectors and facility boundaries may need to be modified to incorporate the new PBN procedures. A list of those sectors identified can be found in Appendix B at the end of this document. Additional east flow transitions need to be added to the LAX VTU SID. The SNA IRVINE SID is currently a conventional procedure with long level segments in the vicinity of SXC. A PBN procedure should be designed for more repeatable and predictable flight tracks, thereby reducing level-offs. The ANAHM SID is currently a conventional procedure with unused transitions and inefficient vertical and lateral paths. A PBN procedure should be designed for more repeatable and predictable flight tracks. The facilities have requested that the CASTA SID be used without the current time restrictions. The CASTA and LOOP SIDs are unused between the hours of local. More in-depth analysis will be required to make an accurate decision on the possibility of extended use. Holding patterns need to be developed in the D&I process. The OST recommends replacing the proposed FIXIT with an RNAV VTU SID. Further analysis will be required during the final design portion of the project. The PSP STARs (SBONO/CLOWD) are not completely tied into the RNP approaches. An ending altitude is required, but will need to be determined when actual procedures are in the final design stages. More work is required in determining where to implement RNP approaches at satellite airports. Notional RNP approaches have been developed for facility consideration and are included in the TARGETS package. More work is required in determining where new or improved T-Routes are needed in SCT s airspace. Although the OST did make some T-Route proposals, these were specifically requested by facilities and stakeholders. 116
125 4.5.2 Issues Outside of the Scope of OAPM Additional issues were identified that were beyond the scope of the Southern California OST and have been recorded for further consideration outside of the OAPM process. The out-of-scope issues identified and recorded are summarized below: RNAV visual approaches RNAV visual approaches are generally created by an individual airline or group. PSP operations revert to ZLA overnight Lack of radar coverage in the area makes this hard to achieve; however, with the implementation of Fusion the OST feels this could be considered in the future. Extended service volume (ESV) for ONT ILS This is a conventional approach and steps to extend the ILS ESV lie with the Western Service Center. Reverse flows over GMN Although it would be beneficial to reverse the arrival and departure flows over the GMN area, this project would involve four large facilities (SCT, ZLA, NCT, ZOA) requiring long term planning and extensive environmental work. Class B, Class C, TRSA Airspace changes requiring rulemaking do not fit within the OAPM timeline. NTD airspace transfer Facilitating this airspace transfer is outside of the OAPM scope Limits of Design Process The limitations placed on proposed designs by criteria for PBN procedures were brought up as an issue by facilities, stakeholders, and OST team members. The primary issue encountered is that the criteria for PBN procedures are overly restrictive, particularly for high-performing aircraft in use throughout the NAS today. One example of this criteria issue is the POGGI SID off SAN. The current POGGI cannot pass a criteria check without a speed restriction of 230 knots or less over JETTI and LOWMA. However, both facilities and stakeholders pointed out that this restriction is canceled by ATC for many, if not most, aircraft on the procedure, because it is unnecessary: aircraft can fly the procedure well without the restriction. Changes in criteria are well beyond the scope of the OST and indeed the OAPM process altogether; however, these types of criteria issues limit the scope of the PBN solutions and likely guarantee some controller intervention on PBN procedures, thus negating some of the expected benefits of the PBN procedures. 117
126 5 Summary of Benefits 5.1 Qualitative Benefits Near-Term Impacts The benefits of the PBN procedures proposed by the OST include the following: Reduced phraseology, frequency congestion, and pilot workload: Reduced phraseology due to PBN will reduce the number of transmissions needed to accomplish required restrictions by combining multiple clearances into a single transmission. Prior studies have demonstrated transmission reductions on the order of 18% to 34% with 85% RNAV equipage, 4 and the OST believes it is reasonable to expect a similar level of savings. Reduced transmissions will translate into less frequency congestion which could potentially reduce hear back/read back errors. In addition, the consolidation of clearances associated with an RNAV procedure reduces pilot workload, which allows for more headsup time and allows the crew to focus on high-workload situations. Repeatable, predictable flight paths and accurate fuel planning: The introduction of PBN ensures lateral flight path accuracy. The predictable flight paths help assure procedurally deconflicted traffic flows and allow airlines to more accurately plan for a consistent flight path. It also allows users to more accurately predict the amount of fuel required for a procedure. Enhanced lateral and vertical flight paths: Optimized climbs and descents and shorter lateral paths reduce the number and length of level-offs and total distance flown, thereby reducing fuel burn and carbon emissions. Altitude windows can vertically separate traffic flows and allow for industry-standard glide paths Long-Term Impacts to Industry Implementation of these proposed procedures will have long-term effects for industry. Flight planning OAPM proposed procedures will result in reduced mileage and fuel burn in the long-term, particularly as more metroplexes are optimized. In the near-term, more direct paths that are not dependent on ground-based navigational aids, plus optimized flight profiles, will lead to reduced fuel burn only within an optimized metroplex. Reduced fuel loading will also allow for a reduction in cost to carry. 4 Sprong, K., et al., June 2006, Benefits Estimation of RNAV SIDs and STARs at Atlanta, F083-B06-020, (briefing), The MITRE Corporation, McLean, VA. 118

127 Timetable Shortened, more efficient routes will necessitate timetable adjustments, particularly as more metroplexes are optimized. This will potentially benefit crew scheduling, connecting information, time on gates, ramp scheduling, etc. 5.2 Quantitative Benefits The quantified benefits of the Southern California OST recommendations are broken down into annual fuel savings in dollars, annual fuel savings in gallons, and annual carbon emissions reductions in metric tons. The primary benefit drivers are reduced miles flown and improved vertical profiles. The Southern California OST found that current track data indicated aircraft were already flying efficient lateral paths, and therefore much of the benefits result from improved vertical profiles. Table 32 breaks down the benefits for Southern California. These numbers were derived by comparing currently flown track miles, published procedure miles, and vertical profiles to proposed PBN procedure track miles and vertical profiles. First, it is fully expected that ATC will continue to offer shorter routings and remove climb restrictions, when feasible, further increasing operator benefits. The benefits analysis assumes aircraft will fly the specific lateral and vertical RNAV procedures. Table 32. Total Annual Fuel Benefits Associated with Distance, Profile, and Filed Mile Changes 119
Optimization of Airspace and Procedures in the Metroplex
 Optimization of Airspace and Procedures in the Metroplex Administration SoCal Metroplex Project Overview Brief To: By: Los Angeles World Airport Rob Henry, Manager SoCal Metroplex Jose Gonzalez, SoCal
SoCal Metroplex Study Area
 An Update on Southern California Airspace Modernization November 10, 2016 Chart Publication Date Santa Barbara Municipal Airport, Bob Hope Airport, Palm Springs International Airport, Ontario International
SoCal Metroplex Study Area
 An Update on Southern California Airspace Modernization November 10, 2016 Chart Publication Date Long Beach Daugherty, John Wayne Orange County, Los Alamitos, Fullerton Municipal and Zamperini Field Airports
An Update on Southern California Airspace Modernization November 10, 2016 Chart Publication Date San Diego International, McClellan Palomar, Brown
 An Update on Southern California Airspace Modernization November 10, 2016 Chart Publication Date San Diego International, McClellan Palomar, Brown Field Municipal and Navy North Island Airports October
Appendix B Ultimate Airport Capacity and Delay Simulation Modeling Analysis
 Appendix B ULTIMATE AIRPORT CAPACITY & DELAY SIMULATION MODELING ANALYSIS B TABLE OF CONTENTS EXHIBITS TABLES B.1 Introduction... 1 B.2 Simulation Modeling Assumption and Methodology... 4 B.2.1 Runway
Optimization of Airspace and Procedures in the Metroplex (OAPM) Study Team Final Report Northern California Metroplex
 Study Team Final Report Northern California Metroplex") Federal Aviation Administration Optimization of Airspace and Procedures in the Metroplex (OAPM) Study Team Final Report Northern California Metroplex Table of Contents 1 Background 1 2 Purpose of Northern
Federal Aviation Administration Optimization of Airspace and Procedures in the Metroplex (OAPM) Study Team Final Report Northern California Metroplex Table of Contents 1 Background 1 2 Purpose of Northern
Optimization of Airspace and Procedures in the Metroplex
 Optimization of Airspace and Procedures in the Metroplex Administration November 10, 2016 Chart Date To: By: Dispatchers Rob Henry, SoCal D&I Integration Manager Jose Gonzalez, SoCal NATCA D&I Lead Administration
Los Angeles Basin Terminal Airspace Redesign
 Los Angeles Basin Terminal Airspace Redesign Presentation to: GT CDA Workshop Name: Walter White & Kathryn Higgins Date: January 20, 2006 0 0 SCT Airspace Redesign Overview Raise initial LAX Departure
Aviation Committee Meeting
 Aviation Committee Meeting Chair: Paul Haney (Englander Knabe & Allen) Vice Chairs: Jim Dunn (Airtel Plaza Hotel) Stacy Howard (National Business Aviation Association) Lunch Courtesy of WEDNESDAY, AUGUST
Cleveland/Detroit Metroplex
 Federal Aviation Administration Cleveland/Detroit Metroplex Optimization of Airspace and Procedures Study Team Final Report May 2014 By Cleveland/Detroit Metroplex Study Team Table of Contents 1 Background
Federal Aviation Administration. Optimization of Airspace and Procedures in the Metroplex (OAPM) Study Team Final Report Atlanta Metroplex
 Study Team Final Report Atlanta Metroplex") Federal Aviation Administration Optimization of Airspace and Procedures in the Metroplex (OAPM) Study Team Final Report Atlanta Metroplex Table of Contents 1 Background 1 2 Purpose of Atlanta Team Effort
Federal Aviation Administration Optimization of Airspace and Procedures in the Metroplex (OAPM) Study Team Final Report Atlanta Metroplex Table of Contents 1 Background 1 2 Purpose of Atlanta Team Effort
Federal Aviation Administration. Optimization of Airspace and Procedures in the Metroplex (OAPM) Study Team Final Report Charlotte Metroplex
 Study Team Final Report Charlotte Metroplex") Administration Optimization of Airspace and Procedures in the Metroplex (OAPM) Study Team Final Report Charlotte Metroplex Table of Contents 1 Background 1 2 Purpose of the Charlotte OST Effort 1 3 OST
Administration Optimization of Airspace and Procedures in the Metroplex (OAPM) Study Team Final Report Charlotte Metroplex Table of Contents 1 Background 1 2 Purpose of the Charlotte OST Effort 1 3 OST
2 Purpose and Need. 2.1 The Need for the CLT OAPM Project Description of the Problem
 2 Purpose and Need Under NEPA, an Environmental Assessment (EA) must describe the purpose and need for the Proposed Action. The following sections discuss the need for the Proposed Action and provide specific
THE NATIONAL ACADEMIES PRESS
 THE NATIONAL ACADEMIES PRESS This PDF is available at http://nap.edu/23574 SHARE NextGen for Airports, Volume 1: Understanding the Airport s Role in Performance-Based Navigation: Resource Guide DETAILS
PBN AIRSPACE CONCEPT WORKSHOP. SIDs/STARs/HOLDS. Continuous Descent Operations (CDO) ICAO Doc 9931
 ICAO Doc 9931") International Civil Aviation Organization PBN AIRSPACE CONCEPT WORKSHOP SIDs/STARs/HOLDS Continuous Descent Operations (CDO) ICAO Doc 9931 Design in context Methodology STEPS TFC Where does the traffic
International Civil Aviation Organization PBN AIRSPACE CONCEPT WORKSHOP SIDs/STARs/HOLDS Continuous Descent Operations (CDO) ICAO Doc 9931 Design in context Methodology STEPS TFC Where does the traffic
Name of Customer Representative: Bruce DeCleene, AFS-400 Division Manager Phone Number:
 Phase I Submission Name of Program: Equivalent Lateral Spacing Operation (ELSO) Name of Program Leader: Dr. Ralf Mayer Phone Number: 703-983-2755 Email: rmayer@mitre.org Postage Address: The MITRE Corporation,
Los Angeles International Airport Community Noise Roundtable LAX Departure Overflights of Palos Verdes and San Pedro
 Los Angeles International Airport Community Noise Roundtable LAX Departure Overflights of Palos Verdes and San Pedro Comments by Jeff Calvagna Rancho Palos Verdes 6 March 2018 Summary of Key Points LAX
Have Descents Really Become More Efficient? Presented by: Dan Howell and Rob Dean Date: 6/29/2017
 Have Descents Really Become More Efficient? Presented by: Dan Howell and Rob Dean Date: 6/29/2017 Outline Introduction Airport Initiative Categories Methodology Results Comparison with NextGen Performance
Optimized Profile Descents A.K.A. CDA A New Concept RTCA Airspace Working Group
 Optimized Profile Descents A.K.A. CDA A New Concept RTCA Presented to Environmental Working Group December 05, 2007 Outline RTCA Charter and Terms of Reference Objectives Membership and Organization Activities
VATSIM LOS ANGELES ARTCC STANDARD OPERATING PROCEDURES
 VATSIM LOS ANGELES ARTCC STANDARD OPERATING PROCEDURES September 25th, 2018 1 VATSIM LOS ANGELES ARTCC STANDARD OPERATING PROCEDURES FOREWORD This document establishes facility Standard Operating Procedures
Analysis of Operational Impacts of Continuous Descent Arrivals (CDA) using runwaysimulator
 using runwaysimulator") Analysis of Operational Impacts of Continuous Descent Arrivals (CDA) using runwaysimulator Camille Shiotsuki Dr. Gene C. Lin Ed Hahn December 5, 2007 Outline Background Objective and Scope Study Approach
Analysis of Operational Impacts of Continuous Descent Arrivals (CDA) using runwaysimulator Camille Shiotsuki Dr. Gene C. Lin Ed Hahn December 5, 2007 Outline Background Objective and Scope Study Approach
POST-IMPLEMENTATION COMMUNITY IMPACT REVIEW
 POST-IMPLEMENTATION COMMUNITY IMPACT REVIEW RNAV STAR updates and RNP AR approaches at Edmonton International Airport NAV CANADA 77 Metcalfe Street Ottawa, Ontario K1P 5L6 January 2018 The information
RNP AR APCH Approvals: An Operator s Perspective
 RNP AR APCH Approvals: An Operator s Perspective Presented to: ICAO Introduction to Performance Based Navigation Seminar The statements contained herein are based on good faith assumptions and provided
Surveillance and Broadcast Services
 Surveillance and Broadcast Services Benefits Analysis Overview August 2007 Final Investment Decision Baseline January 3, 2012 Program Status: Investment Decisions September 9, 2005 initial investment decision:
POST-IMPLEMENTATION COMMUNITY IMPACT REVIEW
 POST-IMPLEMENTATION COMMUNITY IMPACT REVIEW RNAV STAR updates and RNP AR approaches at Winnipeg James Armstrong Richardson International Airport NAV CANADA 77 Metcalfe Street Ottawa, Ontario K1P 5L6 November
Continuous Descent? And RNAV Arrivals
 Continuous Descent? And RNAV Arrivals From an ATC Perspective Presentation to: CDA Workshop GA Tech Name: Don Porter RNP Project Lead FAA, RNAV RNP Group Date: 18 April 2006 My Background 22 years Terminal
Design Airspace (Routes, Approaches and Holds) Module 11 Activity 7. European Airspace Concept Workshops for PBN Implementation
 Module 11 Activity 7. European Airspace Concept Workshops for PBN Implementation") Design Airspace (Routes, Approaches and Holds) Module 11 Activity 7 European Airspace Concept Workshops for PBN Implementation Design in Context TFC Where does the traffic come from? And when? RWY Which
Design Airspace (Routes, Approaches and Holds) Module 11 Activity 7 European Airspace Concept Workshops for PBN Implementation Design in Context TFC Where does the traffic come from? And when? RWY Which
System Oriented Runway Management: A Research Update
 National Aeronautics and Space Administration System Oriented Runway Management: A Research Update Gary W. Lohr gary.lohr@nasa.gov Senior Research Engineer NASA-Langley Research Center ATM 2011 Ninth USA/EUROPE
(Presented by the United States)
") International Civil Aviation Organization 31/07/09 North American, Central American and Caribbean Office (NACC) Tenth Meeting of Directors of Civil Aviation of the Central Caribbean (C/CAR/DCA/10) Grand
International Civil Aviation Organization 31/07/09 North American, Central American and Caribbean Office (NACC) Tenth Meeting of Directors of Civil Aviation of the Central Caribbean (C/CAR/DCA/10) Grand
Operators may need to retrofit their airplanes to ensure existing fleets are properly equipped for RNP operations. aero quarterly qtr_04 11
 Operators may need to retrofit their airplanes to ensure existing fleets are properly equipped for RNP operations. 24 equipping a Fleet for required Navigation Performance required navigation performance
Air Navigation Bureau ICAO Headquarters, Montreal
 Performance Based Navigation Introduction to PBN Air Navigation Bureau ICAO Headquarters, Montreal 1 Performance Based Navigation Aviation Challenges Navigation in Context Transition to PBN Implementation
Updates to Procedures at St. John s International Airport
 October 10, 2017 Updates to Procedures at St. John s International Airport This document provides notice of upcoming changes to instrument procedures being implemented by NAV CANADA at the St. John s International
LAX Community Noise Roundtable Work Program A1 Review of SoCal Metroplex Proposed Procedures and Suggestions for Comment Letter.
 LAX Community Noise Roundtable Work Program A1 Review of SoCal Metroplex Proposed Procedures and Suggestions for Comment Letter July 8, 2015 Southern California Metroplex Environmental Assessment Presentation
POST-IMPLEMENTATION COMMUNITY IMPACT REVIEW
 POST-IMPLEMENTATION COMMUNITY IMPACT REVIEW RNAV STAR updates and RNP AR approaches at Halifax Stanfield International Airport NAV CANADA 77 Metcalfe Street Ottawa, Ontario K1P 5L6 November 2017 The information
International Civil Aviation Organization. PBN Airspace Concept. Victor Hernandez
 International Civil Aviation Organization PBN Airspace Concept Victor Hernandez Overview Learning Objective: at the end of this presentation you should Understand principles of PBN Airspace Concept 2 Gate
Click to edit Master title style
 Federal Aviation Administration (FAA) SoCal Metroplex Project LAWA Briefing to City Council IGTC&T Committee Los Angles World Airports Noise Management June 7, 2016 Background: NextGen Program & PBN NextGen
Federal Aviation. Administration. FAA Overview. Federal Aviation. Administration
 Presented to: AFCEA International Los Angeles By: William C. Withycombe Regional Administrator, Western-Pacific Region Date: Overview! Major Safety Initiatives! Organizational Structure! Destination 2025!
LONG BEACH, CALIFORNIA
 LONG BEACH, CALIFORNIA 1 LONG BEACH, CALIFORNIA Airport Capacity Session Kent Duffy Senior Airport Planner Federal Aviation Administration kent.duffy@faa.gov 2 Agenda FAA Airport Capacity Guidance Airport
Washington Dulles International Airport (IAD) Aircraft Noise Contour Map Update
 Aircraft Noise Contour Map Update") Washington Dulles International Airport (IAD) Aircraft Noise Contour Map Update Ultimate ASV, Runway Use and Flight Tracks 4th Working Group Briefing 8/13/18 Meeting Purpose Discuss Public Workshop input
Washington Dulles International Airport (IAD) Aircraft Noise Contour Map Update Ultimate ASV, Runway Use and Flight Tracks 4th Working Group Briefing 8/13/18 Meeting Purpose Discuss Public Workshop input
PBN Performance. Based Navigation. Days 1, 2 & 3. ICAO PBN Seminar Seminar Case Studies Days 1,2,3. Seminar Case Studies
 PBN Performance Based Navigation Seminar Case Studies Days 1, 2 & 3 1 Overview 2 Case Study - Day 1 Case Study - Day 2 Case Study - Day 3 3 Case Study - Day 1 Learning Objectives Identify navigation performance
NextGen Priorities: Multiple Runway Operations & RECAT
 NextGen Priorities: Multiple Runway Operations & RECAT May 2018 Presented by Paul Strande & Jeffrey Tittsworth Federal Aviation Administration National Airspace System Today Air traffic services for the
FLIGHT OPERATIONS PANEL (FLTOPSP)
") International Civil Aviation Organization FLTOPSP/1-WP/3 7/10/14 WORKING PAPER FLIGHT OPERATIONS PANEL (FLTOPSP) FIRST MEETING Montréal, 27 to 31 October 2014 Agenda Item 4: Active work programme items
International Civil Aviation Organization FLTOPSP/1-WP/3 7/10/14 WORKING PAPER FLIGHT OPERATIONS PANEL (FLTOPSP) FIRST MEETING Montréal, 27 to 31 October 2014 Agenda Item 4: Active work programme items
The purpose of this Demand/Capacity. The airfield configuration for SPG. Methods for determining airport AIRPORT DEMAND CAPACITY. Runway Configuration
 Chapter 4 Page 65 AIRPORT DEMAND CAPACITY The purpose of this Demand/Capacity Analysis is to examine the capability of the Albert Whitted Airport (SPG) to meet the needs of its users. In doing so, this
TWELFTH AIR NAVIGATION CONFERENCE
 International Civil Aviation Organization AN-Conf/12-WP/6 7/5/12 WORKING PAPER TWELFTH AIR NAVIGATION CONFERENCE Agenda Item 2: Aerodrome operations improving airport performance 2.2: Performance-based
Learning Objectives. By the end of this presentation you should understand:
 Designing Routes 1 Learning Objectives By the end of this presentation you should understand: Benefits of RNAV Considerations when designing airspace routes The basic principles behind route spacing The
Executive Summary. MASTER PLAN UPDATE Fort Collins-Loveland Municipal Airport
 Executive Summary MASTER PLAN UPDATE Fort Collins-Loveland Municipal Airport As a general aviation and commercial service airport, Fort Collins- Loveland Municipal Airport serves as an important niche
1. Background. 2. Summary and conclusion. 3. Flight efficiency parameters. Stockholm 04 May, 2011
 Stockholm 04 May, 2011 1. Background By this document SAS want to argue against a common statement that goes: Green departures are much more fuel/emission efficient than green arrivals due to the fact
Federal Aviation Administration. Air Traffic 101. By: Michael Valencia & Dianna Johnston Date: Feb. 26, 2017
 Presented to: UC Davis Aviation Symposium By: Michael Valencia & Dianna Johnston Date: Overview Part 1 Air Traffic Controllers History Safety and Navigation Terminology Air Traffic Facility Types Equipment
Colombian PBN implementation: El Dorado case study
 Colombian PBN implementation: El Dorado case study SDM WORKSHOP ON PBN 19.10.2017 XAVIER OUTTERS SME & PROJECT MANAGER NAVBLUE SAS Electronic Flight Bag Dispatch Pre-flight Airport Databases - FlySmart+
According to FAA Advisory Circular 150/5060-5, Airport Capacity and Delay, the elements that affect airfield capacity include:
 4.1 INTRODUCTION The previous chapters have described the existing facilities and provided planning guidelines as well as a forecast of demand for aviation activity at North Perry Airport. The demand/capacity
NextGen: New Technology for Improved Noise Mitigation Efforts: DFW RNAV Departure Procedures
 NextGen: New Technology for Improved Noise Mitigation Efforts: DFW RNAV Departure Procedures DFW International Airport Sandy Lancaster, Manager Noise Compatibility October 13, 2008 OUTLINE About DFW Airport
Operational Evaluation of a Flight-deck Software Application
 Operational Evaluation of a Flight-deck Software Application Sara R. Wilson National Aeronautics and Space Administration Langley Research Center DATAWorks March 21-22, 2018 Traffic Aware Strategic Aircrew
AERONAUTICAL INFORMATION CIRCULAR 18/18
 NAV CANADA 19 JUL 18 AERONAUTICAL INFORMATION CIRCULAR 18/18 GUIDANCE FOR STANDARD TERMINAL ARRIVAL (STAR) PROCEDURES The guidance currently published in the Transport Canada Aeronautical Information Manual
American Institute of Aeronautics and Astronautics
 Speech by Jeff Hmara to the American Institute of Aeronautics and Astronautics Tuesday April 25, 2002 FREE FLIGHT 1500 K Street, NW Suite 500 Washington, DC 20005 WHAT IS FREE FLIGHT?...3 CORE CAPABILITIES...3
Mr. Chairman, Members of the Committee, I am Chet Fuller, President GE Aviation
 Mr. Chairman, Members of the Committee, I am Chet Fuller, President GE Aviation Systems, Civil. Thank you for the opportunity to testify before the Subcommittee today on the issue of Area Navigation (RNAV)
Saint Petersburg-Clearwater International Airport. Airspace & Instrument Approach Analysis
 Saint Petersburg-Clearwater International Airport Airspace & Instrument Approach Analysis February 23, 2005 Jeppesen Boeing Jeppesen Government / Military Services Group Airspace Services Division AIRSPACE
COMMUNITY NOISE MITIGATION SUGGESTIONS
 COMMUNITY NOISE MITIGATION SUGGESTIONS Toronto Pearson is one of North America's fastest growing global hub airports, handling nearly 40 million passengers today, and well on its way to reaching greater
2 Purpose and Need. 2.1 The Need for the Proposed Action Description of the Problem
 2 Purpose and Need The FAA is preparing this EA to evaluate the potential environmental impacts associated with implementation of new RNAV-defined IFPs for the Atlanta Metroplex (Proposed Action). According
MetroAir Virtual Airlines
 MetroAir Virtual Airlines NAVIGATION BASICS V 1.0 NOT FOR REAL WORLD AVIATION GETTING STARTED 2 P a g e Having a good understanding of navigation is critical when you fly online the VATSIM network. ATC
PBN and airspace concept
 PBN and airspace concept 07 10 April 2015 Global Concepts Global ATM Operational Concept Provides the ICAO vision of seamless, global ATM system Endorsed by AN Conf 11 Aircraft operate as close as possible
TWELFTH AIR NAVIGATION CONFERENCE
 International Civil Aviation Organization 19/3/12 WORKING PAPER TWELFTH AIR NAVIGATION CONFERENCE Montréal, 19 to 30 November 2012 (Presented by the Secretariat) EXPLANATORY NOTES ON THE AGENDA ITEMS The
Efficiency and Automation
 Efficiency and Automation Towards higher levels of automation in Air Traffic Management HALA! Summer School Cursos de Verano Politécnica de Madrid La Granja, July 2011 Guest Lecturer: Rosa Arnaldo Universidad
APPENDIX D MSP Airfield Simulation Analysis
 APPENDIX D MSP Airfield Simulation Analysis This page is left intentionally blank. MSP Airfield Simulation Analysis Technical Report Prepared by: HNTB November 2011 2020 Improvements Environmental Assessment/
Framework Brief. Edinburgh SIDs
 Framework Brief 11-Nov-2015 CAA House Edinburgh SIDs 2 Security Statement Unclassified This presentation has been approved for public distribution and publication on the CAA website. Copyright 2015 NATS/
TWELFTH WORKING PAPER. AN-Conf/12-WP/137. International ICAO. developing RNAV 1.1. efficiency. and terminal In line.
 International Civil Aviation Organization WORKING PAPER 31/10/12 English only TWELFTH AIR NAVIGATION CONFERENCE Montréal, 19 to 30 November 2012 Agenda Item 5: Efficient flight paths through trajectory-based
LA Basin Hot Spots. Southern California Airspace Users Working Group Education Subcommittee
 LA Basin Hot Spots This Presentation has been adapted from a presentation of Al German Orange County Flight Center by the Southern California Airspace Users Working Group Education Subcommittee What you
GREENER SKIES OVER SEATTLE INITIATIVE
 WRITTEN SUBMISSION OF AIR LINE PILOTS ASSOCIATION, INTERNATIONAL TO THE SUBCOMMITTEE ON AVIATION COMMITTEE ON TRANSPORTATION AND INFRASTRUCTURE UNITED STATES HOUSE OF REPRESENTATIVES ON NEXTGEN SUCCESS
Performance Based Navigation (PBN) Implementation Plan. The Gambia
 Implementation Plan. The Gambia") Performance Based Navigation (PBN) Implementation Plan The Gambia Version 1.0 Table of contents 1. Executive summary.. 2 2. Introduction. 2 3. The need for PBN implementation 2 4. Benifit of PBN implementation
Performance Based Navigation (PBN) Implementation Plan The Gambia Version 1.0 Table of contents 1. Executive summary.. 2 2. Introduction. 2 3. The need for PBN implementation 2 4. Benifit of PBN implementation
NextGen Trajectory-Based Operations Status Update Environmental Working Group Operations Standing Committee
 NextGen Trajectory-Based Operations Status Update Environmental Working Group Operations Standing Committee May 17, 2010 Rose Ashford Rose.Ashford@nasa.gov 1 Outline Key Technical Concepts in TBO Current
Draft Concept Alternatives Analysis for the Inaugural Airport Program September 2005
 Draft Concept Alternatives Analysis for the Inaugural Airport Program September 2005 Section 3 - Refinement of the Ultimate Airfield Concept Using the Base Concept identified in Section 2, IDOT re-examined
2012 Performance Framework AFI
 2012 Performance Framework AFI Nairobi, 14-16 February 2011 Seboseso Machobane Regional Officer ATM, ESAF 1 Discussion Intro Objectives, Metrics & Outcomes ICAO Process Framework Summary 2 Global ATM Physical
NextGen AeroSciences, LLC Seattle, Washington Williamsburg, Virginia Palo Alto, Santa Cruz, California
 NextGen AeroSciences, LLC Seattle, Washington Williamsburg, Virginia Palo Alto, Santa Cruz, California All Rights Reserved 1 Topics Innovation Objective Scientific & Mathematical Framework Distinctions
AIR TRAFFIC FLOW MANAGEMENT INDIA S PERSPECTIVE. Vineet Gulati GM(ATM-IPG), AAI
, AAI") AIR TRAFFIC FLOW MANAGEMENT INDIA S PERSPECTIVE Vineet Gulati GM(ATM-IPG), AAI AIR TRAFFIC FLOW MANAGEMENT ATFM is a service provided with the objective to enhance the efficiency of the ATM system by,
AIR TRAFFIC FLOW MANAGEMENT INDIA S PERSPECTIVE Vineet Gulati GM(ATM-IPG), AAI AIR TRAFFIC FLOW MANAGEMENT ATFM is a service provided with the objective to enhance the efficiency of the ATM system by,
Atlantic Interoperability Initiative to Reduce Emissions AIRE
 ICAO Colloquium on Aviation and Climate Change ICAO ICAO Colloquium Colloquium on Aviation Aviation and and Climate Climate Change Change Atlantic Interoperability Initiative to Reduce Emissions AIRE Célia
ICAO PBN CONCEPTS, BENEFITS, AND OBJECTIVES
 AFCAC/ICAO Joint Workshop Walter White ICAO PBN CONCEPTS, BENEFITS, AND OBJECTIVES 24 JUNE 2014 Airbus ProSky Corporate Presentation 29/06/2014 PERFORMANCE-BASED NAVIGATION The implementation of Performance-Based
USE OF RADAR IN THE APPROACH CONTROL SERVICE
 USE OF RADAR IN THE APPROACH CONTROL SERVICE 1. Introduction The indications presented on the ATS surveillance system named radar may be used to perform the aerodrome, approach and en-route control service:
Cockpit Display of Traffic Information (CDTI) Assisted Visual Separation (CAVS)
 Assisted Visual Separation (CAVS)") Cockpit Display of Traffic Information (CDTI) Assisted Visual Separation (CAVS) Randall Bone 6 th USA / Europe ATM 2005 R&D Seminar Baltimore, Maryland June 2005 Overview Background Automatic Dependent
Cockpit Display of Traffic Information (CDTI) Assisted Visual Separation (CAVS) Randall Bone 6 th USA / Europe ATM 2005 R&D Seminar Baltimore, Maryland June 2005 Overview Background Automatic Dependent
Modification of VOR Federal Airway V-170 in the Vicinity of Devils Lake, ND
 This document is scheduled to be published in the Federal Register on 01/09/2013 and available online at http://federalregister.gov/a/2013-00288, and on FDsys.gov 4910-13 DEPARTMENT OF TRANSPORTATION Federal
Safety / Performance Criteria Agreeing Assumptions Module 10 - Activities 5 & 6
 Safety / Performance Criteria Agreeing Assumptions Module 10 - Activities 5 & 6 European Airspace Concept Workshops for PBN Implementation Why have safety and performance criteria? Measure performance
Required Navigation Performance (RNP) in the United States
 in the United States") Required Navigation Performance (RNP) in the United States Overview FAA Roadmap for Performance-Based Navigation Moving to Performance-Based Navigation (RNAV and RNP) Definitions Operational attributes
Required Navigation Performance (RNP) in the United States Overview FAA Roadmap for Performance-Based Navigation Moving to Performance-Based Navigation (RNAV and RNP) Definitions Operational attributes
Don-Jacques OULD FERHAT VP Airspace and Airlines Services. Airbus. PBN Safety programs
 Don-Jacques OULD FERHAT VP Airspace and Airlines Services Airbus PBN Safety programs Long term cooperation with China Complex projects in China RNP AR at Kathmandu airport Cochin : First RNP APCH in India
FORT LAUDERDALE-HOLLYWOOD INTERNATIONAL AIRPORT ENVIRONMENTAL IMPACT STATEMENT DRAFT
 D.3 RUNWAY LENGTH ANALYSIS Appendix D Purpose and Need THIS PAGE INTENTIONALLY LEFT BLANK Appendix D Purpose and Need APPENDIX D.3 AIRFIELD GEOMETRIC REQUIREMENTS This information provided in this appendix
Follow up to the implementation of safety and air navigation regional priorities XMAN: A CONCEPT TAKING ADVANTAGE OF ATFCM CROSS-BORDER EXCHANGES
 RAAC/15-WP/28 International Civil Aviation Organization 04/12/17 ICAO South American Regional Office Fifteenth Meeting of the Civil Aviation Authorities of the SAM Region (RAAC/15) (Asuncion, Paraguay,
RNP AR and Air Traffic Management
 RNP AR and Air Traffic Management BOEING is a trademark of Boeing Management Company. Copyright 2009 Boeing. All rights reserved. Expanding the Utility of RNP AR Sheila Conway RNP AR User s Forum Wellington,
Forecast of Aviation Activity
 DETROIT METROPOLITAN WAYNE COUNTY AIRPORT FAR PART 150 NOISE COMPATIBILITY STUDY UPDATE CHAPTER B FORECAST OF AVIATION ACTIVITY Forecast of Aviation Activity Introduction This chapter summarizes past aviation
SECTOR ROUTE/STAR INSTRUCTION NOTES
 1. PURPOSE: This letter of agreement establishes standard procedures for coordination of air traffic between Los Angeles Center (ZLA) and the Southern California TRACON (SCT). 2. CANCELLATION: All previous
CONTROLLED AIRSPACE CONTAINMENT POLICY
 Safety and Airspace Regulation Group (SARG) 17 January 2014 Policy Statement 1 Overview CONTROLLED AIRSPACE CONTAINMENT POLICY 1.1 UK airspace design policy for ATS Routes, SIDs and STARs is based upon
Draft Environmental Assessment for the Cleveland-Detroit Metroplex Project
 Draft Environmental Assessment for the November 10, 2017 Prepared by: United States Department of Transportation Federal Aviation Administration Dallas, TX Table of Contents 1 Introduction... 1-1 Project
LAMP 2 - FASI(S) Network
 Network") Future Airspace Strategy Implementation South: ATS Route Network managed by NERL under London Airspace Management Programme 2 LAMP 2 - FASI(S) Network Stage 1 Assessment Meeting Friday 23 rd February 2018
Future Airspace Strategy Implementation South: ATS Route Network managed by NERL under London Airspace Management Programme 2 LAMP 2 - FASI(S) Network Stage 1 Assessment Meeting Friday 23 rd February 2018
AIR/GROUND SIMULATION OF TRAJECTORY-ORIENTED OPERATIONS WITH LIMITED DELEGATION
 AIR/GROUND SIMULATION OF TRAJECTORY-ORIENTED OPERATIONS WITH LIMITED DELEGATION Thomas Prevot Todd Callantine, Jeff Homola, Paul Lee, Joey Mercer San Jose State University NASA Ames Research Center, Moffett
Dave Allanby GM Operations SOUTH AFRICAN EXPRESS
 Dave Allanby GM Operations SOUTH AFRICAN EXPRESS World Airspace Usage World City to City - 60 000 Flights Expectations of a Single Airspace Regional Master Plan To provide a strategic view and direction
OVERVIEW OF THE FAA ADS-B LINK DECISION
 June 7, 2002 OVERVIEW OF THE FAA ADS-B LINK DECISION Summary This paper presents an overview of the FAA decision on the ADS-B link architecture for use in the National Airspace System and discusses the
PBN Performance. Based Navigation. - PBN & Airspace Concepts - ICAO PBN Seminar Introduction to PBN
 PBN Performance Based Navigation - PBN & Airspace Concepts - Introduction to PBN 1 Learning Objectives PBN Concept within the context of an Airspace (Operational) Concept. Introduction to PBN 2/37 Components
Performance Metrics for Oceanic Air Traffic Management. Moving Metrics Conference Pacific Grove, California January 29, 2004 Oceanic Metrics Team
 Performance Metrics for Oceanic Air Traffic Management Moving Metrics Conference Pacific Grove, California January 29, 2004 Oceanic Metrics Team Agenda Metrics Team Michele Merkle, FAA AUA-600 Lynne Hamrick,
Instrument Proficiency Check Flight Record
 Instrument Proficiency Check Flight Record Date: Flight Time: Sim. Inst. Time: Pilot Name: Aircraft Type: Aircraft Tail Number: Act. Inst. Time: Instructor Name: Holding Procedures Task Notes N/A Satisfactory
Naples Airport Authority Board of Commissioners and Noise Compatibility Committee Special Meeting on Central/South Florida Metroplex
 Naples Airport Authority Board of Commissioners and Noise Compatibility Committee Special Meeting on Central/South Florida Metroplex March 16, 2017 Ted Baldwin and Robert Mentzer Metroplex Overview: From
Measurement of environmental benefits from the implementation of operational improvements
 Measurement of environmental benefits from the implementation of operational improvements ICAO International Aviation and Environment Seminar 18 19 March 2015, Warsaw, Poland Sven Halle Overview KPA ASSEMBLY
ATM STRATEGIC PLAN VOLUME I. Optimising Safety, Capacity, Efficiency and Environment AIRPORTS AUTHORITY OF INDIA DIRECTORATE OF AIR TRAFFIC MANAGEMENT
 AIRPORTS AUTHORITY OF INDIA ATM STRATEGIC PLAN VOLUME I Optimising Safety, Capacity, Efficiency and Environment DIRECTORATE OF AIR TRAFFIC MANAGEMENT Version 1 Dated April 08 Volume I Optimising Safety,
Airport Characterization for the Adaptation of Surface Congestion Management Approaches*
 MIT Lincoln Laboratory Partnership for AiR Transportation Noise and Emissions Reduction MIT International Center for Air Transportation Airport Characterization for the Adaptation of Surface Congestion
Southern California TRACON and Lindbergh Tower LETTER OF AGREEMENT SUBJECT: INTER-FACILITY COORDINATION AND CONTROL PROCEDURES
 Southern California TRACON and Lindbergh Tower LETTER OF AGREEMENT EFFECTIVE: September 13, 2012 SUBJECT: INTER-FACILITY COORDINATION AND CONTROL PROCEDURES 1. PURPOSE. This agreement establishes procedures