Shazia Zaman MSDS 63712Section 401 Project 2: Data Reduction Page 1 of 9
|
|
|
- Baldwin Nelson
- 5 years ago
- Views:
Transcription
1 Shazia Zaman MSDS 63712Section 401 Project 2: Data Reduction Page 1 of 9 Introduction: Airport operation as on-timer performance, fares for travelling to or from the airport, certain connection facilities as train, bus to and from the airport are related to how travelers decide to travel through the airport. At any given airport, the airport revenue is based on flights being flown in and out of the airport. However, it also depends on how many travelers have travelled through the airport to provide added revenue by utilizing different services at the airport. Descriptive Statistics: The data being used in this study is collected from US Department of Transportation available at for following: US domestic airports on-time performance for domestic travel as reported by major airlines on monthly basis US domestic traffic as flights were scheduled for domestic travel plus number of seats available and number of passenger being travelled. Data is available on monthly basis. US domestic average fare based on airport from where travel has originated. This is based on round trip fare if round trip was purchased and one-way fare if one-way trip was purchased. Data is only available on quarterly basis as finance reports are available on quarterly basis. I have applied the fares to each month in the years based on the quarter of the years. For example, the average fare reported in 1 st Quarter of 2014 is applied to month 1, 2, and 3 in Other inter-connection services available at US domestic airports as intercity connection through rail, bus, airline, ferry and airport official website in order to provide certain travel information prior to travel planning. Data is available as up-to-date information, and information is not available on historical basis. I have applied this data to all the months for given airport based on airport code. This study is lacking to gather data for security checkpoint wait time at the airport. It was challenging and manual process to gather historical data from Transportation Security Administration site Data selection: I have collected data for year 2014 and As Average fare quarterly report for 3Q of 2015 is still not available, I have removed the data for 3Q of I have selected data for airports that have network with at least 10 different airport for inbound and outbound flights. Additionally I have only included airports with at least 5000 departures and arrival scheduled per month. This will reduce the possibility of any outliers due to very small airport operations. Goal: The goal of this study is to analyze data using data reduction models and analyze the variable that are correlated to either passengers being travelled to or from the airport.
2 Shazia Zaman MSDS 63712Section 401 Project 2: Data Reduction Page 2 of 9 Explanatory variables: Sums are aggregated on month except for categorical (Yes/No) and Numerical data types Variable Abbreviation Data type Used in Analysis Count of different airlines flying out of the airport outbound_carrier_cnt Numerical Removed from initial analysis as it is mostly same as inbound carrier count Count of different airlines flying out of inbound_carrier_cnt Numerical Yes the airport Count of different airport that are inbound_network_cnt Numerical Yes connected through outbound flights from the airport Count of different airport that are connected through inbound flights to outbound_network_cnt Numerical Yes the airport Is other connection service by rail, bus, ferry, air is available to/from the airport to/from city Is other connection service by rail, bus, ferry, air is available to/from the airport to/from another airport in the area How many different services available either as intercity service or transit service INTERCITY_SERVICE Yes/No Removed after initial analysis transit_service Yes/No Removed after initial analysis modes_serving Numerical Removed after initial analysis for PC Does the airport has official website website_avail Yes/No Removed after initial analysis Average fare from origination airport fare Continuous Yes Sum of number of Departure delays >= DEP_DEL15 Continuous Yes 15 minutes Sum of cancelled flights CANCELLED Yes Sum of number of Arrival delay >= 15 ARR_DEL15 Yes minutes Sum of delays due to carrier s operation carrier_delay Continuous Yes Sum of delays due to incoming aircraft being late causing the on-going flight being late >= 15 minutes LATE_AIRCRAFT_DELAY Continuous Yes Sum of delays or cancellation attributed to National Aviation System Sum of delays and cancellation due to security issues as re-boarding, evacuation. nas_delay Continuous Yes SECURITY_DELAY Continuous Yes Sum of delays due to weather delays on WEATHER_DELAY Continuous Yes either origin or destination Sum of departures scheduled as planned departures_scheduled Continuous Yes Sum of departures actually performed departures_performed Continuous Yes


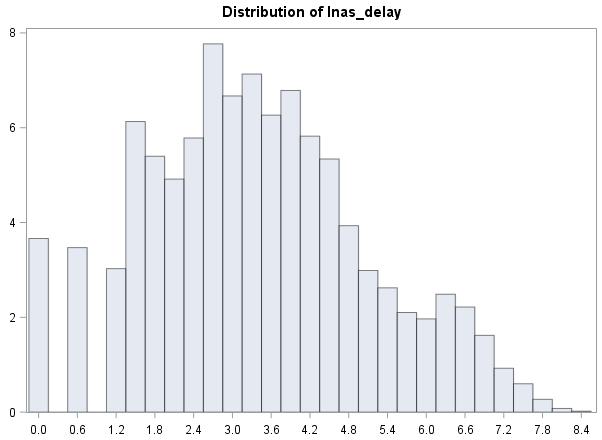
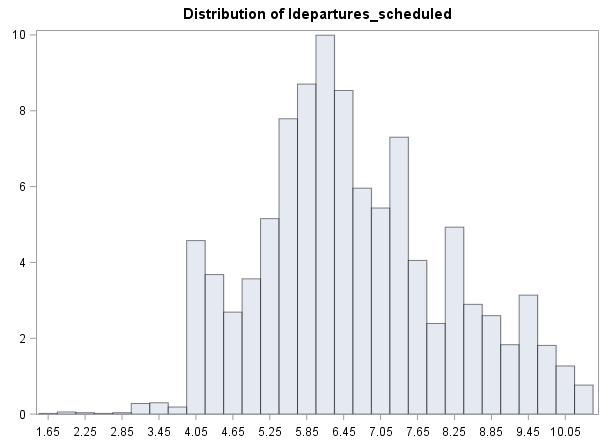
3 Shazia Zaman MSDS 63712Section 401 Project 2: Data Reduction Page 3 of 9 Sum of arrivals actually performed arrivals_performed Continuous Yes Sum of arrivals scheduled as planned arrivals_scheduled Continuous Yes Sum of seats available on flights outbound_capacity Continuous Yes departing from the airport Sum of seats available on flights arriving at the airport inbound_capacity Continuous Yes Table 1 Response variables: Variable Abbreviation Data Type Used in Analysis Number of passengers boarded on passengers_enplaned Continuous Yes flights flying out from the airport Number of passengers arrived at the airport from incoming flights passengers_deplaned Continuous Yes Table 2 After some initial analysis as finding the Means and SD as shown in Figure 1, I have decided to remove outbound_carrier_cnt from the analysis as it is almost similar to inbound_carrier_cnt. Usually airline that has arrived at the airport, will depart too. Figure 1 Figure 2 As standard deviation is large on most of the continuous variables, I have decided to take log transformation on continuous variables and the in/outbound network counts and inbound carrier count. New logged transformed data is displayed in Figure 2 above. Initial observation for normal distribution is done by generating histograms. Generating scatter plot was not very helpful with large number of variables and not being able to visualize it clearly. Data exception from normality check:


4 Shazia Zaman MSDS 63712Section 401 Project 2: Data Reduction Page 4 of 9 First histograms for categorical variables as website_avail, transit_service, INTERCITY_SERVICE would not be applicable to normality as they have just two values. For modes_serving that I have not transformed to log data as it is not a continuous variable so its histogram doesn t apply. Data included in normality check:

5 Shazia Zaman MSDS 63712Section 401 Project 2: Data Reduction Page 5 of 9


6 Shazia Zaman MSDS 63712Section 401 Project 2: Data Reduction Page 6 of 9 As evident from histograms, most of the continuous variables are normally distributed as log transformed, some are skewed, and less has exceptions as not being normally distributed. Analysis: I have decided to first try PCA to see if I can eliminate more variables before running canonical correlation analysis CCA. As PCA can take one response variable, I have perform PCA for both response variables lpassengers_enplaned and lpassengers_deplaned separately. As discussed in the class about PCA with categorical variables, I have removed categorical variable website_avail, transit_service, INTERCITY_SERVICE from PCA analysis. As data is already been adjusted using log transformed, I have used covariance option with PCA analysis using SAS procedure princomp. First Performed analysis for lpassenger_enplanded, and it shows that two PC should be enough to get over 90% variance covered. PC1: It seems to be correlated on most of the variables: Prin1 lcarrier_delay lpassengers_enplaned loutbound_capacity linbound_capacity ldep_del lnas_delay lweather_delay larr_del llate_aircraft_delay ldepartures_scheduled ldepartures_performed larrivals_scheduled larrivals_performed lcancelled modes_serving is not very correlated, I will leave it out from analysis going forward. It is shown that most of the variables as correlated in PC1 (Prin1). AS

7 Shazia Zaman MSDS 63712Section 401 Project 2: Data Reduction Page 7 of 9 For PC2 (Prin2), flight cancellation and weather delays seems to be much correlation and it is evident historically. Prin1 Prin2 lcancelled lweather_delay From PCA for passenger_deplanded, again two PC are enough to get more than 90% of variance covered. Prin1 lcarrier_delay lpassengers_deplaned loutbound_capacity linbound_capacity ldep_del lnas_delay lweather_delay larr_del llate_aircraft_delay ldepartures_scheduled ldepartures_performed larrivals_scheduled larrivals_performed lcancelled from further analysis. Again it is evident that most of the variables are correlated in PC1 (Prin1) for response variable of lpassenger_deplanded. For PC2 (Prin2), seems like three variables are correlated mostly as shown below: Prin1 Prin2 lpassengers_deplaned loutbound_capacity linbound_capacity From the separate PCA for both response variable, it is evident that carrier count and both inbound and outbound network count is not very correlated. Fare is not very correlated either. So moving forward I will drop linbound_carrier_cnt, linbound_network_count, loutbound_network_cnt and lfare As we have multiple response variables, and still large number of explanatory variables, I have decide to perform Cannonical Component analysis. MANOVA cannot be applied here as the explanatory variables are correlated. I have large number of sample as CCA is suggested with medium size sample as 50 to 100. To limit the sample size, I have selected data for some of the busy airports as following: DFW (Dallas Fort Worth), ATL (Atlanta), ORD (Chicago), LAX (Los Angeles), JFK (New York) The sample size now is about 105 that is acceptable for CCA. I have processed the CCA using SAS procedure cancorr. Hypothesis: Test of H0: The canonical correlations in the current row and all that follow are zero


8 Shazia Zaman MSDS 63712Section 401 Project 2: Data Reduction Page 8 of 9 From the output from SAS as shown above, it is evident that one variate is good enough to explain the variability in the model. First canonical variate in the result is explaining about 99.4% of variability in the model. First variate is also supported by having very Eigenvalue. Also from the hypothesis test, it is again evident that first canonical variate is significant with p-value < On the other hand second variate is not significant with p-value of I will only consider the variate V1 and W1 as response variate and explanatory variate following from the hypothesis test. As discussed in the class lectures, only loading > 0.4 should be considered. So I have highlighted in yellow the explanatory variables that are mostly defining the response variable. From response variables, V1, lpassengers_deplaned is selected as > 0.4 that is passengers arriving at the airport by incoming flights. I have also circled the canonical variate W1 for IARR_DEL15 as it should be included in the model as it defines passengers arriving at the airport. I still think that IDEP_DEL15 and ICANCELLED as flights delayed to depart > 15 minutes and flights being cancelled should be included in the model. However, as I are looking from the airport perspective and flight might be more of the planning controlled by airlines and not by airport.

9 Shazia Zaman MSDS 63712Section 401 Project 2: Data Reduction Page 9 of 9 Flights scheduled to arrive and depart is the coordination between airport and airlines. Thus it make more sense to add it to the model. loutbound_capacity and linbound_capacity are representing the log value of total seat capacity for flights coming in and going out of the airport. As seats are based on flight aircraft being big or small with more seats, it is partially related to airport as how many big and small aircafts can be handled at the airport. From the correlation between response variables and variates, departure delay and arrival delays seems more correlated to response along with delays related to carrier operations. It does seems logical as more passengers are being handled, it might be possible to get delayed for various reasons; however it should be already in the flight plan. Conclusion: I have analyzed the dataset for on-time performance in regards to airport and airline operations, average fares summary and other intercity and transit services for the airport. Provided given data, it is evident that passenger traffic for in/out of the airport is highly based on planning of flight schedules vs. actual flight operations performed as arrival/departure. Plus it is also based on total seat capacity that will refer back to what kind of aircraft being used by airlines, as bigger aircraft has more seats available as compare to smaller aircraft. It is a question if airport is capable of handling small or big aircrafts. I would also include that flight arrival/departure delays are also correlated, however the impact of current on-time performance may affect future travelers in order to choose airports as origin and destination for next travel. References: Data: Time%20Performance%20Data&DB_Short_Name=On-Time Database to hold data and reformat for analysis: MySql Database plus references operations on tables. Class Lectures MSDS 6372
Big Data Processing using Parallelism Techniques Shazia Zaman MSDS 7333 Quantifying the World, 4/20/2017
 Big Data Processing using Parallelism Techniques Shazia Zaman MSDS 7333 Quantifying the World, 4/20/2017 ABSTRACT In order to process and analyze Big Data, different techniques have been introduced to
Predicting Flight Delays Using Data Mining Techniques
 Todd Keech CSC 600 Project Report Background Predicting Flight Delays Using Data Mining Techniques According to the FAA, air carriers operating in the US in 2012 carried 837.2 million passengers and the
Temporal Deviations from Flight Plans:
 Temporal Deviations from Flight Plans: New Perspectives on En Route and Terminal Airspace Professor Tom Willemain Dr. Natasha Yakovchuk Department of Decision Sciences & Engineering Systems Rensselaer
Managing And Understand The Impact Of Of The Air Air Traffic System: United Airline s Perspective
 Managing And Understand The Impact Of Of The Air Air Traffic System: United Airline s Perspective NEXTOR NEXTOR Moving Moving Metrics: Metrics: A Performance-Oriented View View of of the the Aviation Aviation
Evaluation of Predictability as a Performance Measure
 Evaluation of Predictability as a Performance Measure Presented by: Mark Hansen, UC Berkeley Global Challenges Workshop February 12, 2015 With Assistance From: John Gulding, FAA Lu Hao, Lei Kang, Yi Liu,
Directional Price Discrimination. in the U.S. Airline Industry
 Evidence of in the U.S. Airline Industry University of California, Irvine aluttman@uci.edu June 21st, 2017 Summary First paper to explore possible determinants that may factor into an airline s decision
Frequent Fliers Rank New York - Los Angeles as the Top Market for Reward Travel in the United States
 Issued: April 4, 2007 Contact: Jay Sorensen, 414-961-1939 IdeaWorksCompany.com Frequent Fliers Rank New York - Los Angeles as the Top Market for Reward Travel in the United States IdeaWorks releases report
LCCs: in it for the long-haul?
 October 217 ANALYSIS LCCs: in it for the long-haul? Exploring the current state of long-haul low-cost (LHLC) using schedules, fleet and flight status data Data is powerful on its own, but even more powerful
Modeling Airline Fares
 Modeling Airline Fares Evidence from the U.S. Domestic Airline Sector Domingo Acedo Gomez Arturs Lukjanovics Joris van den Berg 31 January 2014 Motivation and Main Findings Which Factors Influence Fares?
Abstract. Introduction
 COMPARISON OF EFFICIENCY OF SLOT ALLOCATION BY CONGESTION PRICING AND RATION BY SCHEDULE Saba Neyshaboury,Vivek Kumar, Lance Sherry, Karla Hoffman Center for Air Transportation Systems Research (CATSR)
IAB / AIC Joint Meeting, November 4, Douglas Fearing Vikrant Vaze
 Passenger Delay Impacts of Airline Schedules and Operations IAB / AIC Joint Meeting, November 4, 2010 Cynthia Barnhart (cbarnhart@mit edu) Cynthia Barnhart (cbarnhart@mit.edu) Douglas Fearing (dfearing@hbs.edu
Gulf Carrier Profitability on U.S. Routes
 GRA, Incorporated Economic Counsel to the Transportation Industry Gulf Carrier Profitability on U.S. Routes November 11, 2015 Prepared for: Wilmer Hale Prepared by: GRA, Incorporated 115 West Avenue Suite
November 2013 Passenger and Cargo Traffic Statistics Reno-Tahoe International Airport
 November 2013 Passenger and Cargo Traffic Statistics Reno-Tahoe International Airport December 26, 2013 U.S. DOMESTIC INDUSTRY OVERVIEW FOR NOVEMBER 2013 All RNO Carriers Domestic Systemwide year over
Ticketing and Booking Data
 Ticketing and Booking Data Jim Ogden January 9, 2018 Agenda The booking and ticketing process What s available in the booking and ticketing data How to use booking and ticketing data? Summary The booking
MIT ICAT. Price Competition in the Top US Domestic Markets: Revenues and Yield Premium. Nikolas Pyrgiotis Dr P. Belobaba
 Price Competition in the Top US Domestic Markets: Revenues and Yield Premium Nikolas Pyrgiotis Dr P. Belobaba Objectives Perform an analysis of US Domestic markets from years 2000 to 2006 in order to:
Air Transport Indicators
 Air Transport Indicators Brown Bag Lunch Presentation and Discussion 1. February 2006 Heinrich C. Bofinger and Peter Roberts Why Are Measures and Indicators For Air Transport Needed? To gain understanding
Measuring Airline Networks
 Measuring Airline Networks Chantal Roucolle (ENAC-DEVI) Joint work with Miguel Urdanoz (TBS) and Tatiana Seregina (ENAC-TBS) This research was possible thanks to the financial support of the Regional Council
Projections of regional air passenger flows in New Zealand, by Tim Hazledine Professor of Economics at the University of Auckland
 Projections of regional air passenger flows in New Zealand, 2018-2043 by Tim Hazledine Professor of Economics at the University of Auckland Presentation to Knowledge Hub Seminar at the Ministry of Transport,
Statistical Evaluation of Seasonal Effects to Income, Sales and Work- Ocupation of Farmers, the Apples Case in Prizren and Korça Regions
 Abstract Statistical Evaluation of Seasonal Effects to Income, Sales and Work- Ocupation of Farmers, the Apples Case in Prizren and Korça Regions PhD. Eriona Deda Faculty of Economics and Agribusiness,
Investigating the Effect of Flight Delays and Cancellations on Travel from Small Communities
 University of Massachusetts Amherst ScholarWorks@UMass Amherst Tourism Travel and Research Association: Advancing Tourism Research Globally 2015 ttra International Conference Investigating the Effect of
15:00 minutes of the scheduled arrival time. As a leader in aviation and air travel data insights, we are uniquely positioned to provide an
 FlightGlobal, incorporating FlightStats, On-time Performance Service Awards: A Long-time Partner Recognizing Industry Success ON-TIME PERFORMANCE 2018 WINNER SERVICE AWARDS As a leader in aviation and
Peer Performance Measurement February 2019 Prepared by the Division of Planning & Market Development
 2017 Regional Peer Review Peer Performance Measurement February 2019 Prepared by the Division of Planning & Market Development CONTENTS EXECUTIVE SUMMARY... 3 SNAPSHOT... 5 PEER SELECTION... 6 NOTES/METHODOLOGY...
TravelWise Travel wisely. Travel safely.
 TravelWise Travel wisely. Travel safely. The (CATSR), at George Mason University (GMU), conducts analysis of the performance of the air transportation system for the DOT, FAA, NASA, airlines, and aviation
Measuring the Business of the NAS
 Measuring the Business of the NAS Presented at: Moving Metrics: A Performance Oriented View of the Aviation Infrastructure NEXTOR Conference Pacific Grove, CA Richard Golaszewski 115 West Avenue Jenkintown,
Smaller Hubs, Large Hubs and the Interdependencies. Prepared by: David Dague InterVISTAS Senior Vice President
 Smaller Hubs, Large Hubs and the Interdependencies Prepared by: David Dague InterVISTAS Senior Vice President JANUARY 26, 2017 Why should we care about large hub airports 90 million reasons why large hub
2017/ Q1 Performance Measures Report
 2017/2018 - Q1 Performance Measures Report Contents Ridership & Revenue... 1 Historical Revenue & Ridership... 1 Revenue Actual vs. Planned... 3 Mean Distance Between Failures... 5 Maintenance Cost Quarter
Incentives and Competition in the Airline Industry
 Preliminary and Incomplete Comments Welcome Incentives and Competition in the Airline Industry Rajesh K. Aggarwal D Amore-McKim School of Business Northeastern University Hayden Hall 413 Boston, MA 02115
ANALYSIS OF THE CONTRIUBTION OF FLIGHTPLAN ROUTE SELECTION ON ENROUTE DELAYS USING RAMS
 ANALYSIS OF THE CONTRIUBTION OF FLIGHTPLAN ROUTE SELECTION ON ENROUTE DELAYS USING RAMS Akshay Belle, Lance Sherry, Ph.D, Center for Air Transportation Systems Research, Fairfax, VA Abstract The absence
Unit Activity Answer Sheet
 Probability and Statistics Unit Activity Answer Sheet Unit: Applying Probability The Lesson Activities will help you meet these educational goals: Mathematical Practices You will make sense of problems
Sioux Falls Regional Airport Sioux Falls, SD
 Sioux Falls Regional Airport Sioux Falls, SD Volume 16-4 T1 Data Through April 216 July 216 Sioux Falls Onboard Ticker YE Apr 16 YoY Apr-16 YoY Passengers 989,223 -.4% 79,34 1.8% Airport Traffic Monthly
2017/2018 Q3 Performance Measures Report. Revised March 22, 2018 Average Daily Boardings Comparison Chart, Page 11 Q3 Boardings figures revised
 2017/2018 Q3 Performance Measures Report Revised March 22, 2018 Average Daily Boardings Comparison Chart, Page 11 Q3 Boardings figures revised Contents Ridership & Revenue... 1 Historical Revenue & Ridership...
Demand, Load and Spill Analysis Dr. Peter Belobaba
 Demand, Load and Spill Analysis Dr. Peter Belobaba Istanbul Technical University Air Transportation Management M.Sc. Program Network, Fleet and Schedule Strategic Planning Module 13 : 12 March 2014 Lecture
Corporate Productivity Case Study
 BOMBARDIER BUSINESS AIRCRAFT Corporate Productivity Case Study April 2009 Marketing Executive Summary» In today's environment it is critical to have the right tools to demonstrate the contribution of business
Table of Contents PAGE
 DECEMBER 2018 EL PASO INTERNATIONAL AIRPORT MONTHLY ACTIVITY REPORT December 2018 Table of Contents PAGE AIRPORT ACTIVITY OVERVIEW 1 NONSTOP DESTINATION ANALYSIS 2 MAP OF NONSTOP DESTINATIONS 3 FLIGHT
Table of Contents PAGE
 NOVEMBER 2018 EL PASO INTERNATIONAL AIRPORT MONTHLY ACTIVITY REPORT November 2018 Table of Contents PAGE AIRPORT ACTIVITY OVERVIEW 1 NONSTOP DESTINATION ANALYSIS 2 MAP OF NONSTOP DESTINATIONS 3 FLIGHT
Table of Contents PAGE
 OCTOBER 2018 EL PASO INTERNATIONAL AIRPORT MONTHLY ACTIVITY REPORT October 2018 Table of Contents PAGE AIRPORT ACTIVITY OVERVIEW 1 NONSTOP DESTINATION ANALYSIS 2 MAP OF NONSTOP DESTINATIONS 3 FLIGHT SCHEDULE
Department of Transportation, Federal Aviation Administration (FAA). SUMMARY: Under this notice, the FAA announces the submission deadline of
. SUMMARY: Under this notice, the FAA announces the submission deadline of") This document is scheduled to be published in the Federal Register on 10/02/2017 and available online at https://federalregister.gov/d/2017-21045, and on FDsys.gov [4910-13] DEPARTMENT OF TRANSPORTATION
This document is scheduled to be published in the Federal Register on 10/02/2017 and available online at https://federalregister.gov/d/2017-21045, and on FDsys.gov [4910-13] DEPARTMENT OF TRANSPORTATION
AUGUST 2008 MONTHLY PASSENGER AND CARGO STATISTICS
 Inter-Office Memo Reno-Tahoe Airport Authority Date: October 2, 2008 To: Statistics Recipients From: Tom Medland, Director Air Service Business Development Subject: RENO-TAHOE INTERNATIONAL AIRPORT PASSENGER
Inter-Office Memo Reno-Tahoe Airport Authority
 Inter-Office Memo Reno-Tahoe Airport Authority Date: November 30, 2009 To: Statistics Recipients From: Krys T. Bart, A.A.E., President/CEO Subject: RENO-TAHOE INTERNATIONAL AIRPORT PASSENGER STATISTICS
Aviation Insights No. 8
 Aviation Insights Explaining the modern airline industry from an independent, objective perspective No. 8 January 17, 2018 Question: How do taxes and fees change if air traffic control is privatized? Congress
Evaluation of Quality of Service in airport Terminals
 Evaluation of Quality of Service in airport Terminals Sofia Kalakou AIRDEV Seminar Lisbon, Instituto Superior Tecnico 20th of October 2011 1 Outline Motivation Objectives Components of airport passenger
Dynamic and Flexible Airline Schedule Design
 Dynamic and Flexible Airline Schedule Design Cynthia Barnhart Hai Jiang Global Airline Industry Program October 26, 2006 De-banked (or De-peaked) Hubs Depature/arrival activities # of departures/arrivals
The Effects of Schedule Unreliability on Departure Time Choice
 The Effects of Schedule Unreliability on Departure Time Choice NEXTOR Research Symposium Federal Aviation Administration Headquarters Presented by: Kevin Neels and Nathan Barczi January 15, 2010 Copyright
An Automated Airspace Concept for the Next Generation Air Traffic Control System
 An Automated Airspace Concept for the Next Generation Air Traffic Control System Todd Farley, David McNally, Heinz Erzberger, Russ Paielli SAE Aerospace Control & Guidance Committee Meeting Boulder, Colorado
Sitting on the Runway: Current Aircraft Taxi Times Now Exceed Pre-9/11 Experience
 U.S. Department of Transportation Research and Innovative Technology Administration SR-8 Bureau of Transportation Statistics Special Report May 8 Sitting on the Runway: Current Aircraft Taxi Times Now
Young Researchers Seminar 2009
 Young Researchers Seminar 2009 Torino, Italy, 3 to 5 June 2009 Hubs versus Airport Dominance (joint with Vivek Pai) Background Airport dominance effect has been documented on the US market Airline with
Aviation Trends. Quarter Contents
 Aviation Trends Quarter 1 2013 Contents Introduction 2 1 Historical overview of traffic 3 a Terminal passengers b Commercial flights c Cargo tonnage 2 Terminal passengers at UK airports 7 3 Passenger flights
Fuel Burn Impacts of Taxi-out Delay and their Implications for Gate-hold Benefits
 Fuel Burn Impacts of Taxi-out Delay and their Implications for Gate-hold Benefits Megan S. Ryerson, Ph.D. Assistant Professor Department of City and Regional Planning Department of Electrical and Systems
Impact of Advance Purchase and Length-of-Stay on Average Ticket Prices in Top Business Destinations
 Impact of Advance Purchase and Length-of-Stay on Average Ticket Prices in Top Business Destinations Research Summary Average ticket prices continue to trend downward in 2016, but since 2014 there have
Table of Contents PAGE
 April 2015 EL PASO INTERNATIONAL AIRPORT MONTHLY ACTIVITY REPORT April 2015 Table of Contents PAGE AIRPORT ACTIVITY OVERVIEW 1 NONSTOP DESTINATION ANALYSIS 2 MAP OF NONSTOP DESTINATIONS 3 FLIGHT SCHEDULE
Estimates of the Economic Importance of Tourism
 Estimates of the Economic Importance of Tourism 2008-2013 Coverage: UK Date: 03 December 2014 Geographical Area: UK Theme: People and Places Theme: Economy Theme: Travel and Transport Key Points This article
Dallas/Fort Worth International Airport Development Opportunities Southgate Plaza
 Dallas/Fort Worth International Airport Development Opportunities Southgate Plaza City of Dallas Economic Development Committee Briefing March 2, 2009 Business Overview Business Overview DFW s contribution
Airline Network Structures Dr. Peter Belobaba
 Airline Network Structures Dr. Peter Belobaba Istanbul Technical University Air Transportation Management M.Sc. Program Network, Fleet and Schedule Strategic Planning Module 8: 11 March 2014 Lecture Outline
Reno-Tahoe Airport Authority U.S. DOMESTIC INDUSTRY OVERVIEW FOR FEBRUARY
 Inter-Office Memo Reno-Tahoe Airport Authority Date: March 30, 2009 To: Statistics Recipients From: Krys T. Bart, A.A.E., President/CEO Subject: RENO-TAHOE INTERNATIONAL AIRPORT PASSENGER STATISTICS U.S.
Online Appendix to Quality Disclosure Programs and Internal Organizational Practices: Evidence from Airline Flight Delays
 Online Appendix to Quality Disclosure Programs and Internal Organizational Practices: Evidence from Airline Flight Delays By SILKE J. FORBES, MARA LEDERMAN AND TREVOR TOMBE Appendix A: Identifying Reporting
Megahubs United States Index 2018
 Published: Sep 2018 Megahubs United States Index 2018 The Most Connected Airports in the US 2018 OAG Aviation Worldwide Limited. All rights reserved About OAG Megahubs US Index 2018 Published alongside
Table of Contents PAGE
 FEBRUARY 2018 EL PASO INTERNATIONAL AIRPORT MONTHLY ACTIVITY REPORT February 2018 Table of Contents PAGE AIRPORT ACTIVITY OVERVIEW 1 NONSTOP DESTINATION ANALYSIS 2 MAP OF NONSTOP DESTINATIONS 3 FLIGHT
The Effects of Porter Airlines Expansion
 The Effects of Porter Airlines Expansion Ambarish Chandra Mara Lederman March 11, 2014 Abstract In 2007 Porter Airlines entered the Canadian airline industry and since then it has rapidly increased its
Activity Template. Drexel-SDP GK-12 ACTIVITY. Subject Area(s): Sound Associated Unit: Associated Lesson: None
: Sound Associated Unit: Associated Lesson: None") Activity Template Subject Area(s): Sound Associated Unit: Associated Lesson: None Drexel-SDP GK-12 ACTIVITY Activity Title: What is the quickest way to my destination? Grade Level: 8 (7-9) Activity Dependency:
Activity Template Subject Area(s): Sound Associated Unit: Associated Lesson: None Drexel-SDP GK-12 ACTIVITY Activity Title: What is the quickest way to my destination? Grade Level: 8 (7-9) Activity Dependency:
Aviation Trends. Quarter Contents
 Aviation Trends Quarter 2 217 Contents Introduction... 2 1. Historical overview of traffic... 3 a. Terminal passengers... 4 b. Commercial flights... 5 c. Cargo tonnage... 6 2. Terminal passengers at UK
Aviation Trends. Quarter Contents
 Aviation Trends Quarter 3 217 Contents Introduction... 2 1. Historical overview of traffic... 3 a. Terminal passengers... 4 b. Commercial flights... 5 c. Cargo tonnage... 6 2. Terminal passengers at UK
MIT ICAT. Fares and Competition in US Markets: Changes in Fares and Demand Since Peter Belobaba Celian Geslin Nikolaos Pyrgiotis
 Fares and Competition in US Markets: Changes in Fares and Demand Since 2000 Peter Belobaba Celian Geslin Nikolaos Pyrgiotis Objectives & Approach Objectives Track fare and traffic changes in US domestic
Airport Profile Pensacola International
 Airport Profile Pensacola International 2015 BY THE NUMBERS Enplanements 808,170 Airport Pensacola International Airport (PNS) is located approximately three nautical miles northeast of the central business
System Oriented Runway Management: A Research Update
 National Aeronautics and Space Administration System Oriented Runway Management: A Research Update Gary W. Lohr gary.lohr@nasa.gov Senior Research Engineer NASA-Langley Research Center ATM 2011 Ninth USA/EUROPE
LAX SPECIFIC PLAN AVIATION ACTIVITY ANALYSIS REPORT CY 2014
 LAX SPECIFIC PLAN AVIATION ACTIVITY ANALYSIS REPORT CY 2014 Prepared April 2015 Page 1 Los Angeles International Airport Specific Plan LAX Specific Plan Compliance Review Aviation Activity Analysis January
Have Descents Really Become More Efficient? Presented by: Dan Howell and Rob Dean Date: 6/29/2017
 Have Descents Really Become More Efficient? Presented by: Dan Howell and Rob Dean Date: 6/29/2017 Outline Introduction Airport Initiative Categories Methodology Results Comparison with NextGen Performance
November 8, Chico Municipal Airport Industry Overview and Catchment Area Discussion
 November 8, 2017 Chico Municipal Airport Industry Overview and Catchment Area Discussion Agenda Regional industry discussion Chico performance review Chico catchment area study results Summary / conclusions
General Aviation Economic Footprint Measurement
 General Aviation Economic Footprint Measurement Round Table Discussions ATAC, Ottawa Thursday, March 1 st, 2007 Presentation Outline Electronic Collection of Air Transportation Statistics (ECATS) at Transport
Discriminate Analysis of Synthetic Vision System Equivalent Safety Metric 4 (SVS-ESM-4)
") Discriminate Analysis of Synthetic Vision System Equivalent Safety Metric 4 (SVS-ESM-4) Cicely J. Daye Morgan State University Louis Glaab Aviation Safety and Security, SVS GA Discriminate Analysis of
Discriminate Analysis of Synthetic Vision System Equivalent Safety Metric 4 (SVS-ESM-4) Cicely J. Daye Morgan State University Louis Glaab Aviation Safety and Security, SVS GA Discriminate Analysis of
Building adaptation in the Melbourne CBD: The relationship between adaptation and building characteristics.
 Building adaptation in the Melbourne CBD: The relationship between adaptation and building characteristics. Sara J Wilkinson, Dr Kimberley James and Prof Richard Reed Deakin University - Melbourne Overview
Predictability in Air Traffic Management
 Predictability in Air Traffic Management Mark Hansen, Yi Liu, Lu Hao, Lei Kang, UC Berkeley Mike Ball, Dave Lovell, U MD Bo Zou, U IL Chicago Megan Ryerson, U Penn FAA NEXTOR Symposium 5/28/15 1 Outline
A stated preference survey for airport choice modeling.
 XI Riunione Scientifica Annuale -!Società Italiana di Economia dei Trasporti e della Logistica Trasporti, logistica e reti di imprese: competitività del sistema e ricadute sui territori locali, Trieste,
SERVICE NETWORK DESIGN: APPLICATIONS IN TRANSPORTATION AND LOGISTICS
 SERVICE NETWORK DESIGN: APPLICATIONS IN TRANSPORTATION AND LOGISTICS Professor Cynthia Barnhart Massachusetts Institute of Technology Cambridge, Massachusetts USA March 21, 2007 Outline Service network
3 Aviation Demand Forecast
 3 Aviation Demand 17 s of aviation demand were prepared in support of the Master Plan for Harrisburg International Airport (the Airport or HIA), including forecasts of enplaned passengers, air cargo, based
The Big 4 Airline Era, New Ultra Low Cost Carriers, and Implications for Airports
 The Big 4 Airline Era, New Ultra Low Cost Carriers, and Implications for Airports Linda Perry, Director AAAE Rates and Charges Workshop November 4, 2016 Outline The Big 4 American Delta Southwest United
Modelling Airline Network Routing and Scheduling under Airport Capacity Constraints
 Modelling Airline Network Routing and Scheduling under Airport Capacity Constraints Antony D. Evans Andreas Schäfer Lynnette Dray 8 th AIAA Aviation Technology, Integration, and Operations Conference /
REPORT 2014/065 INTERNAL AUDIT DIVISION. Audit of air operations in the United. Nations Assistance Mission in Afghanistan
 INTERNAL AUDIT DIVISION REPORT 2014/065 Audit of air operations in the United Nations Assistance Mission in Afghanistan Overall results relating to the effective management of air operations in the United
September 2013 Passenger and Cargo Traffic Statistics Reno-Tahoe International Airport
 September 2013 Passenger and Cargo Traffic Statistics Reno-Tahoe International Airport October 31, 2013 U.S. DOMESTIC INDUSTRY OVERVIEW FOR SEPTEMBER 2013 All RNO Carriers Systemwide year over year comparison
Description of the National Airspace System
 Description of the National Airspace System Dr. Antonio Trani and Julio Roa Department of Civil and Environmental Engineering Virginia Tech What is the National Airspace System (NAS)? A very complex system
Passenger and Cargo Statistics Report
 Passenger and Cargo Statistics Report RenoTahoe International Airport November 2017 U.S. DOMESTIC INDUSTRY OVERVIEW FOR NOVEMBER 2017 Systemwide RNO Carriers Domestic Flights year over year comparison
Fundamentals of Airline Markets and Demand Dr. Peter Belobaba
 Fundamentals of Airline Markets and Demand Dr. Peter Belobaba Istanbul Technical University Air Transportation Management M.Sc. Program Network, Fleet and Schedule Strategic Planning Module 10: 30 March
Aviation Trends Quarter
 Aviation Trends Quarter 4 214 Contents Introduction... 2 1. Historical overview of traffic see note 5 on p.15... 3 a. Terminal passengers... 4 b. Commercial flights... 5 c. Cargo tonnage... 6 2. Terminal
Fewer air traffic delays in the summer of 2001
 June 21, 22 Fewer air traffic delays in the summer of 21 by Ken Lamon The MITRE Corporation Center for Advanced Aviation System Development T he FAA worries a lot about summer. Not only is summer the time
Airport Characteristics: Part 2 Prof. Amedeo Odoni
 Airport Characteristics: Part 2 Prof. Amedeo Odoni Istanbul Technical University Air Transportation Management M.Sc. Program Air Transportation Systems and Infrastructure Module 4 May 25, 2015 Outline
Managing Winter Operations An Airline Perspective
 Managing Winter Operations An Airline Perspective May 18 TH 2017 Eric M. Silverman Manager ATC/Airfield Operations: NE Region: Airline Overview/Make-Up: American offers an average of nearly 6,700 flights
U.S. DOMESTIC INDUSTRY OVERVIEW FOR OCTOBER 2010 All RNO Carriers Systemwide year over year comparison
 Inter-Office Memo Reno-Tahoe Airport Authority Date: November 22, 2010 To: Chairman and Board of Trustees From: Krys T. Bart, A.A.E., President/CEO Subject: RENO-TAHOE INTERNATIONAL AIRPORT OCTOBER 2010
March 2014 Passenger and Cargo Traffic Statistics Reno-Tahoe International Airport
 March 2014 Passenger and Cargo Traffic Statistics Reno-Tahoe International Airport April 25, 2014 U.S. DOMESTIC INDUSTRY OVERVIEW FOR MARCH 2014 All RNO Carriers Domestic Systemwide year over year comparison
Chico Municipal Airport. Catchment Area Analysis Results
 Chico Municipal Airport Catchment Area Analysis Results Table of Contents Chico market overview 4 Comparative market analysis 9 Regional airport discussion 14 CIC catchment area results 19 2 Executive
3. Aviation Activity Forecasts
 3. Aviation Activity Forecasts This section presents forecasts of aviation activity for the Airport through 2029. Forecasts were developed for enplaned passengers, air carrier and regional/commuter airline
Airport Incentive Programs: Legal and Regulatory Considerations in Structuring Programs and Recent Survey Observations
 Airport Incentive Programs: Legal and Regulatory Considerations in Structuring Programs and Recent Survey Observations 2010 ACI-NA AIRPORT ECONOMICS & FINANCE CONFERENCE Monica R. Hargrove ACI-NA General
CONTACT: Investor Relations Corporate Communications
 NEWS RELEASE CONTACT: Investor Relations Corporate Communications 435.634.3200 435.634.3553 Investor.relations@skywest.com corporate.communications@skywest.com SkyWest, Inc. Announces Second Quarter 2016
Japan Airlines and American Airlines Joint Business Benefits from April 1, January 11, 2011
 Japan Airlines and American Airlines Joint Business Benefits from April 1, 2011 January 11, 2011 October 25, 2010: Signing of Japan-USA Open Skies Agreement Antitrust immunity was granted to airlines operating
OAG s Top 25 US underserved routes. connecting the world of travel
 OAG s Top 25 US underserved routes connecting the world of travel Underserved Uncovered: OAG s Top 50 underserved international routes Contents About OAG s underserved uncovered 3 About the data 3 OAG
CANSO Workshop on Operational Performance. LATCAR, 2016 John Gulding Manager, ATO Performance Analysis Federal Aviation Administration
 CANSO Workshop on Operational Performance LATCAR, 2016 John Gulding Manager, ATO Performance Analysis Federal Aviation Administration Workshop Contents CANSO Guidance on Key Performance Indicators Software
RENO-TAHOE INTERNATIONAL AIRPORT APRIL 2008 PASSENGER STATISTICS
 Inter-Office Memo Reno-Tahoe Airport Authority Date: June 5, 2008 To: Statistics Recipients From: Tom Medland, Director Air Service Business Development Subject: RENO-TAHOE INTERNATIONAL AIRPORT PASSENGER
CONTACT: Investor Relations Corporate Communications
 NEWS RELEASE CONTACT: Investor Relations Corporate Communications 435.634.3200 435.634.3553 Investor.relations@skywest.com corporate.communications@skywest.com SkyWest, Inc. Announces Second Quarter 2017
Recommendations for Northbound Aircraft Departure Concerns over South Minneapolis
 Recommendations for Northbound Aircraft Departure Concerns over South Minneapolis March 21, 2012 Noise Oversight Committee Agenda Item #4 Minneapolis Council Member John Quincy Background Summer of 2011
The Effectiveness of JetBlue if Allowed to Manage More of its Resources
 McNair Scholars Research Journal Volume 2 Article 4 2015 The Effectiveness of JetBlue if Allowed to Manage More of its Resources Jerre F. Johnson Embry Riddle Aeronautical University, johnsff9@my.erau.edu
Measure 67: Intermodality for people First page:
 Measure 67: Intermodality for people First page: Policy package: 5: Intermodal package Measure 69: Intermodality for people: the principle of subsidiarity notwithstanding, priority should be given in the
Airline network optimization. Lufthansa Consulting s approach
 Airline network optimization Lufthansa Consulting s approach A thorough market potential analysis lays the basis for Lufthansa Consulting s network optimization approach The understanding of the relevant