COCA CULTIVATION IN THE ANDEAN REGION
|
|
|
- Flora Allison
- 6 years ago
- Views:
Transcription


1 Government of Bolivia Government of Colombia Government of Peru COCA CULTIVATION IN THE ANDEAN REGION A survey of Bolivia, Colombia and Peru June 2008
2 UNODC's Illicit Crop Monitoring Programme (ICMP) promotes the development and maintenance of a global network of illicit crop monitoring systems in the context of the illicit crop elimination objective set by the United Nations General Assembly Special Session on Drugs. It provides overall coordination and direct technical support and supervision to UNODC supported annual illicit crop surveys at the country level. This reports presents the results of the annual coca cultivation surveys in Bolivia, Colombia, and Peru, which were conducted jointly by UNODC (ICMP) and the respective Governments. The Regional Overview chapter was compiled by ICMP experts in Vienna. The analysis provided takes into account additional data sources and does not necessarily reflect the views of the three Governments. Unless otherwise specified, all figures presented in this report come from the respective national Governments in the context of national monitoring systems supported by UNODC. The implementation of UNODC's Illicit Crop Monitoring Programme in the Andean region was made possible thanks to financial contributions from the Governments of Austria, Colombia, France, the United States of America, and from the European Commission. This report and other ICMP survey reports can be downloaded from: The boundaries, names and designations used in all maps in this document do not imply official endorsement or acceptance by the United Nations. This document has not been formally edited.
3 CONTENTS PART 1. REGIONAL OVERVIEW COCA CULTIVATION IN THE ANDEAN REGION POTENTIAL COCAINE PRODUCTION COCAINE SEIZURES AND CLANDESTINE LABORATORIES FARM-GATE PRICES OF COCA PRODUCTS FARM-GATE VALUE OF COCA CULTIVATION...22 PART 2. BOLIVIA COCA CULTIVATION SURVEY INTRODUCTION FINDINGS...30 Coca cultivation...31 Coca yield and production...40 Coca prices and trading...42 Coca cultivation in National Parks...51 Reported eradication...52 Reported seizures...53 PART 3. COLOMBIA COCA CULTIVATION SURVEY INTRODUCTION FINDINGS...64 Coca cultivation...64 Coca leaf, coca paste and cocaine base production...85 Coca prices...90 Supply reduction...96 PART 4. PERU COCA CULTIVATION SURVEY INTRODUCTION FINDINGS Coca cultivation Regional analysis Production of coca leaf and derivates Prices for coca leaf and derivates Reported eradication Reported seizures i
4
5 PREFACE The 2007 Andean coca survey shows a marked increase in coca cultivation. The total area of land under coca cultivation in Bolivia, Colombia and Peru in 2007 was 181,600 hectares, a 16% increase over 2006, and the highest level since 2001 (although well below figures from the 1990s). The increase was driven by a 27% rise in Colombia, and smaller increases of 5% and 4% respectively in Bolivia and Peru. Despite the increase in the amount of land being used to grow coca, the actual output in terms of production is almost unchanged from 2006 due to low yields. In 2007, global potential production of cocaine reached 994 metric tons, practically unchanged from the 984 mt recorded for While the world s supply of cocaine remains stable, there are notable shifts in demand which have a dramatic impact on drug trafficking. In response to growing demand for cocaine in Europe (and a strong Euro), drug traffickers are seeking low-risk routes. As a result, West Africa has unwittingly become a hub for cocaine trafficking. While criminals reap big profits, vulnerable countries of the region are paying a heavy price in terms of public health and public security. States in the Caribbean and Central America as well as the border regions of Mexico are caught in the cross-fire between the world's biggest producers and the world's biggest consumers of cocaine. This underlines the need for all countries of the world to assume a shared responsibility for drug control: to reduce demand for cocaine focused on health), to reduce the supply of coca (by promoting development), and by stopping the flow of drug trafficking (through security and justice). The combination of these three factors will increase the long-term effectiveness of drug control, and bring greater peace, security and prosperity to the Andean countries. Antonio Maria Costa Executive Director UNODC iii
6
7 Regional Overview PART 1. REGIONAL OVERVIEW 5
8 Regional Overview Back of divider Part 1 Regional Overview 6
9 Regional Overview FACT SHEET Andean Coca Surveys for Change on Global coca cultivation 156,900 ha +16% 181,600 ha Colombia 78,000 ha +27% 99,000 ha Peru 51,400 ha +4% 53,700 ha Bolivia 27,500 ha +5% 28,900 ha Ecuador < 100 ha n/a Global cocaine production 984 mt +1% 994 mt Colombia 610 mt -2% 600 mt Peru 280 mt +4% 290 mt Bolivia 94 mt +11% 104 mt Farm-gate value of coca cultivation US$ 1,159 million +24% US$ 1,440 million Colombia (coca products) US$ 683 million +37% US$ 934 million Peru (coca leaf) US$ 285 million +2% US$ 292 million Bolivia (coca leaf) US$ 180 million +19% US$ 214 million Farm-gate value of coca cultivation in % of GDP 2 Colombia 0.5% 0.5% Peru 0.4% 0.4% Bolivia 2.0% 2.4% Average wholesale price of cocaine* Colombia (in main cities) US$ 1,762/kg +25% US$ 2,198/kg Peru (in producing regions) US$ 825/kg +3% US$ 851/kg Bolivia (in main cities) US$ 1,870/kg +6% US$ 1,983/kg Ecuador US$ 4,000/kg 0% US$ 4,000/kg Reported eradication of coca bush* Colombia (aerial spraying) 172,026 ha -11% 153,134 ha (manual) 43,051 ha +55% 66,805 ha Peru (manual) 12,688 ha -5% 12,072 ha Bolivia (manual) 5,070 ha +24% 6,269 ha Ecuador (manual) 9 ha +278% 36 ha 3 Reported seizure of cocaine (base and HCl)* Colombia 177 mt -9% 161 mt Peru 20 mt -30% 14 mt Bolivia 14 mt +29% 18 mt Ecuador 34 mt -26% 25 mt * As reported by the respective Government. 1 For 2007, no survey was implemented in Ecuador. 2 GDP of the respective year as reported by Governments. 3 Source: INCSR
10
11
12
13
14
15 Regional Overview 1 COCA CULTIVATION IN THE ANDEAN REGION In 2007, the area under coca cultivation in Bolivia, Colombia and Peru amounted to 181,600 ha, 24,700 ha more than in This increase by 16% is mainly due to a significant increase in Colombia, and smaller increases in Peru and Bolivia. Despite these recent increases, the global area under coca cultivation continues to be lower than in the 1990s and 18% below the level recorded in 2000 (221,300 ha). Colombia represented 55% of the global area under coca bush, followed by Peru (30%) and Bolivia (16%). There is no indication of large-scale coca cultivation outside the three main coca growing countries. Low levels of coca cultivation were identified in Ecuador in An assessment of coca cultivation in the Venezuela-Colombia border area of the same year also indicated marginal levels of coca cultivation in Venezuela. Figure 1: Coca cultivation in the Andean region (ha), 1990 to , , ,000 Hectares 150, , ,000 75,000 50,000 25, Colombia Peru Bolivia Table 1: Coca cultivation in the Andean region (ha), 1997 to Change on 2006 Bolivia 45,800 38,000 21,800 14,600 19,900 21,600 23,600 27,700 25,400 27,500 28,900 +5% Peru 68,800 51,000 38,700 43,400 46,200 46,700 44,200 50,300 48,200 51,400 53,700 +4% Colombia 79, , , , , ,000 86,000 80,000 86,000 78,000 99, % Total 194, , , , , , , , , , , % Source: United States Department of State National Monitoring Systems supported by UNODC In 2007, coca cultivation in Colombia amounted to 99,000 ha, an increase of 27% over This was mainly due to an increase in the Pacific and Central regions, which were responsible for over three quarters of the total area increase. Pacific contained the largest area under coca cultivation in 2007 with 25,960 ha, followed by Putumayo-Caquetá, Central and Meta-Guaviare. Together, these four regions represented 89% of the total area under coca cultivation in Colombia. Putumayo- Caquetá, once the largest coca region, had seen a considerable decrease in area under cultivation between 2000 and However, coca cultivation has gradually increased to almost the 2002 level. Meta-Guaviare, the second largest coca region in 2001, ranked only forth in 2007, having 13
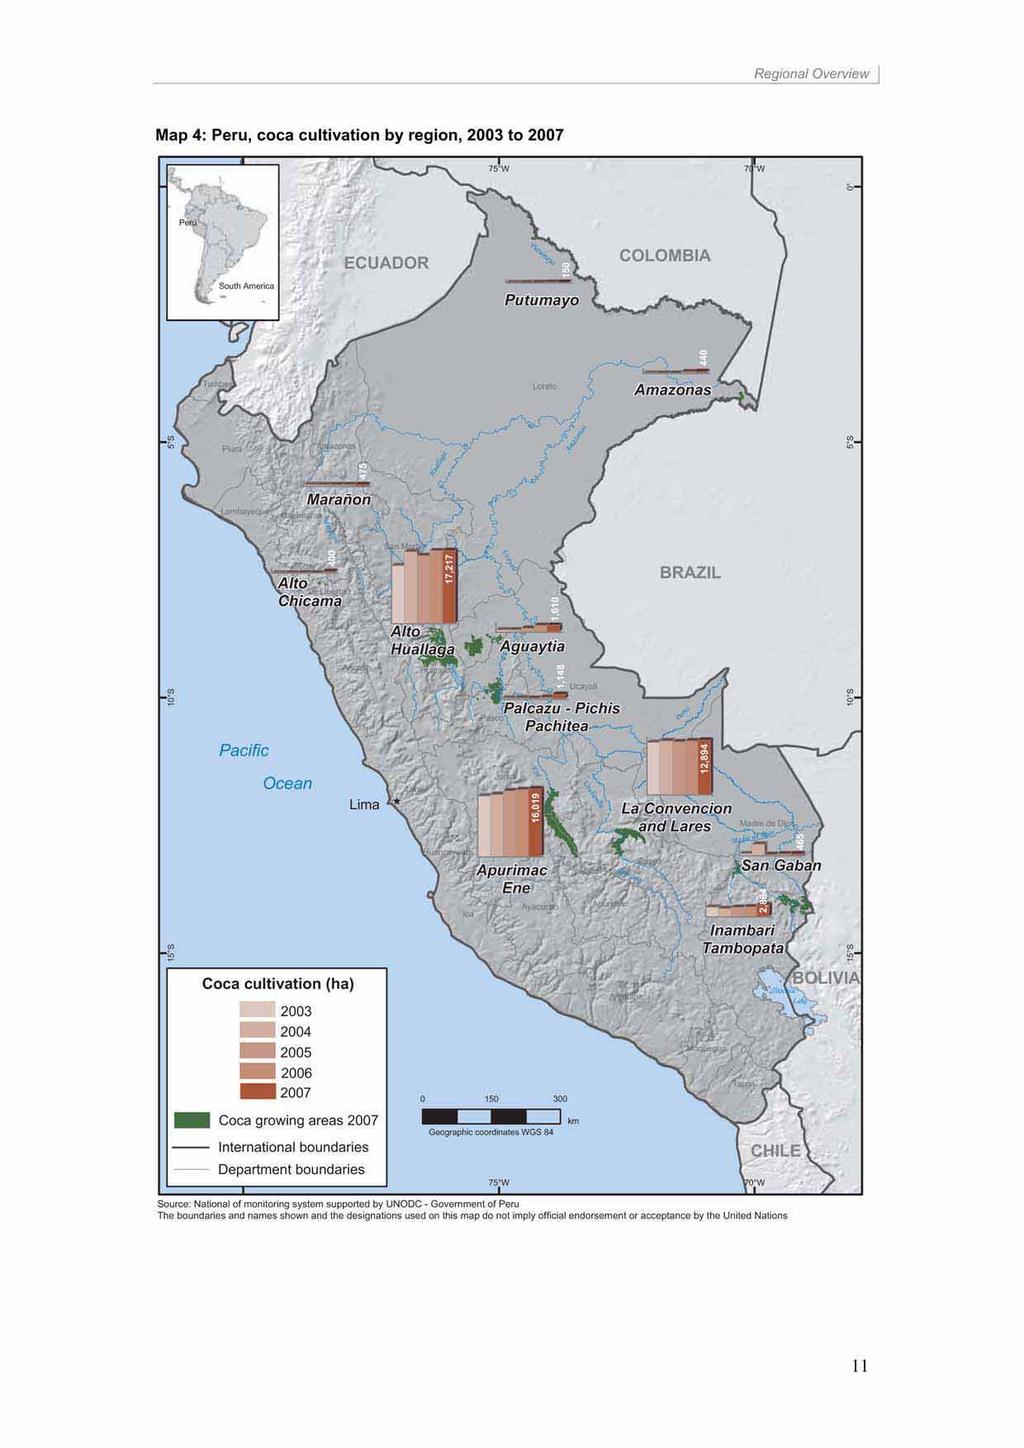
16 Regional Overview experienced its sixth year of decline. This, and other decreases in smaller cultivating regions, such as Amazonia and Sierra Nevada, could not offset increases in the larger regions. The Colombian authorities continued to intensify manual eradication efforts. In 2007, 66,805 ha were eradicated manually. In addition, the authorities maintained a high level of eradication by spraying (153,134 ha). Both manual eradication and spraying activities were concentrated in the departments of Antioquia (Central region), Nariño (Pacific region) and Putumayo. Figure 2: Coca cultivation in Colombia (ha), 1997 to , , ,000 Hectares 100,000 75,000 50,000 25, US Department of State National Monitoring System supported by UNODC In 2007, coca cultivation in Peru increased by 4% to 53,700 ha. Cultivation in the three largest coca regions, which together represented 86% of the total area under coca bush, remained relatively stable and increased only marginally (500 ha). In Alto Huallaga, the largest cultivating region, the expansion of coca in the southern areas was somewhat offset by the eradication of coca fields in the northern parts of the region. In 2007, most of the increase occurred in the smaller coca cultivating regions. These regions contributed 1,800 ha to the overall 2,300 ha increase. The coca area in Inambari-Tambopata, a region close to the border with Bolivia, increased by 21% or about 500 ha to 2,900 ha. This is the third consecutive increase in three years in Inambari-Tambopata. The small and partly new coca cultivation areas in the North and North East of the country increased moderately and continued to constitute only a small proportion of the overall coca cultivation area in the country. Eradication of coca bush, which in Peru is done manually, decreased slightly but remained at a relatively high level of over 12,000 ha. 14
17 Regional Overview Figure 3: Coca cultivation in Peru (ha), 1997 to ,000 70,000 60,000 50,000 Hectares 40,000 30,000 20,000 10, US Department of State National Monitoring System supported by UNODC In 2007, coca cultivation in Bolivia increased by 5% or 1,400 ha to 28,900 ha. The coca area used for non-traditional purposes increased by 9% over Overall, the area under coca cultivation in Bolivia remained much lower than in the early and mid 1990s. The area under coca bush increased in both main cultivation regions (Yungas of La Paz and Chapare) at about the same rate. As in 2006, 69% of the coca area was located in the Yungas of La Paz, 30% in Chapare, and only 1% in Apolo. The Government of Bolivia reported a 24% increase in eradication in 2007 (to 6,269 ha). This was higher than levels reached in 2005 (5,070 ha) and 2006 (6,073 ha). Ninety-five per cent of the eradication, which in Bolivia is done manually, was carried out in the Chapare region. Figure 4: Coca cultivation in Bolivia (ha), 1997 to ,000 40,000 Hectares 30,000 20,000 10, US Department of State National Monitoring System supported by UNODC 15
18 Regional Overview 2 POTENTIAL COCAINE PRODUCTION The global potential production of cocaine reached 994 mt in 2007, almost the same as in 2006 (984 mt), with levels amounting to 600 mt in Colombia, 290 mt in Peru and 104 mt in Bolivia. The slightly lower cocaine production in Colombia, where more coca was grown in lower yielding regions, was offset by increases in Peru and Bolivia. Due to improved cultivation techniques and coca leaf to cocaine conversion processes, global cocaine production is at a level similar to those of the late 1990s, although the area under coca cultivation is considerably smaller. In 2007, the potential production of cocaine HCl in Colombia remained roughly at the same level as in 2006 (610 mt), representing 60% of global production, despite the increase in area under coca cultivation. Several reasons contributed to this situation, among them the increase in cultivation in regions with under-average coca leaf yields, and the reduction in area under cultivation in high yielding regions such as Meta-Guaviare. In addition, new research revealed lower coca leaf yields in one of the main coca regions (Central), where the largest increase in cultivation occurred. The total cocaine production in Peru increased by 4% over While production reached its highest level since 1997 with 290 mt, it is still much lower than it had been during the first half of the 1990s. In 2007, Peru accounted for 29% of global cocaine production. In 2007, the potential cocaine production in Bolivia increased by 11% and amounted to 104 mt. The increase in cocaine production is almost similar to the increase in area under coca cultivation in areas where coca leaf production is not destined for traditional purposes. Figure 5: Global potential cocaine production (mt), 1990 to 2007 Metric tons 1,100 1, Bolivia Colombia Peru 16
19 Regional Overview Table 2: Global potential cocaine production (mt), 1997 to 2007* Change on 2006 Bolivia % Colombia % Peru % Total , % Source: UNODC World Drug Report 2008 and national monitoring systems supported by UNODC. * Production estimates for 2004 and 2005 in Bolivia and in Peru from 2003 to 2005 were revised based on updated information available in Colombian cocaine production estimates for 2004 and later are not directly comparable with previous years. 3 COCAINE SEIZURES AND CLANDESTINE LABORATORIES Global seizures of cocaine HCl and base decreased by 6% from 750 mt in 2005 to 706 mt in Overall, the amount seized declined in the Americas with the exception of Central America, and increased in other parts of the world, most noticeably in West and Central Europe, where large consumer markets exist, and in West and Central Africa. West and Central Africa seems to develop more and more into a break of bulk location for the trafficking of cocaine en route to Europe. In 2005, seizures in this region still trailed far behind the Caribbean, while in 2006, a much larger amount of cocaine was seized in West and Central Africa. The largest part of seizures continued to take place in South America, namely in Colombia. Colombia, where 61% of global cocaine was produced in 2006, accounted for 177 mt or 26% of global seizures in A large majority of cocaine seized in Colombia was cocaine HCl. In 2007, total cocaine seizures declined further to 161 mt. However, the amount of cocaine HCl seized in the country remained by and large unchanged at about 127 mt. Figure 6: Global cocaine seizures by region (mt equivalents and % of total), 2006* 0 50, , , , , , ,000 South America North America West & Central Europe Central America 317 (45%) 171 (24%) 121 (17%) 72 (10%) West and Central Africa Caribbean East and South-East Asia Southern Africa Oceania South Asia Southeast Europe North Africa Near and Middle East /South-West Asia East Europe East Africa 15 (2%) 8.6 (1%) Source: UNODC Annual Reports Questionnaires * Includes cocaine HCl, cocaine base, crack cocaine, and other cocaine types. Seizures as reported (street purity). In Peru, seizures declined from 22 mt of cocaine HCl and base in 2005 to 20 mt in 2006, about 3% of global seizures, and further to only 14 mt in 2007, despite the fact that over the same period 17
20 Regional Overview potential cocaine production in the country increased. However, it should be noted that 2005 and 2006 were years with exceptionally high seizures. The majority of the drugs seized in Peru was cocaine HCl. In Bolivia, the amount of cocaine HCl and base seized increased for the third consecutive year. In 2007, almost 18 mt of cocaine HCl and base were seized by the authorities. About one fifth of the total amount was cocaine HCl, a much higher proportion than in the past three years. Coca leaf seizures also increased significantly in 2007 and amounted to 1,730 mt of sun-dried coca leaves, 40 times the amount seized in The increase in seizure of coca leaf can be attributed to the strengthening of the Special Force for the Control of Coca Leaves (GECC) and tighter road controls. An increasing quantity of coca leaves traded in southern part of the country is smuggled to neighbouring Argentina. During 2007, the Argentinean police seized a significant amount of coca leaves (44 mt) and 3.3 mt of cocaine at the Bolivian border. In 2006, Governments reported over 6,390 clandestine coca processing laboratories worldwide, over 99% of which were located in Bolivia, Colombia and Peru. 4 The increase over the 5,901 laboratories destroyed in 2005 is mainly due to higher numbers reported by Bolivia and Colombia. Almost the complete conversion process from coca leaf to cocaine HCl seems to take place in the three coca cultivating countries, and there are very few reports of laboratories producing cocaine in other countries. 5 In 2006, Spain (10), the United States of America (4), Chile (2) and South Africa (1) reported the destruction of cocaine laboratories and the SAR Hong Kong reported the destruction of five crack laboratories. This indicates that a small amount of cocaine was produced in countries outside the coca cultivation region as well. Preliminary figures for 2007 indicate that the number of coca processing laboratories destroyed in Bolivia, Colombia and Peru remained at about the 2006 level. Table 3: Reported clandestine coca processing installations destroyed, 2007* Bolivia Colombia Peru Coca paste and/or cocaine base laboratories 4,081 2, Cocaine HCl laboratories All coca laboratories 4,087 2, Coca leaf maceration pits 6,526 n.a. 1,079 * As reported by Governments. 4 FARM-GATE PRICES OF COCA PRODUCTS Prices for coca and derivates in the illicit market do not necessarily react like market prices in the licit economy. Climatic seasons, price changes of agricultural inputs, labour costs and precursors all influence prices. The effects of law enforcement activities on prices are more difficult to determine. Eradication typically targets certain areas for a certain period in the form of campaigns. The effects on prices may be limited to only that region, and, depending on their frequency and spatial coverage, price observations may not necessarily trace this dynamism one-to-one. Eradication activities usually lead to a reduction in coca leaf on the illicit market, and a surge in coca leaf prices can be the consequence. However, the presence of law enforcement forces in a coca area may also lead to the temporary disappearance of traffickers in that region, and a breakdown of the illicit coca leaf market as demand crumbles. Law enforcement activities directed mainly against trafficking and clandestine laboratories can lead to similar consequence, even if the actual production remains unaffected. 4 These figures were reported to UNODC through the Annual Reports Questionnaire (ARQ) of the respective years and may differ from updated information available from the respective Governments at the time of publishing this report. 5 E.g. the Government of Ecuador reported the destruction of 2 cocaine processing laboratories to the CICAD in
21 Regional Overview In Bolivia and Peru, where state-controlled markets for coca leaf and consumption for traditional purposes exist, the situation is even more complicated. Farmers can theoretically sell to drug traffickers at the price of the illicit market, to the state-controlled institutions which offers fixed prices, to non-authorized coca leaf traders who nonetheless market coca leaf for traditional purposes, or, in Bolivia, legally market a certain quantity themselves. In Colombia and Peru, antigovernment groups involved in drug trafficking execute certain control over some coca cultivation areas. They may also determine prices in their sphere of influence and control marketing channels, again with the effect that the prices observed to not necessarily reflect the dynamics of supply and demand. While all these factors are thought to have a potential effect regionally and in certain months, the national aggregated figures and annual averages are thought to reflect relatively well the overall price trend in a country. Comparing prices of coca leaf derivatives across countries is even more challenging. It is reasonable to assume that prices include a varying and difficult to quantify risk factor and that this risk factor plays a more prominent role the higher the level of interaction and the more refined the product is. Furthermore, the composition and quality of the products such as the alkaloid content are not know. The local names used do not always reflect the chemical stage of the product, e.g. whether it is coca paste or already cocaine base, nor its purity. More recently, the weakening of the US dollar, the currency of the main consumer market, against the Euro, used in the second largest consumer market, is thought to have influenced prices in producing regions. Coca leaf prices As in most years since 1996, prices of sun-dried coca leafs in Bolivia in 2007 were significantly higher than in Peru in US dollar terms. While farm-gate prices of sun-dried coca leaf in Bolivia have shown an overall decreasing trend from 2000 to 2006 but increased in 2007, prices in Peru have been relatively stable over the same period. However, monthly averages followed a roughly similar pattern over the last three years. In Bolivia, prices of sun-dried coca leaf in Chapare increased by 16% over 2006 but remained well under the price level of over US$ 4.0/kg reached between 2000 and The national average farm-gate price for coca leaf outside the state-controlled market increased by 5% from US$ 3.9/kg in 2006 to US$ 4.1/kg in Prices for coca leaf in the Yungas of La Paz region and also in the state-controlled coca leaf markets all showed increases of similar magnitude, which points towards an increased demand for sun-dried coca leaf. These price increases, which happened in a year in which total coca leaf production increased, in combination with significantly higher seizures of coca leaf and derivatives in 2007, especially of cocaine HCl, indicate that the increased demand can most likely be attributed to narco-trafficking. In 2007, farm-gate prices for sun-dried coca leaves remained stable in Peru at on average US$ 2.5/kg, after having seen higher price levels of US$ 2.7/kg and US$ 2.9/kg in 2004 and 2005 respectively. However, the annual average prices have remained in the US$ 2-3/kg range since It is interesting to note that coca leaf prices in Peru tend to be higher towards the Bolivian border, and that coca cultivation expanded in those regions. In Colombia, only a small proportion of farmers sells fresh coca leaves, while the majority prefers to process the leaf into coca paste or cocaine base on the farm. The price of fresh coca leaf converted to sun-dried leaf equivalents, without taking into account a possible value added through the sun-drying process, would have been US$ 2.5/kg at the farm-gate in both 2006 and 2007, which is a level similar to Peru. 19
22 Regional Overview Figure 7: Monthly average farm-gate prices of sun-dried coca leaf in Bolivia and Peru (US$/kg), January 1990 to December US$/kg Bolivia (Chapare region) Colombia (indicative sun-dried equival.) Peru (national) Prices for Colombia in sun-dried leaf equivalents of fresh coca leaf prices, assuming a 57% weight loss through sun-drying. This does not take into account any possible value added through sun-drying. The monitoring of coca leaf prices in Colombia is in its initial phase, and prices are only indicative. Coca derivatives In both Colombia and Peru, coca paste prices have been relatively stable over the past years, despite a strong reduction of the area under coca bush cultivation in Colombia and a significant increase in Peru since beginning of the decade. The decline of Colombian coca paste prices in 2002 as well as their increase in 2007 may at least partly be attributed to a weakening and restrengthening of the Colombian peso, the currency in which prices are reported locally, against the US dollar in these years. In 2007, the average price for coca paste at the farm-gate in Colombia increased by 7% in US dollar terms, but decreased by 5% in Colombian pesos to COP 1,959,000/kg (US$ 943/kg) due to a strengthening of the Colombian peso. Annual average prices of coca paste at the farm-gate have been relatively stable at COP 210,000/kg between 2004 and In 2007, the wholesale price of cocaine HCl increased in both Colombian peso and US dollar terms and reached COP 4,567,000/kg or US$ 2,198/kg, an increase by 25% in US dollar over This is the highest price in US dollars recorded since 1991, and in Colombian pesos at a similar high level as in the years 2003 and In Peru, the price for coca paste increased on average by 9% from US$ 551/kg in 2006 to US$ 600/kg in 2007, mainly due to a steep rise in the last quarter of the year. Despite this increase, the average price of coca paste remained at a lower level than in 2004 and The wholesale price of cocaine in producing regions increased only slightly by 3% from US$ 825/kg in 2006 to US$ 851/kg in These increases should be interpreted with caution, as the Peruvian sol strengthened against the US dollar in the course of the year Between 2002 and 2007, annual prices for coca paste in Colombia were consistently higher than in Peru, on average between 30 and almost 60%. The large price difference is conspicuous as in terms of final export quality of cocaine, there seems to be no major difference. According to US reports, the purity of cocaine seizures originating from Peru has been consistently higher than of cocaine HCl originating from Colombia over the same period. Several factors might have 20
23 Regional Overview contributed to this discrepancy in prices, among them differences in coca paste quality, prices of chemical precursors and wages of specialized labour ( cooks ) helping farmers with the processing. Cost factors even more difficult to assess are the influence of armed groups in coca growing areas controlling marketing channels and farm-gate prices and the risk factor immanent to illicit and clandestine operations. Farm-gate prices for coca paste or cocaine base are not available from Bolivia, where farmers are thought to sell coca leaves, directly. The wholesale price of cocaine base in producing regions is reported to be US$ 900/kg, and thus higher than in Peru and close to the Colombian price level. Figure 8: Farm-gate price of coca paste in Colombia and Peru (US$/kg), January 2002 to December US$/kg '000 COP/kg Jan-02 Jan-03 Jan-04 Jan-05 Jan-06 Jan-07 0 Peru (US$/kg) Colombia (US$/kg) Colombia (COP/kg) In the absence of detailed information about quality and composition of coca derivates traded in production areas, prices may not always be comparable. Prices in Colombia refer to pasta básica and in Peru to pasta básica de cocaína lavada. Wholesale prices for cocaine HCl in Ecuador, where coca cultivation is negligible, were at US$ 4,000 (2007) much higher than in Bolivia and Colombia, and seemed to stabilized after a decline between 2004 and Table 4: Ecuador, wholesale prices for cocaine products (US$/kg), 2003 to Cocaine base 2,500 2,500 1,900 1,900 1,900 Cocaine HCl 5,000 5,000 4,500 4,000 4,000 Source: UNODC Annual Reports Questionnaires, 2003 to
24 Regional Overview 5 FARM-GATE VALUE OF COCA CULTIVATION Farm-gate values of coca cultivation in Bolivia and Peru are based on potential sun-dried coca leaf production. For Colombia, the farm-gate value is based on the potential production of each product sold by farmers (fresh coca leaf, coca paste or cocaine base). Farm-gate values constitute a gross value, without taking into account the expenses farmers incur for agricultural inputs such as herbicides, pesticides, fertilizers, or for wages. In 2007, the farm-gate value of coca products increased in all three coca cultivating countries, in Colombia 6 due increases in farm-gate prices in US dollar terms and in area under coca cultivation, in Peru due to an increase in coca leaf production, and in Bolivia due to the combined effects of an elevated price level and expansion of coca leaf production. By and large, the economic importance of coca products, expressed as their farm-gate values, remained unchanged in Colombia and Peru where the growth of the national economy kept pace with the increase in farm-gate value. However, in Bolivia the importance of the coca industry grew in 2007, and the farm-gate value of coca leaf as a proportion of the GDP grew from 2.0% in 2006 to 2.5% in Figure 9: Potential farm-gate value of coca products, 2007 Million US$ % of GDP 0 Bolivia (sun-dried coca leaf) Colombia (coca leaf and derivatives) Peru (sun-dried coca leaf) Farm-gate value (US$ million) As % of GDP GDP of 2007 as reported/estimated by the respective Government. 6 For technical reasons, the potential farm-gate value of coca products in Colombia is calculated based on the coca area on 31 December, without considering changes in the amount of production due to increases or decreases in the area under cultivation in the course of the year. Therefore, the area expansion in 2007 by 27% contributes to a nominal increase of the farm-gate value. The calculation of the potential cocaine production discussed earlier, however, takes cultivation dynamics into account. 22
25 Bolivia PART 2. BOLIVIA COCA CULTIVATION SURVEY 23
26 Bolivia Back of divider Part 2 Bolivia 24
27 Bolivia FACT SHEET Bolivia Coca Survey for 2007 Change 2006 on Coca cultivation 27,500 ha +5% 28,900 ha Of which in the Yungas of La Paz 18,900 ha +5% 19,800 ha in Chapare 8,300 ha +6% 8,800 ha in Apolo 300 ha 0% 300 ha Of which permitted by Bolivian law 1008* 12,000 ha 12,000 ha not permitted by Bolivian law ,500 ha +9% 16,900 ha Average annual sun-dried coca leaf yield 7 in Chapare 2,764 kg/ha 2,764 kg/ha in the Yungas of La Paz 1,294 kg/ha 1,321 kg/ha in the Yungas, traditional coca growing areas 1,213 kg/ha 1,215 kg/ha Production of sun-dried coca leaf 48,000 mt +6% 51,000 mt Potential production of cocaine 94 mt +11% 104 mt as % of global cocaine production 10% 10% National weighted average farm-gate price of coca leaf (outside state-authorized market)* Chapare average farm-gate price of coca leaf* Total farm-gate value of coca leaf production GDP* Farm-gate value of coca leaf production as % of GDP Value of agricultural sector GDP* Farm-gate value of coca leaf production as % of value of 2007 agricultural sector US$ 3.9/kg +5% US$ 4.1/kg US$ 3.2/kg +19% US$ 3.8/kg US$ 180 million US$ 8.7 billion +19% +4.5% US$ 214 million US$ 9.1 billion 2.0% 2.4% US$ 1.37 billion -0.7% US$ 1.36 billion 13% 16% Reported eradication of coca bush* 5,070 ha +24% 6,269 ha Reported seizure of cocaine base* 12,779 kg +17% 14,912 kg Reported seizure of cocaine hydrochloride* 1,309 kg +123% 2,923 kg * As reported by the Government yield figures are updated by the new cultivation levels across the sampling strata as defined by the 2006 yield study. 25
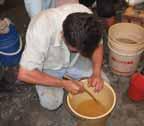
28 Bolivia ABBREVIATIONS BOB Bolivianos (Bolivian currency) CONALTID Bolivian National Council for Fighting against Drugs DIGCOIN Bolivian National Direction of Coca Leaf Control and Industrialization DIGECO Bolivian National Direction of Coca Leaf Commercialization (up to 2005) DIGPROCOCA Bolivian National Direction of Development for Coca Growing Areas DIRECO National Direction of Agricultural Re-conversion (up to 2005) FELCN Special Force against Drug Trafficking GCP Ground Control Point GIS Geographical Information Systems GPS Global Positioning System ICMP UNODC Illicit Crop Monitoring Programme HCl (cocaine) hydrochloride UNODC United Nations Office on Drugs and Crime ACKNOWLEDGEMENTS The following organizations and individuals contributed to the implementation of the 2007 coca cultivation survey in Bolivia and to the preparation of the present report: Government of Bolivia: Vice-Ministry for Coca and Integral Development UNODC: Ivan Alfaro Coordinator (Project) Robert Szucs - GIS Specialist (Project) Patricia Delgado - GIS Specialist (Project) Gonzalo Aruquipa - Remote Sensing Specialist (Project) Blanca Vega Remote Sensing Specialist (Project) Helder Catari Remote Sensing Specialist (Project) Enrique Castañón GIS Specialist (Project) Claudia Ortega - Administrative Assistant (Project) Varinia Herbas Intern (Project) Isabel Condori Intern (Project) Christina Albertin - UNODC Representative (field office) José Rocabado - UNODC National Programme Officer (field office) Coen Bussink - Remote Sensing and GIS Expert (Statistics and Survey Section, Vienna) Anja Korenblik - Programme Management Officer (Studies and Threat Analysis Section, Vienna) Angela Me Chief (Statistics and Survey Section, Vienna) Martin Raithelhuber - Programme Officer (Statistics and Survey Section, Vienna) Javier Teran Statistician (Statistics and Survey Section, Vienna) Thomas Bauer (University of Natural Resources and Applied Life Sciences, Vienna) Reinfried Mansberger (University of Natural Resources and Applied Life Sciences, Vienna) Photo credits: UNODC BOL/F57 project or otherwise indicated. Unless otherwise specified, all figures presented in this report come from the respective National Governments in the context of national monitoring systems supported by UNODC. The implementation of UNODC s Illicit Crop Monitoring Programme in the Andean countries and the Bolivia survey in 2007 was made possible thanks to financial contributions from the Governments of Austria, Colombia, France, the United States of America, and from the European Commission. 26
29 Bolivia CONTENTS 1 INTRODUCTION FINDINGS...30 COCA CULTIVATION...31 Regional analysis...32 Coca cultivation in the Yungas of La Paz...34 Coca cultivation in Apolo...37 Coca cultivation in Chapare...39 COCA YIELD AND PRODUCTION...41 COCA PRICES AND TRADING...42 COCA CULTIVATION IN NATIONAL PARKS...51 REPORTED ERADICATION...52 REPORTED SEIZURES
30
31 Bolivia 1 INTRODUCTION The objectives of UNODC s Illicit Crop Monitoring Programme (ICMP) are to establish methodologies for the collection and analysis of data on illicit crops and to improve Governments capacity to monitor these crops in the context of the strategy adopted by Member States at the General Assembly Special Session on Drugs in June ICMP is currently active in seven countries: Afghanistan, Bolivia, Colombia, Lao PDR, Morocco, Myanmar and Peru. The Bolivian Government and UNODC launched the project Land use management and monitoring system in the Yungas of La Paz in October Initially, the project focused only on the Yungas of La Paz, but since 2003 it has extended its scope to provide estimates on coca cultivation at the national level. Until 2006, the coca cultivation areas were monitored by satellite imagery, but in 2007 the methodology was enhanced by the use of very high resolution photos taken from an airplane. This report presents the project s findings for During 2007, the project was implemented in cooperation with the National Direction of Development for the Coca Growing Regions (DIGPROCOCA, former DIRECO), Vice-Ministry of Coca and Integral Development. DIGPROCOCA provided logistical support during the implementation of ground activities, including the collection of a large number of ground control points, mainly in the Chapare area. The Bolivian National Government, through the National Council of Fight against Illicit Trafficking of Drugs (CONALTID) uses the information provided by this project for planning and implementing its strategy for the fight against illicit drug trafficking. Coca cultivation decreased significantly in Bolivia at the end of the 1990s, following a significant reduction in the area under coca cultivation in the Chapare region. Bolivia is now the third largest coca producer worldwide, far behind Colombia and Peru. Coca cultivation is concentrated in the departments of La Paz (in the areas of the Yungas of La Paz and Apolo) and in the Chapare area (department of Cochabamba). Bolivian Law 1008 ( Law on the Regime Applicable to Coca and Controlled Substances, 1988) permits up to 12,000 ha of traditional coca cultivation for traditional consumption and other legal uses. Most of this area is located in the Yungas of La Paz. In addition, in October 2004, the Bolivian Government temporarily authorized the cultivation of 3,200 ha of coca in the Chapare region. Law No 1008 does not provide a precise definition of the geographic limits of the traditional coca growing areas, however, the Bolivian Government is preparing a study which is intended to lead to a legal delineation of the area where coca for traditional use may be cultivated. The National Government is planning to develop a study to determine the national coca leaf demand for traditional purposes. This study is scheduled to begin in 2008, and to provide results by the end of
32
33 Bolivia 2 FINDINGS Coca cultivation In 2007, the total area under coca cultivation in Bolivia was estimated at 28,900 ha, an increase of 5% over last year s estimate of 27,500 ha. Coca cultivation in areas outside the 12,000 ha for traditional use increased by 9%. The increase at the national level was due to an increase in the main cultivation regions the Yungas of La Paz and Chapare. In the Yungas of La Paz, the increase occurred mainly in the Municipality of La Asunta while other municipalities remained stable. In the Chapare region, the increase occurred mainly in the Southwest part. The project detected that the increase had occurred in areas where eradications were not undertaken. On the other hand, where eradication efforts are implemented, coca levels were observed to have remained stable or to have decreased. In the Yungas of La Paz, low levels of eradication combined with migration processes from the impoverished areas of Bolivia to the Yungas can be the reasons for an increasing trend since Figure 10: Coca cultivation in Bolivia (ha), ,000 40,000 Hectares 30,000 20,000 10, US Department of State National Monitoring System supported by UNODC In 2007, coca cultivation increased globally by 16%. Whilst this increase was as a result of increases in all three coca-producing countries, it was mainly caused by the significant increase in Colombia (27%). Coca cultivation in Bolivia represented 16% of global coca cultivation in 2007, compared to 18% in Bolivia remained the third largest coca cultivator, behind Colombia and Peru. 31
.")
34 Bolivia Regional analysis The increase in coca cultivation at the national level of 5%, from 27,500 ha to 28,900 ha, was the result of a combined increase in the Chapare and Yungas areas. Although these areas showed similar rates of increase, respectively 6% and 5%, the non-traditional coca-growing area in the Yungas expanded by a much larger proportion (13%). The most relevant increase took place in certain isolated areas of Yungas of La Paz, where new settlements were observed. Eradication is not undertaken in these areas. Table 5: Coca cultivation estimates by region (ha), Region % change on % of 2007 total Yungas of La Paz 13,800 16,200 17,300 18,100 18,900 19,800 5% 69% Chapare n.a. 7,300 10,100 7,000 8,300 8,800 6% 30% Apolo n.a % 1% Total 23,550 27,700 25,400 27,500 28,900 5% 100% Figure 11: Coca cultivation estimates by region (ha), hectare Yungas of La Paz Chapare Apolo In most of the Chapare region, farmers are cultivating an average of 0.16 ha of coca, locally called cato. This is the maximum amount allowed according to an agreement reached between the Government and social organizations of coca farmers in October Aerial photographs and geo-videos taken over Chapare during the survey clearly show the trend of coca cultivation on fields with the size of one cato in most parts of the region. Cato-size coca field 32
35

36 Bolivia Coca cultivation in the Yungas of La Paz The Yungas of La Paz, situated at about 150 km from the city of La Paz, at the eastern side of the Andes Range, is a region of uneven relief with steep slopes, turbulent rivers and elevations ranging from 300 to 4,000 meters above sea level. Significant climatic variations are observed even over short distances. Coca bush is predominantly cultivated on narrow terraces built on high gradient hills. Aerial view of the Northern Yungas The survey revealed 19,800 ha of coca cultivation in the Yungas of La Paz in 2007; this represents an increase of 5% compared to the 18,900 found in 2006 and follows the trend since Most of the cultivation continued to be taken place in the provinces of South Yungas and North Yungas, accounting respectively for 53% and 33% of the regional total. The largest annual increase (9%) was observed in South Yungas. The increase in this province is mainly due to the increase occurred in the area of La Asunta, where the project observed once again new settlements of people migrating from Bolivian High Lands. Eradication was not undertaken in this province. For the first time in the monitoring history, Caranavi province showed a decrease (-4%) caused by the eradication efforts; however this province only accounted for 8% of the regional total in Table 6: Distribution of coca cultivation in the Yungas of La Paz (ha), % change % of 2007 Province total South Yungas 7,182 8,356 8,867 9,395 9,753 10,588 9% 53% North Yungas 5,187 5,914 6,166 6,257 6,432 6,532 2% 33% Caranavi ,248 1,381 1,714 1,653-4% 8% Inquisivi % 4% Murillo % 1% Rounded total 13,800 16,200 17,300 18,100 18,900 19,800 5% 100% 34
 permits up to 12,000 ha of traditional coca cultivation for traditional consumption and other legal uses.")
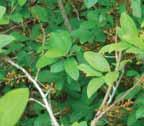
37 Bolivia Figure 12: Distribution of coca cultivation areas in the Yungas of La Paz, 2007 Caranavi 8% Inquisivi 4% Murillo 1% North Yungas 33% South Yungas 54% The Bolivian Law 1008 ( Law on the Regime Applicable to Coca and Controlled Substances, 1988) permits up to 12,000 ha of traditional coca cultivation for traditional consumption and other legal uses. Most of this area is located in the Yungas of La Paz, although the law does not provide for geographic delimitation of the traditional coca cultivation area. Most of the coca leaf produced in the Yungas of La Paz is traded through the coca market, controlled by DIGCOIN, of Villa Fatima in La Paz-city. Only a small amount of coca fields (300 ha) was eradicated in Yungas in The eradication efforts were focused mainly in Caranavi, causing a reduction in the cultivated area. A study on coca leaf yield conducted by UNODC and the Government in the Yungas in 2006 confirmed that farmers were using more sophisticated agricultural techniques in their coca fields, employing more fertilizers, pesticide and mechanical irrigation to improve the yield of their coca fields. In Caranavi, new coca fields established at the expense of primary forest or coffee plantations, benefited from higher yields due to the richer soils. High level inputs like terrace construction and mechanical irrigation in the Yungas 35


38 Bolivia Orthorectified aerial photo of La Asunta town and surrounding coca fields Harvesting of coca leaves in the Yungas 36
39 Bolivia Coca cultivation in Apolo Apolo is located at the northern part of the department of La Paz, on the eastern edge of the Andean mountain range. With relatively dry weather conditions and poor soils, coca fields in Apolo often have a low yield and are cultivated only for about three to five years. In 2004, DIRECO conducted a cadastral survey of coca cultivation in the Apolo region, measuring in situ all of the coca fields located in the region. The DIRECO survey revealed that coca cultivation reached 289 ha in The UNODC/Government of Bolivia project monitored Apolo completely for the first time in 2004, finding 273 ha of coca cultivation. In 2007, the project didn t obtain images from Apolo, but undertook a field mission, where some increase in cultivation was observed mainly in the area of Camata River. Table 7: Coca cultivation in Apolo region (ha), Province Municipality Franz Tamayo % change Apolo Coca cultivation in the Apolo region is traditionally associated with cassava to take advantage of the same furrow for the two different crops. The coca fields in central Apolo are scattered and relatively small (about 200 m 2 ) compared to the new coca fields found in the southern part or elsewhere in the country. Terraces are not used. The coca cultivation techniques and coca leaf sun drying are similar to techniques used in the Yungas area of La Paz. The northern part of Apolo is part of the Madidi National Park, the largest biosphere reserve in Bolivia. Only a few dispersed and small coca fields were found on the western side of the Madidi Park. In Apolo, coca cultivation is considered traditional according to law No eradication was undertaken in this area. 37


 Bulo Bulo!")

40 Bolivia Map 8: Coca cultivation density for Chapare, Bolivia 'W Río Cabito 65 30'W 65 0'W Río Mamoré 64 30'W BRAZIL 15 30'S PERU Bolivia San Cochabamba Andrés 15 30'S Río Apere Río Secure Loreto CHILE Río Ibare ARGENTINA PARAGUAY San Ignacio Beni El Puente 16 0'S Río Isiboro 16 0'S Río Grande ó Guapay Río Ichoa Río Chipiriri Arr. Uriuta Río Chapare Río Useuta Río Yapacani Mineros Río Piray 16 30'S Chimore Río Ichilo Santa Cruz 16 30'S San Carlos Río Altamachi Río Malpaso Villa Tunari Isinuta! Río Eterasama Río Chapare Yapacaní 17 0'S Río Isinota Eterazama! Villa14deSeptiembre Puerto Villarroel!! Senda F! Chipiriri! Senda B Villa Tunari!! ShinahotaChimore!! Ivirgarzama Puerto Villarroel! Arr. Mariposas Río Chore 17 0'S Sacaba Colomi Tiraque Río Ivirizu Río Chimoré Cochabamba Yungas de Vandiola! Valle Ivirza! Río Osos Río Zabala Valle Sacta! Río Sajta Entre Rios! Entre Rios (Bulo Bulo) Bulo Bulo! Río Espuma Tolata Arbieto San Benito Arani Vacas Pojo Río Molle Río Alizar Río San Mateo Río Moile 17 30'S 17 30'S Tarata Pocona Buena Vista Capinota 18 0'S Acasio Anzaldo Arampampa (ha/km² ) Potosi Río Caine Toro Toro Department boundaries San Pedro de Buena Vista Municipality boundaries Alalay Vila Vila Río San Pedro Mizque Totora Aiquile Omereque Pasorapa Comarapa Main Road River Poroma km Pocoata Geographic coordinates, WGS 1984 & Village center 1 : 'W Ravelo 65 30'W 65 0'W Presto 64 30'W Source: Government of Bolivia - National monitoring system supported by UNODC. The boundaries and names shown and the designation used on this map do not imply official endorsement or acceptance by the United Nations 'S Cultivation density >8.0 Río Mizque Río Pajta Saipina Río San Juán Pampa Grande Río Cienaga Trigal Moro Moro Mairana Vallegrande Río Tembladeras 18 0'S 18 30'S 38

41 Bolivia Coca cultivation in Chapare The Chapare region is situated in Cochabamba department, and the region is also referred to as the Cochabamba tropics, extending over the provinces of Chapare, Carrasco and Tiraque. In contrast to the Yungas of La Paz, Chapare region has moderate slopes and large rivers. Elevations vary from 300 to 2500 meters, and coca is cultivated between 300 and 1000 meters. The highest mountains are located in the south and the country s large tropical savannas begin in the northern part of Chapare. Temperatures are tropical and the area records the highest precipitation levels in Bolivia. In the 1990s, the Chapare region held the largest amount of coca cultivation. Following sustained eradication efforts and alternative development programmes, cultivation decreased dramatically but later started to increase again. Table 8: Distribution of coca cultivation by province in Chapare region (ha), Province % change % of 2007total Chapare 4,250 5,844 4,094 4,857 4,536-7% 52% Carrasco 2,864 3,520 2,312 2,791 3,492 25% 40% Tiraque % 9% Rounded total 7,300 10,100 7,000 8,300 8,800 6% 100% The 2007 survey found 8,800 ha of coca cultivation in Chapare, representing an increase of 6% compared to the 8,300 ha found in In contrast to last years, the increase occurred mainly in the south-western part of the Cochabamba tropical areas, corresponding to the Carrasco province. Like in former years, the increase took place in areas where no eradication was performed. On the other hand, some decrease was observed in regions where eradication was carried out. This aerial photo clearly shows the trend to cultivate coca in catos (40m x 40m) It should be noted that political boundaries are not properly defined between the departments of Cochabamba and Beni. For this reason, although some coca cultivation might actually be located 39

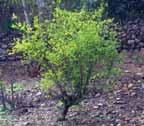
42 Bolivia It should be noted that political boundaries are not properly defined between the departments of Cochabamba and Beni. For this reason, although some coca cultivation might actually be located in Beni Department, all of the coca fields identified during the survey along the undefined departmental border were counted as part of the municipality of Villa Tunari, in the Department of Cochabamba. In past years, farmers of the Cochabamba Tropics used to intersperse or hide coca bushes in order to avoid detection and eradication. These practices are not very common nowadays because of the cato policy, and most coca fields were found to be free of association with other crops. It is generally accepted that coca cultivation is done with much more care in Yungas than in Chapare, and the techniques of cultivation differ from those used in Yungas. For example, the seedbeds in Chapare are usually not covered. Since the terrain is flat, there is no need to build terraces. The coca bushes in Chapare are bigger than in Yungas, and are settled with more space in between. The practice of pruning coca bushes does not exist. The association of coca with other crops is sometimes done to take advantage of the same open space, or coca is placed under leguminous trees, which fix nitrogen in the soil, thereby improving coca yield. In Chapare, the coca leaves are also sun-dried on bare floor before trading, but not with the same care as in the Yungas. According to FELCN, a part of total production is marketed outside of the region, while another part is used for local consumption (chewing and medicines). Coca bushes in Chapare may last on average 30 years if allowed to develop normally. Isolated, scattered old plants of large dimension have been observed, still yielding substantial quantities of coca leaves. Fertilizers and pesticides are also widely used in the Chapare. A spot to sun-dry coca leaves in Chapare 40
43 Bolivia Coca yield and production Based on data collected during the coca leaf surveys carried out in 2005 and 2006 in Bolivia. It has been determined that the annual sun-dried coca leaf yield in the Yungas and Apolo amounted to 1,321 kg per hectare. Applying this yield estimate to the area under coca cultivation interpreted in Yungas and Apolo resulted in 26,552 mt of potential production of sun-dried coca leaf in this region in In the absence of any detailed study on coca leaf by the Government of Bolivia and UNODC in Chapare, coca leaf yield estimates are derived from information from the United States Government under Operation Breakthrough. US Operation Breakthrough found a sun-dried coca leaf yield in Chapare of 2,764 kg per hectare. Using this yield, total sun-dried coca leaf production in Chapare was estimated at 24,323 mt. It should be noted that this estimate represents the potential coca leaf for cocaine production. Due to lack of data, it does not take into account the currently unknown amount of coca leaf from Chapare region that is destined for local consumption (chewing and medicinal preparation). Therefore, the total potential production of sun-dried coca leaf in Bolivia, including production for traditional purposes, was estimated at 51,000 mt in In order to calculate the total sun-dried coca leaf production destined for cocaine production, it is necessary to take into account the coca leaf cultivation for traditional use. Law 1008 authorizes 12,000 ha of coca cultivation in the traditional region. During the latest coca leaf survey, it was determined that according to the location where the traditional cultivation takes place, the sundried coca leaf yield amounts to 1,210 kg per hectare. Therefore, the total estimated production of sun-dried coca leaf under law 1008 is estimated at 14,520 mt in This implies that there were 36,355 mt of sun-dried coca leaf available for cocaine production in Bolivia in Table 9: Coca leaf yield and production by region, 2007 Region Production of sundried coca leaf Annual coca Annual sun-dried coca cultivation (ha) leaf yield (kg/ha/year) (mt/year) Yungas* and Apolo 20,100 1,321 26,552 Chapare 8,800 2,764 24,323 Total 28,900 1,765 51,000 * Includes 12,000 ha of traditional coca cultivation Operation Breakthrough also communicated conversion rates of 370 kg of sun-dried leaf for 1 kg pure cocaine in Chapare and of 315 kg of leaf for 1 kg of cocaine in the Yungas of La Paz. Applying the conversion factors to the total sun-dried coca leaf production for cocaine production, it resulted in 104 mt of potential cocaine production in Bolivia in This represents an increase in the production of cocaine of about 11% compared to
44 Bolivia Figure 13: Potential cocaine production in Bolivia (mt), Metric tons Production Despite the increase of cocaine production in Bolivia, its global share stayed the same, with 10% of the global potential cocaine production of 994 mt. Production continues to be much lower than in the mid nineties, when Bolivia accounted for about a quarter of global cocaine production. Coca prices and trading In Bolivia, sun-dried coca leaf trade is regulated by the National Directorate of Coca Leaf Commercialization and Industrialization DIGCOIN, (formerly DIGECO). DIGCOIN controls the quantity and prices of coca leaf traded in the two market facilities authorized by the Government: the market of Villa Fatima in La Paz city and the market of Sacaba in Cochabamba department, close to Cochabamba city. During 2007, a total of 17,120 mt of coca leaves fell under the control of DIGCOIN, representing an increase of 30% compared to This increase is partly due to new ways of coca trading introduced by DIGCOIN. Until recently the only mode of transaction for coca was its sale through retailers at market places. In 2007, other transaction venues were introduced, including i) authorized sales by coca farmers to consumers; ii) transactions under agreements; iii) sales by coca farmers to consumers at fixed selling points, and iv) selling in restricted quantities by farmers to the coca-processing industry. Table 10: Ways and volumes (mt) of coca leaf trading authorized by DIGCOIN, 2007 Way of trade DIGCOIN Market/Office La Paz Cochabamba Total Retailers at markets 13, ,643 Authorized exchange 1, ,453 Direct sale (agreements) Direct sale (fixed points of sale) 1, ,919 Provision for industrialization Total 16,092 1,028 17,120 Percentage 94% 6% 100% Source: DIGCOIN As can be observed in the table above, in 2007, the largest amount of coca leaf traded within the state-authorized system, some 16,092 mt or 94%, was traded in Villa Fatima and in DIGCOIN La Paz offices. The remaining 1,028 mt was traded in Sacaba or DIGCOIN Cochabamba Offices. 42
45 Bolivia Once again, the prices of coca leaves at the Villa Fatima market were higher than at the Sacaba market, with respective annual averages of BOB 36/kg (US$ 4.6/kg) and BOB 32/kg (US$ 4.1/kg). The annual average weighted price of coca leaves on these two markets was BOB 35/kg (US$ 4.6/kg) in Table 11: Monthly prices and quantities of coca leaf marketed through DIGCOIN, 2007 Chapare: Sacaba market La Paz: Villa Fatima market Weighted average Price Quantity Quantity sold Price BOB/kg Month BOB/kg sold (mt) (mt) BOB/kg US$/kg January , February , March , April , May , June , July , August , September , October , November , December , Annual average , Source: DIGCOIN According to DIGCOIN information, a total of 16,092 mt of traded coca came from the Yungas. Based on the data of the yield study, the equivalent area would be 12,218 ha of coca grown in the Yungas of La Paz. 1,028 mt from the Chapare were traded, with an equivalent area of 381 ha. Each trader is authorized by DIGCOIN to trade up to 500 pounds (227 kg) of dry coca leaf per month. DIGCOIN s authorization specifies where the coca leafs are bought (Villa Fatima or Sacaba) and the point of final destination for its retail. Coca is retailed in packages of a maximum weight of 15 pounds (6.8 kg). The following map shows the distribution of traded coca leaves throughout the country according to the DIGCOIN registry. As in 2006, in 2007, most of the coca leaves ended up in Santa Cruz department, followed by the departments of Tarija, La Paz and Potosi. There was a significant increase in La Paz department, where the new transaction venues were used to trade to the rural communities of the Altiplano. In Santa Cruz, coca leaves are supplied mostly for the workers of large scale industrial farms of soy beans and sugar canes who habitually chew it. Coca chewing is also widespread among miners of the departments of La Paz, Potosi and Oruro. An increasing quantity of coca leaves traded in the southern part of the country is smuggled to neighboring Argentina. During 2007, the Argentinean police seized the significant amount of 44 mt of coca leaves and 3.3 mt of cocaine at the Bolivian border. 43
46 Bolivia Table 12: Reported monthly coca leaves and cocaine seizures in Argentina (kg), 2007 Month Seizure of coca leaves (kg) Seizure of cocaine (kg) January 2, February 3, March 5, April 4, May 3, June 2, July 2, August 2, September 3, October 4, November 4, December 4, Total 44,406 3,328 Source: Argentinean National Police Force Figure 14: Reported monthly coca leaves and cocaine seizures in Argentina (kg), ,000 5,000 4,000 3,000 2,000 1,000 0 Jan Feb Mar Apr May Jun July Aug Sep Oct Nov Dec Coca leaves Cocaine Source: Argentinean National Police Force The total value of coca leaves traded through the control of DIGCOIN amounted to BOB 483 million or US$ 62 million in 2007, representing a significant increase of 16% compared to The volume of trade increased by 30% and the average annual price also increased by 13% (from BOB 31/kg to BOB 35/kg). 44
47
48 Bolivia Farm-gate prices of sun-dried coca leaf have been collected in Chapare on a monthly basis by DIGPROCOCA (former DIRECO) since 1990 and by the UNODC monitoring project in the Yungas of La Paz since Average annual prices for coca leaf were higher in the Yungas of La Paz, at BOB 38/kg (US$ 4.8/kg) than in the Chapare, at BOB 26/kg (US$ 3.2/kg). Table 13: Monthly sun-dried coca leaf price* in the Yungas of La Paz, 2007 Municipality Municipality Municipality Municipality of Month of Coripata of La Asunta of Caranavi Chulumani BOB/kg BOB/kg BOB/kg BOB/kg Average BOB/kg Average US$/kg Jan Feb Mar Apr May Jun Jul Aug Sep Oct Nov Dec Annual average * Outside the state-controlled trading system. Compared to 2006, sun-dried coca leaf prices increased slightly in 2007 to BOB 38/kg in the Yungas. Table 14: Reported monthly sun-dried coca leaf prices* in the Chapare, 2007 Month BOB/kg US$/kg January February March April May June July August September October November December Anual average Source: DIGPROCOCA * Outside the state-controlled trading system. In contrast to the last two years, prices in Chapare increased significantly from BOB 26/kg in 2006 to BOB 29.3/kg (+13%). The increase in prices paralleled an increase in the cultivated surface, and can be attributed to an increase in the demand of dried coca leaves. 46
49 Bolivia Figure 15: Monthly sun-dried coca leaf price in the Yungas of La Paz, Chapare and markets controlled by DIGCOIN, $US/Kg Jan Feb Mar Apr May Jun Jul Aug Sep Oct Nov Dec Yungas Chapare Digcoin Sources: UNODC monitoring project/digprococa/ DIGCOIN Weighted by production, the annual average price for coca leaf outside the market controlled by DIGCOIN was US$ 4.1/kg. This was a lower price than that of US$ 4.5/kg on the market controlled by DIGCOIN. However, at the end of the year, prices from the markets controlled by DIGCOIN were similar, and even higher, than prices outside the authorized markets. Prices of coca leaves have not been systematically recorded for Apolo. Anecdotal information suggests much lower prices in Apolo than elsewhere in the country, ranging from US$ 2.5 to US$ 2.8/kg in The reason for lower prices in Apolo could be attributed to the remoteness of the region, being far from the main trading centers. Coca leaf production in Apolo (281 mt) was negligible compared to the national total, and was therefore not taken into account in the establishment of the national annual price estimate. The existence of coca leaf price data from Chapare collected by DIRECO since 1990 provides a picture of long term price trends. Following a strong price rise in 1999 in line with a strong increase in eradication sun-dried coca leaf prices reached a peak of US$ 5.7 /kg in Prices subsequently fell to the lowest level since 1998 (US$ 3.2/kg in 2006) and rose again to U$ 3.8/kg in However, coca leaf prices in Bolivia continue to be substantially higher than in neighboring Peru (US$ 2.5/kg). 47
50 Bolivia Table 15: Reported monthly prices of sun-dried coca leaf in Chapare (US$/kg), 1991 to 2007 Month January February March April May June July August September October November December Annual Average US$/kg Figure 16: Farm-gate prices of sun-dried coca leaf in Chapare and national cocaine production, 1990 to 2007 Coca production (metric tons) 100,000 90,000 80,000 70,000 60,000 50,000 40,000 30,000 20,000 10, Coca price ($US/Kg) Coca production Coca leaf price in Chapare The estimation of the total farm-gate value of coca leaf production in Bolivia included the total value of the market controlled by DIGCOIN. The farm-gate value of coca leaves outside this market in 2007, amounted to a rounded value of US$ 214 million. 48
51 Bolivia Table 16: Estimation of the total farm-gate value of coca leaf production, 2007 Region Coca weighted average price US$/kg Coca production (mt) Coca value US$ Outside Outside Outside Authorized Total Authorized Authorized authorize authorized authorized market production market market d market market market Total value Yungas ,156 16,092 10,064 73,432,365 48,306, ,738,605 Chapare ,323 1,028 23,295 4,232,388 88,521,760 92,754,148 Rounded total 51,000 17,000 34,000 78,000, ,000, ,000,000 The increase of the coca value in 2007 is attributable to the increase in prices and production in both Yungas and Chapare regions. The total farm-gate value of coca leaf production in 2007 is equivalent to 2.4% of the projected Bolivian GDP 8 of US$ 9.1 billions for It represents 16% of the projected value of the licit agricultural sector of US$ 1.36 billions in These figures suggest that, for the country as a whole, coca production still has an impact on the Bolivian economy, and continues to play an important role within the coca producing regions. Street prices of cocaine paste and cocaine of unknown purity from the major cities and coca growing regions in Bolivia were also reported by FELCN and are provided in the table below. Table 17: Reported prices of cocaine base and cocaine HCl (US$/kg), 2007 City Cocaine base Cocaine HCL La Paz 975 2,050 Cochabamba 1,150 2,000 Santa Cruz 1,250 1,900 Region Yungas of La Paz 800 1,100 Chapare 1,000 1,500 Source: FELCN It should be noted that prices for coca leaves and their derivatives were consistently higher in Bolivia than in neighboring Peru. Table 18: Prices for coca leaf and its derivatives in Peru and Bolivia (US$/kg), 2007 Products Peru Bolivia Coca leaf Cocaine base (in coca producing regions) Cocaine HCl* 851 1,800 * Source: As reported by the respective Government. 8 Source: INE,


 0.")

52 Madera Bolivia Map 10: Coca cultivation and National Parks, Bolivia W 60 W Bolivia 10 S SOUTH AMERICA 10 S! Cobija Pando Manuripi Heat MadredeDios BRAZIL Rio Itenez PERU Rio Beni 15 S Titicaca lake Madidi Apolo Est. Biológica del Beni Apolobamba Pilon Lajas La Paz Yungas Beni Rio Mamore! Trinidad Noel Kempff Mercado 15 S Cotapata ^ La Paz Isiboro Secure Chapare Sajama Tunari! CochabambaCarrasco Amboro! Oruro Toro Toro! Santa Cruz Santa Cruz San Matias Oruro Poopo lake El Palmar! Sucre Kaa Iya del Gran Chaco Otuquis 20 S Potosi! Potosi Chuquisaca 20 S CHILE Eduardo Avaroa Cordillera de Sama! Tarija Tarija Tariquia Rio Pilcomayo PARAGUAY Cultivation density (ha/km² ) S ARGENTINA km Geographic coordinates, WGS : W Yun... : 60 W Source: Government of Bolivia - National monitoring system supported by UNODC. The boundaries and names shown and the designation used on this map do not imply official endorsement or acceptance by the United Nations. >4 National parks National parks affected by coca cultivation International boundaries Department boundaries Coca growing areas 25 S 50
53 Bolivia Coca cultivation in National Parks There are 21 protected areas and National Parks in Bolivia, totaling an area of 165,000 sq km, representing 15% of the national territory. Coca cultivation decreased in the National Parks of Chapare due to eradication efforts in these areas. The main decrease (-32%) was found in Isuburu Secure National Park. Ecosystems of the National Parks are particularly fragile and deforestation for establishment of coca cultivation causes irreversible damage to their environment. Although eradication has been efficient during 2007, it should be noted that the damage to the forest due to coca cultivation is irreversible. Table 19: Coca cultivation estimates by National Parks in Chapare (ha), Area % change % of total Isiboro Secure National Park 1,605 2,807 1,161 1, % 11% Carrasco National Park 778 1, % 9% Madidi National Park n.a % 0.1% Total within National Parks 2,383 4,074 1,952 2,298 1,825-21% 21% Outside National Parks 4,917 6,026 5,053 6,002 6,975 16% 79% Rounded Total 7,300 10,100 7,005 8,300 8,800 6% 100% Figure 17: Distribution of coca cultivation in Chapare region inside and outside national parks (ha), ,000 7,000 6,000 5,000 4,000 3,000 2,000 1,000 0 Total within National Parks Outside National Parks
54 Bolivia Reported eradication In 2007, the Bolivian Government reported the eradication of 6,269 ha of coca, 24% more than in the previous year. Only 300 ha of coca were eradicated in the Yungas of La Paz, (5%) and 5,969 ha in the Cochabamba Tropics (95%). In Bolivia, no chemical or aerosol agents are used and the eradication of coca cultivation is exclusively manual. Figure 18: Reported eradication and coca cultivation in Bolivia (ha), ,000 50,000 40,000 hectare 30,000 20,000 10, Eradication 5,498 7,512 7,026 11,62116,999 7,953 9,435 11,85310,087 8,437 6,073 5,070 6,269 Coca cultivation 48,60048,10045,800 38,00021,80019,60019,900 24,40022,80027,60025,400 27,50029,000 Sources: For coca cultivation: UNODC; for eradication: DIGPROCOCA Figure 19: Reported monthly eradication in Bolivia (ha), Jan Feb Mar Apr May Jun Jul Aug Sep Oct Nov Dec Eradication (ha) Source: DIGPROCOCA 52

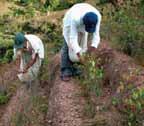
55 Bolivia The Bolivian government also reported the eradication of 7.5 ha of coca seedlings in the Chapare region, an increase of 30% compared to The eradication of coca seedlings helps to avoid the replanting of eradicated coca fields. Table 20: Reported monthly eradication of coca seedlings (m 2 ), Month January 1,460 1,795 2, ,077 February 1,415 2,830 4,516 1,907 4,196 March 4,520 3,296 4,320 2,904 4,052 April 4,013 2,936 4,825 3,764 4,014 May 2,352 2,989 3,639 2,691 8,856 June 2,972 5,411 4,737 5,683 8,245 July 5,962 6,963 4,372 7,328 7,595 August 10,140 4,344 5,294 10,035 7,879 September 6,438 3,156 4,010 7,667 7,568 October 9,978 4,470 4,812 7,083 8,299 November 7,280 5,869 4,222 6,166 7,387 December 3,294 5,488 4,862 1,814 5,436 Total 59,823 49,547 52,357 57,486 74,604 Source: DIGPROCOCA Reported seizures Manual eradication of a coca field in Caranavi DIGCOIN, through FELCN, controls the trade of coca leaves within the country, including control over the transport of coca leaves. Coca leaves are seized if transported without a license or outside of the authorized route specified in the license. In 2007, DIGCOIN seized 1,343 mt of coca leaves, representing a significant increase of 27% compared to the reported seizure of 1,343 mt in The increase in seizure of coca leaf can be attributed to a strengthening of FELCN s special force for the control of coca leaves (Grupo Especial de Control de la Hoja de Coca, GECC), which included introducing control of additional roads, and improvement in equipment and infrastructure. 53
56 Bolivia Table 21: Reported seizure of coca leaves (kg), Department La Paz 31,291 22,375 66, , , ,463 Cochabamba ,105 37, ,803 1,030,834 1,203,767 Santa Cruz 7,343 20,828 30,441 68,508 52, ,703 Tarija 1,407 4,451 10,183 16,499 19,604 11,843 Oruro 1,205 4,682 6,120 24,814 21,913 24,393 Potosi 357 1,321 1,942 1,509 4,010 4,999 Sucre 0 1,450 1,448 3,229 11,780 7,013 Beni ,525 4,778 6,768 Pando Total 42,544 66, , ,268 1,343,062 1,705,636 Source: FELCN Figure 20: Reported seizure of coca leaves, ,400,000 1,200,000 1,000, ,000 kg 600, , ,000 0 La Paz Cochabamba Santa Cruz Tarija Oruro Potosi Chuquisaca Beni Source: FELCN The Special Force for the Fight against Drugs (FELCN) reports annually on drugs seizures. Between 2006 and 2007, there was a significant increase of 17% in reported seizures of cocaine base and more than a doubling of seizures of cocaine HCl 9. Table 22: Reported seizure of drugs in Bolivia, (kg) Product Cocaine base 8,906 6,905 5,044 4,280 4,741 6,934 8,189 10,152 12,779 14,912 Cocaine HCl 2, , ,300 1,309 2,923 Heroin Cannabis 320 2,160 3,745 7,055 8,754 8,510 28,200 31, , ,777 Source: FELCN 9 The peak in seizure of cocaine HCL in 2003 was due to an exceptional operation conducted by FELCN. 54
57 Bolivia Figure 21: Reported seizures of cocaine base and cocaine HCl in Bolivia (kg), kg Cocaine base Source: FELCN Cocaine HCL The increasing trend of cocaine base seizures has continued in 2007; the destruction of coca/cocaine laboratories and maceration pits was very similar to the year before and remained at a high level. Table 23: Reported destruction of clandestine laboratories and macerations pits, Type Coca paste and/or cocaine laboratories 1, ,006 1,420 1,769 2,254 2,619 4,070 4,087 Precusors laboratories Cocaine laboratories only Maceration pit 1,659 1, ,292 1,950 2,544 3,293 4,064 6,268 6,526 Figure 22: Reported destruction of clandestine laboratories/macerations pits, ,000 6,000 5,000 4,000 3,000 2,000 1, Coca paste and/or cacaine laboratories 1,066 1, ,006 1,420 1,769 2,254 2,619 4,070 4,087 Maceration pit 1,481 1,659 1, ,292 1,950 2,544 3,293 4,064 6,268 6,526 Source: FELCN 55
58 Bolivia 56
59 Colombia PART 3. COLOMBIA COCA CULTIVATION SURVEY 57
60 Colombia Back of divider Part 3 Colombia 58
61 Colombia FACT SHEET Colombia Coca Survey for 2007 Change 2006 on 2006 Net coca cultivation (rounded total) 78,000 ha +27% 99,000 ha Of which Pacific region 18,810 ha +38% 25,960 ha 2007 Putumayo-Caquetá region 17,220 ha +23% 21,130 ha Central region 12,130 ha +73% 20,950 ha Meta-Guaviare region 20,540 ha -4% 19,690 ha Elsewhere 9,170 ha +23% 11,270 ha Reported cumulative aerial spraying of coca bush* 172,026 ha -11% 153,134 ha Reported manual eradication of coca bush* 43,051 ha +55% 66,805 ha Average farm-gate price of coca paste Total farm-gate value of the production of coca leaf and its derivatives US$ 879/kg COP 2,070,000/kg +7% -5% US$ 943/kg COP 1,959,000/kg US$ 683 million +37% US$ 934 million in % of GDP % 0.5% in % of GDP of agricultural sector 1 5% 5% No. of households involved in coca cultivation Annual household gross income from the production of coca leaf and its derivatives 67,000 households +19% 80,000 households US$ 10, % US$ 11,675 Potential production of cocaine 610 mt -2% 600 mt in % of world cocaine production 62% 60% Average wholesale cocaine price* US$ 1,762/kg COP 4,155,000/kg +25% +10% US$ 2,198/kg COP 4,567,000/kg Reported opium poppy cultivation* 1,023 ha -30% 714 ha Potential opium latex production 31 mt +10% 34 mt Potential heroin production 1.3 mt +8% 1.4 mt Average farm-gate price of opium latex* US$ 251/kg +14% US$ 286/kg Average heroin price* US$ 9,992/kg +8% US$ 10,780/kg Reported seizure of cocaine* 127,326 kg -1% 126,641 kg Reported seizure of heroin* 442 kg +21% 537 kg Reported destruction of clandestine laboratories 11 * 2,270 +4% 2,367 * As reported by the Government. 10 GDP of the respective year as reported by the Government. 11 Includes laboratories processing coca paste/cocaine base, cocaine hydrochloride, heroin, morphine, potassium permanganate, and non-specified. 59
62 Colombia ABBREVIATIONS COP DANE DEA DIRAN DNE DNP GME HCl ICMP INCB IDB NNPS OAS PDA PCI RSS SIMCI UNODC USAID US$ mt Colombian Pesos National Department of Statistics US Drugs Enforcement Administration Colombian Anti-Narcotics Police National Narcotics Office National Planning Department Mobile Eradication Groups (cocaine) hydrochloride Illicit Crop Monitoring Programme International Narcotics Control Board Inter-American Development Bank National Natural Parks System Organization of American States Alternative Development Programme Presidential Programme against Illicit Crops Social Solidarity Net Integrated Illicit Crops Monitoring System United Nations Office on Drugs and Crime United States Agency for International Development United States Dollars Metric tons ACKNOWLEDGEMENTS The following organizations and individuals contributed to the implementation of the 2007 coca cultivation survey in Colombia, and to the preparation of the present report: Government of Colombia: Ministry of Interior and Justice National Narcotics Office - DNE Anti-Narcotics Police - DIRAN Ministry of Defense Presidential Agency for Social Action and International Cooperation UNODC: Rodolfo Llinás, SIMCI Project Coordinator Orlando González, Digital Processing Expert Sandra Rodríguez, Digital Processing Expert Zully Sossa, Digital Processing Expert Maria Isabel Velandia, Digital Processing Expert Martha Paredes, Research and Analysis Expert Leonardo Correa, Field Engineer Juan Carlos Parra, Editing Engineer Martha Luz Gutierrez, Administrative Assistant Javier Espejo, Assistant Engineer Maria Ximena Gualdron, Assistant Engineer Aldo Lale-Demoz, Representative for Colombia Coen Bussink, Remote Sensing and GIS Expert, Statistics and Survey Section, Vienna Anja Korenblik, Programme Management Officer, Studies and Threat Analysis Section, Vienna Angela Me, Chief, Statistics and Survey Section, Vienna Martin Raithelhuber, Programme Officer, Statistics and Survey Section, Vienna Javier Teran, Statistician, Statistics and Survey Section, Vienna The implementation of UNODC s Illicit Crop Monitoring Programme in the Andean countries and the Colombian survey in 2007 was made possible thanks to financial contributions from the Governments of Austria, Colombia, France, the United States of America, and from the European Commission. Unless otherwise specified, all figures presented in this report come from the Government of Colombia in the context of national monitoring systems supported by UNODC. Photo credits: UNODC/SIMCI unless otherwise specified. 60
63 Colombia CONTENTS 1 INTRODUCTION FINDINGS...64 COCA CULTIVATION...64 National cultivation...64 Regional Analysis...71 Possible areas of new cultivation...84 COCA LEAF, COCA PASTE AND COCAINE BASE PRODUCTION...85 Potential cocaine production...87 COCA PRICES...91 Coca leaf, cocaine base and cocaine prices...91 Coca leaf prices...92 Coca paste prices...92 Cocaine base prices...93 Cocaine prices...94 Income per hectare...94 SUPPLY REDUCTION...97 Reported forced manual eradication...97 Reported aerial spraying Reported seizures
64 Río Magdalena Río Caquetá Colombia Map 11: Coca cultivation density in Colombia, W 70 W Colombia Caribbean Sea South America Barranquilla La Guajira Cartagena Atlántico Magdalena Cesar PANAMA Sucre Córdoba Bolívar Norte de Santander VENEZUELA Cucutá Arauca 5 N Pacific Ocean Río Atrato Chocó Valle Cali uca Río Ca Medellín Antioquia Caldas Risaralda Quindío Tolima Santander Boyacá Cundinamarca Bogotá Meta Casanare Arauca eta Río M Río Vichada Río Guaviare Vichada R ío Meta Puerto Carreño Río Orinoco 5 N Tumaco Nariño Pasto Cauca Popayán Huila Florencia na Río Magdale Neiva San José Guaviare Mitú Río Inírida Guainía Putumayo Puerto Asís Caquetá Vaupés N 10 N Río P utuma ECUADOR yo Amazonas BRAZIL 5 S Cultivation density (ha/km²) >4.0 International boundaries Department boundaries PERU km Geographic coordinates WGS W Rí oamazonas Leticia 70 W 5 S Source: Government of Colombia - National monitoring system supported by UNODC The boundaries and names shown and the designations used in this map do not imply official endorsement or acceptance by the United Nations 62
65 Colombia 1 INTRODUCTION The objectives of UNODC s Illicit Crop Monitoring Programme (ICMP) are to establish methodologies for data collection and analysis, to increase the governments capacity to monitor illicit crops on their territories and to assist the international community in monitoring the extent and evolution of illicit crops in the context of the elimination strategy adopted by the Member States at the U.N. General Assembly Special Session on Drugs in June ICMP presently covers seven countries: Colombia, Bolivia and Peru for coca; Afghanistan, Lao PDR and Myanmar for opium and Morocco for cannabis. During the 1980 s and 1990 s, Colombia became the country with the largest illicit coca growing area and cocaine production in the world. Illicit coca cultivation in the country expanded steadily throughout this period, in particular in remote areas of the Amazon basin. Although coca cultivation started to decrease in 2001, Colombia remains the largest coca-growing country in the world. UNODC has supported the monitoring of illicit crops since 1999, and has produced nine annual surveys through a special satellite based analysis programme called SIMCI (from the Spanish initials). In October 2006, UNODC signed a new agreement with the Colombian government to continue and expand monitoring and analysis work. In this context, the SIMCI II project facilitates the implementation of additional tasks in the framework of an integrated approach to analyze the drug problem in Colombia. The project also supports the monitoring of related problems such as fragile ecosystems, natural parks, indigenous territories, the expansion of the agricultural frontier and deforestation. It provides Geographic Information System support to the government s alternative development projects and its Forest Warden Families Programme. The new project foresees the creation of an Inter-Institutional Committee permanently assigned to govern the project in order to ensure the transfer of know-how to the national beneficiary institutions. SIMCI II is a joint project between UNODC and the Colombian government, represented by the Ministry of Interior and Justice and the International Cooperation Agency. The national counterpart is the Ministry of Interior and Justice. The project is managed by a technical coordinator and composed of engineers and technicians: four digital image processing specialists, one field engineer, a cartographic technician, a research and analysis specialist, two assistant engineers and an administrative assistant. The team cooperates with technicians from the Police Antinarcotics Division (DIRAN) and National Parks Administration. It supports several studies and investigations for government and private institutions, related to land use, environment, licit crops, etc. SIMCI provides to the abovementioned institutions experts, access to its Spatial Information Data Bank, transfer of technology and guidance to achieve their goals. Organizations that benefited from SIMCI support include the National Directorate for Statistics (DANE), local governments, the National Federation of Coffee Growers, NGOs as well as other UN agencies and projects. The project has developed technical agreements with several national and foreign Universities, to interchange and share knowledge, for training activities and joint projects. Among them are BOKU University in Austria, Zaragoza University in Spain, Universities of Harvard, Michigan and Maryland in USA, Andes, Antonio Nariño and other Universities in Colombia. 63
66 Colombia 2 FINDINGS Coca cultivation National cultivation In 2007, the total area under coca cultivation in Colombia was estimated at 99,000 ha. This estimate represented a 27% increase in area under the illicit crop compared to 2006 (78,000 ha). This is the first significant increase in coca cultivation after four years of relatively stable cultivation. Similar to the previous six surveys, the 2007 survey represents the situation as of the end of the year, (31 December 2007). As was the case last year, the survey covered the whole territory and detected coca cultivation in 23 out of 32 departments. In 2007, the area under coca cultivation represents 2% of the agricultural land in Colombia. Figure 23: Coca cultivation in Colombia (ha), , , , ,000 Hectares 100,000 80,000 60,000 40,000 20, US Department of State National Monitoring System supported by UNODC The increase in area under coca cultivation between 2006 and 2007 took place despite heavy antidrugs strategies implemented by the Government of Colombia. In 2007, aerial spraying of coca cultivation amounted to 153,000 ha and the Colombian Government also reported additional manual eradication of almost 67,000 ha. Analysis of coca cultivation changes Coca cultivation is very dynamic in Colombia. A range of variables can be associated with increases and decreases of the cultivation area over time. Factors such as favorable prices, pressure exerted by armed groups on farmers, the legal economy, and temporary crisis situations can all lead to an increase in the cultivated area. On the other hand, factors such as forced eradication, aerial spraying, improved security conditions, and plant diseases could reduce the cultivated area. This cultivation survey does not endeavor to assess how or to what extent these factors bring about change in the area under coca cultivation. Rather, it shows the situation on a given date of the year (31st of December). 64

 due to its high yield. It is noticeable that the largest coca growing municipalities presented also the highest increases in area in 2007.")
67 Colombia The ten municipalities listed below embrace the largest areas under coca cultivation in Colombia in 2007; they account for 36% of the national coca cultivation and 47% of the national potential cocaine production. Cumaribo, a municipality located in Orinoco region, has not only the largest coca cultivation area in Colombia (7% of the total country), but the highest potential cocaine production (9% of the total country) due to its high yield. It is noticeable that the largest coca growing municipalities presented also the highest increases in area in In addition, there has not been any significant change in the top 10 ranking of municipalities for the last two years. Table 24: The ten municipalities with the largest coca cultivation area and potential cocaine production, 2007 Municipality Department Coca cultivated area (ha) As % of total coca cultivation in Colombia Potential pure cocaine production (mt) Cumaribo Vichada 6, % 57 Tumaco Nariño 5, % 18 Puerto Asís Putumayo 4, % 24 Vista Hermosa Meta 3, % 33 El Retorno Guaviare 3, % 34 San José del Guaviare Guaviare 3, % 39 Puerto Rico Meta 2, % 35 Mapiripan Meta 2, % 32 Cartagena del Chairá Caquetá 1, % 12 Olaya Herrera Nariño 1, % 4 Total 35, % 288 Manual eradication in Nariño, Source: Accion Social PCI, Government of Colombia 65
68 Colombia Map 12: Coca cultivation density change in Colombia, W 70 W Colombia Caribbean Sea South America Barranquilla Atlántico Cartagena Magdalena La Guajira 10 N Cesar 10 N PANAMA Sucre Bolívar Córdoba Norte de Santander Cucutá VENEZUELA Arauca Medellín Antioquia Santander Arauca Puerto Carreño Chocó Risaralda Caldas Boyacá Casanare Vichada 5 N Pacific Ocean Quindío Tolima Cundinamarca Bogotá 5 N Valle Cali Meta Cauca Popayán Huila Neiva San José Guainía Tumaco Florencia Guaviare Pasto Nariño Caquetá Mitú Vaupés Puerto Asís Putumayo 0 0 ECUADOR Amazonas BRAZIL 5 S Strong decrease Decrease Stable Increase Strong increase International boundaries Department boundaries 75 W PERU km Geographic coordinates WGS 84 Leticia 70 W 5 S Source: Government of Colombia - National monitoring system supported by UNODC The boundaries and names shown and the designations used in this map do not imply official endorsement or acceptance by the United Nations 66
69 Colombia In absolute numbers, the most important increases of coca crops between 2006 and 2007 took place in the departments of Nariño (+4,653 ha) in the southwest corner of the country, and in the departments of Antioquia (+3,769 ha) and Bolivar (+3,250 ha), both in the central region. The area under coca cultivation in Nariño increased from 15,606 ha in 2006 to 20,259 ha in The Nariño region contributed with 21% of the total area under coca cultivation in Colombia. Coca cultivation in Nariño became notorious in 2002, when the area increased from approximately 7,500 ha in 2001 to 15,131 ha in In 2007, Nariño remained the department with the highest area with coca cultivation in the country with 20,259 ha (21% of total cultivation in Colombia); followed by the department of Putumayo with 14,813 ha, which accounted for 15% of the total cultivation. The only reduction in an important growing region took place in Meta department (-677 ha). The department of Norte de Santander, located at the border with Venezuela, was showing a decreasing trend in the period Unfortunately, in 2007 the area under coca cultivation increased four fold from less than 500 ha in 2006 to 1,946 ha. As was the case in 2006, Nariño and Putumayo with a combined increase of over 7,200 ha remained the two departments with the largest area in terms of coca cultivation, together accounting for 36% of the total country s area under coca cultivation. In fact, 46% of the 2007 cultivation took place in only three departments: Nariño, Putumayo and Meta. The same three departments accounted for 50% of the total cultivation in Table 25: Coca cultivation by department (ha), Department Dec Dec Dec Dec Dec Dec % change % of total 2007 Nariño 15,131 17,628 14,154 13,875 15,606 20,259 30% 21% Putumayo 13,725 7,559 4,386 8,963 12,254 14,813 21% 15% Meta 9,222 12,814 18,740 17,305 11,063 10,386-6% 11% Antioquia 3,030 4,273 5,168 6,414 6,157 9,926 61% 10% Guaviare 27,381 16,163 9,769 8,658 9,477 9,299-2% 9% Vichada 4,910 3,818 4,692 7,826 5,523 7,218 31% 7% Caquetá 8,412 7,230 6,500 4,988 4,967 6,318 27% 6% Bolívar 2,735 4,470 3,402 3,670 2,382 5, % 6% Cauca 2,120 1,443 1,266 2,705 2,104 4,168 98% 4% Arauca 2, ,552 1,883 1,306 2,116 62% 2% N. de 8,041 4,471 3, , % 2% Córdoba ,536 3,136 1,216 1,858 53% 2% Santander , ,325 53% 1% Chocó , ,080 32% 1% Guainía % 0,6% Amazonas % 0,6% Valle del % 0,5% Vaupés 1,485 1,157 1, % 0,3% Magdalena % 0,3% Cundinama % 0,1% La Guajira % 0,1% Boyacá % 0,1% Caldas % 0% Total 102,000 86,000 80,000 86,000 78,000 99,000 27% Department
70
71 Colombia Coca cultivation in national parks The presence of illicit crops in both Natural Parks and Indigenous Territories has been monitored by SIMCI since the 2001 coca survey. The data have been delivered to the competent authorities to enable them to identify actions and projects to be applied for the preservation of its social and environmental characteristics with minimum of harm. The boundaries of National Parks and Indigenous territories have been provided by the official institutions in charge of their management. In 2005, the limits of National Parks were edited by the monitoring project in cooperation with technicians from the National Parks Administrative Unit. The editing improved the match between SIMCI cartographic material and the official boundaries of the Parks. National Parks boundaries are not always precise and therefore coca cultivation estimated in each of them depends on the accuracy of their delimitation. To enable annual comparison the same boundaries were used for each year. Coca cultivation in 2007 was found in 16 of the 51 National Parks in Colombia. With 3,770 ha in 2007, coca cultivation represented 0.02% of the total area covered by National Parks, and coca cultivation in National Parks represented 4% of the total level of coca cultivation in Coca cultivation in National Parks showed an increase of 6% in This increase was mainly due to a increase in the National Parks of Nukak (+591 ha, or +75% increase), Paramillo (+184 ha or +78%) and Munchique (+49 ha or 817%). Decreases in the areas with coca cultivation were found in many other National Parks. However, for the first time, the National Parks of El Tuparro, Sanquianga and Utria were affected by coca cultivation in Table 26: Coca cultivation in National Parks (ha), National parks % change Nukak 1, ,370 75% Sierra La 2,707 3,354 1,689 1,258-26% Paramillo % La Paya % Sierra Nevada % Tinigua % Munchique % Sanquianga Catatumbo-Bari % Puinawai % El Tuparro Yariguíes % Utría Alto Fragua % Los Picachos % El Cocuy %- Selva de Florencia Farallones Tayrona Rounded Total 5,400 6,100 3,600 3,800 6% 69
72
73 Colombia Regional Analysis In 2007, 68% of coca cultivation in Colombia took place in the coca growing regions of Pacific, Putumayo-Caquetá and Central. The largest increases took place in the Central region (+ 8,822 ha), in Pacific (+ 7,153 ha) located in the corridor between the western range of mountains and the Pacific Ocean coastal region and in Putumayo-Caquetá (+3,910 ha) in the southern part of the country bordering Ecuador. Small decreases took place in Meta-Guaviare (- 855 ha, -4%) and in the Amazonian region (-434 ha, -23%) in the southern part of Colombia and in Sierra Nevada, in the North region of the country. Table 27: Coca cultivation by region (ha), Region % Change % of total 2007 Pacific 17,362 19,561 15,789 17,633 18,807 25, % 26% Putumayo-Caquetá 22,137 14,789 10,888 13,951 17,221 21, % 21% Central 14,829 15,389 15,081 15,632 12,131 20, % 21% Meta-Guaviare 36,603 28,977 28,507 25,963 20,540 19,685-4% 20% Orinoco 7,124 4,357 6,250 9,709 6,829 9, % 10% Amazonia 3,018 2,508 2,588 2,320 1,905 1,471-23% 2% Sierra Nevada , % 0% Rounded Total 102,000 86,000 80,000 86,000 78,000 99, % 100% Figure 24: Coca cultivation by region (ha), ,000 35,000 30,000 Hectares 25,000 20,000 15,000 10,000 5,000 0 Meta- Guaviare Pacific Central Putumayo- Caquetá Orinoco Amazonia Sierra Nevada 71

74 s e Colombia Map 15: Coca cultivation density in the Meta-Guaviare region, Colombia 2007 Antioquia 74 W 72 W Arauca 70 W Santander 6 N COLOMBIA VENEZUELA Boyacá 6 N Caldas ECUADOR PERU BRAZIL Yopal Casanare Bogotá Cundinamarca 4 N Tolima Villavicencio Guamal Acacias Cumaral Villavicencio San Carlos Guaroa Cabuyaro Puerto López Río Meta Puerto Gaitán Río Vichada Vichada 4 N El Castillo San Martín Huila Mesetas Meta Puerto Lleras Mapiripán La Uribe Vista Hermosa Puerto Rico Puerto Concordia Río Guaviare La Macarena San José San José del Guaviare Guainía Río Inírida 2 N Guaviare El Retorno 2 N Calamar Rí o Vau p Miraflores Miraflores Vaupés Mitú 0 Putumayo PERU Río Putumayo Río Caguán Caquetá Río Caquetá 74 W km Geographic coordinates WGS W Amazonas Vaupés Cultivation density (ha/km²) >8 International boundaries Department boundaries Municipality boundaries Roads Meta Guaviare Region 0 70 W Source: Goverment of Colombia - National monitoring system supported by UNODC The boundaries and names shown and the designations used in this map do not imply official endorsement or acceptance by the United Nations 72
75 Colombia Meta-Guaviare region The Meta-Guaviare region was traditionally the largest coca producing region. However, the notorious increase of coca cultivation in the Pacific, Putumayo-Caquetá and Central regions and the decreasing trend of Meta-Guaviare since 2005, dropped this region to the fourth place in Table 28: Coca cultivation in Meta-Guaviare (ha), Department % Change Meta 12,814 18,740 17,305 11,063 10,386-6% Guaviare 16,163 9,769 8,658 9,477 9,299-2% Total 28,977 28,509 25,970 20,540 19,685-4% Annual trend -21% -2% -9% -21% -4% In 2004 and 2005, the department of Meta was the department with the highest level of coca cultivation in Colombia. However, if dropped to the third place in 2007, because of a decrease of 36% in period and 6% in period. The department of Meta contributes 11% of the national coca cultivation area. In 2007, the sprayed area of coca cultivation decreased in this region from 25,900 ha in 2006 to 15,527 ha in Manual eradication also decreased from 5,176 ha in 2006 to 3,768 ha in Between 2005 and 2006, coca cultivation in the department of Guaviare increased from 8,658 ha to 9,477 ha (+9%) and remained rather stable in 2007(-2% or -178 ha). At the same time, aerial spraying decreased from 14,700 ha in 2006 to 11,000 ha in 2007 (-26%) and manual eradication remained stable around 1,100 ha. The fact that the significant reduction in the area under coca cultivation came along with a reduction of the amount of eradication activities could be attributable to the implementation of the Government of Colombia s Consolidation Plan in the Meta-Guaviare region. The primary goals of the plan are to bring security and stability to the region by strengthening the presence of the state and promoting national and international investment in licit agricultural production. Among the fourteen national parks surveyed, the National Park of Nukak, located within Guaviare department, had the largest level of coca cultivation within a protected area (1,370 ha in 2007). This represented an increase of 591 ha (+75%) in 2007 as compared to 2006 and replaced the National Park Sierra La Macarena as the protected area with the largest area cultivated with coca. Guaviare was the department where coca cultivation first appeared in Colombia at the end of the seventies. Since then, coca cultivation remained important in the department. Although a significant decrease was noted in the past few years, this trend was reversed in 2007 when 9,299 ha were detected. Guaviare accounted for 9% of the national total. 73
76 Colombia Map 16: Coca cultivation density in the Pacific region, W 78 W 76 W Sucre Montería VENEZUELA 8 N COLOMBIA PANAMA Córdoba Bolívar 8 N ECUADOR PERU BRAZIL Cultivation density (ha/km²) 6 N >8 Río Atrat o Chocó Antioquia Río Cauca Medellín 6 N International boundaries Department boundaries Roads Pacific Region Quibdó Istmina Manizales Caldas Bogotá 4 N Pacific Ocean Río San Juan Ibagué Cundinamarca 4 N Valle Cali Tolima Huila Neiva Neiva Meta Cauca Popayán Río Magdalena 2 N Tumaco Tumaco R ío Patía Nariño Florencia 2 N ECUADOR Pasto Mocoa Caquetá Puerto Asís Putumayo km 80 W Geographic coordinates WGS W 76 W Río Caguá 0 Source: Government of Colombia - National monitoring system supported by UNODC The boundaries and names shown and the designations used in this map do not imply official endorsement or acceptance by the United Nations 74
77 Colombia Pacific region Nariño is located in the south-western part of the country, at the border with Ecuador. The geographic features of the region include high altitudes, as well as coastline. This contributed to the spread of cultivation of coca bush and opium poppy, as well as the maritime smuggling of illegal drugs and precursor chemicals through the department. Table 29: Coca cultivation in the Pacific Region (ha), Department % Change Nariño 17,628 14,154 13,875 15,606 20, % Cauca 1,443 1,266 2,705 2,104 4, % Choco , , % Valle del Cauca % Total 19,561 15,788 17,633 18,807 25, % Annual trend +13% -19% +12% +7% +38% Coca cultivation in Nariño became significant in 2002, when coca cultivation decreased in the neighboring departments of Putumayo and Caquetá. Between 2001 and 2002, coca cultivation decreased by 40,000 ha in Putumayo and Caquetá, while increasing by 7,600 ha in Nariño. Aerial spraying has been very intensive in Nariño department since 2000, surpassing 30,000 ha in 2003, 2004 and 2007, and reaching a record of 59,900 ha in In addition, 14,984 ha of manual eradication were reported in 2006, almost twice the reported area in Despite of the eradication activities conducted during the period , coca cultivation increased by 4,653 ha. In 2007, coca cultivation was found in 23 of 64 municipalities. With a total of 20,259 ha of coca cultivation, Nariño has the highest amount of land under illicit cultivation with 21% of the total coca cultivation in the country. Even though the department of Nariño shows the largest amount of coca cultivation, the investment in ongoing alternative development programmes continues to be at a low level, about 6.4% of total budget. In Cauca department, the investment maintained a level of 5.8% of the total national. As it is the case with neighboring Nariño department, Cauca has a long coastline, high mountain ranges and a mainly rural economy. Following a period of continuous decrease between 1999 and 2006 interrupted in 2005, the increase in 2007 to almost double the area took place when manual eradication decreased from 4,973 ha in 2006 to 1,884 ha in Although its capital, Cali, was an important centre for narco-trafficking in the nineties, the department of Valle del Cauca always recorded less than 300 ha under coca cultivation, but it showed a dramatic increase in the period from 28 ha in 2005 to 453 ha in
78 Colombia Map 17: Coca cultivation density in the Putumayo-Caquetá region, W Caldas 74 W Boyacá 72 W Istmina Chocó VENEZUELA Manizales Cundinamarca Yopal Casanare COLOMBIA Ibagué Bogotá 4 N ECUADOR PERU BRAZIL Tolima Villavicencio Río Meta 4 N Valle Cali Meta Cauca Popayán Huila Río Magdalena Neiva San José Río Guaviare Río Inírida 2 N 2 N Puerto Rico Guaviare Pasto Nariño Sibundoy San Francisco Santiago Mocoa Mocoa San José Morelia de la Fragua Albania Curillo Florencia Florencia Valparaiso La Montañita Milán El Paujil El Doncello San Vicente del Caguán Río Va upés Miraflores Orito Villa Garzón Puerto Caicedo Valle del Guamuéz San Miguel Puerto Asís Puerto Asís Puerto Guzmán Solita Putumayo Cartagena del Chaira R Caquetá ío Caguán Solano Vaupés 0 0 Puerto Leguizamo Río Caquetá Río Putumayo Amazonas ECUADOR 2 S Cultivation density (ha/km²) 2 S >8 International boundaries Department boundaries Municipality boundaries Roads Putumayo Caquetá Region 76 W PERU km Geographic coordinates WGS W Río Amazonas 72 W Source: Government of Colombia - National monitoring system supported by UNODC The boundaries and names shown and the designations used in this map do not imply official endorsement or acceptance by the United Nations 76

79 Colombia Putumayo-Caquetá region In 2000, coca cultivation peaked in Putumayo department at 66,000 ha, represented 40% of the national total. Following four years of consecutive decreases, coca cultivation in Putumayo was estimated at only 4,400 ha or 5% of the national total in This trend was later reversed. Between 2004 and 2006, coca cultivation increased by 105% in 2005, 37% in 2006, and by 21% in 2007 positioning this department as the second largest in terms of coca cultivation in the country. At the same time, 24,469 ha were manually eradicated which represents an increase of almost five times more than in 2006, while aerial spraying maintained a level of 26,500 ha. Table 30: Coca cultivation in the Putumayo-Caquetá region (ha), Department % Change Putumayo 7,559 4,386 8,963 12,254 14, % Caquetá 7,230 6,500 4,988 4,967 6, % Total 14,789 10,886 13,951 17,221 21, % Annual trend -33% -26% +28% +23% +23% The Government s programme Plan Colombia to fight against illicit drugs was implemented in 2002 in this department, combining actions of interdiction, aerial spraying, manual eradication and important alternative development projects with acceptable results in the period 2002 to However, only 7.6% of the 2007 budget of ongoing alternative development projects went to Putumayo, whereas this amount was 35% in the period. Most of the new coca fields identified in 2007 were re-established on the fields cultivated at the beginning of this decade. The spraying and manual eradication activities in 2007 were particularly intense in this region, but the reseeding and the recovery of old or abandoned coca fields may have compensated their effects. In 2007, in a belt of about 10 km width along the Ecuadorian border that covers about 550,000 ha in the departments of Nariño and Putumayo, 5,200 ha of coca cultivation were found in This represented a decrease of almost 1,900 ha (or 11%) compared to In Caquetá department, coca cultivation peaked at 26,000 ha in 2000 or 16% of the country total. Following intense aerial spraying that started in 1996, coca cultivation decreased to levels around 6,000 ha in the period In 2006, coca cultivation was at its lowest level at 4,967 ha, but it increased by 1,351 ha reaching 6,318 ha in 2007 representing +27% increase, while the aerial spraying has remained as around 5,000 ha since Coca bush in Boyaca, Cundinamarca 77
80 Colombia Map 18: Coca cultivation density in the Central region, W Barranquilla Santa Marta 74 W La Guajira 72 W VENEZUELA COLOMBIA Cartagena Cartagena Atlántico Valledupar Cesar 10 N ECUADOR PERU BRAZIL Magdalena 10 N Río Magdalena VENEZUELA Caribbean Sea Sincelejo Montería Sucre Río Catatumbo Catatumbo Córdoba Bolívar Norte de Santander 8 N NortedeAntioquia Sur de Bolívar Cucutá Cucutá 8 N Bucaramanga Antioquia Río A trato Río Cauca Medellín Santander Arauca 6 N 6 N Chocó Quibdó Boyacá Istmina Caldas Yopal San Juan 4 N Cultivation density (ha/km²) >8 International boundaries Valle Department boundaries Tolima Cali Roads Central Region 76 W Cauca Ibagué Huila Bogotá Cundinamarca Villavicencio Geographic coordinates WGS W Source: Government of Colombia - National monitoring system supported by UNODC The boundaries and names shown and the designations used in this map do not imply official endorsement or acceptance by the United Nations Meta km Casanare Río Meta 4 N 72 W 78
81 Colombia Central region Since 2002, coca cultivation remained stable at around 15,000 ha in the Central region of Colombia. It decreased to 12,131 ha in 2006, but showed a significant increase of 8,822 ha (78%) in At the end of the 1990 s, Norte de Santander department was one of the most important centers of coca cultivation in the country, accounting for 10% of the country total in Since then, the Government has been able to drastically reduce coca cultivation in this department, and in 2006 it dropped to less than 500 ha. However, in 2007, coca cultivation showed a very important increase of 1,458 ha, three times more than the amount recorded in 2006 (488 ha). Table 31: Coca cultivation in the Central Region (ha), Department % Change Antioquia 4,273 5,168 6,414 6,157 9, % Bolivar 4,470 3,402 3,670 2,382 5, % N. Santander 4,471 3, , % Cordoba 838 1,536 3,136 1,216 1, % Santander 632 1, , % Cundinamarca % Boyaca % Caldas % Total 15,389 15,073 15,632 12,131 20, % Annual trend +4% -2% +4% -22% +73% In the department of Bolivar, coca cultivation is concentrated in the South region, known as Sur de Bolivar. Coca cultivation in the department remained relatively stable, accounting for 3% to 8% of the country total in the period In 2007, coca cultivation increased by 136% (or an increase of 3,250 ha), the highest in the last seven years. Whereas the aerial spraying in this department increased by the considerable amount of 4,388 ha (+165%), manual eradication decreased from 1,952 ha in 2006 to 514 ha in 2007 (-74%). In Antioquia, coca cultivation averaged 3,000 ha between 1999 and Coca cultivation has been increasing since 2002, from 3,030 ha to 9,926 ha in 2007 (only in the last year there was an increase of 3,769 ha). This increase over the past five years occurred despite the intensification of aerial spraying, which increase from 3,300 ha in 2002 to 27,000 ha in 2007; In addition, manual eradication was conducted in 6,166 ha. In the department of Caldas, the most important coffee growing area in Colombia, coca cultivation was detected for the first time in 2003 (54 ha). Coca cultivation reached a peak in 2006 with 461 ha and went back to the initial level in In 2007, aerial spraying decreased from 1,068 ha to 284 ha and manual eradication decreased from 552 ha to 424 ha in The department of Cordoba showed an increase of 642 ha in 2007 (+53%). Manual eradication reported in 2007 amounted to 3,141 ha (+47%) and aerial spraying presented a significant increase from 1,800 ha in 2005 to 6,300 ha in The departments of Norte de Santander, Antioquia and Santander received the largest share of alternative development funds in Colombia (the 65% in 2006 and the 58% in 2007). 79
82 Colombia Map 19: Coca cultivation density in the Orinoco region, N Cucutá 72 W VENEZUELA COLOMBIA ECUADOR BRAZIL PERU 70 W 68 W Cultivation density (ha/km²) >8 International boundaries Department boundaries Municipality boundaries Roads Orinoco Region 8 N VENEZUELA Arauca Fortul Saravena Arauquita Arauca Arauca Tame Puerto Rondón Cravo Norte Río Met a Puerto Carreño 6 N 6 N La Primavera Puerto Carreno Río Orinoco Río Tomo Casanare Santa Rosalía Río Vichada Cumaribo 4 N Río Meta Vichada Puerto Inírida 4 N Meta Río Guaviare Guainía Río Inírida Guaviare 2 N 2 N Vaupés km 72 W Geographic coordinates WGS W BRAZIL 68 W Source: Government of Colombia - National monitoring system supported by UNODC The boundaries and names shown and the designations used in this map do not imply official endorsement or acceptance by the United Nations 80
83 Colombia Orinoco region In Vichada department, near the Venezuelan border, coca cultivation peaked at 9,200 ha in 2001 decreasing to 5,523 ha in 2006 and increasing again to 7,218 ha in In Vichada, the most important concentration of coca cultivation can be found between the Tuparro and Vichada rivers in the center of the department. The dispersion of coca cultivation in remote parts of the department increases the time flight and cost of aerial spraying. However, in 2007, a record of 7,193 ha of aerial spraying and 590 ha of manual eradication were reported in this department. Coca cultivation in Arauca was detected for the first time in 2000 with about 1,000 ha. It rose to 2,000 ha in 2001 and 2002 and after a decrease in , it went back to over 2,000 ha in In 2003, aerial spraying amounted to 12,000 ha and coca cultivation dropped to 500 ha in December of that year. However, coca cultivation increased in 2007 reaching 2,116 ha despite the increase of manual eradication of 660 ha and of aerial spraying of 2,695 ha. Table 32: Coca cultivation in the Orinoco region (ha), Department % Change Vichada 3,818 4,692 7,826 5,523 7, % Arauca 539 1,552 1,883 1,306 2, % Total 4,357 6,244 9,709 6,829 9, % Annual trend -39% +43% +56% -30% +37% Coca fields in Arauca 81

84 Colombia Map 20: Coca cultivation in the Amazonia region, N 74 W Santander 72 W Arauca 70 W Río Meta 68 W Puerto Carreño 6 N VENEZUELA Boyacá Cundinamarca BogotáECUADOR PERU COLOMBIA BRAZIL Yopal Casanare Río Vichada Vichada Río Orinoco VENEZUELA 4 N Meta Río Meta Barranco Mina Río Inírida Puerto Inírida Cacahual 4 N San José Río Guaviare Guainía Morichal Nuevo Inirida Puerto Colombia San Felipe 2 N Guaviare Pana Pana 2 N Papunahua Miraflores Mitú Mitú Río Vaupés La Guadalupe Carurú Yavarate 0 Río Caguán Caquetá Pacoa Vaupés La Victoria Río Apap oris 0 Mirití Paraná Río Putumayo Puerto Alegría La Chorrera Río Puerto Santander Amazonas Río Caquetá Taraira La Pedrera BRAZIL Ig ara 2 S El Encanto Parana Puerto Arica 2 S PERU Tarapaca 4 S Cultivation density (ha/km²) >8 International boundaries Department boundaries Municipality boundaries Roads Amazonia Region 74 W 72 W Puerto Nariño Rí o Amazonas Leticia Leticia km Geographic coordinates WGS W 68 W 4 S Source: Government of Colombia - National monitoring system supported by UNODC The boundaries and names shown and the designations used in this map do not imply official endorsement or acceptance by the United Nations 82

85 Colombia Amazonia region As was the case in the Putumayo-Caquetá region, the departments of Vaupes, Amazonas and Guainia belong to the Amazon basin. Although sharing important similarities with Putumayo and Caquetá, these three departments, refered to as Amazon region, have never been important centres of coca cultivation. This is due to the remoteness of the area, as well as to the lack of airport and road infrastructure linking this region to the rest of the country. Consequently, no aerial spraying or manual eradication of coca cultivation was carried out in Coca cultivation continues the trend of slow decrease since it was first observed in Table 33: Coca cultivation in the Amazonia Region (ha), Department % Change Guainía % Amazonas % Vaupés 1,157 1, % Total 2,508 2,588 2,320 1,905 1,471-23% Annual trend -17% +3% -10% -18% -23% Manual eradication (Courtesy Accion Social PCI 83
86 Colombia Sierra Nevada region The Sierra Nevada region, with the departments of Magdalena and Guajira, has never been an important centre of coca cultivation in Colombia. Coca cultivation remained between 500 and 1,300 ha over the last eight years and after three years of decreases reached the lowest level of 365 ha in There were no aerial spraying activities and manual eradication amounted to 777 ha in The region is also an important tourism centre and hosts the Sierra Nevada National Park. The National Park is one of the most important ecological reserves in Latin America, known for its rich bio-diversity and presence of several ancient indigenous cultures. In 2007, coca cultivation amounted to 94 ha in the Sierra Nevada National Park, a decrease of 21% compared to Table 34: Coca cultivation in the Sierra Nevada region (ha), Department % Change Magdalena % Guajira % Total 759 1, % Annual trend -24% +66% -57% -19% -16% Possible areas of new cultivation The survey covered and interpreted 100% of the national territory, including areas previously not known as being coca-growing regions. In doing so it serves as an early warning system to detect and prevent the spread of coca into new areas. In 2007, potential small coca fields were detected in remote areas outside the established agricultural areas of the departments of the Orinoco and Amazon River basins. Field verification has not been carried out in these areas because the verification of small and isolated patches of coca cultivation was considered too time consuming and too costly. Therefore, the estimate for coca cultivation in these areas is presented as indicative and was not included in the final estimate. The 2007 survey analyzed 19 Landsat images looking for vegetation having characteristics similar to coca fields. A total of 531 ha were assessed as possible coca cultivation in new areas. Table 35: Possible coca cultivation in new areas (ha), 2007 Department Area (ha) Vaupes 259 Amazonas 197 Guainia 58 Vichada 10 Caquetá 8 Total
87 Colombia Coca leaf, coca paste and cocaine base production The potential production of fresh coca leaf in Colombia in 2007 was calculated by multiplying each regional area under coca cultivation by their annual yield of fresh coca leaf as determined during the 2005 and 2008 coca leaf yield surveys. The potential production of fresh coca leaf of the area of 31 December 2007 was estimated at 572,800 mt. Assuming 57% moisture content in the leaf, this was equivalent to a total production of 246,300 mt of sun-dried coca leaf in Colombia. In April 2008, SIMCI 12 carried out a survey in Sur de Bolivar, Catatumbo and Sierra Nevada to collect data on fresh coca leaf yield in 2007, agricultural characteristics of coca cultivation practices, as well as data on the transformation process from fresh coca leaf to coca paste or cocaine base. The survey relied on 435 face to face interviews with coca famers and several group discussions. From the analysis of the data collected in the field this year in selected coca growing regions, significant decrease of the fresh coca leaf yield in 2007 as compared to the estimates of 2005 was observed. In Sur de Bolivar, the annual coca leaf yield was estimated at 5,700 kg/ha/year, which is 14% lower than the estimated yield in In Sierra Nevada, the annual coca leaf yield was 2,900 kg/ha/year, which is 46% lower than the estimated yield in In Catatumbo, the annual coca leaf yield was 4,200 kg/ha/year, representing a decrease of 9% as compared to the estimate in The decrease in annual coca leaf yield in these regions are not well known and further research and analysis will be necessary to better understand the reason behind changes in coca leaf yield. Several factors may play role such as changes in agricultural management, change of plant varieties, plant diseases as well as the possible impact of the forced eradication (manual and aerial spraying), part of the anti-drugs campaigns implemented by the Colombian government. Table 36: Regional coca leaf yields and regional coca leaf production in Colombia, 2007 Region Coca cultivation (ha) Annual coca leaf yield kg/ha/year Upper limit 95% confidence interval (kg/ha/year) Lower limit 95% confidence intervals (kg/ha/year) Coca leaf production (mt) Meta-Guaviare 19,685 9,900 9,200 10, ,900 Sur de Bolívar * 19,007 5,700 5,200 6, ,300 Putumayo-Caquetá 21,131 5,600 4,900 6, ,300 Orinoco 9,334 7,100 6,400 7,900 66,300 Pacific 25,960 2,600 2,300 2,900 67,500 Amazonia 1,471 5,600 4,900 6,400 8,200 Catatumbo * 1,946 4,200 3,900 4,600 8,200 Sierra Nevada * 365 2,900 2,600 3,100 1,100 Total/Average 99,000 5,800 4,925 5, ,800 * Coca leaf yields in these regions were determined during the 2008 survey campaign. Meta-Guaviare is the most productive region in the country, accounting for 34% of the total coca leaf production in Colombia. It is followed by Putumayo-Caquetá (21% of the total coca leaf production) and Sur de Bolivar (19%). In terms of area under coca cultivation, the largest area in 2007 was found in Pacific, accounting for 26% of the total area under cultivation in Colombia. 12 By subcontracting an agricultural research agency, The Agricultural Assessments International Corporation (AAIC). Survey took place from March to April
, 2007 12,000 10,000 9,900 Kilograms per hectare 8,000 6,000 4,000 7,100 5,700 5,600 5,600 4,200 2,900 2,600")

88 Colombia The second largest was Putumayo-Caquetá (22%) and Sur de Bolivar and Meta-Guaviare accounts for 20% respectively. Figure 25: Regional annual coca leaf yield framed by their confidence interval (kg/ha), ,000 10,000 9,900 Kilograms per hectare 8,000 6,000 4,000 7,100 5,700 5,600 5,600 4,200 2,900 2,600 2,000 0 Meta- Guaviare Orinoco Sur de Bolívar Putumayo- Caquetá Amazonia Catatumbo Sierra Nevada Pacific In Colombia, traditional use of the coca leaf can be considered marginal, and virtually the entire coca leaf production is destined for cocaine production. There are various ways to produce cocaine. The overall process is that leaves are processed into coca paste, then into cocaine base, then into cocaine hydrochloride. The farmers can either sell the coca leaves, or process these leaves into coca paste or base. The last step, the processing of the cocaine base into cocaine hydrochloride is not carried out by farmers but in clandestine laboratories. Coca paste is the first product obtained in the process of alkaloid extraction from coca leaves using sulfuric acid, salts, and kerosene. Therefore, it becomes cocaine sulfate with a high content of organic remnants, pigments, tannins, and other chemical substances. Cocaine base is obtained by dissolving the cocaine sulphate in an acid and adding an oxidant agent (potassium permanganate being the oxidant most often used in Colombia), then adding a base. The resulting substance is precipitated and filtered. Coca leaves being processed to produce cocaine base in Boyaca 86
89 Colombia The coca leaf yield surveys 13 revealed that 46% of the farmers, representing 27% of the total coca leaf production, sell directly the coca leaves, without processing them. Another 30% of the farmers, who represent 28% of the total coca leaf production, processed them into coca paste, and the remaining 28% of the farmers, who represent 45% of the total coca leaf production, process their leaves into cocaine base. Table 37: Division of labour among coca producers, 2007 Region % of farmers directly selling fresh coca leaves % of farmers processing coca leaves into coca paste % of farmers processing coca leaves into cocaine base Putumayo-Caquetá 32% 65% 3% Catatumbo * 86% 13% 1% Sur de Bolivar * 31% 5% 64% Sierra Nevada * 91% 4% 5% Orinoco 15% 0% 85% Meta Guaviare 9% 26% 65% Pacific 68% 31% 1% All regions 46% 30% 28% * Division of labor in these regions was determined during the 2008 survey campaign. During the survey, the farmers who processed their coca leaves were asked about the amount of coca leaves and ingredients used, and the amount of final product obtained. The distinction between paste and base is not easy to draw because the terms are often misused by the farmers themselves. In order to distinguish between these two products, it was decided to refer to cocaine base when the farmers reported the use of permanganate potassium or ammonium for processing their leaves, and coca paste when the farmers did not report the use of these products. Potential cocaine production The coca yield survey implemented in 2005 and 2008 focused on obtaining data not only on the yield of the fresh coca leaf but also on the transformation process from fresh coca leaf to coca paste or cocaine base. The data on annual coca leaf yield and the conversion rates of coca leaves into coca paste and cocaine base were combined with the area under coca cultivation estimates to determine the total productions of coca leaf, coca paste and cocaine base. To determine conversion rates from cocaine base to cocaine hydrochloride, UNODC relied on a external sources. In fact, investigating clandestine cocaine laboratories was not possible because these laboratories are directly in the hands of narco-traffickers. So far, UNODC did not collect any data to estimate the efficiency of these clandestine laboratories nor on the quantity of cocaine hydrochloride that can be produced from coca paste or cocaine base. In addition to the technical difficulties to obtain these data, this kind of survey is also complicated by the existence of several techniques to produce cocaine hydrochloride, and various purity level of the end-product. Therefore, the UNODC calculation for cocaine production in 2007 relied on its own estimates of cocaine base and on data obtained by the United States Operation Breakthrough regarding the conversion rates from cocaine base to cocaine hydrochloride and the resulting purity level of cocaine hydrochloride for conversion into equivalent of pure cocaine production. 13 Findings refer to the 2008 SIMCI Coca leaf yield in Sierra Nevada, Catatumbo and Sur de Bolivar and to the 2005 SIMCI/DNE coca leaf yield everywhere else. 87
90
91 Colombia US Operation Breakthrough mentioned a 1:1 conversion rate from cocaine base to cocaine hydrochloride. However, this was obtained from laboratories especially set up for this kind of survey, and thus this conversion rate is likely to correspond to ideal circumstances not always obtained in reality, especially by farmers. The same source also communicated to UNODC that cocaine base contained about 75% of pure cocaine alkaloid and the cocaine hydrochloride contained about 85% of pure cocaine alkaloid. From this data, UNODC derived a 1:0.9 ratio from cocaine base to cocaine hydrochloride. This ratio of 1:0.9 was deemed to apply better to the cocaine base production which corresponded to cocaine base obtained from farmers not working in ideal conditions. Since 2002, UNODC estimated the cocaine production in Colombia based on the average area of the two cultivation figures recorded as of December of the previous year and December of the current year. This average area was then multiplied by the estimated yield per hectare for each of the regions in order to obtain the potential coca leaf production. This method enables UNODC to take into account that coca fields are harvested more than once in a given year and eradication activities are spread over several months. Therefore, the average of 2006 and 2006 cultivation areas yields to 525,300 mt of fresh coca leaf, which are equivalent to 783 mt of cocaine base after applying the corresponding conversion factor found during the surveys. This is equivalent to 705 mt of cocaine hydrochloride or 600 mt of pure cocaine. This represented an average pure cocaine yield of 6.6 kg per hectare. Table 38: Regional cocaine base, cocaine hydrochloride and pure cocaine production, 2007 Region Cocaine base (mt) Cocaine hydrochloride (mt) Pure Cocaine (mt) Meta-Guaviare Sur de Bolívar Putumayo-Caquetá Orinoco Pacific Amazonia Catatumbo Sierra Nevada Total
92 Colombia Figure 26: Potential cocaine production in Colombia (mt), Metric tons Production Note: Cocaine production estimates for 2004 and later are not directly comparable with previous years. In 2007, at the global level, the potential cocaine production in Colombia represented 60% of the global potential cocaine production o 994 mt. Table 39: Global potential cocaine production (mt), Change on 2006 Bolivia % Colombia % Peru % Total , % Source: UNODC World Drug Report Note: Production estimates for 2004 and 2005 in Bolivia and in Peru from 2003 to 2005 were revised based on updated information available in Colombian cocaine production estimates for 2004 and later are not directly comparable with previous years. 90
93 Colombia Coca prices Coca leaf, cocaine base and cocaine prices Coca leaf and cocaine paste prices have remained almost unchanged for the last three years in Colombia. Cocaine prices in US dollars have increased by 25%, from an average of US$1,762/kg in 2006 to US$2,198/kg in However, during the last four years the Colombian Peso has strengthened against the dollar by about 32%. As a result of this appreciation, in local currency (Colombian Pesos, COP), prices of cocaine have increased by approximately 10%, from 4,155,000 COP/kg in 2006 to 4,567,000/kg in The changes in prices and purity of drugs are important indicators for the availability of drugs in the market. In 2005, UNODC/SIMCI started the periodic and systematic collection of price data in the first production stages (coca leaf, coca paste and cocaine base). This information is completed with data from the Presidential Programme against Illicit Crops (PCI). The prices of cocaine, cocaine base, morphine and heroin were provided by the antinarcotics police (DIRAN) and were collected by intelligence services in different cities across the country. Most of the peasants sell coca base, which they have produced in small kitchen located in the farm. The processing does not require vast know-how and high level of technology, the latest surveys confirm that in 85% of the cases the peasant does the processing by himself, and only the remaining proportion of farmers hire a cook or chemist to do the processing. The technical know-how was brought to the farmers during the 90 s by drug-traffickers to facilitate and to increase the commercialization of cocaine. The prices of coca in different processing stages (coca leaves and coca paste) may be influenced by the aerial spraying and manual eradication, interdiction and the intervention of illegal armed groups, who often impose their prices and conditions on the farmers. In general, it was observed that repressive interventions of the national army have a significant decreasing impact on the prices due to the unavailability of sellers and resellers, although it does not necessarily affect production. On the other hand, extensive aerial spraying or problems due to adverse climate, pests and diseases could have an increasing impact on the prices. Table 40: Average prices of coca leaf and its derivatives, Product US$/kg % change 2006/ COP/ kg US$/kg 000 COP/ kg US$/kg 000 COP/ kg US$/kg 000 COP/ kg US$/kg 000 COP/ kg Cocaine 1,710 4,600 1,860 4,315 1,762 4,155 2,198 4, % 10% Cocaine base 1,090 2,532 1,038 2,447 1,326 2, % 12% Coca paste 810 2, , , ,959 +7% -5% Coca leaf % - 91
94 Colombia Coca leaf prices In Colombia, coca leaf is traded as fresh, whereas in Peru and Bolivia, coca leaf is traded as sundried. Converted in equivalent sun-dried coca leaf (assuming a moisture loss of 57% from fresh coca leaf to sun-dried coca leaf, as established from the 2004 UNODC survey on coca leaf yield in Peru), coca leaf price in Colombia in 2007 was established at US$ 2.4/kg, which is about the price of sun-dried coca leaf in Peru (US$ 2.5/kg) and lower that the prices registered this year in Bolivia (US$ 4.7/kg). Coca paste prices Prices of coca paste increased by 7%, from the annual average in 2006 of US$ 879/kg to the annual average in 2007 of US$ 943/kg. However, due to the appreciation of the Colombian Peso against the dollar, in local currency, prices of coca paste decreased from the annual average in 2006 of $ 2,070,000 COP/kg to the annual average in 2007 of $ 1,959,000 COP/kg, a reduction equivalent to 5%. The monthly coca paste in 2007 ranged between $ 1,788,000 COP/kg and $ 2,193,000 COP/kg with significant increases towards the end of the year. Variations within a calendar year reflected the anti-drug actions undertaken by the Colombian Government. At regional level, the lowest prices in the across the country in 2007 were recorded in Putumayo- Caquetá region. Here, in average one kilogram of coca paste was trade at $ 1,723,000 COP. In particular, in the Putumayo department, extensive eradication activities were carried out by the Colombian Government; approximately 27,000 ha of coca cultivation were aerial sprayed, and about 24,500 ha of coca cultivation were manual eradicated. The Pacific region recorded the second lowest price of coca paste; one kilogram of coca paste cost $ 1,882,000 COP in This situation occurred despite of the extensive aerial spraying activities, which in 2007 amount to 36,275 ha and 14,812 ha of manual eradication. The Meta-Guaviare region did not show any significant change during the calendar year despite the eradication actions, the average price was $ 2,112,000/kg in 2007 (US$ 1,107/kg). The higher prices were recorded in the Central Region, $ 2,121,000/kg (US$ 1.021/kg). Table 41: Monthly coca paste price in Colombia ('000 COP/kg), 2007 Months National average Central Pacific Putumayo -Caquetá Sierra Nevada Meta- Guaviare January 1,829 2,000 1,400 1,946 1,700 2,100 February 1,788 1,700 1,550 1,800 2,100 March 1,833 1,850 1,500 2,150 April 2,041 2,294 1,908 1,629 2,200 2,175 May 1,841 1,825 1,590 1,800 2,150 June 2,086 2,154 1,733 1,692 2,800 2,050 July 1,913 1,800 1,739 2,200 August 1,997 2,000 1,800 1,586 2,400 2,200 September 1,925 1,933 1,842 2,000 October 1,964 2,050 1,842 2,000 November 2,093 2,300 2,100 1,879 December 2,193 2,300 2,400 1,879 Average COP 1,959 2,121 1,882 1,723 2,117 2,113 Average US$ 943 1, ,019 1,015 92
95 Colombia Figure 27: Average monthly coca paste prices ('000 COP/kg), Dec 1999-Dec ,600 2,400 2, COP 2,000 1,800 1,600 1,400 1,200 Jul-98 Dec-99 Apr-01 Sep-02 Jan-04 May-05 Oct-06 Feb-08 Jul-09 Cocaine base prices The collection of prices data and their analysis is complicated by the absence of standard in naming the products, and in the absence of indications on the quality of the products. This is the case for cocaine base and coca paste, which can easily be confused. However, the data on cocaine base, albeit less frequently reported than the data on coca paste, confirmed that cocaine base is a more refined product than coca paste, and that both products can be traded. There is a difference in price between coca paste and cocaine base due to the complexity and the chemicals added in the production of the latter. The average price of cocaine base in 2007 was $ 2,752,000/kg (US$ 1,326/kg). The highest prices were recorded in the Central region and Sierra Nevada. On average, prices of the cocaine base were 40% higher than the prices of coca paste in Figure 28: Prices of coca paste and cocaine base by region (US$/kg), ,000 2,914 2,650 2,738 2,752 2,500 2,000 2,121 1,882 1,723 2,300 2,200 2,117 2,113 1,959 US$/kg 1,500 1, Centre Pacific Putumayo - Caqueta Coca paste Sierra Nevada Orinoco Meta - Guaviare Cocaine base All regions * Orinoco does not have information on coca paste because the coca is immediately processed into cocaine base. In 2007, cocaine base prices for Putumayo-Caquetá were not available. 93
96 Colombia Cocaine prices Because of the clandestine nature of the trade, cocaine prices are less easily collected than prices of coca paste or coca leaf. This explains that fewer data are available for cocaine prices compared to other products. In Colombia, prices of cocaine hydrochloride are collected by DIRAN (the Anti-Narcotics Police), and refer to wholesale prices in the main cities. Prices may be affected by factors such as supply, anti-drug control measures and purity levels. In connection with the supply, cocaine production has been relatively stable in recent years (average of 600 tons over the past five years). In terms of seizures, after the all-times high record occurred in 2004 and 2005 with 149 and 173 mt respectively, seizures in the past two years remain stable at a total of 127 tons in The purity level was not investigated in this report. The average price of cocaine in the past eight years is $ 4,153,000 COP/kg (US $ 1,711/kg). Between 2006 and 2007 the average price of cocaine increased in COP from $4,155,000 to $4,567,000 per kilogram, equivalent to an increase of 10%. In US dollar, the price rose from $1,762 to $ 2,198 (+25%). There were no significant fluctuations in the calendar year and higher prices were found at the Central Regions and Orinoco. The table below presents the annual averages of cocaine prices since The prices are presented both in Colombian Pesos (COP) and US$ as constant price of 1991 to correct for the inflation. Table 42: Cocaine HCl price in Colombia Income per hectare Year '000 COP/kg US$/kg , ,020 1, ,377 1, ,488 1, ,232 1, ,762 1, ,769 1, ,101 1, ,800 1, ,100 1, ,599 1, ,389 1, ,500 1, ,600 1, ,315 1, ,155 1, ,567 2,198 Source: DIRAN The data from the monthly survey on prices in Colombia combined with the data from the coca leaf yield survey, enabled UNODC to calculate a theoretical income from the sale of coca leaf, coca paste and cocaine base. The differences between these incomes give an indication of the value-added that farmers have if they produce coca paste and cocaine base. The table below shows a definite increase in the value added at each step of the processing. The value-added of cocaine base (+66%), explains why 49% of the coca leaf production was transformed into cocaine base by the farmers. 94
97 Colombia Table 43: Potential annual gross income of coca cultivation for different derivatives of coca leaf (US$/ha), 2007 Derivatives Annual yield Average annual price Annual income in Value-added from coca leaf kg/ha US$/kg US$/ha % Coca leaf 5, ,960 - Coca paste ,581 23% Cocaine base 8.7 1,326 11,536 66% Cocaine HCl 6.6 2,198 14, % Figure 29: Potential annual income per hectare of coca leaf, coca paste, cocaine base and cocaine HCl, , , ,507 12, ,536 US$/ha 10, , , , ,960 8,581 2, Coca leaf Coca paste Cocaine base Cocaine hydrochloride Coca leaf Coca paste Cocaine base Cocaine hydrochloride Based on the total production of each item sold by the farmers and the respective prices in 2007, the total farm-gate income value resulting from coca cultivation was estimated at about US$ 934 million. This value does not take into account the farmers production costs, such as cost of herbicides, pesticides, fertilizers and labor wages. It should also be noted that 47% of this value is made in the Meta-Guaviare region, because of its very high annual yield and high proportion of farmers processing cocaine base. Table 44: Value of the production of coca leaf and its derivatives at farm-gate level, 2007 Product kg US$/kg US$ value Coca leaf 155,492, ,590,400 Coca paste 264, ,952,000 Cocaine base 376,000 1, ,576,000 Rounded total farm-gate value 934,000,000 The total farm-gate value of production of coca leaf and its derivatives, corresponded to 0.5% of the 2007 GDP of Colombia, which amounted to US$ 172 billion according to DANE. In 2007, the total farm-gate value of coca cultivation also represented 5% of the agricultural GDP of Colombia, which was US$ 17.8 billion. 95
98 Colombia The coca leaf yield survey also enabled UNODC to collect data on the average area of coca cultivation by family. It was found that on average, a household cultivates about 1.25 ha of coca plants. With a total area under coca cultivation of 99,000 ha in 2007, the number of family cultivating coca plants was thus estimated at 80,000. Table 45: Number of families involved in coca cultivation in Colombia, 2007 Region Coca cultivation (ha) Persons per family Ha per family Number of families Number of people Meta-Guaviare 19, ,100 86,070 Sur Bolivar 19, ,800 31,177 Putumayo-Caquetá 21, , ,840 Orinoco 9, ,500 11,000 Pacific 25, , ,160 Amazonian 1, ,100 8,820 Catatumbo 1, ,500 7,472 Sierra Nevada ,020 All regions 99,000 80, ,000 Thus, US$ 934 million evenly distributed among 80,000 families represented an annual gross income per family of US$ 11,675. With a total of 383,000 people in these families, this was equivalent to an annual per capita gross income of US$ 2,440. The gross income value does not take into account the production costs, such as cost of herbicides, pesticides, fertilizers and labour wages. Coca fields in Meta 96
99 Colombia Supply reduction Reported forced manual eradication Forced manual eradication is the responsibility of the Presidential Agency for Social Action. It is executed by the Mobile Eradication Groups (GME) which are groups of farmers and former insurgent armed group members with the help of the Anti Narcotics Police (DIRAN) and the national army. The campaigns of forced manual eradication of coca cultivation reached record levels in 2007; 66,805 ha of coca cultivation were manual eradicated in 2007, whereas 43,051 ha were eradicated in Approximately 60% of this year s manual eradication took place in Putumayo (24,462 ha) and in Nariño (14,812). Table 46: Reported forced manual eradication of coca areas by department (ha), 2007 Department Manual eradication % share Putumayo % Nariño % Antioquia % Meta % Córdoba % Santander % Cauca % Norte de Santander % Guaviare % Boyacá 863 1% Choco 834 1% Caquetá 777 1% Cesar 728 1% Arauca 660 1% Vichada 590 1% Magdalena 572 1% Bolívar 514 1% Caldas 424 1% Cundinamarca Amazonas Guainia Valle Guajira Risaralda 33 - Tolima 25 - Huila 3 - Casanare 1 - TOTAL 66, % Reported forced manual eradication of coca areas, by department, 2007 Sources: PCI- Social Action, National Police 97

100 Colombia Manual eradication has a major impact on coca production since the bushes are completely uprooted. Replanting means significant costs for the farmer since it takes about 6 months between planting and the first harvest, moreover with low productivity in the initial stage. However, in some eradicated areas, replanting and new coca plantations have been observed and UNODC recommends in its eradication report 14 to accompany eradication with alternative production projects. Aerial spraying in coca fields in Nariño 14 Report on monitoring and assessment of the manual eradication conducted in 2007 (GME) 98
101 Río Ma gdalena Río Caquetá Colombia Map 22: Forced manual eradication and coca cultivation in Colombia, W 70 W Colombia Caribbean Sea South America Barranquilla La Guajira Cartagena Atlántico Magdalena Cesar PANAMA Sucre Bolívar Córdoba Norte de Santander Cucutá VENEZUELA Arauca 5 N Pacific Ocean Río Atrato Chocó Valle Cali uca Río Ca Medellín Antioquia Caldas Risaralda Quindío Tolima Santander Boyacá Cundinamarca Bogotá Meta Casanare Arauca eta Río M Río Vichada Río Guaviare R Vichada ío Meta Puerto Carreño Río Orinoco 5 N Tumaco Cauca Popayán Huila Florencia na Río Magdale Neiva San José Guaviare Río Inírida Guainía Pasto Nariño Puerto Asís Caquetá Mitú Vaupés Putumayo N 10 N ECUADOR Río P utuma yo Amazonas BRAZIL 5 S Forced manual eradication areas Coca cultivation 2007 International boundaries Department boundaries 75 W PERU km Geographic coordinates WGS 84 Rí o Amazonas Leticia 70 W 5 S Sources: for coca cultivation Government of Colombia - National monitoring system supported by UNODC; for manual eradication areas PCI The boundaries and names shown and the designations used in this map do not imply official endorsement or acceptance by the United Nations 99
102
103 Colombia Reported aerial spraying The Colombian anti-drug strategy includes several measures of control, ranging from aerial spraying, to force or voluntary manual eradication; these measures often times include alternative development and crops substitution programmes. UNODC does not participate in or supervise the spraying activities. All data were received directly from the Anti-narcotics Police (DIRAN). The spraying programme carried out by DIRAN is done through aerial spraying with a mixture of products called Round Up (primarily composed of an herbicide named glyphosate and a surfactant named Cosmoflux and other additives). In late 2002, the National Narcotics Council approved an herbicide concentration of 2.5 liters per hectare for opium poppy and 10.4 litres per hectare for coca, with a view to increasing the spraying effectiveness rate, which was reported as being 91% in The chemical mixture has mainly effect over the leaves and not over the roots or the soil, and therefore the bush can be subject of a prune operation at about one foot over the ground to obtain a renewal of the bush in about six months. In 2007, the spraying effectiveness rate was reported as being 88 %. As shown in the table below, the largest spraying operations in the period has been carried out in Nariño, Putumayo and Guaviare departments. These are the regions where most of the area under coca cultivation can be found in Colombia. In 2007, DIRAN reported a total of 153,134 ha of coca fields sprayed, this represented a decrease of 11% compared with The departments of Nariño, Putumayo and Antioquia presented the highest levels of spraying in this year. Figure 30: Comparison of net coca cultivation and cumulative sprayed and manually eradicated areas (ha), , , ,000 Hectares 90,000 60,000 30, Coca cultivation Aerial spraying Manual forced eradication The cumulative sprayed area is the sum of areas during a given time period (calculated by multiplying the length of flight lines by their width), differs from the effective sprayed area, which disregards the overlap between adjacent sprayed bands and areas sprayed several times in the same calendar year. 101
104 Colombia Table 47: Aerial spraying of coca cultivation by department and year (ha), Sources Environmental Audit of the National Narcotics Bureau Anti-narcotics Police Department Department Nariño - - 6,442 8,216 17,962 36,910 31,307 57,630 59,865 36,275 Antioquia - - 6,259-3,321 9,835 11,048 16,833 18,022 27,058 Putumayo 3,949 4,980 13,508 32,506 71,891 8,342 17,524 11,763 26,491 26,766 Meta 5,920 2,296 1,345 3,251 1,496 6,973 3,888 14,453 25,915 15,527 Guaviare 37,081 17,376 8,241 7,477 7,207 37,493 30,892 11,865 14,714 10,950 Vichada , ,446-5,485 7,193 Bolívar ,581-4,783 6,456 6,409 2,662 7,050 Córdoba ,767 5,588 6,259 Caquetá 18,433 15,656 9,172 17,252 18,567 1,059 16,276 5,452 4,575 5,084 Cauca - 2,713 2, ,308 1,811 3,292 1,536 3,557 Arauca ,734 5,336 2,584 1,400 2,695 Norte Santander - - 9,584 10,308 9,186 13,822 5, ,687 2,683 Santander ,855 2,042 2,146 1,754 Caldas ,090 1, Chocó Valle La Guajira Magdalena , Vaupés Boyacá Cundinamarca Aerial Spraying 66,029 43,112 58,073 94, , , , , , ,135 Net Culitavation (ha) 102, , , , ,000 86,000 80,000 86,000 78,000 99,000 Source: DIRAN Once coca fields are sprayed, it takes approximately six to eight months to recover productive crops when the bushes are pruned or replanted. However, when heavy rain occurs or bushes are washed by the farmers immediately after the spraying, the loss in coca leaf can be reduced and the crop recovers quickly. The sustainability of the eradication efforts depends to a large extent on the real alternatives open to the farmers and to the displacement of the cultivation into new and more remote areas of the country (balloon effect). In order to neutralize or reduce the impact of the aerial spraying, several actions are taken by the farmers such as: to plant coca bushes interspersed with other plants, to apply protective substances on leaves, to wash the leaves, to reduce the size of the fields, to rotate coca crops with other licit crops in the same field, etc. The aerial spraying may cause the loss of one or more harvests, the reduction of productivity or the total loss of crops but it has become clear that the impact varies considerably from one region to another and that it is not the only cause for reduction or loss of coca crops. 102
105

106 Colombia Reported seizures UNODC is not involved in the collection of data on seizures and destruction of laboratories. However, the data provided by the Colombian government are presented here in order to show the existence of possible trafficking corridors and allow for a better understanding of the dynamics that surrounds the drug business. According to DNE, a total of 2,367 clandestine laboratories were destroyed in Out of these, a total of 2,095 corresponded to laboratories processing coca paste or cocaine base, 265 corresponded to laboratories processing cocaine hydrochloride, 4 potassium permanganate, 2 of heroin and one laboratory producing hydrochloride acid. Compared to 2006, it represented an increase of 4% in the number of illegal laboratories dismantled, demonstrating the constant efforts done by the Colombian Government against illicit drug production and cultivation. Figure 31: Number of clandestine laboratories destroyed, , ,000 Illegal laboratories destroyed 2,000 1,500 1, , , , ,000 80,000 60,000 40,000 20,000 Area under coca cultivation Coca cultivation in ha Cland. labs destroyed Illegal laboratory (courtesy DIRAN) 104
107 Colombia In the department of Nariño, among the regions with the largest planted areas of coca cultivation in the country, was where the largest number of laboratories that process coca leaf derivatives (basic paste, cocaine base and cocaine) were detected and destroyed 15. The highest number of cocaine laboratories ( cristalizaderos ) were detected and destroyed in Narino, Norte de Santander, Meta and Valle. Table 48: Illegal laboratories destroyed by department and by drug type, 2007 Department Coca paste/base laboratories destroyed Cocaine laboratories destroyed Heroin laboratorios destroyed Potassium permanganate laboratories destroyed Total Nariño Norte de Santander Meta Putumayo Cordoba Antoquia Vichada Cauca Valle Bolivar Guaviare Magdalena Amazonas Caquetá Boyaca Cesar Atlantico Santander Choco Cundinamarca Guainia 6 6 Arauca 5 5 Caldas 5 5 La Guajira Risaralda 2 2 Total 2, ,366 Source: DNE Data provided by the National Narcotics Bureau (DNE) show stable trend between 2006 and 2007 in terms of cocaine seizures (126,641 kg of reported seizures of cocaine in 2007 and 127,326 kg of reported seizures of cocaine in 2006). Most of the seizures happened in the Pacific region, in the departments of Choco, Valle, Nariño and Cuaca. 15 It is important to associate this with its strategic position due to its proximity to the Pacific Ocean. 105
108
109 Colombia Table 49: Reported seizures of illicit drugs, Drug unit Coca leaf kg 638, , , , ,544 1,064,500 Coca paste kg 974 2,368 1,218 2,651 5, Cocaine base kg 22,615 27,103 37, ,491 42,708 33,882 Cocaine hydrochloride kg 95, , , , , ,641 Opium latex kg , Morphine kg Heroin kg Raw cannabis kg 76, , , ,795 93, ,684 Synthetic drugs unit 175,382 5,042 19, ,724 7,888 1,968,857 Source: DNE Table 50: Reported seizures of cocaine on the Pacific and Atlantic routes (kg), Region Pacific 43,435 47,137 46,128 61,042 61,758 61,423 Atlantic 16,065 23,157 30,928 35,856 14,150 9,235 Total seized on sea 59,500 70,294 77,056 96,898 75,908 70,658 Total seizures 95, , , , , ,641 % of seizures on sea 62% 62% 52% 56% 60% 56% Source: Colombian Navy, Intelligence Division The Pacific Corridor continues to be the most commonly used route for drug transport (56% of seizures take place at sea). In connection, heroin seizures showed an increase of 21% over the previous year, going from 442 to 537 kg, which equals to 38% of the potential production of heroin. These were seized mostly in the Central Region (58%) and Pacific Region (15%). Figure 32: Reported seizures of cocaine on the Pacific and Atlantic routes (kg), ,000 60,000 50,000 40,000 kg 30,000 20,000 10, ,435 16,065 47,137 23,157 46,128 30,928 61,042 35,856 61,758 14,150 61,423 9, Pacific Atlantic 107
110 Colombia 108
111 Peru PART 4. PERU COCA CULTIVATION SURVEY 109
112 Peru Back of divider Part 4 Peru 110
113 Peru FACT SHEET Peru Coca Survey for 2007 Change 2006 on 2006 Coca cultivation 51,400 ha +4% 53,700 ha Of which in Alto Huallaga 17,100 ha +1% 17,200 ha 2007 Apurímac-Ene 15,800 ha +1% 16,000 ha La Convención-Lares 12,700 ha +1% 12,900 ha Elsewhere 5,800 ha +31% 7,600 ha Weighted average sun-dried coca leaf yield 2,200 kg/ha 0% 2,200 kg/ha Potential production of sun-dried coca leaf ,100 mt +2% 116,800 mt Potential production of cocaine HCl 280 mt +4% 290 mt In% of global production 28% 29% Average farm-gate price of sun-dried coca leaf US$ 2.5/kg 0% US$ 2.5/kg Average farm-gate price of coca paste US$ 551/kg +9% US$ 600/kg Average price of cocaine HCl in producing regions* US$ 825/kg +3% US$ 851/kg Potential farm-gate value of sun-dried coca leaf US$ 285 million +2% US$ 292 million Farm-gate value of coca leaves as % of GDP % 0.4% Reported eradication of coca cultivation* 12,688 ha -5% 12,072 ha Reported seizure of sun-dried coca leaves* 1,067 mt +74% 1,858 mt Reported seizure of coca paste* 5,044 kg +24% 6,260 kg Reported seizure of cocaine HCl* 14,749 kg -45% 8,119 kg * As reported by the Government. 16 Includes all coca leaf potentially produced. For the calculation of coca leaf available for cocaine production, 9,000 mt of sun-dried coca leaf were deducted from this figure, which, according to Government sources, is the amount used for traditional purposes. 17 GDP of the respective year as reported by the Government. 111
114 Peru ABBREVIATIONS CADA CONTRADROGAS CORAH DEVIDA DIRANDRO ENACO GIS GPS HCl ICMP NAS OFECOD UNODC ACKNOWLEDGEMENTS Alternative Development Assistance Body Committee for the Fight Against Drug Consumption Control and Reduction of Coca Leaf in Alto Huallaga National Commission for Development and Life without Drugs Anti-Drugs Directorate, Peruvian National Police National Coca Enterprise Geographical Information Systems Global Positioning System (cocaine) hydrochloride UNODC Illicit Crop Monitoring Programme Narcotics Affairs Section, United States Embassy Drug Control Office, Peruvian Ministry of Interior United Nations Office on Drugs and Crime The following organizations and individuals contributed to the implementation of the 2007 coca cultivation survey in Peru, and to the preparation of the present report: Government of Peru: National Commission for Development and Life without Drugs (DEVIDA) UNODC: Humberto Chirinos, Project Coordinator, Peru Paloma Lumbre, Digital Classification, Cartography and GIS Specialist, Peru Aldo Gutarra, Multi-spectral Analysis Specialist, Peru Germán Galvez, Surveying, Cartography and GIS Specialist, Peru Lorenzo Vallejos, Digital Classification, Cartography and GIS Specialist, Peru Victor Rojas, Photo-Interpretation and Cartography Specialist, Peru Carlos Coello, Cartographic Technician, Peru Flavio Mirella, UNODC Representative for Peru and Ecuador Coen Bussink, Remote Sensing and GIS Expert, Statistics and Survey Section, Vienna Anja Korenblik, Programme Management Officer, Studies and Threat Analysis Section, Vienna Angela Me, Chief, Statistics and Survey Section, Vienna Martin Raithelhuber, Programme Officer, Statistics and Survey Section, Vienna Javier Teran, Statistician, Statistics and Survey Section, Vienna Unless otherwise specified, all figures presented in this report come from the respective national Governments in the context of national monitoring systems supported by UNODC. Photo credits: UNODC Peru or otherwise indicated. The implementation of UNODC s Illicit Crop Monitoring Programme in the Andean countries and the Peru survey in 2007 was made possible thanks to financial contributions from the Governments of Austria, Colombia, France, the United States of America, and from the European Commission. This report and other ICMP survey reports can be downloaded from: 112
115 Peru CONTENTS 1 INTRODUCTION FINDINGS COCA CULTIVATION REGIONAL ANALYSIS Alto Huallaga Apurimac-Ene La Convención-Lares Other cultivation regions PRODUCTION OF COCA LEAF AND DERIVATES PRICES FOR COCA LEAF AND DERIVATES REPORTED ERADICATION REPORTED SEIZURES
116
117 Peru 1 INTRODUCTION In response to the decisions of the 1998 United Nations General Assembly Special Session on Drugs, UNODC developed and implemented a global Illicit Crop Monitoring Programme (ICMP). Through this programme, UNODC supports Member States in establishing a crop monitoring system to monitor illicit cultivation of coca, opium poppy and cannabis. The Programme is currently operating in Afghanistan, Bolivia, Colombia, Laos, Morocco, Myanmar, and Peru. In 1998, UNODC started working with DEVIDA to develop a national coca monitoring system in Peru. Using aerial photography, the project produced a detailed mapping (at 1:20,000 scale) of all the coca cultivation areas in Every year since then, satellite images were used to update the estimates. This report presents the findings of the 2007 Survey. In Peru, the General Law on Drugs enacted in 1978 prohibits the cultivation of coca and seedlings in new areas within the national territory. This reference to cultivation includes the grafting and renovation of existing coca bushes. In 1978, another law established the National Coca Enterprise (ENACO), which has a monopoly on the commercialization and industrialization of the coca leaves. Therefore, the selling of coca leaves to any party other than ENACO is considered illicit by national law. The Government also established in 1996 a Committee for the Fight Against Drug Consumption (CONTRADROGAS), renamed National Commission for Development and Life without Drugs (DEVIDA) in DEVIDA s objectives are to design, coordinate and implement policies and activities aimed at national drug control. Until the mid-1990s, Peru was the world s main coca cultivating country. Today, it is the second major producer of coca behind Colombia. The reduction in coca cultivation in Peru in the mid-1990s was linked to the sharp decline in both the coca leaf prices and the demand for Peruvian coca leaf. In 1995, trade in coca leaf on the local market ceased and, from 1996 to 1998, the prices of coca leaf remained lower than its production costs. Farmers abandoned their coca fields and coca cultivation dropped from 115,300 ha to 38,700 ha, or 66%, between 1995 and After 1999, coca prices increased slowly while the prices of licit crops (coffee and cacao) decreased. Farmers started to re-activate their abandoned coca fields and coca cultivation rose again in Peru. To some extent, the increase has been contained by the presence of alternative development projects, as well as the introduction of eradication measures, which include both forced eradication conducted by CORAH (Ministry of Interior) and voluntary eradication schemes conducted by DEVIDA. The recent stabilization of coca leaf prices and the increase of prices for licit alternative crops may also contribute to curb the expansion of coca cultivation observed in recent years. 115
118
119 Peru 2 FINDINGS Coca cultivation In 2007, coca cultivation in Peru increased by 4% and amounted to 53,700 ha. Despite having experienced the second consecutive increase in two years, coca cultivation remained well below the levels registered in the mid 1990s, when Peru was the world s largest cultivator of coca bush. However, Peru remains the world s second largest coca cultivating country behind Colombia. Figure 33: Coca cultivation in Peru (ha), 1997 to ,000 70,000 60,000 Hectares 50,000 40,000 30,000 20,000 10, US State Department National Monitoring System supported by UNODC Regional analysis Overall, coca cultivation in the three largest regions, which together represented 86% of the total area under coca bush, remained relatively stable and increased only marginally in In Alto Huallaga, the largest cultivating region, the expansion of coca areas in some parts was balanced off by eradication of coca fields in other parts of that region, resulting in a small overall increase of around 100 ha. The coca area in both Apurímac-Ene and La Convención-Lares grew by around 200 ha each, an increase of about 1%. It is believed that coca leaf produced in Alto Huallaga and Apurímac-Ene is directed towards narco-trafficking, while the production of La Convención-Lares is mainly marketed for traditional purposes. 117
120 Peru In 2007, the smaller coca cultivating regions contributed much more to the overall increase both in absolute terms (plus 1,800 ha) and proportionally. Inambari-Tambopata, a coca region close to the border with Bolivia, increased significantly, by 21% or about 500 ha, and amounted to 2,900 ha. This is the third consecutive increase in three years. The small and partly new coca cultivation areas in the North and North East of the country increased moderately but continued to constitute only a small proportion of the overall coca bush area in the country. There is evidence of a reactivation of old coca fields in Alto Chicama, a traditional coca growing area where coca fields had been abandoned years ago. Figure 34: Coca cultivation by region, 2007 Apurímac - Ene 30% La Convención - Lares 24% Alto Huallaga 32% Inambari - Tambopata 5% Aguaytía 3% Other 6% Marañon, Putumayo, Amazonas 2% San Gabán 1% Palcazú - Pichís - Pachitea 2% Alto Chicama 1% Table 51: Coca cultivation by cultivation region (ha), 2001 to 2007 Region Change on 2006 Alto Huallaga 14,481 15,286 13,646 16,900 16,039 17,080 17,217 1% Apurímac-Ene 12,600 14,170 14,300 14,700 15,530 15,813 16,019 1% La Convención-Lares 13,980 12,170 12,340 12,700 12,503 12,747 12,894 1% Inambari-Tambopata 2,520 2,430 2,260 2,000 2,250 2,366 2,864 21% Aguaytía 1,051 1, ,570 1,610 3% Palcazú-Pichís-Pachitea , % Marañón, Putumayo, Amazonas 1,250 1, ,065 10% San Gabán , % Alto Chicama n.a. Rounded Total 46,200 46,700 44,200 50,300 48,200 51,400 53,700 4% 118


121 Peru Alto Huallaga The Alto Huallaga region is located on the eastern side of the Andes mountain range, in the high tropical or subtropical forests of the departments of San Martin and Huamuco. In this region, coca bush is cultivated between 400 and 1,400 meters above sea level. For a forth consecutive year, Alto Huallaga was the largest coca cultivating region in Peru, and accounted for almost one third of the total area under coca cultivation. Overall, the area under coca bush increased only slightly by less than 1% over Steep slopes with coca fields in Ongón, Alto Huallaga Despite this seemingly stable picture, the situation in Alto Huallaga was rather dynamic in The disparity widened between the shrinking coca cultivation in the northern part and dense, expanding coca cultivation in the southern part. In the northern and central part of the region, the area under coca bush decreased by over 900 ha as a result of intense eradication activities and the availability of alternatives, which contributed to preventing farmers from re-planting their eradicated fields with coca. A sizeable portion of the farming population seems to have adopted the cultivation of licit crops such as oil palm, cacao and palmito (heart of palm) among others. It is noteworthy that in 2007 in northern Alto Huallaga prices for cacao increased by 50% and for coffee by 15% over 2006, while coca leaf prices decreased over the same period. However, the coca area in the southern part increased by over 1,000 ha, resulting in a net growth of around 100 ha. The largest expansion in absolute terms took place in the southern most areas of Monzón and Tulumayo with 398 and 442 ha respectively. Agriculture in Monzón is almost exclusively directed towards coca cultivation. Together, these two areas constituted over 83% or 14,400 ha of the total coca area in Alto Huallaga. No eradication was reported in these areas in Alternative livelihood projects are almost non-existent and access to law enforcement and government representatives in general is difficult, which hinders development activities in this part of the region. The Ongón area in the northwest of Alto Huallaga along the Mishollo river was again included into the survey in The roughly 400 ha identified in 2001 were reported eradicated in 2002, and no changes were observed until 2005/2006. According to field observations, some former coca fields have been reactivated, and in 2007, 86 ha of coca were identified. 119


122 Peru Clearings for coca fields in Monzón, Alto Huallaga Dense coca fields in Monzón, Alto Huallaga 120
123
124 Peru Apurímac-Ene The Apurímac-Ene cultivation region is situated in the central part of the country extending over 12,000 sq km in the valleys of the rivers Apurímac and Ene, among the departments of Ayacucho, Cusco and Junin. The relief is uneven, and coca cultivation takes place at altitudes ranging between 550 and 2,000 meters above sea level. In 2007, Apurímac-Ene remained the second largest coca cultivating region in Peru, trailing closely behind Alto Huallaga. Over the past six years, the coca cultivation area has grown slowly but steadily, from 14,170 ha in 2002 to just over 16,000 ha in Due to its high yields, which lie over the national average, the region can be considered to be the single largest coca leaf producer in Peru. Coca leaf production is thought to be almost entirely destined for cocaine production. Similar to parts of Alto Huallaga, the political atmosphere in Apurímac-Ene was very tense in No eradication activities were reported from Apurímac-Ene but interdiction activities against narco-trafficking and cocaine production took place. Trafficker seems to use frequently groups of porters, each carrying 10 to 15 kg, to transport drugs out of the region. These groups have armed protection and use a network of footpaths, which is difficult for police to monitor. It should be noted that the region, besides being the major coca leaf producer, is also a major producer of coffee and cacao. It remains to be seen whether the recent price increase experienced by these licit crops will continue to prevent further expansion of coca cultivation in the region or even contribute to a reduction. Sun-drying of coca leaf, Apurímac 122
125


126 Peru La Convención-Lares La Convención-Lares, the third largest coca cultivating region in Peru, is situated in the department of Cusco. Coca is mostly cultivated between 800 and 2,000 meters above sea level on the steep mountain slopes of this region. In 2007, almost 12,900 ha of coca fields were identified. Almost the entire coca leaf production is thought to be destined to traditional use. Since 2001, the area under coca bush has been relatively stable. The variations are thought to be due to the practice of pruning the coca bushes periodically after about three to four years rather than an increasing or decreasing area under coca cultivation. Freshly pruned coca fields are not captured with the current survey methodology, since these fields cannot be identified as coca on the satellite images used for the survey. Coca farmer tending his field, La Convención-Lares It is believed that coca leaf production from the region is mainly oriented towards traditional uses like chewing, and not towards narco-trafficking. There were no reports of eradication nor destruction of maceration pits or clandestine laboratories in this region. 124
127
, Putumayo (close to the Colombia border) and Amazonas (Caballococha) remained relatively stable in 2007.")

128 Peru Coca fields in La Convención-Lares Other cultivation regions The area under coca in the cultivation regions of Aguaytía increased only slightly in The area under coca bush in Marañón (situated in the northern part of the Peruvian Andes), Putumayo (close to the Colombia border) and Amazonas (Caballococha) remained relatively stable in Amazonas, which was included into the survey for the first time in 2006, is a lowland forest area characterized by planes and a slightly undulating landscape. The area is located in the northeastern corner of Peru in the border triangle with Colombia and Brazil close to Leticia in Colombia and Tabatinga in Brazil. Inambari-Tambopata and San Gabán Inambari-Tambopata is the largest of the smaller coca cultivation regions. It is located in the East of the country close to the border with Bolivia. In 2007, 2,894 ha of coca fields were identified, an increase by 21% over The region has access to a highway leading to Bolivia, where coca leaf prices are generally considerably higher than in Peru. The area under coca cultivation in San Gabán increased only slightly in Palcazú-Pichís-Pachitea The valleys of the rivers Palcazú, Pichís and Pachitea are situated in the province of Oxapampa in the department of Pasco. The landscape is predominantly hilly, alternating with flat areas. Coca cultivation is found between 300 and 500 meters altitude. In 2007, the region experienced the largest increase in coca cultivation area in both percentage and absolute terms, from 426 ha in 2006 to 1,147 ha in However, this is still much below the level reported from the early 1990s. 126


129 Peru Recent forest clearing with new coca field, Pichís-Palcazú Alto Chicama For the first time, in 2007, the region of Alto Chicama was included in the survey. Alto Chicama is located in the department of La Libertad where coca is mainly cultivated between 800 and 1,500 m altitude. Cultivation was directed towards producing coca leaves for chewing, and mine workers constituted an important consumer base in the region. Several years ago, the coca fields were abandoned, and cultivation of grapes gained more prominence. Recently, some coca fields have been reactivated. However, these plantations are relatively old, show a low plant density, and some coca bushes may be more than 30 years old. A relatively low coca leaf yield can therefore be expected. Old coca bush in Alto Chicama 127

130 Peru Coca field in Alto Chicama Production of coca leaf and derivates UNODC continuously tries to refine its estimation of coca leaf yields and cocaine production. Due to the problematic security situation in many cultivation regions, access was difficult or impossible, and systematic coca leaf yield studies have not been conducted since However, results obtained in a selective and non-random research for the main cultivation areas indicate no major changes in coca leaf yield. The regional coca leaf yield estimates for the main coca cultivation regions Apurímac-Ene, Alto Huallaga and La Convención-Lares established by UNODC in 2004 are therefore used to estimate the total coca leaf production in For the other regions, information obtained previously by UNODC in the years 2000 and 2001 was used. The total production of sun-dried coca leaf in Peru was estimated at 116,800 mt in This corresponds to a national weighted average of about 2,200 kg/ha sun-dried coca leaf. The coca leaf production in 2007 was 2% higher than in 2006 (114,100 mt). According to a study of the National Institute of Statistics and Computer Science (INEI), 9,000 mt of sun-dried coca leaf are used for traditional, commercial and industrial purposes in Peru annually. 18 For the calculation of the amount of coca leaf available for cocaine production, this amount was deducted from the total of 116,800 mt in Based on updated information available on conversion rates established by the "Operation Breakthrough", conducted by the United States in 2003 and 2004, 375 kg of sun-dried coca leaf are necessary to produce one kilogramme of cocaine HCl of 100% purity. Applying this rate to the remaining 107,800 mt of sun-dried coca leaf available for cocaine production, 290 mt of cocaine HCl can be produced. Therefore, the total potential production of cocaine HCl was estimated at 290 mt in "Encuesta nacional sobre consumo tradicional de hoja de coca en los hogares", INEI-DEVIDA, November

131 Peru Figure 35: Potential cocaine production (mt), 1997 to Metric tons Production Prices for coca leaf and derivates While prices of coca leaf and derivatives had fallen between 2005 and 2006, prices were stable or increased slightly between 2006 and On average, farm-gate prices for sun-dried coca leaf remained unchanged at US$ 2.5/kg in Seasonal variation and regional price differences continue to exist. Inambari-Tambopata, a region en route to Bolivia where coca leaf is traded at a higher price level, had the highest average price of US$ 3.1/kg, while the lowest average price (US$ 2.0/kg) was recorded in Apurímac, a large, centrally located coca region linked to cocaine production. Maceration pit for coca leaves (courtesy DEVIDA) 129
132 Peru Figure 36: National average farm-gate price of sun-dried coca leaf (US$/kg), 1990 to US$/kg Coca leaf prices differ considerably between regions. This is not surprising considering the fact that transport of the bulky coca leaf between regions is costly and risky due to law enforcement activities. The monthly fluctuations in coca leaf prices are thought to be the result of seasonal variations in the supply of coca leaf. Eradication efforts as well as market disruptions due to law enforcement activities, which cause traffickers to leave some regions temporarily, also play a role. Table 52: Farm-gate price of sun-dried coca leaf by region (US$/kg), 2005 to 2007 Region % change Alto Huallaga: Monzón % Alto Huallaga: South % Alto Huallaga: North % Apurímac % Inambari % Aguaytía % National average % Unlike coca leaf prices, the price for coca paste increased on average by 9% from US$ 551/kg in 2006 to US$ 600/kg in 2007, mainly due to a steep rise in the last quarter of the year. Despite this increase, the average price of coca paste remained at a lower level than in 2004 and The wholesale price of cocaine in production regions increased only slightly by 3% from US$ 825/kg in 2006 to US$ 851/kg in As the Peruvian sol strengthened against the US dollar in the course of the year 2007, the meaning of these price increase is not yet clear. 130
 0.")

133 Peru Figure 37: Monthly average farm-gate prices of sun-dried coca leaf and coca paste (US$/kg), Jan to Dec US$/kg (coca leaf) US$/kg (coca paste) 0.0 Jan-2003 Jan-2004 Jan-2005 Jan-2006 Jan Sun-dried coca leaf Coca paste (pasta básica de cocaína lavada) Reported eradication Eradication of coca bush, which in Peru is done manually, decreased slightly but remained at the relatively high level of over 12,000 ha. In 2007, the Government reported a total of 12,072 ha of eradication, of which 11,056 ha were forced eradication and 1,016 ha voluntary self-eradication. Eradication activities were intense in the northern parts of Alto Huallaga, were a significant reduction of the area under coca cultivation was achieved. There are indications that eradicated fields in this area have not been replanted with coca, and that the production of licit crops has increased. This increase was supported by alternative livelihood projects but also benefitted from prices increases for products such as palm oil and cacao. In some coca cultivation regions, such as Monzón in the southern part of Alto Huallaga or Apurímac-Ene, no eradication was carried out, due to the problematic security situation in these areas. Eradication of coca in protective clothing for fear of mines (courtesy DEVIDA) 131
GLOBAL ILLICIT CULTIVATION OF COCA BUSH AND PRODUCTION OF COCA LEAF AND COCAINE, CULTIVATION (a) OF COCA BUSH IN HECTARES
 OF COCA BUSH IN HECTARES") 3.1. Production: Opium/heroin 3.2. Coca/ Cocaine GLOBAL ILLICIT CULTIVATION OF COCA BUSH AND PRODUCTION OF COCA LEAF AND COCAINE, 1990-2005 1990 1991 1992 1993 1994 1995 1996 1997 1998 1999 2000 2001 2002
3.1. Production: Opium/heroin 3.2. Coca/ Cocaine GLOBAL ILLICIT CULTIVATION OF COCA BUSH AND PRODUCTION OF COCA LEAF AND COCAINE, 1990-2005 1990 1991 1992 1993 1994 1995 1996 1997 1998 1999 2000 2001 2002
PART 3. BOLIVIA COCA CULTIVATION SURVEY
 PART 3. BOLIVIA COCA CULTIVATION SURVEY FACT SHEET BOLIVIA COCA SURVEY FOR 2005 2004 Variation on 2004 Bolivia Coca Survey for 2005 2005 Coca cultivation 27,700 ha - 8 % 25,400 ha Of which in the Yungas
GLOBAL ILLICIT CULTIVATION OF COCA BUSH AND PRODUCTION OF COCA LEAF AND COCAINE, CULTIVATION (a) OF COCA BUSH IN HECTARES
 OF COCA BUSH IN HECTARES") 5.2 Production: Coca/Cocaine 5.2. Coca/ Cocaine GLOBAL ILLICIT CULTIVATION OF COCA BUSH AND PRODUCTION OF COCA LEAF AND COCAINE, 1990-2004 1990 1991 1992 1993 1994 1995 1996 1997 1998 1999 2000 2001 2002
5.2 Production: Coca/Cocaine 5.2. Coca/ Cocaine GLOBAL ILLICIT CULTIVATION OF COCA BUSH AND PRODUCTION OF COCA LEAF AND COCAINE, 1990-2004 1990 1991 1992 1993 1994 1995 1996 1997 1998 1999 2000 2001 2002
June 2006 COCA CULTIVATION IN THE ANDEAN REGION. A survey of Bolivia, Colombia and Peru. Government of Peru. Government of Colombia
 COCA CULTIVATION IN THE ANDEAN REGION A survey of Bolivia, Colombia and Peru June 2006 Government of Bolivia Government of Colombia Government of Peru UNODC's Illicit Crop Monitoring Programme (ICMP) promotes
ONDCP August Cocaine. Smuggling
 ONDCP-01-07 August 2007 Cocaine Smuggling in 2006 Produced by the Office of National Drug Control Policy Cocaine Smuggling in 2006 The counterdrug community estimates that between 530 and 710 metric tons
June 2006 COCA CULTIVATION IN THE ANDEAN REGION. A survey of Bolivia, Colombia and Peru. Government of Peru. Government of Colombia
 COCA CULTIVATION IN THE ANDEAN REGION A survey of Bolivia, Colombia and Peru June 2006 Government of Bolivia Government of Colombia Government of Peru UNODC's Illicit Crop Monitoring Programme (ICMP) promotes
ABBREVIATIONS ISSN
 ABBREVIATIONS COP DANE DEA DIRAN DNE DNP GME IGAC ICMP INCB IDB NNPS OAS PDA PCI RSS SIMCI UNODC USAID US$ mt Colombian Pesos National Department of Statistics US Drugs Enforcement Administration Colombian
EUROPEAN COMMISSION DIRECTORATE-GENERAL HUMANITARIAN AID AND CIVIL PROTECTION - ECHO
 EUROPEAN COMMISSION DIRECTORATE-GENERAL HUMANITARIAN AID AND CIVIL PROTECTION - ECHO Monthly report number 2013/10 Month OCTOBER Country South America (except Colombia for HA) Date of submission 08/11/13
Annual Coca Cultivation Survey 2001
 PERU UNDCP Annual Coca Cultivation Survey 2001 Illicit Crop Monitoring System Peru Country Office Peru March 2002 I. SUMMARY Illegal coca cultivation in Peru has registered significant changes in its dynamic
Economic climate in Latin America improved slightly, despite worsening in Brazil
 August 13 th APRIL/2015 Ifo/FGV Economic Climate Index for Latin America 71 74 JULY/2015 Economic climate in Latin America improved slightly, despite worsening in Brazil The Ifo/FGV Economic Climate Index
International economic context and regional impact
 Contents I. GDP growth trends in Latin America and the Caribbean in 2012 II. Regional performance in 2012: Inflation, employment and wages External sector Policies: Fiscal and Monetary III. Conclusions
Benchmarking Travel & Tourism in United Arab Emirates
 Benchmarking Travel & Tourism in United Arab Emirates How does Travel & Tourism compare to other sectors? Summary of Findings, November 2013 Sponsored by: Outline Introduction... 3 UAE summary...... 8
Benchmarking Travel & Tourism in Russia
 Benchmarking Travel & Tourism in Russia How does Travel & Tourism compare to other sectors? Sponsored by: Summary of Findings, November 2013 Outline Introduction... 3 Russia summary..... 8 Data sources
5th NAMIBIA TOURISM SATELLITE ACCOUNT. Edition
 5th NAMIBIA TOURISM SATELLITE ACCOUNT Edition PREFACE I am pleased to present to you the 5 th edition of the Tourism Satellite Account (TSA). TSA is an accounting framework and economic statistical tool
Why Colombia Investment Environment & Business Opportunities
 Why Colombia Investment Environment & Business Opportunities Tobias Meurer Mai 2017 Table of Content 1. Recent Macroeconomic Developments 2. Investment Environment 3. Export Platform 4. Wood processing
Benchmarking Travel & Tourism in Colombia
 Benchmarking Travel & Tourism in Colombia How does Travel & Tourism compare to other sectors? Summary of Findings, November 2013 Sponsored by: Outline Introduction... 3 Colombia summary..... 8 Data sources
Councils get more resources. Bs Millions. Are resources that Councils in Cochabamba recieved in (2011)
") Councils get more resources Bs1. Millions Are resources that Councils in Cochabamba recieved in (0) Fiscal Surplus For six consecutive years, Bolivia generates more income than it spends it means has fiscal
Councils get more resources Bs1. Millions Are resources that Councils in Cochabamba recieved in (0) Fiscal Surplus For six consecutive years, Bolivia generates more income than it spends it means has fiscal
Sugar Cane production in both Haiti and the DR are down. New markets could restore production to historic levels.
 Sugar Cane production in both Haiti and the DR are down. New markets could restore production to historic levels. Sugar Cane Production in Haiti and the DR Dominican Republic 25 Haiti 2 15 1 Hectares Harvested
Horticulture trade intelligence. A custom report compiled for Hort Innovation by Euromonitor International. Avocado. Quarter 1: January to March 2017
 Horticulture trade intelligence A custom report compiled for Hort Innovation by Euromonitor International Avocado Quarter 1: January to March 217 Horticulture trade intelligence: Avocado: 217: Content
United Kingdom. How does Travel & Tourism compare to other sectors? GDP. Size. Share. UK GDP Impact by Industry. UK GDP Impact by Industry
 United Kingdom Stonehenge in Wiltshire Agriculture Automotive Banking Chemicals Communications Education Financial Mining Other Service Manufacturing Manufacturing Services Exports Retail (without wholesale)
COLOMBIAN: RECENT DEVELOPMENTS
 COLOMBIAN: RECENT DEVELOPMENTS Why do business in Colombia? Strategic geographic location: easy access to the North American, European, Asian and Latin American markets. Macroeconomic stability: economic
INTEGRATION AND TRADE IN THE AMERICAS
 INTER-AMERICAN DEVELOPMENT BANK Department of Integration and Regional Programs Division of Integration, Trade and Hemispheric Issues Institute for the Integration of Latin America and the Caribbean Statistics
Mexico. How does Travel & Tourism compare to other sectors? GDP. Size. Share. Mexico GDP Impact by Industry. Mexico GDP Impact by Industry
 Mexico Chapultepec Castle in Mexico City Agriculture Automotive Manufacturing Banking Chemicals Manufacturing Communications Education Financial Services Mining Other Service Exports Retail (without wholesale)
Putting Museums on the Tourist Itinerary: Museums and Tour Operators in Partnership making the most out of Tourism
 1 of 5 ICME papers 2002 Putting Museums on the Tourist Itinerary: Museums and Tour Operators in Partnership making the most out of Tourism By Clare Mateke Livingstone Museum, P O Box 60498, Livingstone,
IATA ECONOMICS BRIEFING AIRLINE BUSINESS CONFIDENCE INDEX OCTOBER 2010 SURVEY
 IATA ECONOMICS BRIEFING AIRLINE BUSINESS CONFIDENCE INDEX OCTOBER SURVEY KEY POINTS Results from IATA s quarterly survey conducted in October show business conditions continued to improve during the third
VALUE OF TOURISM. Trends from
 VALUE OF TOURISM Trends from 2005-2015 March 2017 TABLE OF CONTENTS 1. Overview... 2 Key highlights in 2015... 2 2. Contributions to the economy... 4 TOURISM REVENUE... 5 Total revenue... 5 Tourism revenue
Congressional Briefing Southern California Air Cargo Traffic and its Impact on the Region s Economy
 Congressional Briefing Southern California Air Cargo Traffic and its Impact on the Region s Economy World Trade Week Briefing Series Los Angeles Chamber of Commerce Thursday, March 17, 2011 The Role of
Implementation Status & Results Bolivia BO Rural Alliances (P083051)
") losure Authorized Public Disclosure Authorized Public Disclosure Authorized Public Disclosure Authorized The World Bank Implementation Status & Results Bolivia BO Rural Alliances (P083051) Operation Name:
losure Authorized Public Disclosure Authorized Public Disclosure Authorized Public Disclosure Authorized The World Bank Implementation Status & Results Bolivia BO Rural Alliances (P083051) Operation Name:
Economic Impact of Tourism. Cambridgeshire 2010 Results
 Economic Impact of Tourism Cambridgeshire 2010 Results Produced by: Tourism South East Research Department 40 Chamberlayne Road, Eastleigh, Hampshire, SO50 5JH sjarques@tourismse.com http://www.tourismsoutheast.com
English Australia. National ELICOS Market Report 2017: Executive Summary
 English Australia National ELICOS Market Report 2017: Executive Summary June 2018 A report prepared for English Australia by StudentMarketing, Ltd. June 2018 English Australia contact: Brett Blacker StudentMarkerketing
Regional Director Latin America and Caribbean
 U.S. GRAINS COUNCIL Around the world; Around the clock Kurt Shultz Regional Director Latin America and Caribbean Leveraged Funding Non-Cash $7.8 Million Member Cash $5.2 Million FAS Funds $14.8 Million
Benchmarking Travel & Tourism in Australia
 Benchmarking Travel & Tourism in Australia How does Travel & Tourism compare to other sectors? Sponsored by: Summary of Findings, November 2013 Outline Introduction... 3 Australia summary..... 8 Data sources
Regional Differences in International Airline Operating Economics: 2008 and 2009
 Cir 332 AT/191 Regional Differences in International Airline Operating Economics: 2008 and 2009 Approved by the Secretary General and published under his authority International Civil Aviation Organization
COUNTRY CASE STUDIES: OVERVIEW
 APPENDIX C: COUNTRY CASE STUDIES: OVERVIEW The countries selected as cases for this evaluation include some of the Bank Group s oldest (Brazil and India) and largest clients in terms of both territory
Press Release. Bilfinger 2017: Stable foundation laid for the future
 Press Release February 14, 2018 Bilfinger 2017: Stable foundation laid for the future Organic growth in orders received after three years of decline Trend reversal: Output volume better than expected Growth
The Economic Contributions of Agritourism in New Jersey
 The Economic Contributions of Agritourism in New Jersey Bulletin E333 Cooperative Extension Brian J. Schilling, Extension Specialist in Agricultural Policy Kevin P. Sullivan, Institutional Research Analyst
Import Summery Report United Arab Emirates
 Import Summery Report United Arab Emirates Contents 1. 2. 3. 3.1 3.2 3.3 3. 3.5. 5. 5.1 5.2 Disclaimer Overview of UAE Imports Non-Oil Imports Overview of UAE Import Sectors Food Products Building Materials
SHIP MANAGEMENT SURVEY* July December 2015
 SHIP MANAGEMENT SURVEY* July December 2015 1. SHIP MANAGEMENT REVENUES FROM NON- RESIDENTS Ship management revenues dropped marginally to 462 million, following a decline in global shipping markets. Germany
PREMIUM TRAFFIC MONITOR JULY 2014 KEY POINTS
 PREMIUM TRAFFIC MONITOR JULY 2014 KEY POINTS Growth in international air passengers was weak for a second consecutive month with a 2.6% increase in July compared to a year ago premium seat numbers rose
OPERATING AND FINANCIAL HIGHLIGHTS SUBSEQUENT EVENTS
 Copa Holdings Reports Net Income of US$6.2 Million and EPS of US$0.14 for the Third Quarter of 2015 Excluding special items, adjusted net income came in at $37.4 million, or EPS of $0.85 per share Panama
Economic Climate Index - Latin America
 Oct-08 Jan-09 Apr-09 Jul-09 Oct-09 Jan-10 Apr-10 Jul-10 Oct-10 Jan-11 Apr-11 Jul-11 Oct-11 Jan-12 Apr-12 Jul-12 Oct-12 Jan-13 Apr-13 Jul-13 Oct-13 Jan-14 Apr-14 Jul-14 Oct-14 Jan-15 Apr-15 Jul-15 Oct-15
Prospects for international tourism
 Prospects for international tourism Project LINK UN DESA Expert Group Meeting on the World Economy, NYC, USA 24-26 October 211 John G.C. Kester Programme Manager, Tourism Trends and Marketing Strategies
Call Center Industry in Colombia
 Call Center Industry in Colombia 2008 1 Colombia was chosen by DIRECTV as one of the options to centralize its Call Center operations, mainly because of the high level of commitment and service attitude
SHIP MANAGEMENT SURVEY. January June 2018
 CENTRAL BANK OF CYPRUS EUROSYSTEM SHIP MANAGEMENT SURVEY January June 2018 INTRODUCTION The Ship Management Survey (SMS) is conducted by the Statistics Department of the Central Bank of Cyprus and concentrates
Produced by: Destination Research Sergi Jarques, Director
 Produced by: Destination Research Sergi Jarques, Director Economic Impact of Tourism Oxfordshire - 2015 Economic Impact of Tourism Headline Figures Oxfordshire - 2015 Total number of trips (day & staying)
Latin America. Chapter 9 Physical Geography
 Latin America Chapter 9 Physical Geography Latin American Regions Middle America includes Mexico and the Central American countries The Caribbean Islands South America Mexico Landforms Sierra Madre Oriental
Economic Impact of Tourism. Norfolk
 Economic Impact of Tourism Norfolk - 2009 Produced by: East of England Tourism Dettingen House Dettingen Way, Bury St Edmunds Suffolk IP33 3TU Tel. 01284 727480 Contextual analysis Regional Economic Trends
Annex Multilateral Conventions 1. SUBJECT Where and When Signed Multilateral Organization Vienna Convention on Vienna, April 24, 1963
 Annex 3 MULTILATERAL AND BILATERAL JUDICIAL COOPERATION INSTRUMENTS SIGNED BY COLOMBIA (Special Reference to Latin American Countries, Spain and Portugal) 1. Multilateral Conventions 1 SUBJECT Where and
% change vs. Dec ALL VISITS (000) 2,410 12% 7,550 5% 31,148 1% Spend ( million) 1,490 15% 4,370-1% 18,710 4%
 2,410 12% 7,550 5% 31,148 1% Spend ( million) 1,490 15% 4,370-1% 18,710 4%") HEADLINES FULL YEAR 2012 (PROVISIONAL) 1 Overall visits 31.148 million visits making 2012 the best year for inbound tourism since 2008 but not a record. 1% increase in visits on 2011 (30.798 visits) slightly
HEADLINES FULL YEAR 2012 (PROVISIONAL) 1 Overall visits 31.148 million visits making 2012 the best year for inbound tourism since 2008 but not a record. 1% increase in visits on 2011 (30.798 visits) slightly
PART 4. COLOMBIA COCA CULTIVATION SURVEY
 PART 4. COLOMBIA COCA CULTIVATION SURVEY SUMMARY FACTS SHEET 2004 Variation on 2004 2005 Net coca cultivation (rounded total) 80,000 hectares + 8% 86,000 hectares Of which Meta-Guaviare region 28,500
MEASURING ACCESSIBILITY TO PASSENGER FLIGHTS IN EUROPE: TOWARDS HARMONISED INDICATORS AT THE REGIONAL LEVEL. Regional Focus.
 Regional Focus A series of short papers on regional research and indicators produced by the Directorate-General for Regional and Urban Policy 01/2013 SEPTEMBER 2013 MEASURING ACCESSIBILITY TO PASSENGER
Passenger traffic growth rate slowed to 3.6% in August; air freight volumes increased by 4.8%
 Passenger traffic growth rate slowed to 3.6% in August; air freight volumes increased by 4.8% Montréal, 24 October Global airport passenger traffic lost momentum from a growth rate of 5.4% in July to 3.6%
PREMIUM TRAFFIC MONITOR DECEMBER 2014 KEY POINTS
 PREMIUM TRAFFIC MONITOR DECEMBER 2014 KEY POINTS International air travel recorded another moderate rise to end 2014, up 3.6% in December compared to a year ago. The annual expansion was in line with the
TSA governance at national level
 Mr. Peter Laimer Directorate Spatial Statistics UNWTO/DG GROW TSA-Workshop Agenda Item 6 TSA governance at national level Austrian experiences Brussels, 29/30 November 2017 www.statistik.at We provide
Results of Tourist Activity
 Results of Tourist Activity México, January, 2014 Ministry of Tourism Tourist Planning and Policy Undersecretariat Index Relevant Results, January, 2014.. Analysis of Main Results in the Sector..... 1
III. TRADE IN COMMERCIAL SERVICES BY CATEGORY
 . TRADE IN COMMERCIAL SERVICES BY CATEGORY The Highlights Transportation services Rising seaborne trade and air traffic contribute to the increase of transportation services trade In a context of rising
The Economic Impact of Tourism Brighton & Hove Prepared by: Tourism South East Research Unit 40 Chamberlayne Road Eastleigh Hampshire SO50 5JH
 The Economic Impact of Tourism Brighton & Hove 2014 Prepared by: Tourism South East Research Unit 40 Chamberlayne Road Eastleigh Hampshire SO50 5JH CONTENTS 1. Summary of Results 1 1.1 Introduction 1 1.2
Colombia. Tourism in the economy. Tourism governance and funding
 Colombia Tourism in the economy Tourism contributed COP 14.1 billion to the Colombia economy in 2014, equivalent to 2.7% of total GDP. It is the country s biggest service export and the third largest sector
WORLDWIDE AIR TRANSPORT CONFERENCE (ATCONF) SIXTH MEETING. Montréal, 18 to 22 March 2013
 SIXTH MEETING. Montréal, 18 to 22 March 2013") ATConf/6-IP/13 7/3/13 WORLDWIDE AIR TRANSPORT CONFERENCE (ATCONF) SIXTH MEETING Montréal, 18 to 22 March 2013 Agenda Item 2: Examination of key issues and related regulatory framework Agenda Item 2.1 :
ATConf/6-IP/13 7/3/13 WORLDWIDE AIR TRANSPORT CONFERENCE (ATCONF) SIXTH MEETING Montréal, 18 to 22 March 2013 Agenda Item 2: Examination of key issues and related regulatory framework Agenda Item 2.1 :
WORLD GEOGRAPHY. Hector Rodriguez
 Mr. Chavira 9th Period WORLD GEOGRAPHY Hector Rodriguez P a g e 1 Table of Contents Latin America Page 2 o Maps Economic Map Page 3 Political Map Page 4 Population Map Page 5 Physical Page 6 o Notes Physical
Doing Business in Latin America and the Caribbean. Rita Ramalho Program Manager
 Doing Business in Latin America and the Caribbean Rita Ramalho Program Manager What does Doing Business measure? Doing Business indicators: Focus on regulations relevant to the life cycle of a small to
Aviation Competitiveness. James Wiltshire Head of Policy Analysis
 Aviation Competitiveness James Wiltshire Head of Policy Analysis 1 Air Connectivity and Competitiveness Aviation is a major enabler of economic activity and social cohesion Air Connectivity drives economic
MULTILATERALISM AND REGIONALISM: THE NEW INTERFACE. Chapter XI: Regional Cooperation Agreement and Competition Policy - the Case of Andean Community
 UNCTAD/DITC/TNCD/2004/7 UNITED NATIONS CONFERENCE ON TRADE AND DEVELOPMENT Geneva MULTILATERALISM AND REGIONALISM: THE NEW INTERFACE Chapter XI: Regional Cooperation Agreement and Competition Policy -
Mikaela Weisse Scott Kloeck-Jenson Fellowship report Travel Award (2014) Lima, Peru
 Lima, Peru") Mikaela Weisse Scott Kloeck-Jenson Fellowship report Travel Award (2014) Lima, Peru I received a Scott Kloeck-Jenson fellowship to complete an international internship during the summer of 2014. I spent
Mikaela Weisse Scott Kloeck-Jenson Fellowship report Travel Award (2014) Lima, Peru I received a Scott Kloeck-Jenson fellowship to complete an international internship during the summer of 2014. I spent
Tourism in numbers
 Tourism in numbers 2013-2014 Glenda Varlack Introduction Tourism is a social, cultural and economic experience which involves the movement of people to countries or places outside their usual environment
1st Period Mr. Chavira WORLD GEOGRAPHY. Hector Rodriguez
 1st Period Mr. Chavira WORLD GEOGRAPHY Hector Rodriguez P a g e 1 Table of Contents Latin America Page 2 o Maps Economic Map Page 3 Political Map Page 4 Population Map Page 5 Physical Page 6 o Notes Physical
The Economic Impact of Tourism Brighton & Hove Prepared by: Tourism South East Research Unit 40 Chamberlayne Road Eastleigh Hampshire SO50 5JH
 The Economic Impact of Tourism Brighton & Hove 2013 Prepared by: Tourism South East Research Unit 40 Chamberlayne Road Eastleigh Hampshire SO50 5JH CONTENTS 1. Summary of Results 1 1.1 Introduction 1 1.2
TRANSPORT AFFORDABILITY INDEX
 TRANSPORT AFFORDABILITY INDEX Report - December 2016 AAA 1 AAA 2 Table of contents Foreword 4 Section One Overview 6 Section Two Summary of Results 7 Section Three Detailed Results 9 Section Four City
Tourism Trends, Outlook and Issues. John G.C. Kester. 6th UNWTO/PATA Forum on Tourism Trends and Outlook. Guilin, China October 2012 day 1
 Tourism Trends, Outlook and Issues 6th UNWTO/PATA Forum on Tourism Trends and Outlook Guilin, China 11-13 October 212 day 1 John G.C. Kester Programme Manager, Tourism Trends and Marketing Strategies World
De luchtvaart in het EU-emissiehandelssysteem. Summary
 Summary On 1 January 2012 the aviation industry was brought within the European Emissions Trading Scheme (EU ETS) and must now purchase emission allowances for some of its CO 2 emissions. At a price of
September. ECHO Quito team MONTHLY REPORT
 EUROPEAN COMMISSION HUMANITARIAN AID OFFICE (ECHO) Monthly report number 2012/09 Month Country September South America (except Colombia for HA) Date of submission 04/10/12 Author ECHO Quito team 1. SUMMARY
<click here for the DREF budget, here for contact details, or here to view the map of the affected area>
 Bolivia: Floods DREF operation n MDRBO005 GLIDE FL-2010-000008-BOL 12 February 2010 The International Federation s Disaster Relief Emergency Fund (DREF) is a source of un-earmarked money created by the
CTO PERFORMANCE REVIEW 2005 CARIBBEAN TOURISM PERFORMANCE
 CTO PERFORMANCE REVIEW 2005 CARIBBEAN TOURISM PERFORMANCE We can perhaps describe the Caribbean tourism sector as continuing to hold its own in 2005. Based upon the available returns from its 31 member
EU Trade policy in Latin America
 EU Trade policy in Latin America Thomas LE VAILLANT European Commission DG TRADE - Relations with Latin America Topics 1.Trade and investment flows 2. Regionalism in Latin America 3. State of play 4. Architecture
A RESEARCH ON INTERNATIONAL TOURISM IN JAPAN - CULTIVATING INBOUND TOURISM -
 A RESEARCH ON INTERNATIONAL TOURISM IN JAPAN - CULTIVATING INBOUND TOURISM - Taichiro Sahara Senshu University 2-1-1 Higashimita Tama-Ku Kawasaki-Shi, Kanagawa JAPAN, 214-8580 C/o Tatsuro Watanabe Laboratory
Aviation Trends Quarter
 Aviation Trends Quarter 4 214 Contents Introduction... 2 1. Historical overview of traffic see note 5 on p.15... 3 a. Terminal passengers... 4 b. Commercial flights... 5 c. Cargo tonnage... 6 2. Terminal
Airline financial performance and longterm developments in air travel markets
 Airline financial performance and longterm developments in air travel markets March 2018 Brian Pearce, Chief Economist, IATA www.iata.org/economics % of invested capital Investor returns falling but above
Estimates of the Economic Importance of Tourism
 Estimates of the Economic Importance of Tourism 2008-2013 Coverage: UK Date: 03 December 2014 Geographical Area: UK Theme: People and Places Theme: Economy Theme: Travel and Transport Key Points This article
III. TRADE IN COMMERCIAL SERVICES BY CATEGORY
 .. TRADE IN COMMERCIAL SERVICES BY CATEGORY Transportation services China records impressive growth of world transportation services reached $750 billion in 2007, an increase of 19 per cent, following
Andean Competitiveness
 Background 1. Poor countries, high income inequality 2. Failure of ISI brought inflation, deep economic crisis and political crisis in the 70s 3. Market oriented economic reforms in the 80s and 90s 4.
SHIP MANAGEMENT SURVEY. July December 2017
 SHIP MANAGEMENT SURVEY July December 2017 INTRODUCTION The Ship Management Survey is conducted by the Statistics Department of the Central Bank of Cyprus and concentrates primarily on transactions between
IATA Fuel Efficiency Program
 IATA Fuel Efficiency Program IATA Fuel Efficiency Program The program was launched by IATA in 2004 in response to the rising price of fuel. It is focused on supporting the airlines to increase fuel efficiency
Global economy and aviation do we have room to grow?
 Global economy and aviation do we have room to grow? 18 January 2017 Brian Pearce Chief Economist, IATA Airline Industry Economics Advisory Workshop 2016 1 Room to grow? Looking through the cycle Potential
A. P. Moller Maersk Trade Report
 A.P. MOLLER MAERSK INFORME DE COMERCIO / Q4 2017 / COLOMBIA A. P. Moller Maersk Trade Report Q4 2017 COLOMBIA A.P. MOLLER MAERSK TRADE REPORT / T4 2017 / COLOMBIA CONTAINERIZED EXPORTS, PROTAGONISTS OF
Mrs. Reifsnyder World Geography. Unit 8: Latin America Study Guide SOLs Addressed: WG. 1c, 2b, 3c, 4, 10b/c
 Mrs. Reifsnyder World Geography Unit 8: Latin America Study Guide SOLs Addressed: WG. 1c, 2b, 3c, 4, 10b/c Essential Questions: - In what ways do physical, economic, and cultural characteristics influence
Produced by: Destination Research Sergi Jarques, Director
 Produced by: Destination Research Sergi Jarques, Director Economic Impact of Tourism Epping Forest - 2014 Economic Impact of Tourism Headline Figures Epping Forest - 2014 Total number of trips (day & staying)
Managing through disruption
 28 July 2016 Third quarter results for the three months ended 30 June 2016 Managing through disruption 3 months ended Like-for-like (ii) m (unless otherwise stated) Change 30 June 2016 30 June 2015 change
HEALTH SECTOR ECONOMIC INDICATORS REPORT
 HEALTH SECTOR ECONOMIC INDICATORS REPORT For: Mid North Coast Local Health District Report prepared by: April 2013 Table of Contents Introduction 3 Executive Summary 4 Output 5 Value-Added 7 Workforce
USDBC MEXICO MONTHLY REPORT MARCH 2016
 USDBC MEXICO MONTHLY REPORT MARCH 2016 2015 / 2016 FALL - WINTER OFFICIAL DRY BEAN CROP REPORT 2016 Fall-Winter Bean Crop Comments Sinaloa.- Sinaloa reported final production of 75 thousand MT of Azufrado
Month June 2011 South America (except Colombia for HA) Date of submission 01/07/11 MONTHLY REPORT
 Date of submission 01/07/11 MONTHLY REPORT") ANNEX IV-3 EUROPEAN COMMISSION HUMANITARIAN AID OFFICE (ECHO) Monthly report number 2011/6 Month June 2011 Country South America (except Colombia for HA) Date of submission 01/07/11 Author ECHO Quito MONTHLY
ANNEX IV-3 EUROPEAN COMMISSION HUMANITARIAN AID OFFICE (ECHO) Monthly report number 2011/6 Month June 2011 Country South America (except Colombia for HA) Date of submission 01/07/11 Author ECHO Quito MONTHLY
EASYJET INTERIM MANAGEMENT STATEMENT FOR THE QUARTER ENDED 31 DECEMBER 2010
 20 January 2011 easyjet Interim Management Statement Page 1 of 5 20 January 2011 EASYJET INTERIM MANAGEMENT STATEMENT FOR THE QUARTER ENDED 31 DECEMBER 2010 Highlights: Total revenue up by 7.5% to 654
Daniel Titelman Director Economic Development Division
 Daniel Titelman Director Economic Development Division Economic trends in the region continue to be marked by: Uncertainty and risk in the global economy: External demand remains sluggish, which reflects
Israeli-Egyptian Trade: In-Depth Analysis
 Israeli-Egyptian Trade: In-Depth Analysis YITZHAK GAL BADER ROCK MIDDLE EAST Contents Israeli-Egyptian Economic Relations 3 Israel s Trade With Egypt 6 Egypt s Trade With Israel in Context 10 The Israeli-Egyptian
STATEMENT OF PROBLEMS OF THE PROJECT
 Strategic planning and the development of Vladivostok city local economic policy Andrey Velichko (Far Eastern State University, Vladivostok city, Russia) the presenter Alexandr Abramov, Yuriy Avdeev, Denis
Government of Colombia. Colombia. Coca Cultivation Survey
 Government of Colombia Colombia Coca Cultivation Survey June 2007 Censo de cultivos de coca 2006 1 ABBREVIATIONS COP DANE DEA DIRAN DNE DNP GME ICMP INCB IDB NNPS OAS PDA PCI RSS SIMCI UNODC USAID US$
Analysing the performance of New Zealand universities in the 2010 Academic Ranking of World Universities. Tertiary education occasional paper 2010/07
 Analysing the performance of New Zealand universities in the 2010 Academic Ranking of World Universities Tertiary education occasional paper 2010/07 The Tertiary Education Occasional Papers provide short
Air transport demand shows continued resilience despite geopolitical pressure as passenger and freight traffic grow
 Air transport demand shows continued resilience despite geopolitical pressure as passenger and freight traffic grow Montreal, 7 August 2018 Airports Council International (ACI) World reported global passenger
Contents of the Economic Survey 2012
 Contents of the Economic Survey 2012 I. Macroeconomic trends in Latin America and the Caribbean in 2012 II. Reactions of the countries of the region to the adversities of the global economy III. Savings
UNITED NATIONS EDUCATIONAL, SCIENTIFIC AND CULTURAL ORGANIZATION CONVENTION CONCERNING THE PROTECTION OF THE WORLD CULTURAL AND NATURAL HERITAGE
 World Heritage Distribution limited 27 COM WHC-03/27.COM/INF.13 Paris, 23 June 2003 Original : English/French UNITED NATIONS EDUCATIONAL, SCIENTIFIC AND CULTURAL ORGANIZATION CONVENTION CONCERNING THE
Tourism as an Economic Pillar. Mary Vrolijk 25 September 2015
 Tourism as an Economic Pillar Mary Vrolijk 25 September 2015 Tourism Trends. Tourism: a key role player in economies. Spinoff effects: Job creation, New small and medium enterprises(sme s), Country competiveness,