GLOBAL ILLICIT CULTIVATION OF COCA BUSH AND PRODUCTION OF COCA LEAF AND COCAINE, CULTIVATION (a) OF COCA BUSH IN HECTARES
|
|
|
- Esmond Prosper Evans
- 5 years ago
- Views:
Transcription
1 5.2 Production: Coca/Cocaine 5.2. Coca/ Cocaine GLOBAL ILLICIT CULTIVATION OF COCA BUSH AND PRODUCTION OF COCA LEAF AND COCAINE, CULTIVATION (a) OF COCA BUSH IN HECTARES Bolivia (b) 50,300 47,900 45,300 47,200 48,100 48,600 48,100 45,800 38,000 21,800 14,600 19,900 21,600 23,600 27,700 Colombia (c) 40,100 37,500 37,100 39,700 44,700 50,900 67,200 79, , , , , ,000 86,000 80,000 Peru (d) 121, , , , , ,300 94,400 68,800 51,000 38,700 43,400 46,200 46,700 44,200 50,300 Total 211, , , , , , , , , , , , , , ,000 POTENTIAL PRODUCTION OF DRY COCA LEAF IN METRIC TONS Bolivia 77,000 78,000 80,300 84,400 89,800 85,000 75,100 70,100 52,900 22,800 13,400 20,200 19,800 18,500 25,000 Colombia 45,300 45,000 44,900 45,300 67,500 80, , , , , , , , , ,900 Peru 196, , , , , , , ,600 95,600 69,200 46,200 49,300 52,500 50,790 70,300 Total 319, , , , , , , , , , , , , , ,200 POTENTIAL MANUFACTURE (e) OF COCAINE IN METRIC TONS Bolivia Colombia Peru Total a) Potentially harvestable, after eradication b) Sources: : CICAD and US Department of State, International Narcotics Control Strategy Report; : National Illicit Crop Monitoring System supported by UNODC. c) Sources: : CICAD and US Department of State, International Narcotics Control Strategy Report; : National Illicit Crop Monitoring System supported by UNODC. d) Sources: : CICAD and US Department of State, International Narcotics Control Strategy Report; : National Illicit Crop Monitoring System supported by UNODC. e) Amounts of cocaine that could be manufactured from locally produced coca leaf (due to imports and exports actual amounts of cocaine manufactured in a country can differ). 207
2
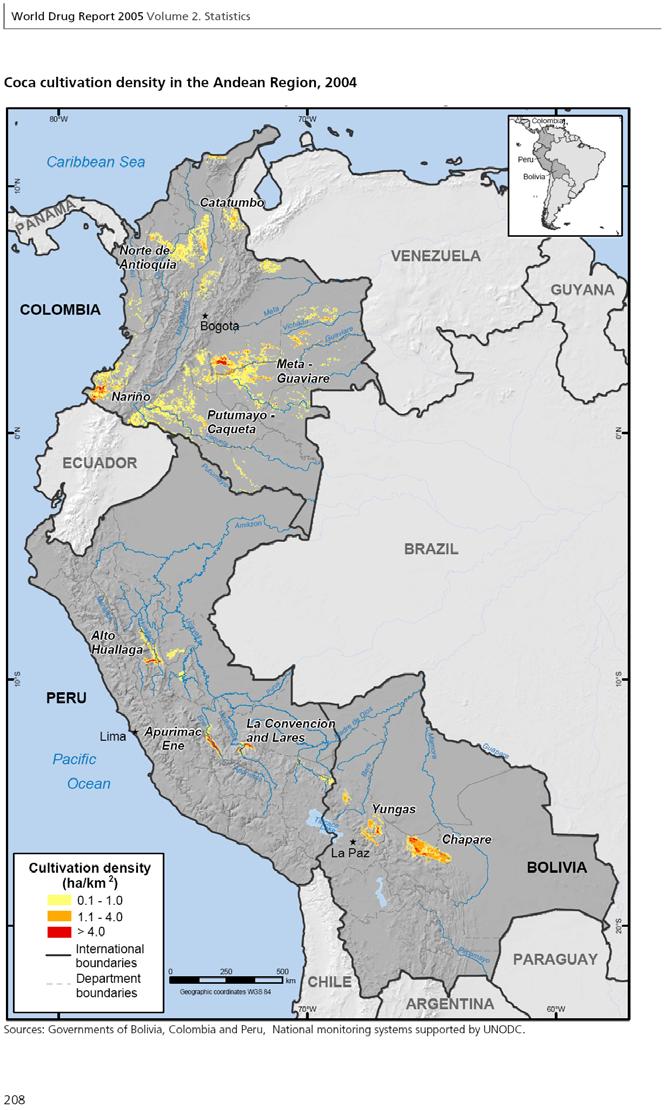
3 5.2 Production: Coca/Cocaine Colombia In 2004, the total area under coca cultivation in Colombia was estimated at about 80,000 ha, a 7% decrease compared to last year estimate of 86,000 ha. It was the fourth consecutive annual decrease of coca cultivation in Colombia, representing a reduction of 51% compared to the peak annual estimate of 163,000 ha in 2000 (-11% in 2001, -30% in 2002, -16% in 2003 and 7% in 2004). Results of the 2004 UNODC Colombia Annual Survey Coca Cultivation The results of the Coca Survey showed that, at the end of December 2004, about 80,000 ha of coca were cultivated in Colombia. This represented a decrease of 6,000 ha since December 2003 when coca cultivation was estimated at about 86,000 ha. The decrease of coca cultivation corresponded to a sustained level of aerial spraying and manual eradication that peaked at 139,200 ha, an increase of 3% compared to 2003, as well as the implementation of alternative development projects. The budget for alternative development projects also increased between 2003 and The budget for alternative development projects implemented at the municipality and departmental levels increased from US$38 millions in 2003 to US$78 millions in Geographical Distribution In 2004 the department with the highest level of coca cultivation was Meta (18,700 ha), followed by Nariño (14,200 ha), Guaviare (9,800 ha), and Caqueta (6,500 ha). Putumayo department, which ranked first and accounted for 41% of the total coca cultivation in 2000, only accounted for 5% of the national total and ranked sixth in There are significant differences on the impact of aerial spraying and alternative development projects at the departmental level. Aerial spraying and alternative development efforts were intense in Putumayo and Caqueta between 2000 and 2004, producing a decrease of about 80,000 ha of coca cultivation. However, between 2000 and 2004, coca cultivation increased in Nariño by about 5,000 ha, despite of intense aerial spraying, and investment in alternative development amounting to US$ 11 millions. In Meta, coca cultivation increased by about 7,600 ha during the same period, which could be due to the absence of alternative development projects and the low level of aerial spraying of coca cultivation. Coca Production To establish an estimate of the cocaine production in 2004, UNODC relied on information available from other sources. The US government has done the most comprehensive work on this topic. The findings of this work indicated that the average cocaine yield per hectare of coca bushes amounts to 4.7 kg/ha in Colombia. In order to arrive at a realistic estimate for Colombia, UNODC calculated an average of the two cultivation figures recorded in December 2003 and in December 2004 by the UNODC supported national monitoring system. This average of 83,000 ha was then multiplied by the estimated yield per hectare. The result amounted to 390 metric tons of potential cocaine production in Colombia for Coca prices In 2004, the average price for one kg of coca paste amounted COP 2,121,000 (US$807). Compared to 2003, the prices decreased in Colombian pesos, but because of the depreciation of the US$, increased in US$ terms. Using the average price for coca paste of US$ 80/kg in 2004 and assuming a 1:1 conversion rate between coca paste and cocaine, the total farm-gate value of the 390 metric tons of coca paste produced in Colombia in 2004 would amount to about US$315 millions. 209
4 World Drug Report 2005 Volume 2. Statistics Opium cultivation and production As of December 2004, the Colombian Anti-narcotics police s (DIRAN) estimates based on reconnaissance flights and spray operations, identified 3,950 hectares of opium poppy under cultivation, a stable situation compared to 4,026 hectares in Opium prices in 2004 were rather similar to the opium prices reported in The price of opium latex in 2004 averaged US$ 164/kg. With an estimated opium latex production of 118 metric tons, the potential value of the 2004 farm-gate production of opium latex would amount to about US$ 19 millions. Trend in heroin and morphine prices per kg showed a similar pattern of a steady increase between 2003 and The average annual heroin price in 2004 was COP 20,067,000/kg or US$ 7,635/kg, representing an increase of 21% in COP and 33% in US$ compared to the annual average of Eradication The Colombian anti-drugs strategy includes a number of measures ranging from aerial spraying, to forced or voluntary manual eradication, including alternative development and crops substitution programmes. UNODC did not participate in or supervise any spraying activities. All data were received from DIRAN. Reports from DIRAN showed that, for the fourth consecutive time, spraying activities reached record level in The DIRAN sprayed a total of 136,552 hectares (or +3% from 2003) and the Army manually eradicated 2,588 ha of coca. In addition, DIRAN sprayed 3,061 (or +71% from 2003) hectares and the Army manually eradicated 804 ha of opium poppy. 210
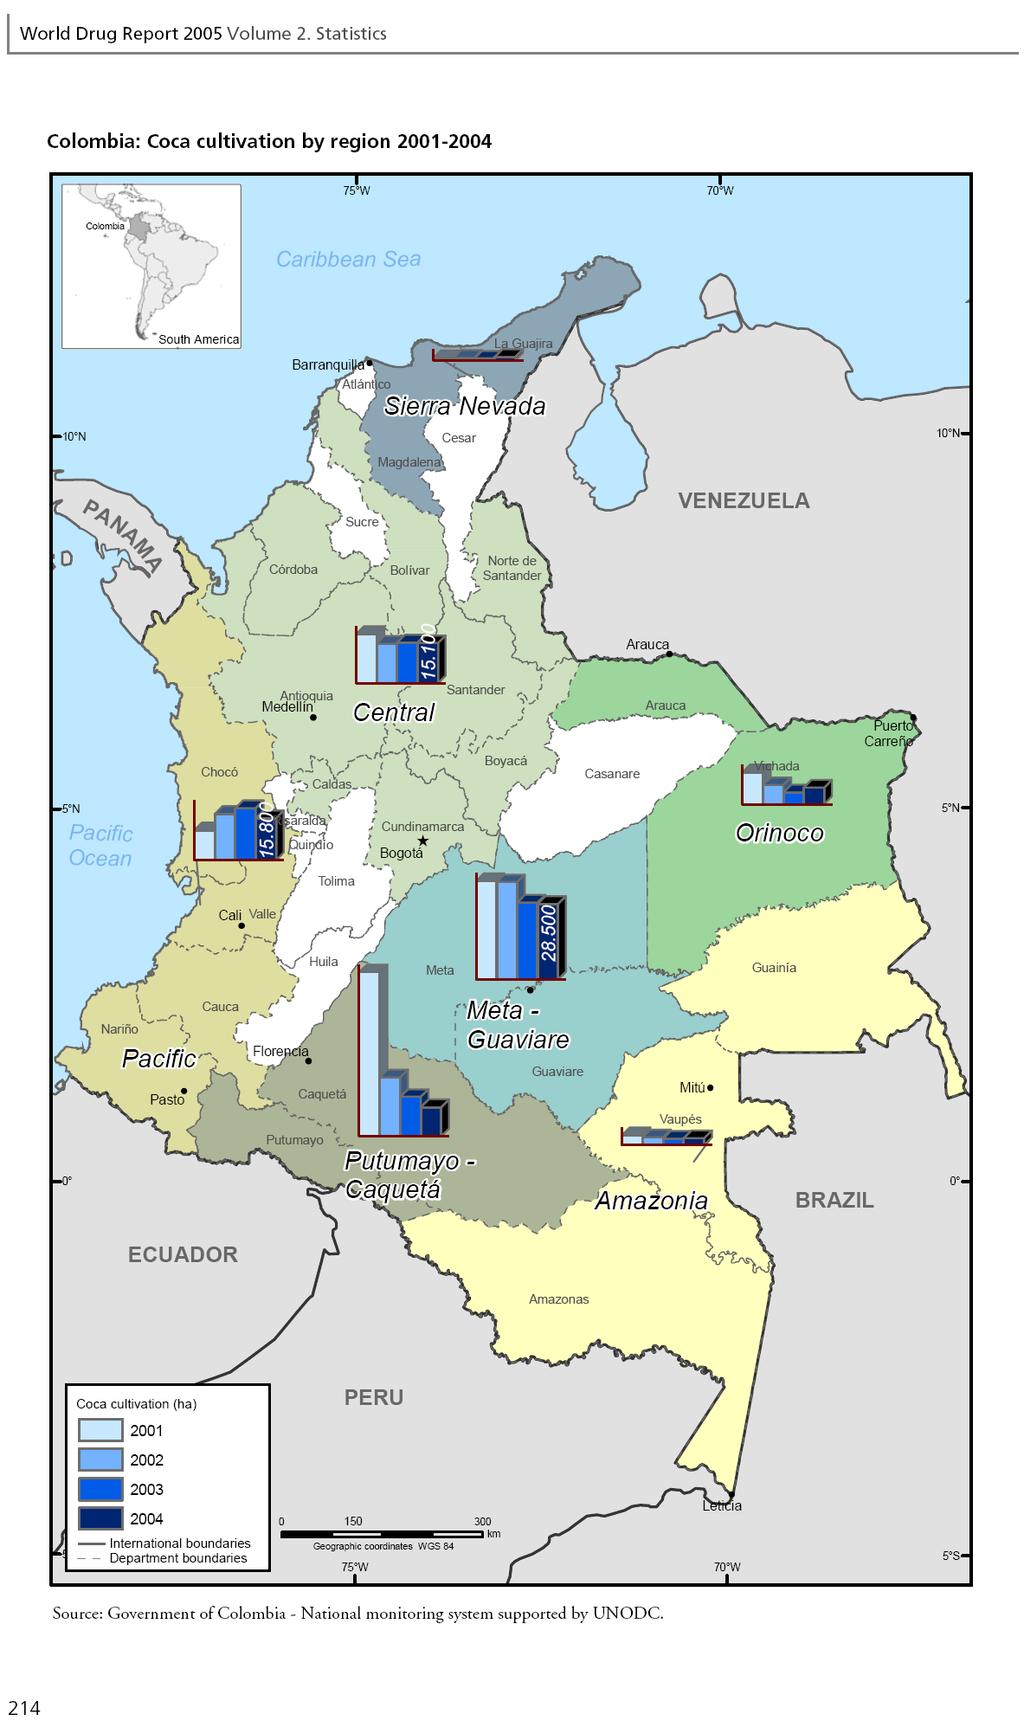
5 5.2 Production: Coca/Cocaine Fact Sheet: Colombia Coca Survey Variation on Net coca cultivation (rounded total) 86,000 ha - 7 % 80,000 ha Of which Meta-Guaviare region 29,000 ha -2% 28,500 ha Pacific region 19,600 ha -19% 15,800 ha Central region 15,400 ha -2% 15,100 ha Putumayo-Caqueta region 10,900 ha - 10,900 ha Elsewhere 7,600 ha +32% 10,100 ha Reported accumulated aerial spraying and manual eradication of coca cultivation 136,800 ha +3% 139,200 ha Approximate annual budget for alternative development projects at department level (out of a total of US$ 230 millions for , not including US$ 350 millions for activities of national reach for ) 1 US$38 million + 105% US$78 millions Average farm-gate price of coca paste 780 US$ /kg + 4 % 810 US$/kg Total farm-gate value of coca paste production US$350 millions -10 % US$315 millions GDP (in US$ billion) 2 US$ bn n.a. US$ 95.3 bn Potential production of cocaine in percent of world cocaine production 440 mt 65 % - 11 % 390 mt 57 % Average cocaine price US$ 1,565 /kg + 9% US$1,713/kg Reported opium poppy cultivation (rounded) 4,000 ha 4,000 ha Average farm-gate price of opium latex US$ 154 /kg + 6% US$ 164 /kg Total farm-gate value of opium production (rounded) US$ 19 millions US$19 millions Potential heroin production 5 mt 5 mt Average heroin price US$ 5,700 /kg + 33% US$7,600 /kg Reported seizure of cocaine Reported seizure of heroin 113,142 kg 629 kg Reported destruction of illegal laboratories 3 1, % 1,709 1 Not including US$ 350 million for activities of national reach for GDP for 2003 from the World Bank, not yet available for GDP for 2004 estimated from Economist Intelligence Unit. Sources were not comparable, but the Colombian Government reported a growth rate of 4.21% for 2003 and 4.12% for Includes laboratories processing coca paste/base (1,582), cocaine hydrochloride (243), heroin (8), morphine (1), Potassium permanganate (19), ammoniac (1) and non-specified (11). 211
6 World Drug Report 2005 Volume 2. Statistics Graphs, tables and maps: Colombia Colombia, coca cultivation, in ha, , ,000 Hectares 120,000 80,000 40, Cultivation 40,100 37,500 37,100 39,700 44,700 50,900 67,200 79, ,80 160,10 163,30 144,80 102,00 86,000 80,000 Colombia, main departments of coca cultivation, in ha, Departments % annual change % of 2004 country total Meta 12,814 18,740 46% 23% Nariño 17,628 14,154-20% 18% Guaviare 16,163 9,769-40% 12% Caquetá 7,230 6,500-10% 8% Putumayo 7,559 4,386-42% 5% Norte de Santander 4,471 3,055-32% 4% Rest of the country 20,135 23,396 16% 29% Rounded Total 86,000 80,000-7% 100% Colombia, coca cultivation trends by regions, in ha, Region Putumayo-Caqueta 82,015 92,625 61,636 22,137 14,789 10,886 Meta - Guaviare - Vaupes 40,833 30,235 38,896 38,088 30,134 29,593 Bolivar - Antioqua - Cordoba 11,461 8,624 8,647 6,150 9,581 10,106 Cauca - Nariño 10,250 13,919 10,633 17,251 19,071 15,420 Others 15,560 17,107 24,995 18,445 12,425 13,995 Grand Total 160, , , ,071 86,000 80,


7 PA NA 150 PERU 75 W P yo quet á Meta Boyacá 300 km u tu ma Río Ca Caquetá Bogotá Guaviare San José Norte de Santander Santander Cundinamarca Geographic coordinates WGS 84 Putumayo Florencia 0 le Huila Tolima Quindío Risaralda Caldas Medellín Bolívar lena Cesar La Guajira Mitú Rí Vichada zo n as G Río 70 W ní oi Rí rida iare uav ichada Río V Leticia Am a Vaupés om Amazonas Casanare Arauca Arauca BRAZIL co Puerto R í o A rauca Carreño Guainía VENEZUELA 70 W Source: Government of Colombia - National monitoring system supported by UNODC International boundaries Department boundaries > (ha/km²) Cultivation density ECUADOR Cauca Cali Valle Chocó Sucre Antioquia Córdoba da Magdalena R ío 5 S 0 Pasto Nariño Pacific Ocean 5 N 10 N Atlántico Barranquilla Río Ca uca South America o trat Río A Caribbean Sea na ag d a A M Río M Colombia eta 75 W Rí g 5 S 0 5 N 10 N PA NA Nariño International boundaries Department boundaries Significant increase Increase Insignificant changes Decrease Significant decrease ECUADOR Pasto Cauca Cali 0 Huila Tolima Quindío Risaralda Caldas Medellín Antioquia Córdoba Magdalena 75 W Geographic coordinates WGS PERU Putumayo Bogotá 300 km Caquetá Meta Boyacá Santander San José La Guajira Norte de Santander Cesar Cundinamarca Sucre Bolívar Atlántico Barranquilla Florencia Valle Chocó South America Caribbean Sea 75 W Amazonas Vaupés Guaviare Casanare 70 W Leticia Mitú Arauca Arauca Puerto Carreño BRAZIL Guainía Vichada VENEZUELA 70 W Source: Government of Colombia - National monitoring system supported by UNODC 5 S 0 Pacific Ocean 5 N 10 N Colombia Colombia: Coca cultivation density change A M o Río M a Río Orin o Colombia: Coca cultivation density S 0 5 N 10 N 5.2 Production: Coca/Cocaine 213
8
9 5.2 Production: Coca/Cocaine Colombia, potential cocaine production, Metric tons Production Colombia, average coca base price, (thousand of pesos /kg) '000 Colombian pesos/kg 2,400 2,300 2,200 2,100 2,000 1,900 1,800 1,700 1,600 1,500 Dec 99 Jan-Dec 2000 Jan-Dec 2001 Jan-Dec 2002 Jan 03-Dec 2003 Jan 04-Dec 2004 Colombia, average coca base price (thousand of pesos /kg) Jan Feb Mar Apr May Jun Jul Aug Sept Oct Nov Dec ,714 1,690 1,628 1,666 1,666 1,682 1,691 1,680 1,665 1,740 1,750 1, ,730 2,179 2,150 2, ,192 2,208 2,146 2,146 2,124 2,204 2,165 2,203 2,208 2,034 2, ,213 2,247 2,215 2,231 2,242 2,263 2,300 2,295 2,269 2,270 2,217 2, ,180 2,100 2,060 2,088 2,140 2,180 2,000 2,030 2,130 2,240 2,180 2,
10 World Drug Report 2005 Volume 2. Statistics Colombia, cumulative aerial spraying of coca bushes by department (in ha), Sources Environmental Audit of the National Narcotics Bureau Antinarcotics Police Department Department Guaviare 3,142 21,394 14,425 30,192 37,081 17,376 8,241 7,477 7,207 37,493 30,892 Meta 729 2,471 2,524 6,725 5,920 2,296 1,345 3,251 1,496 6,973 3,888 Caqueta ,370 18,433 15,656 9,172 17,252 18,567 1,059 16,276 Putumayo ,949 4,980 13,508 32,506 71,891 8,342 17,524 Vichada , ,446 Antioquia ,259-3,321 9,835 11,048 Cordoba Vaupes Cauca ,713 2, ,308 1,811 Norsantander ,584 10,308 9,186 13,822 5,686 Nariño ,442 8,216 17,962 36,910 31,307 Santander ,855 Boyaca Bolivar ,581-4,783 6,456 Arauca ,734 5,336 Magdalena 1,632 Guajira 449 Caldas 190 Sub-total 3,871 23,915 18,519 41,861 66,029 43,111 58,073 94, , , ,552 Manual eradication 1,745 2,752 4,011 2,609 Total eradication 3,871 23,915 18,519 41,861 66,029 43,111 58,073 95, , , ,161 Net cultivation 45,000 51,000 67,000 79, , , , , ,000 86,000 80,000 Colombia, comparison of net coca cultivation and reported cumulated sprayed area 4, in ha, , , , , ,000 80,000 60,000 40,000 20, Cultivation Eradication 4 Reported cumulated spraying does not take into account the effectiveness of spraying nor the fact that some spraying paths can overlap, which explains that eradicated areas are larger then cultivated areas. Illicit crop cultivation estimates presented in this publication are net, i.e. posteradication. 216
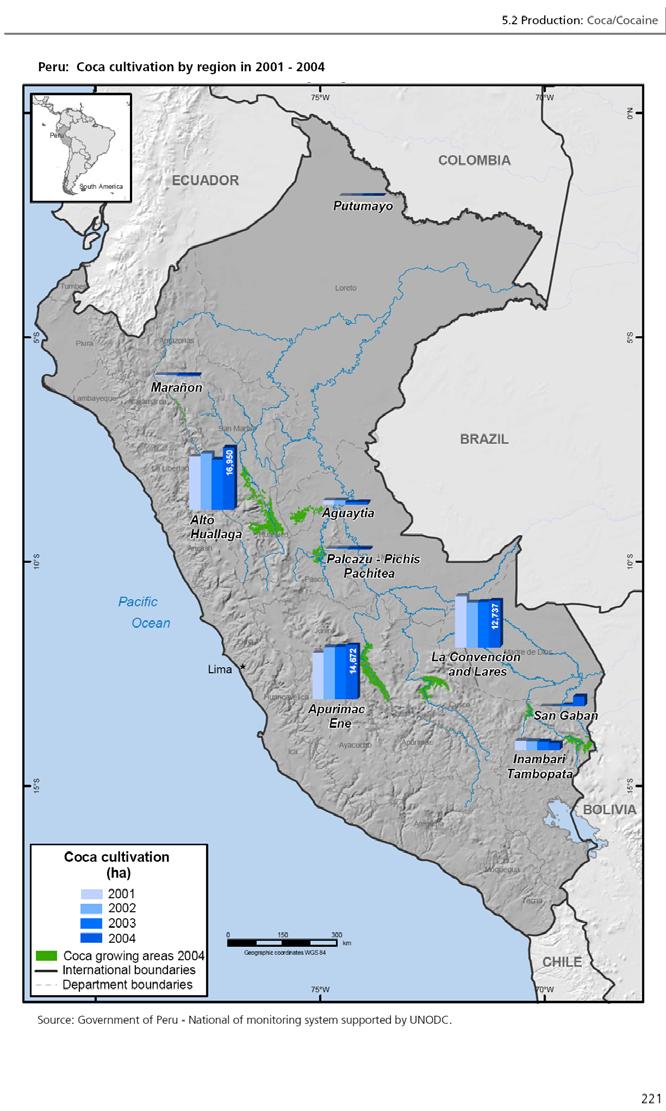
11 5.2 Production: Coca/Cocaine Peru Peru is the second largest cultivator of coca after Colombia. It represented 33% of the 2004 global coca cultivation, compared to 29% in A percentage that remained much lower than 10 years ago, when coca cultivation in Peru accounted for 54% of the cultivation in the world. However, the increases in coca cultivation in Peru and Bolivia in 2004 neutralized reductions noted in Colombia so that global coca cultivation remained almost stable (+3%). Results of the 2004 UNODC Peru Annual Survey Coca Cultivation In 2004, the total area under productive coca cultivation in Peru was estimated at about 50,300 ha. This represented an increase of 14% over the estimate for 2003 of 44,200 ha. Despite this increase, coca cultivation in 2004 remained below the levels registered in the mid-nineties, when cultivation was above 100,000 hectares. Geographical Distribution In Peru, most of the coca cultivation is concentrated in 14 large valleys and 8 small valleys. These valleys can be grouped in three main regions, making up to 88% of the total cultivation in 2004: Alto Huallaga, Apurimac-Ene and La Convencion y Lares. Each region has its own characteristics. While La Convencion y Lares is the main supplier of the domestic consumption of coca leaf, coca cultivation in Apurimac-Ene and Alto Huallaga are almost exclusively oriented for the production of cocaine for domestic and international markets. Coca cultivation in other areas like San Gaban and Inambari-Tambopata at the border with Bolivia, Aguaytia and Pichis-Palcazu-Pitea in the central part of the country, and Putumayo of Loreto department close to Colombia, only accounted for 12% of the Coca cultivation in these areas has mainly been oriented towards the production of cocaine. Coca Production The total sun-dried leaf production in 2004 for Peru was estimated to range between 96,000 and 123,000 metric tons, with an average estimation of 110,000 metric tons, equivalent to a production of oven-dried coca leaf of about 76,500 metric tons (+/- 12%). Based on a conversion rate of 375 kg of oven-dried coca leaf for 1 kg of cocaine, the potential production of cocaine was estimated to range between 160 and 210 metric tons, with an average rounded estimate of 190 metric tons. Coca prices The annual average price of US$2.8/kg for coca leaves represented an increase of 33% compared to the annual average price of US$2.2/kg in On the long term, coca leaves prices have tended to increase since their lowest level of US$0.6/kg in 1996 when the interruption of the air-bridge between Peru and Colombia reduced demand for Peruvian coca leaf. The 2004 average annual price was the highest recorded since This sustained high price of coca leaf may have been the main motivation for the farmers to increase coca cultivation. Opium cultivation and production The UNODC-supported national illicit crop monitoring system has not yet established a reliable methodology for the detection of opium poppy in Peru. However, opium poppy cultivation was considered negligible in Opium poppy was mainly cultivated in the mountain range. The Antidrugs Directorate Peruvian National Police (DIRANDRO) estimated at around 1,500 ha the total opium 217
12 World Drug Report 2005 Volume 2. Statistics poppy cultivation in Peru in A stable situation compared to the latest available estimate of about 1,400 ha for DIRANDRO reported annual opium latex yield of about 8 kg/ha, and a conversion rate of 10kg of opium latex for 1 kg of heroin. Based on this estimates, heroin production would be around 1 metric tons. A relatively small production compared to neighbouring Colombia where heroin production is estimated at 5 metric tons in Eradication In 2004, the Peruvian government reported the eradication of 10,257 ha of coca fields, 10% less than in It was however the third largest level of eradication since Of the total of 10,257 ha, about 75% were eradicated by the Control and Reduction of Coca Cultivation in Alto Huallaga (CORAH), the government entity in charge of forced eradication. CORAH operates throughout the country under the responsibility of the Ministry of interior. 218
13 5.2 Production: Coca/Cocaine Fact Sheet: Peru Coca Survey Variation on Coca cultivation 44,200 ha +14 % 50,300 ha Of which Alto Huallaga 13,600 ha +24% 28,500 ha Apurimac-Ene 14,300 ha +3% 15,800 ha La Convencion y Lares 12,340 ha +3% 15,100 ha Elsewhere 3,940 ha +52% 10,900 ha Average sun-dried coca leaf yield from UNODC study in 2004 In Alto Huallaga (except Monzon) In Apurimac-Ene 2,988 kg/ha 3,627 kg/ha In La Convencion y Lares 1,650 kg/ha + 32 % 1,457 kg/ha Weighted average sun-dried coca leaf yield Potential production of sun-dried coca leaf 1,650 kg/ha + 32 % 2,180 kg/ha 72,800 mt + 50 % 110,000 mt Potential production of cocaine hydrochloride in percent of world illicit opium production 155 mt 23 % + 23 % 190 mt 28 % Average farm-gate price of sun-dried coca leaf US$ 2.2/kg + 27 % US$ 2.8/kg Potential farm-gate value of sun-dried coca leaf 5 US$ 304 millions GDP (Peru National Statistics Institute) US$ 68.5 billions Farm-gate value of coca leaf production 0.44% Average farm-gate price of coca paste US$ 530/kg +21 % US$ 640/kg Reported eradication of coca cultivation 11,312 ha - 9 % 10,257 ha Reported seizure of cocaine paste 4,366 kg + 44 % 6,330 kg Reported seizure of cocaine hydrochloride 3,574 kg % 7,303 kg Reported opium poppy cultivation n.a. 1,447 ha Reported seizure of opium latex 433 kg + 4 % 451 kg 5 Farm-gate value for 2004 was calculated based on coca leaf yield data obtained by UNODC in In 2003, farm-gate value for 2003 was estimated using coca leaf yield dating The total farm-gate value for 2003 and 2004 were therefore not directly comparable. 219
14 World Drug Report 2005 Volume 2. Statistics Graphs, tables and maps: Peru 2004 Peru, coca cultivation, in ha, , , ,000 Hectares 80,000 60,000 40,000 20, Cultivation 121,30 120,80 129,10 108,80 108,60 115,30 94,400 68,800 51,000 38,700 43,400 46,200 46,700 44,200 50,300 Peru, main areas of coca cultivation Change Percentage of 2004 Area Total Alto Huallaga 13,650 16,900 24% 34% Aguaytia % 1% Apurimac 14,300 14,700 3% 29% La Convencion - Lares 12,340 12,700 3% 25% Inambari - Tambopata 2,260 2,000-12% 4% San Gaban % 5% Others % 2% Total 44,200 50,300 14% 100% Peru, potential cocaine production, Metric tons Production
15
16 World Drug Report 2005 Volume 2. Statistics Peru, farm-gate prices of coca leaf (US$/kg) January February March April May June July August September October November December Annual Average US$/kg In constant US$ of Peru, Upper Huallaga, farmgate prices of coca leaf (US$/kg) January February March April May June July August September October November December Annual Average US$/kg In constant US$ of
17 5.2 Production: Coca/Cocaine Peru, average dry coca leaf prices for Peru and for Upper Huallaga, US$/kg, US$/kg Upper Huallaga Country Peru, coca cultivation and reported eradication, in ha, (source CORAH) Years Eradication (ha) Cultivation (ha) , ,100 60, ,800 70, , , , , , , , , , , , , , ,300 94, ,500 68, ,800 51, ,700 38, ,200 43, ,400 46, ,200 46, ,312 44, ,257 50,
18 World Drug Report 2005 Volume 2. Statistics Peru, cultivation and reported eradication, in ha, , , ,000 hectares 80,000 60,000 40,000 20, Cultivation Eradication (ha) 224
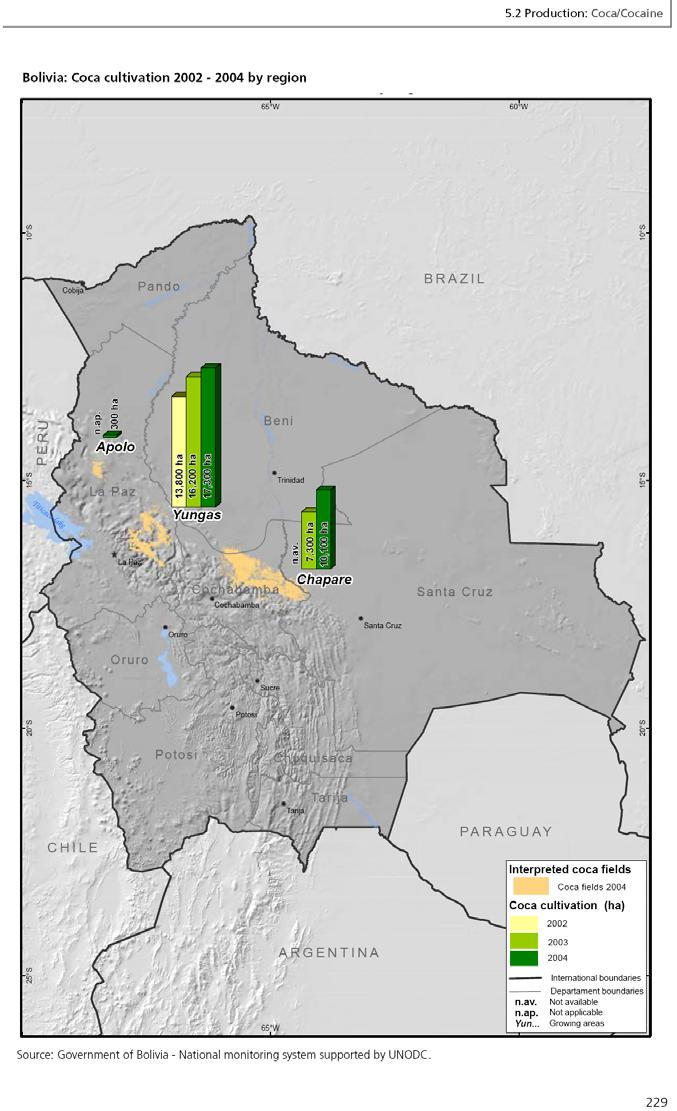
19 5.2 Production: Coca/Cocaine Bolivia Under its Illicit Crop Monitoring Programme, UNODC has been assisting the Bolivian Government in the implementation of a national coca monitoring system. For the first time, in 2003, the Bolivian project was extended to the national level and consequently, able to provide estimates for coca cultivation at the national level. Bolivia is the third largest producer of coca in the world. It trails far behind Colombia, the world s largest producer. Results of the 2004 UNODC Bolivia Annual Survey Coca Cultivation In 2004, the total area under coca cultivation in Bolivia was estimated to be 27,700 ha, an increase of 17% compared to last year s estimate of 23,600 ha. Although estimates for 2002 and before are not directly comparable with 2003 and 2004 estimates, it is widely recognized that there is an increasing trend in coca cultivation in Bolivia for the past few years. Geographical Distribution The increase in coca cultivation at the national level is mostly due to an increase in coca cultivation in the Chapare region from 7,300 ha to 10,100 ha, or 38%, between 2003 and The increase of 2,800 ha in Chapare represented 67% of the total increase of 4,150 ha. Coca cultivation in the Yungas increased by 7% between 2003 and 2004 to reach 17,300 ha, and it remained the most important region for coca cultivation in Bolivia, accounting for 62% of the total cultivation in Coca Production For the 2004 annual estimate of coca leaf and cocaine production, UNODC continues to rely on information available from other sources. The most comprehensive work on the subject was done by the US Government during the Operation Breakthrough that started in Bolivia in No data are available on coca yield production in the hidden coca fields of Chapare but it is generally agreed that the coca yields from hidden fields are substantially lower than from open coca fields. As an approximation, the yield estimates from the traditional area were applied to the hidden coca cultivation in Chapare. Based on these data, the total coca leaf production amounted to 36,300 metric tons, of which 25,000 metric tons were estimated to be available for cocaine production, the rest correspond to the 12,000 ha of cultivation permitted under Bolivian law. The potential cocaine production in Bolivia is estimated to have amounted to 107 metric tons in This corresponded an increase of 35% compared to the previous year s potential cocaine production of 79 metric tons. Coca prices Farm-gate prices of dry coca leaf have been collected in Chapare on a monthly basis by DIRECO since 1990, and by the UNODC monitoring project in the Yungas of La Paz since Average annual prices for coca leaf were higher in Chapare (US$ 5.2/kg) than in Yungas of La Paz (US$4.7/kg). Prices remained largely stable throughout 2004, although slightly increasing in the Yungas of La Paz to meet prices of Chapare for the last quarter of the year. Eradication In 2004, the Bolivian Government reported the eradication of 8,437 ha of coca fields. Only 4 ha were reported eradicated in the Yungas La Paz, and the remaining 8,433 ha in the Chapare region. This is a 225
20 World Drug Report 2005 Volume 2. Statistics similar pattern as in the previous year. In 2004, the level of reported eradication was 16% less than in In Bolivia, the eradication of coca cultivation is exclusively manual, no chemicals are used. 226
21 5.2 Production: Coca/Cocaine Fact Sheet: Bolivia Coca Survey Variation on Coca cultivation 23,600 ha +17 % 27,700 ha Of which in the Yungas of La Paz 16,200 ha +7% 17,300 ha in Chapare 7,300 ha +38% 10,100 ha in Apolo 50 ha n.a ha Of which permitted by Bolivian law ,000 ha 0% 12,000 ha non-permitted by Bolivian law ,600 ha +35% 15,700 ha Of which in national parks 2,400 ha +71% 4100 ha Average sun-dried coca leaf yielf in traditional coca growing areas outside traditional growing areas 940 kg/ ha 1,800 kg/ha 940 kg/ha 1,800 kg/ha Production of coca leaf 28,300 mt 36,200 mt Maximum potential production of cocaine in percent of global cocaine production 79 mt 12% +35% 107 mt 16% National weighted average farm-gate price of coca leaf (outside state market) n.a. 5.0 US$/kg Chapare average farm-gate price of coca leaf 5.4 US$/kg - 4% 5.2US$/kg Total farm-gate value of coca leaf production US$ 210 millions +12 % US$ 240 millions GDP US$ 7.8 billions + 3.8% US$ billions Farm-gate value of coca leaf production in percent of GDP 1.9 % 2.1 % Bolivia s agricultural GDP US$ 1.4 billions n.a. n.a. Farm-gate value of coca leaf production in percent of agricultural GDP 15% +2% 17% Reported seizure of cocaine paste 6,934 kg + 18% 8,189 kg Reported seizure of cocaine hydrochloride 5,969 kg - 91% 531 kg 6 Survey areas not comparable. 7 GDP of 2004 estimated from the 2003 GDP, and with a projected growth of 3.8% (source: INE) 227
22 World Drug Report 2005 Volume 2. Statistics Graphs, tables and maps: Bolivia Bolivia, coca cultivation, in ha, ,000 40,000 Hectares 30,000 20,000 10, Hectares 50,300 47,900 45,300 47,200 48,100 48,600 48,100 45,800 38,000 21,800 14,600 19,900 24,400 23,600 27,700 Bolivia, Distribution of coca cultivation (2004 UNODC survey) Area 2004 Coca Cultivation % of 2004 total Yungas of La Paz 17,300 63% Chapare 10,100 36% Apolo 300 1% Rounded Total 27, % Bolivia, coca cultivation by municipalities (2004 UNODC survey) Apolo 1% Chapare 36% Yungas of La Paz 63% 228
23
24 World Drug Report 2005 Volume 2. Statistics Bolivia, potential cocaine production, Metric Tons Metric Tons Bolivia, farm-gate prices of coca leaf, (US$/kg) January February March April May June July August September October November December Annual Average US$/kg
25 5.2 Production: Coca/Cocaine Bolivia, coca leaf prices, US$/kg, Bolivia, reported eradication and cultivation, in ha, Year Eradicated (ha) Cultivated (ha) ,026 45, ,621 38, ,999 21, ,953 19, ,435 19, ,853 24, ,087 23, ,437 27,700 Source: DIRECO Bolivia, reported eradication and cultivation, in ha, ,000 40,000 30,000 20,000 10, Eradication Cultivation 231
26 World Drug Report 2005 Volume 2. Statistics Seizure of Illicit laboratories MANUFACTURE SEIZURES OF ILLICIT LABORATORIES REPORTED FOR Remark: For convenience, an attempt was made to group the reported estimates by drug categories. however, due to inconsistencies and gaps in the reporting, no overall analysis of the data set was performed. Numbers are presented as reported to UNODC and should be interpreted with caution. Source: Annual Report Questionnaire if not otherwise indicated Country or Territory Year Name of drug seized Number of laboratories (and quantity of drug) Source COCA GROUP Africa Southern Africa South Africa 2003Cocaine 1 Lab. Subtotal Southern Africa 1 Lab. Total Africa 1 Lab. Americas Central America Honduras Lab. Subtotal Central America 3 Lab. North America United States 2002Cocaine 5 Lab.(1.000 kg) Subtotal North America 5 Lab.(1.000 kg) South America Argentina 2002Cocaine 9 Lab. 2003Cocaine 8 Lab. 2003Coca paste 3 Lab. Bolivia 2002Coca paste 1950 Lab.* F.O Lab. F.O 2002Cocaine base 1426 Lab. F.O 2003Coca paste 2544 Lab.* F.O 2003Cocaine base 1769 Lab. F.O Chile Lab Lab. Colombia Lab. Govt 2002Cocaine base 1273 Lab. Govt Lab. Govt Lab. Govt Lab. Govt 2003Cocaine base 822 Lab. Govt Peru Lab.( kg) Subtotal South America Lab.( kg) Total Americas Lab.( kg) Asia East and South-East Asia * Maceration pits 232
27 5.2 Production: Coca/Cocaine Country or Territory Year Name of drug seized Number of laboratories (and quantity of drug) Source Hong Kong Special Administrative Region of China 2002Cocaine 2 Lab. Subtotal East and South-East Asia 2 Lab. Total Asia 2 Lab. Europe West & Central Europe France 2002Cocaine 1 Lab. Germany, Lab. Federal Republic of Slovenia 2002Cocaine base 1 Lab. Subtotal West & Central Europe 3 Lab. Total Europe 3 Lab. Coca group Lab.( kg) 233
28
GLOBAL ILLICIT CULTIVATION OF COCA BUSH AND PRODUCTION OF COCA LEAF AND COCAINE, CULTIVATION (a) OF COCA BUSH IN HECTARES
 OF COCA BUSH IN HECTARES") 3.1. Production: Opium/heroin 3.2. Coca/ Cocaine GLOBAL ILLICIT CULTIVATION OF COCA BUSH AND PRODUCTION OF COCA LEAF AND COCAINE, 1990-2005 1990 1991 1992 1993 1994 1995 1996 1997 1998 1999 2000 2001 2002
3.1. Production: Opium/heroin 3.2. Coca/ Cocaine GLOBAL ILLICIT CULTIVATION OF COCA BUSH AND PRODUCTION OF COCA LEAF AND COCAINE, 1990-2005 1990 1991 1992 1993 1994 1995 1996 1997 1998 1999 2000 2001 2002
June 2006 COCA CULTIVATION IN THE ANDEAN REGION. A survey of Bolivia, Colombia and Peru. Government of Peru. Government of Colombia
 COCA CULTIVATION IN THE ANDEAN REGION A survey of Bolivia, Colombia and Peru June 2006 Government of Bolivia Government of Colombia Government of Peru UNODC's Illicit Crop Monitoring Programme (ICMP) promotes
Government of Colombia. Colombia. Coca Cultivation Survey
 Government of Colombia Colombia Coca Cultivation Survey June 2007 Censo de cultivos de coca 2006 1 ABBREVIATIONS COP DANE DEA DIRAN DNE DNP GME ICMP INCB IDB NNPS OAS PDA PCI RSS SIMCI UNODC USAID US$
ABBREVIATIONS ISSN
 ABBREVIATIONS COP DANE DEA DIRAN DNE DNP GME IGAC ICMP INCB IDB NNPS OAS PDA PCI RSS SIMCI UNODC USAID US$ mt Colombian Pesos National Department of Statistics US Drugs Enforcement Administration Colombian
PART 4. COLOMBIA COCA CULTIVATION SURVEY
 PART 4. COLOMBIA COCA CULTIVATION SURVEY SUMMARY FACTS SHEET 2004 Variation on 2004 2005 Net coca cultivation (rounded total) 80,000 hectares + 8% 86,000 hectares Of which Meta-Guaviare region 28,500
ONDCP August Cocaine. Smuggling
 ONDCP-01-07 August 2007 Cocaine Smuggling in 2006 Produced by the Office of National Drug Control Policy Cocaine Smuggling in 2006 The counterdrug community estimates that between 530 and 710 metric tons
Flag of Columbia - A Brief History
 Part of the History of National Flags Series from Flagmakers Flag of Columbia - A Brief History Where In The World Trivia The current flag is similar to the historical flag of Gran Colombia. Technical
COLOMBIAN NATIONAL POLICE CRIME REPORT
 COLOMBIAN NATIONAL POLICE CRIME REPORT 1 INDEX Presentation 3 Page Social Impact Offenses 4 I. Murders 5 II. Traffic fatalities 9 III. Personal injuries 12 IV. Traffic injuries 15 V. Thefts 17 VI. Motor-vehicle
COLOMBIAN NATIONAL POLICE CRIME REPORT
 Crime Report COLOMBIAN NATIONAL POLICE CRIME REPORT 1 Crime Report INDEX Presentation 3 Page Social Impact Offenses 4 I. Homicides 5 II. Traffic fatalities 9 III. Personal injuries 12 IV. Traffic injuries
Haga clic para cambiar el estilo tulo
 de tít Haga clic para modificar el estilo de texto del patrón Segundo nivel It developes processes, programs and strategies directed to the integral prevention of the differents forms and efects of psychoactive
Good quality WATER and healthy ENVIRONMENT, Fundamental rights
 7 Good quality WATER and healthy ENVIRONMENT, Fundamental rights Life, physical integrity, health, balanced foods and a healthy environment all are children and adolescents' rights. Public services are
Investment Environment and Business Opportunities in Colombia. February 2012
 Investment Environment and Business Opportunities in Colombia February 2012 About Proexport Proexport is Colombia s entity in charge of the promotion of International Tourism, Foreign Direct Investment,
Why Colombia Investment Environment & Business Opportunities
 Why Colombia Investment Environment & Business Opportunities Tobias Meurer Mai 2017 Table of Content 1. Recent Macroeconomic Developments 2. Investment Environment 3. Export Platform 4. Wood processing
Annual Coca Cultivation Survey 2001
 PERU UNDCP Annual Coca Cultivation Survey 2001 Illicit Crop Monitoring System Peru Country Office Peru March 2002 I. SUMMARY Illegal coca cultivation in Peru has registered significant changes in its dynamic
COCA CULTIVATION IN THE ANDEAN REGION
 Government of Bolivia Government of Colombia Government of Peru COCA CULTIVATION IN THE ANDEAN REGION A survey of Bolivia, Colombia and Peru June 2008 UNODC's Illicit Crop Monitoring Programme (ICMP) promotes
Colombia: An Upcoming Emerging Market for International Investors April 2012
 Colombia: An Upcoming Emerging Market for International Investors April 2012 Proexport is the organization within the Colombian Government responsible for the promotion of International Tourism, Foreign
Presentación Colombia Inglés. Investment Environment and Business Opportunities in Colombia. April 2015
 Presentación Colombia Inglés Investment Environment and Business Opportunities in Colombia April 2015 PROCOLOMBIA About us PROCOLOMBIA We promote exports, tourism, investment and industrial expansion for
THE STATUS OF THE COLOMBIAN EXPANDED INMUNIZATION PROGRAM (PAI)
") THE STATUS OF THE COLOMBIAN EXPANDED INMUNIZATION PROGRAM (PAI) Dra. Marcela Fama Pereira PEDIATRICIAN President of Colombian Society of Pediatrics - SCP Panama, October 19, 2018 PURPOSE Assessment Follow-up
THE STATUS OF THE COLOMBIAN EXPANDED INMUNIZATION PROGRAM (PAI) Dra. Marcela Fama Pereira PEDIATRICIAN President of Colombian Society of Pediatrics - SCP Panama, October 19, 2018 PURPOSE Assessment Follow-up
Birth Register and Statistics. A big challenge for the Pan American Health Organization (PAHO) Dr Fatima Marinho, HDM/HA Coordinator
 Dr Fatima Marinho, HDM/HA Coordinator") Birth Register and Statistics. A big challenge for the Pan American Health Organization (PAHO) Dr Fatima Marinho, HDM/HA Coordinator Congreso Mundial de Epidemiología. Porto Alegre, Brasil, September 21-25,
Birth Register and Statistics. A big challenge for the Pan American Health Organization (PAHO) Dr Fatima Marinho, HDM/HA Coordinator Congreso Mundial de Epidemiología. Porto Alegre, Brasil, September 21-25,
INVESTMENT IN COCOA, CHOCOLATE AND THE CONFECTIONERY INDUSTRY
 Libertad Ord en y Colombian cocoa was declared as fine or flavored cocoa, a category that covers only 5% of beans traded worldwide. (International Cocoa Organization ICCO, 2011). INVESTMENT IN COCOA, CHOCOLATE
UNEARMARKED FUNDS TO REPAY DREF ARE ENCOURAGED.
 COLOMBIA: FLOODS 18 November 2005 The Federation s mission is to improve the lives of vulnerable people by mobilizing the power of humanity. It is the world s largest humanitarian organization and its
PAHO Regional Perspective: Strengthening CR-VS in the Americas
 PAHO Regional Perspective: Strengthening CR-VS in the Americas Alejandro Giusti. Regional Advisor in Vital and Health Statistics s (PAHO) Strengthening Civil Registration World Bank, Washington, June 9,
WORLD TRADE ORGANIZATION
 WORLD TRADE ORGANIZATION Working Party on State Trading Enterprises G/STR/N/10/COL 8 June 2007 (07-2374) Original: Spanish STATE TRADING New and Full Notification Pursuant to Article XVII.4(a) of the GATT
COUNTRY BRIEF - COLOMBIA
 SSI RM Security & Risk Management Consultancy 'Safe in our hands' International House, George Curl Way, Southampton, SO18 2RZ w: www.ssi-ltd.com e: management@ssi-ltd.com t: +44 (0)20 3141 2100 COUNTRY
ANNEX 9-A PART 1 LIST OF COMMITMENTS OF COLOMBIA. Starting from the sixth year after coming into force of the revised GPA for Israel: 5,000,000 SDR
 ANNEX 9-A PART 1 LIST OF COMMITMENTS OF COLOMBIA SECTION A: ENTITIES AT THE CENTRAL LEVEL Goods 1 Thresholds: 130,000 SDR Services Thresholds: 130,000 SDR Construction Services Thresholds: 8,500,000 SDR
immap Because Information Matters
 immap Because Information Matters Vision For immap to be an international resource, for relief and host government agencies, that successfully integrates data into practical humanitarian plans through
Tourism Snapshot A Monthly Monitor of the Performance of Canada s Tourism Industry
 Tourism Snapshot A Monthly Monitor of the Performance of Canada s Tourism Industry December Volume 12, Issue 12 Michelle Valberg www.destinationcanada.com Tourism Snapshot December 1 KEY HIGHLIGHTS With
Appendix A. Technical Description of the Survey
 Appendix A. Technical Description of the Survey The University of Pittsburgh, by demand of USAID (Colombia) performed a thorough research of Colombia s main public opinion and market research companies.
COLOMBIAN SPACE COMMISSION: AN STRATEGY FOR THE SUSTAINABLE DEVELOPMENT OF COLOMBIA
 UN Committee on the Peaceful Uses of Outer Space: 2011 - Fifty-fourth fourth session COLOMBIAN SPACE COMMISSION: AN STRATEGY FOR THE SUSTAINABLE DEVELOPMENT OF COLOMBIA Iván n Darío o Gómez G Guzmán General
International Visitation to the Northern Territory. Year ending September 2017
 International Visitation to the Northern Territory Year ending September 2017 The following is a summary of information relevant to the Northern Territory (NT) tourism industry including visitation results
International Visitation to the Northern Territory. Year ending December 2017
 International Visitation to the Northern Territory Year ending December 2017 The following is a summary of information relevant to the Northern Territory (NT) tourism industry including visitation results
COLOMBIA IN THE WORLD
 Libertad Orden y GROWTH, CONFIDENCE AND OPPORTUNITIES TO INVEST OIL GOODS AND SERVICES COLOMBIA IN THE WORLD Colombia is one of the top twenty oil-producing countries, with a production of over a million
COLUMBIA RISK ASSESSMENT
 City & Country Bogota, Columbia Prepared by Sussex Abroad office Dates of travel July 2015 to August 2016 Updated January 2016 Students affected Study abroad students going to Universidad de Los Andes
Significant increase in accommodation activity but slightly less than in the previous month
 Tourism activity February 2015 15 April, 2015 Significant increase in accommodation activity but slightly less than in the previous month Hotel establishments recorded approximately 2.2 million overnight
Growth in hotel activity supported by the external market
 14 August 2017 Tourism Activity June 2017 Growth in hotel activity supported by the external market Hotel establishments recorded 2.1 million guests and 5.9 million overnight stays in June 2017, figures
Economic climate in Latin America improved slightly, despite worsening in Brazil
 August 13 th APRIL/2015 Ifo/FGV Economic Climate Index for Latin America 71 74 JULY/2015 Economic climate in Latin America improved slightly, despite worsening in Brazil The Ifo/FGV Economic Climate Index
Passenger Traffic Achieves Strong Growth of 4.8% for the Month of August
 Passenger Traffic Achieves Strong Growth of 4.8% for the Month of August Montréal, 7 October Passenger traffic experienced a slight surge in growth to almost +5% for August compared to previous months
Preliminary results for 2017 point to increases of 8.9% in guests and 7.4% in overnight stays
 14 February 2018 Tourism Activity December 2017 Preliminary results for 2017 point to increases of 8.9% in guests and 7.4% in overnight stays Hotel establishments recorded 1.2 million guests and 2.7 million
Tourism Snapshot A Monthly Monitor of the Performance of Canada s Tourism Industry
 Tourism Snapshot A Monthly Monitor of the Performance of Canada s Tourism Industry January 2017 Volume 13, Issue 1 Edmonton Tourism www.destinationcanada.com Tourism Snapshot January 2017 1 KEY HIGHLIGHTS
Impact vs Census (%) Venezuela Vichada. Guainía. Brazil. Sources: OCHA, SIMCI, IMMAP, DGR, DANE
 Venezuela Vichada. Guainía. Brazil. Sources: OCHA, SIMCI, IMMAP, DGR, DANE") Colombia Floods Situation Report #13 11/1/2011 This report was compiled by OCHA Colombia from official and secondary sources, UN agencies and INGOs. It covers the period from 29/12/2010 to 6/1/2011. The
Colombia Floods Situation Report #13 11/1/2011 This report was compiled by OCHA Colombia from official and secondary sources, UN agencies and INGOs. It covers the period from 29/12/2010 to 6/1/2011. The
Daniel Titelman Director Economic Development Division
 Daniel Titelman Director Economic Development Division Economic trends in the region continue to be marked by: Uncertainty and risk in the global economy: External demand remains sluggish, which reflects
Statistics of Air, Water, and Land Transport Statistics of Air, Water, and Land. Transport Released Date: August 2015
 Statistics of Air, Water, and Land Transport 2014 2013 1 Released Date: August 2015 Table of Contents Introduction... 4 Key Points... 5 1. Air Transport... 6 1.1 Aircraft movements... 6 1.2 Number of passengers...
Non residents boost hotel activity
 14 November 2017 Tourism Activity September 2017 Non residents boost hotel activity Hotel establishments recorded 2.2 million guests and 6.3 million overnight stays in September 2017, figures that relate
Residents ensure increase on overnight stays in hotels and similar establishments
 13 July 2018 Tourism Activity May 2018 Residents ensure increase on overnight stays in hotels and similar establishments Hotels and similar establishments registered 2.0 million guests and 5.4 million
Significant increases in overnight stays and revenue
 15 April 2016 Tourism Activity February 2016 Significant increases in overnight stays and revenue Hotel establishments recorded 989.9 thousand guests and 2.6 million overnight stays in February 2016, the
MARKET NEWSLETTER No 57 January 2012
 OVERVIEW OF INTRA-EUROPEAN UNION TRADING BETWEEN 2007/08 AND 2010/11 The data on intra-eu trade reported in this month s newsletter have been taken from the EUROSTAT database. However, it is important
Sugar Cane production in both Haiti and the DR are down. New markets could restore production to historic levels.
 Sugar Cane production in both Haiti and the DR are down. New markets could restore production to historic levels. Sugar Cane Production in Haiti and the DR Dominican Republic 25 Haiti 2 15 1 Hectares Harvested
Tourism Snapshot A Monthly Monitor of the Performance of Canada s Tourism Industry
 Tourism Snapshot A Monthly Monitor of the Performance of Canada s Tourism Industry February 2017 Volume 13, Issue 2 www.destinationcanada.com Tourism Snapshot February 2017 1 KEY HIGHLIGHTS Canada welcomed
Informal Cross Border Food Trade in Southern Africa
 Informal Cross Border Food Trade in Southern Africa Issue 78 August 212 Inside this issue: Summary and Overview Summary of Maize trade flows Summary of rice trade flows Summary of bean trade flows Annex
Steep increases in overnight stays and revenue
 Tourism Activity October 2016 December,15 th 2016 Steep increases in overnight stays and revenue Hotel establishments recorded 1.8 million guests and 5.0 million overnight stays in October 2016, figures
Results of Tourism Activity Mexico, March 2017
 Results of Tourism Activity Mexico, March Undersecretariat of Planning and Tourism Policy Available in http://www.datatur.sectur.gob.mx/sitepages/versionesrat.aspx DIRECTORy ENRIQUE DE LA MADRID CORDERO
Paraguay. International Trade Report January-May 2015
 Paraguay International Trade Report January-May 2015 MH / SSEE / DI / DECI MAY 2015 INDEX EXPORTS Graph 1: Evolution of Exports (January to May 2011-2015) Graph 2: Exports by major trade blocs and countries
BRAZIL INTERNATIONAL INBOUND TRAVEL MARKET PROFILE (2011) Copyright 2012 by the U.S. Travel Association. All Rights Reserved.
 Copyright 2012 by the U.S. Travel Association. All Rights Reserved.") BRAZIL INTERNATIONAL INBOUND TRAVEL MARKET PROFILE (211) Copyright 212 by the U.S. Travel Association. All Rights Reserved. EXECUTIVE SUMMARY With a population of nearly 2 million and a GDP exceeding $2
BRAZIL INTERNATIONAL INBOUND TRAVEL MARKET PROFILE (211) Copyright 212 by the U.S. Travel Association. All Rights Reserved. EXECUTIVE SUMMARY With a population of nearly 2 million and a GDP exceeding $2
Results of Tourist Activity
 Results of Tourist Activity México, January, 2014 Ministry of Tourism Tourist Planning and Policy Undersecretariat Index Relevant Results, January, 2014.. Analysis of Main Results in the Sector..... 1
Informal Cross Border Food Trade in Southern Africa
 Informal Cross Border Food Trade in Southern Africa Issue 6 November 6 Monthly Highlights: Overall informal trade in maize, rice and beans lower this season than past two seasons. Zambia s informal exports
Visit Wales Research Update
 Visit Wales Research Update 19 January 21 This update summarises tourism performance by drawing upon Visit Wales own research and information from other relevant sources. It is based upon information available
International economic context and regional impact
 Contents I. GDP growth trends in Latin America and the Caribbean in 2012 II. Regional performance in 2012: Inflation, employment and wages External sector Policies: Fiscal and Monetary III. Conclusions
Results of Tourism Activity
 Results of Tourism Activity Mexico, July 2016 Lago de San Miguel Regla, Hidalgo. Jardín en Hacienda San Gabriel, Morelos. Parras, Coahuila. Paseo Santa Lucía, Monterrey. Undersecretariat of Planning and
The contribution of Tourism to the Greek economy in 2017
 The contribution of Tourism to the Greek economy in 2017 1 st edition (provisional data) May 2018 Dr. Aris Ikkos, ISHC Research Director Serafim Koutsos Analyst INSETE Republishing is permitted provided
COLOMBIA Investment Environment and Business Opportunities in Colombia. June 2012
 COLOMBIA Investment Environment and Business Opportunities in Colombia June 2012 About us Proexport is Colombia s entity in charge of the promotion of International Tourism, Foreign Direct Investment,
Easter boosts results in tourism accommodation
 16 May 2016 Tourism Activity March 2016 Easter boosts results in tourism accommodation Hotel establishments recorded 1.4 million guests and 3.7 million overnight stays in March 2016, the equivalent to
GROWTH, CONFIDENCE AND OPPORTUNITIES TO INVEST
 GROWTH, CONFIDENCE AND OPPORTUNITIES TO INVEST HOTEL & TOURISM INFRASTRUCTURE ATTRACTIVE INCENTIVES FOR INVESTMENT IN THE HOTEL INDUSTRY Exemption from income taxes for a period of 30 years: the exemption
Colombia Infogram. Synopsis II Sem 2016
 Colombia Infogram Synopsis II Sem 2016 Internal Displacement Explosive Devices Natural Disasters Homicides and Disappearence Rate per 100,000 inhabitants Internal Displacement Internal Displacement 2016
Results of Tourism Activity Mexico, April 2017
 Results of Tourism Activity Mexico, April Undersecretariat of Planning and Tourism Policy Available in http://www.datatur.sectur.gob.mx/sitepages/versionesrat.aspx DIRECTORy ENRIQUE DE LA MADRID CORDERO
Produced by: Destination Research Sergi Jarques, Director
 Produced by: Destination Research Sergi Jarques, Director Economic Impact of Tourism Epping Forest - 2014 Economic Impact of Tourism Headline Figures Epping Forest - 2014 Total number of trips (day & staying)
EUROPEAN COMMISSION DIRECTORATE-GENERAL HUMANITARIAN AID AND CIVIL PROTECTION - ECHO
 EUROPEAN COMMISSION DIRECTORATE-GENERAL HUMANITARIAN AID AND CIVIL PROTECTION - ECHO Monthly report number 2013/10 Month OCTOBER Country South America (except Colombia for HA) Date of submission 08/11/13
UNOSAT Climate Service Flood and Drought Monitoring
 UNOSAT Climate Service Flood and Drought Monitoring El Niño Monthly Update Colombia March 2016 El Niño Monthly Update Colombia 24 March 2016 Geneva, Switzerland UNOSAT Contact: Postal Address: Email: unosat@unitar.org
4,000 3,000 2,000 1,000 2,500 2,000 1,500 1, ,000
 REGIONAL MAIZE SUPPLY AND MARKET OUTLOOK UPDATE Southern Africa December, 215 ABOUT THIS UPDATE This report provides a summary of changes to regional maize availability estimates and markets in Lesotho,
Produced by: Destination Research Sergi Jarques, Director
 Produced by: Destination Research Sergi Jarques, Director Economic Impact of Tourism Oxfordshire - 2015 Economic Impact of Tourism Headline Figures Oxfordshire - 2015 Total number of trips (day & staying)
BUSINESS BAROMETER December 2018
 Credit: Chris Orange BUSINESS BAROMETER December Credit: Nigel Moore 1 Contents Summary of findings 3 Annual monthly performance: visitor attractions..4 Visit Herts Team update 5 National context.8 Visitor
Tourism Snapshot A Monthly Monitor of the Performance of Canada s Tourism Industry
 Tourism Snapshot A Monthly Monitor of the Performance of Canada s Tourism Industry December 2015 Volume 11, Issue 12 www.destinationcanada.com Tourism Snapshot December 2015 1 2 Tourism Snapshot December
Colombia Humanitarian Situation. Synopsis July December 2012
 Colombia Humanitarian Situation Synopsis July December 212 Internal Displacement Explosive Devices Natural Disasters Homicides HSRI Explosive Devices 29-212 Victims (212) APM-ERW Source: Programa Presidencial
Regional Director Latin America and Caribbean
 U.S. GRAINS COUNCIL Around the world; Around the clock Kurt Shultz Regional Director Latin America and Caribbean Leveraged Funding Non-Cash $7.8 Million Member Cash $5.2 Million FAS Funds $14.8 Million
Overnights of residents and non residents increased by 9%, accelerating when compared with the previous month
 15 January 2018 Tourism Activity November 2017 Overnights of residents and non residents increased by 9%, accelerating when compared with the previous month Hotel establishments recorded 1.2 million guests
Main indicators kept growing
 September, 15 th 2016 Tourism Activity July 2016 Main indicators kept growing Hotel establishments recorded 2.1 million guests and 6.5 million overnight stays in July 2016, corresponding to year-onyear
Results of Tourism Activity
 Results of Tourism Activity Mexico, June Undersecretariat of Planning and Tourism Policy Available in http://www.datatur.sectur.gob.mx/sitepages/versionesrat.aspx DIRECTORy ENRIQUE DE LA MADRID CORDERO
Global Airline Trends and Impacts International Aviation Issues Seminar
 Global Airline Trends and Impacts International Aviation Issues Seminar December 2017, Washington D.C. Oliver Lamb Managing Director 1 Around the world in 45 minutes Financial Performance Canada Mexico
Tourism Snapshot A Monthly Monitor of the Performance of Canada s Tourism Industry
 Tourism Snapshot A Monthly Monitor of the Performance of Canada s Tourism Industry September Volume 14, Issue 8 Tourism Toronto www.destinationcanada.com Tourism Snapshot September 1 KEY HIGHLIGHTS IMPORTANT
Colombia Infogram. Synopsis 2015
 Colombia Infogram Synopsis Internal Displacement Explosive Devices Natural Disasters Homicides and Disappearence Rate Internal Displacement Internal Displacement Source: Unidad Para la Atención y Reparación
LATIN AMERICAN DRUGS I: LOSING THE FIGHT. Latin America Report N March 2008
 LATIN AMERICAN DRUGS I: LOSING THE FIGHT Latin America Report N 25 14 March 2008 TABLE OF CONTENTS EXECUTIVE SUMMARY AND RECOMMENDATIONS... i I. INTRODUCTION... 2 II. DRUG CROPS AND COCAINE PRODUCTION:
BUSINESS OPPORTUNITIES IN COLOMBIA
 INVESTMENT Presentación ENVIRONMENT AND Colombia- inglés BUSINESS OPPORTUNITIES IN COLOMBIA 2017 1 Peace is bringing new opportunities to Colombia A Greater Colombia- Postconflict FDI promotion impact
Outlook for (some) Emerging Economies
 Emerging Economies") Outlook for (some) Emerging Economies Sebastián Claro Deputy Governor Central Bank of Chile 11th Asia Copper Conference, Shanghai, November 18, 215 Central Bank of Chile, November 215 1 The last 1 years
Outlook for (some) Emerging Economies Sebastián Claro Deputy Governor Central Bank of Chile 11th Asia Copper Conference, Shanghai, November 18, 215 Central Bank of Chile, November 215 1 The last 1 years
Colombia Humanitarian Situation. Synopsis I Sem 2014
 Colombia Humanitarian Situation Synopsis I Sem 214 Internal Displacement Explosive Devices Natural Disasters Homicides and Disappearence HSRI Internal Displacement Internal Displacement 213 Source: Unidad
Colombia Humanitarian Situation. Synopsis I Sem2014
 Colombia Humanitarian Situation Synopsis I Sem214 Internal Displacement Explosive Devices Natural Disasters Homicides and Disappearence HSRI Internal Displacement 213 Source: Unidad Para la Atención y
Textile Per Capita Consumption
 January 2018 Textile Per Capita Consumption 2005-2022 Part 2: Upper middle income countries - - CHF500.- Table of Contents Preface... 4 Sources... 5 Definitions... 6 Charts... 7 Executive Summary... 10
AFTA Travel Trends. July 2017
 AFTA Travel Trends July 2017 AFTA Travel Trends Report 2017 Inbound and Outbound overview Introduction This snapshot provides an overview of the balance of trade between Inbound and Outbound Travel for
Prospects for international tourism
 Prospects for international tourism Project LINK UN DESA Expert Group Meeting on the World Economy, NYC, USA 24-26 October 211 John G.C. Kester Programme Manager, Tourism Trends and Marketing Strategies
Appendix A: Technical Description of the Sample
 Appendix A: Technical Description of the Sample Sample Design 1 The sample in Colombia was designed to include all non-institutionalized adults (i.e., it excludes people living in the country s jails,
Results of Tourism Activity Mexico, February 2017
 Results of Tourism Activity Mexico, February Undersecretariat of Planning and Tourism Policy Available in http://www.datatur.sectur.gob.mx/sitepages/versionesrat.aspx DIRECTORy ENRIQUE DE LA MADRID CORDERO
Informal Cross Border Food Trade in Southern Africa
 Monthly Highlights: Observed informal cross border trade in maize, rice and beans continue to decline as demand for imports declines in Malawi and Zambia due to favorable harvests. Maize prices are lower
July 2012 Passenger and Cargo Traffic Statistics Reno-Tahoe International Airport
 July 2012 Passenger and Cargo Traffic Statistics Reno-Tahoe International Airport August 31, 2012 U.S. DOMESTIC INDUSTRY OVERVIEW FOR JULY 2012 All RNO Carriers Systemwide year over year comparison Average
Results of Tourism Activity Mexico, May 2017
 Results of Tourism Activity Mexico, May Undersecretariat of Planning and Tourism Policy Available in http://www.datatur.sectur.gob.mx/sitepages/versionesrat.aspx DIRECTORy ENRIQUE DE LA MADRID CORDERO
MONTHLY NATURAL GAS SURVEY. November 2009
 MONTHLY NATURAL GAS SURVEY November 2009 INTERNATIONAL ENERGY AGENCY INTERNATIONAL ENERGY AGENCY Next Release: 12 March 2010 MONTHLY NATURAL GAS SURVEY - 1 CONTENTS TABLE 1 Natural Gas Balances in OECD
Congressional Briefing Southern California Air Cargo Traffic and its Impact on the Region s Economy
 Congressional Briefing Southern California Air Cargo Traffic and its Impact on the Region s Economy World Trade Week Briefing Series Los Angeles Chamber of Commerce Thursday, March 17, 2011 The Role of
Informal Cross Border Food Trade in Southern Africa
 Monthly Highlights: Informal trade in maize and beans increased in uary compared to ember 27, while that of rice decreased. ly, maize traded from il to uary remained at almost the same level as last season,
MONITORING INFORMAL CROSS- BORDER TRADE IN STAPLE FOODS IN SOUTHERN AFRICA
 MONITORING INFORMAL CROSS- BORDER TRADE IN STAPLE FOODS IN SOUTHERN AFRICA A collaborative activity between WFP and FEWS NET Presented at the FAO/University of Pretoria Workshop on Government and Private
INFORMAL CROSS BORDER FOOD TRADE IN SOUTHERN AFRICA. Food Trade Bulletin
 VOLUME 1 ISSUE 2 INFORMAL CROSS BORDER FOOD TRADE IN SOUTHERN AFRICA Food Trade Bulletin April 2014 to March 2015 Inside This Issue 1 Highlights 2 Overview of trade in the 2014/15 marketing season 3 Trade
Easter boosts results in tourism accommodation
 14 June 2017 Tourism Activity April 2017 Easter boosts results in tourism accommodation Hotel establishments recorded 1.9 million guests and 5.1 million overnight stays in April 2017, figures that relate
Results of Tourism Activity
 Reporting Date: January 18, 2016 Results of Tourism Activity Mexico, November 2015 Reserva de la Biósfera El Cielo, Tamaulipas. San Juan de Ulúa, Veracruz. Museo de la Muerte, Aguascalientes. Xilitla,