By a Silken Thread regional banking integration & pathways to financial development in Japan s Great Recession
|
|
|
- Asher Fitzgerald
- 5 years ago
- Views:
Transcription
1 By a Silken Thread regional banking integration & pathways to financial development in Japan s Great Recession Mathias Hoffmann Toshihiro Okubo University of Zurich, URPP FinReg, CESifo & CAMA Keio University Stanford APARC, 1 Dec 2015 Hoffmann & Okubo () By a Silken Thread Stanford APARC, 1 Dec / 25
2 Background What is the role of banking integration in a financial crisis? Theoretically, integration... increases an economy s exposure to foreign bank liquidity shocks... insulates from idiosyncratic shocks to domestic banking system How do historical factors determine the trade-off between integration and segmentation of banking markets? We look at the regional spread of Japan s Great Recession after 1990, exploiting prefecture-level variation in banking integration and local bank dependence Hoffmann & Okubo () By a Silken Thread Stanford APARC, 1 Dec / 25
3
4 Preview of results Cross-regional variation in financial (banking) integration was a key determinant of the transmission of the crisis post-1990 more integrated prefectures more exposed to the property price downturn in the major cities But: FI was good for areas with many small manufacturing firms (SME): internal capital markets mattered: nationwide banks withdrew less strongly from areas with many small manufacturing firms We suggest persistent banking relationships as a driver of de facto segementation in regional banking markets. The Silken thread: de facto segmentation in Japan s banking market can be traced back in history: comparative advantage in silk in the late 19th-century led to a regionally-tiered banking system with close SME-bank relationships. Hoffmann & Okubo () By a Silken Thread Stanford APARC, 1 Dec / 25
5 The silken thread Figure: City and Regional Bank Lending Shares (pre-1990 ( ) averages) vs. number of silk filatures per head in 1895 Tokyo Yamanashi Osaka Kyoto lending share of City Banks pre 1990 Nara Fukuoka Kanagawa Saitama Miyagi Kagawa Aichi Nagasaki Ishikawa Chiba Tochigi Aomori Tokushima Toyama Hiroshima Fukui Hyogo Yamaguchi Ibaraki Kyoto Okayama Akita Gunma Shizuoka Mie Ehime Kumamoto Hokkaido Niigata Tottori Wakayama Oita Shiga Miyazaki Saga Fukushima Kagoshima Iwate Yamagata Kochi Shimane Gifu Nagano Yamanashi lending share of Shinkins pre 1990 Hokkaido Kumamoto Nara Osaka Tokyo Nagasaki Aomori Hiroshima Fukuoka Shizuoka Hyogo Wakayama Kanagawa Saitama Oita Fukui Fukushima Kagoshima Niigata Okayama Shiga Chiba Yamaguchi Miyazaki Kagawa Kochi Ehime Tokushima Tochigi Iwate Miyagi Shimane Mie Akita Gunma Ibaraki Ishikawa Aichi Toyama Saga Tottori Yamagata Gifu Nagano log # silk filatures per capita in log # silk filatures per capita in 1895 The silken thread: Regional financial integration in 1990 low in areas in with a high share of silk-exporting (reeling) firms in 1895 Hoffmann & Okubo () By a Silken Thread Stanford APARC, 1 Dec / 25
6 Policy implications Relevant in the context of the Eurozone today Was there too little or too much financial integration in Europe during the banking & sovereign debt crisis? optimal degree of banking integration of an economy depends on the structure of loan demand by local firms: regions with many SMEs that depend on the local provision of bank loans have more to gain from banking integration. local finance may be a poor substitute for finance from integrated banks in a crisis. A cautionary lesson: differences in financial integration can persist in a de iure integrated banking market. For a VERY long time... Hoffmann & Okubo () By a Silken Thread Stanford APARC, 1 Dec / 25
7 Our story (I): intra-national barriers to capital flows Remark Japan is a centralized country, no major regional differences in banking or financial regulation etc. Broadly similar levels of financial development (e.g. in terms of credit over GDP, bank branches p.c and area) But: a regionally strongly tiered banking system city banks & 1st tier regional banks operate nationwide or at least in severl prefecture 2nd tier regional banks (Sogo (mutual)), industrial cooperative banks (Shinkin) regional lenders to SMEs, regional deposit base, limited or no access to Interbank market Exploit variation in (pre-1990) share of nationwide banks in prefecture-level lending as measure of financial (banking) integration Hoffmann & Okubo () By a Silken Thread Stanford APARC, 1 Dec / 25
8 Figure: Geographical distribution of Pre-1990 SME importance and financial integration and post-1990 p.c. GDP growth rates Hoffmann & Okubo () By a Silken Thread Stanford APARC, 1 Dec / 25
9 Theoretical considerations Figure: A stylized interregional banking model Hoffmann & Okubo () By a Silken Thread Stanford APARC, 1 Dec / 25
10 Empirical framework. Main specification: gdpt k = AggShock t [ α 0 FI k SME k + α 1 FI k + α 2 SME k +... ] +µ k + τ t + ɛ k t (1) where AggShock t = Post1991 t and our theory predicts α 0 > 0. Note: this does not imply that FI is unambigously good. E.g., if integrated banks are hit harder than local banks overall, then α 1 < 0 and the marginal effect α 1 + α 0 SME k can be negative. Hoffmann & Okubo () By a Silken Thread Stanford APARC, 1 Dec / 25
11 A first look: high/low FI sample split Table: Small business importance, financial integration and the Great Recession Small manufacturing firms and the effect of the Great Recession on prefecture-level output growth rates Panel A: Based on value added SME-measure All Sample split by importance of... prefectures Regional Banks City Banks Regional Banks: Shinkins only high low high low high low Post1991t SMEVA k (-2.04) (-4.04) (-0.19) (-0.25) (-3.82) (-3.03) (-0.70) R Panel B: Based on employment based SME-measure All prefs. high low high low high low Post1991t SMEEMP k (-1.96) (-3.73) (0.01) (-0.02) (-3.78) (-4.06) (-0.64) R The table shows the coefficient α in panel regressions of the form gdp k t = α Post1991t SME k + µ k + τt + ɛ k t + constant where Post1991t is a dummy indicating the period from 1991, SME k is small-business importance andµ k and τt are prefecture-fixed and time effects respectively. Sample period is Cooperative banks include Shinkin banks and industrial credit cooperatives. OLS estimates, t-statistics in parentheses. Standard errors are clustered by prefecture. Example Hoffmann & Okubo () By a Silken Thread Stanford APARC, 1 Dec / 25
12 Figure: Cumulative Growth Differential between high and low SME group in two-way sample split (High/Low City Bank Share and High/Low SME share by value added ) Relative cumulative output loss of credit-dependent prefectures worse with low financial integration (red, dashed line). Hoffmann & Okubo () By a Silken Thread Stanford APARC, 1 Dec / 25
13 Baseline specification: interaction term regs Table: Baseline results interaction terms and robustness I II III IV V VI VII VIII IX X FI = FI = FI = FI = Interactions of Post1990t High Regional High City Regional City Regional City Regional High City with... (dummy) (dummy) (share) (share) (dummy) (share) (share) (dummy)...sme k FI k (-2.15) (1.93) (-3.24) (3.78) (-2.15) (1.75) (-2.14) (2.53) (2.24) (1.73)...FI k (1.93) (-1.97) (3.87) (-5.03) (-0.49) (-0.65) (0.21) (-1.96) (-1.66) (-1.35)...SMEVA k (-1.12) (-3.84) (2.72) (-4.06) (-3.64) (-3.51) (-3.80) (-3.97) (-3.97) (-3.56) Controls: X k :...CoreArea (-3.25) (-3.30) (-4.00) (-2.63) (-3.25) (-2.46) (-3.37) (-3.05) (-3.33) (-2.75) R Prefectures Tokio dropped All Tokio dropped All Tokio dropped potential outliers dropped Remarks SME, FI demeaned SME dummy The Table shows results from the regression gdpt k = Post1990t [ ] α0smeva k FI k + α1fi k + α2smeva k + α 3Xt k + µ k + τt + ɛ k t where Post1990t is a dummy indicating the period after 1990 ( ), SMEVAis k small-business importance based on value added, FI k is the measure of financial integration (regional or city bank share in total lending in prefecture k), as indicated in the column heading. µ k and τt are prefecture-fixed and time effects respectively. The vector X k captures prefecture characteristics. In the regressions it is interacted with our crisis dummy Post1990t and contains CoreArea k, a dummy for the core economic areas (Tokyo, Osaka, Aichi, Kanagawa, Chiba, Saitama, Hyogo and Kyoto prefectures). The sample period is OLS estimates, t-statistics in parentheses. Standard errors are clustered by prefecture. In the regressions in column X, we identify a prefecture as a potential outlier if SME or FI are more than 1.64 standard deviations away from the cross-prefectural mean of the respective variable. This leads us to exclude the following six prefectures: Saitama, Tokio, Gifu, Shiga, Osaka, Nagasaki. Robustness Hoffmann & Okubo () By a Silken Thread Stanford APARC, 1 Dec / 25
14 Geographical profile Figure: Geographical profile of the interaction between bank dependence and financial integration Hokkaido Aomori Iwate Miyagi Akita Yamagata Fukushima Ibaraki Tochigi Gunma Saitama Chiba Tokyo Kanagawa Niigata Toyama Ishikawa Fukui Yamanashi Nagano Gifu Shizuoka Aichi Mie Shiga Kyoto Osaka Hyogo Nara Wakayama Tottori Shimane Okayama Hiroshima Yamaguchi Tokushima Kagawa Ehime Kochi Fukuoka Saga Nagasaki Kumamoto Oita Miyazaki Kagoshima Prefecture Hoffmann & Okubo () By a Silken Thread Stanford APARC, 1 Dec / 25
15 Our story (I): financial integration and the spread of the Great Recession Post-1990 growth lower in prefectures with many small (credit-dependent) firms (α2 < 0) high levels of financial integration (α1 < 0). But: SME and FI interact negative effect of FI (or SME) is mitigated in high SME-regions (α 0 > 0) Interpretation in line with model FI increase vulnerability to aggregate shocks but can also provide insulation agains local shocks. SMEs depend on local access to finance and therefore are particularly exposed to local bank shocks. Conditioning on the size of the shock to city and local banks, FI attenuates the effect in high SME prefectures. Hoffmann & Okubo () By a Silken Thread Stanford APARC, 1 Dec / 25
16 Transmission channel Theoretical model assumes that markets for SME lending are segmented: SMEs borrowing from local banks face higher interest rates In integrated markets, SMEs could switch to city banks and total lending (and GDP) growth should be independent of pre-crisis city bank lending share contrary to our finding We argue that it is the strong relationships between local banks and local SMEs that segment the market. Regional banks have long-standing informational advantage w.r.t. their customer base of small firms. But during a crisis these relationships may be a fetter for SME s: Nationwide banks may be unwilling to lend to unknown, risky customers Regional banks with their locally concentrated portfolio lend to SME s only at less favorable terms. Hoffmann & Okubo () By a Silken Thread Stanford APARC, 1 Dec / 25
17 Transmission channel: evidence I City banks keep on lending in areas where they have strong ties to SME Table: Prefecture-level lending after 1990 Lending growth Interactions of Post1990t with pre-1991 variables total City Banks Local Banks total City Banks Local Banks total City Banks Local Banks I II III IV V VI VII VIII IX FI=CityBankShare FI = CityBankShare FI =CityBankShare Tokyo&Osaka excluded Tokyo&Osaka excluded AggShockt= log(landpricet)...smeemp k FI l (2.67) (2.61) (-1.27) (0.61) (1.90) (-0.78) (-1.44) (-1.76) (0.57) FI k (-3.91) (-4.60) (-2.21) (-2.39) (-2.56) (-1.44) (3.70) (1.98) (1.08) SME k (-2.65) (-2.47) (1.00) (-1.16) (-1.36) (1.04) (4.34) (2.78) (3.65)...CoreArea (-4.06) (-3.06) (1.04) (-3.76) (-3.20) (1.21) (8.18) (6.80) (3.69) R Memorandum item: Fraction of SME with City Bank as main bank2002 = (tstat=6.49) CityBankShare k R2 = 0.49 The Table shows results from the regression log(xt k ) = Post1990t [ ] α0smeemp k FI k + α1fi k + α2smeemp k + α 3Xt k + µ k + τt + ɛ k t where Xt k stands in turn for total lending (columns I, IV and VII), city bank lending (columns II, V and VIII) and city bank lending relative to regional bank lending (columns III, VI and IX) in prefecture k. Post1990t is a dummy indicating the period after 1990 (i.e ), SME k is our measure of bank dependence (small-business importance), FI k is a measure of financial integration, the pre-1991 ( ) average city bank share in total lending in prefecture k. In the third panel (columns VII IX), the aggreagte shock is given by the land price decline in the core prefectures from?.µ k and τt are prefecture-fixed and time effects respectively. CoreArea is a dummy for the core economic areas (Tokyo, Osaka, Aichi, Kanagawa, Chiba, Saitama, Hyogo and Kyoto prefectures). The sample period is The memorandum item at the bottom of the table reports the regression of the fraction of small firms reporting a city bank as main bank on our pre-1990 measure of financial integration, the average lending share of city banks in a prefecture in Hoffmann & Okubo () By a Silken Thread Stanford APARC, 1 Dec / 25
18 Transmission channel: evidence II SME-local bank relationships extremely persistent in the silk regions Figure: Silken thread and silken fetters SME share w/o change in bank relationship Tokushima Nagasaki Nara Kochi Shiga Aomori Ehime Fukui Mie Yamaguchi Tochigi Miyazaki Fukushima Iwate Hiroshima Kagawa Saitama Shizuoka Kumamoto Miyagi Okayama Kagoshima Chiba Hyogo Tokyo Osaka Fukuoka Hokkaido Niigata Oita Kanagawa Wakayama Shimane Akita Ishikawa Yamagata Tottori Toyama Gunma Saga Ibaraki Aichi log # silk filatures per capita in 1895 Kyoto Nagano Gifu Yamanashi Hoffmann & Okubo () By a Silken Thread Stanford APARC, 1 Dec / 25
19 Transmission channel: evidence III Table: Transmission mechanism: ancillary implications of model A: Hold-up B: Exposure to local shocks Tier 2 banks Tier 1 banks All High FI Low FI All High FI Low FI High FI Low FI I II III IV V VI VII VIII Interactions of Post1990t with pre-1991 variables Dependent variable is average loan interest rate FI = CityBankShare Interactions of LocalLandPrice k t with pre-1991 variables Dependent variable is GDPgrowth FI = CityBankShare...SMEVA k Real estate exposure SMEVA k Tier 2 Real estate exposure (2.13) (1.00) (2.02) (-0.59) (0.59) (-2.09) (-2.22) (4.65) Real estate exposure Tier 2 Real estate exposure (0.86) (1.64) (0.42) (0.16) (-1.03) (1.54) (0.89) (-3.70) SMEVA k SMEVA k (-1.52) (-0.80) (-0.67) (1.46) (1.32) (0.97) (-0.64) (2.21)...CoreArea (-3.57) (-2.8) (-1.21) (-1.35) Add l controls LocalLandPricet k (1.44) (0.93) SME k Citylandpricet (1.03) (1.47) R number of prefectures The Table shows regressions illustrating the ancillary implications of the stylized banking model discussed in the main text: hold-up (panel A) and differential exposure to local shocks (panel B). Panel A presents regressions of the form Rt k (Tier) = Post1990t [ ] α0smeva k REE(Tier) k + α1ree(tier) k + α2smeva k + α 3Xt k + µ k + τt + ɛ k t where Tier = 1, 2 stands for either tier 1 (supraregional) or tier 2 (local) banks and R(Tier) k t is the average interest rate charged by banks of the respective tier in prefecture k and REE(Tier) k denotes these banks pre-1990 real estate exposure. Regressions are reported for all (colums I, IV), and for high (low) financial integration prefectures (columns II and III for tier 1 and columns V and VI for tier 2). As before, Post1990t is a dummy indicating the period after 1990 (i.e ), SME k is our measure of small-business importance (based on value added), FI k is our measure of financial integration, the pre-1990 lending share of city banks in prefecture k. CoreArea is a dummy for the core economic areas (Tokyo, Osaka, Aichi, Kanagawa, Chiba, Saitama, Hyogo and Kyoto prefectures). The sample period is Panel B shows the regressions of the form gdpt k = LocalLandpricet k [ α0smeva k REE(2) k + α1ree(2) k + α2smeva k + α3] + α4 CityLandpricet SME k + µ k + τt + ɛ k t where LocalLandpricet k is the log change in land prices in prefecture k and CityLandpricet is the log change in land prices in the core areas and REE(2) k is the pre-1990 real estate exposure of local (Tier = 2) banks in prefecture k. The variables SME and FI are as before. The sample period is In both panels, µ k and τt are prefecture-fixed and time effects respectively. The memorandum item at the bottom of the table reports the regression of the fraction of small firms reporting a city bank as main bank on our pre-1990 measure of financial integration, the average lending share of city banks in a prefecture in Hoffmann & Okubo () By a Silken Thread Stanford APARC, 1 Dec / 25
20 Our story (part II): silken threads and silken fetters What are the deep sources of prefecture-level differences in financial integration? Cross-prefecture differences in the historical pathways to financial development lead to huge differences in financial integration in We argue that the specific financing needs of the silk reeling industry led to the emergence of a cooperative, regionallly tiered model of banking. [...] We use # of reeling plants (filatures) p.c. at prefecture-level in 1895 as an instrument for the market share of regional banks in the 1980s Hoffmann & Okubo () By a Silken Thread Stanford APARC, 1 Dec / 25

21
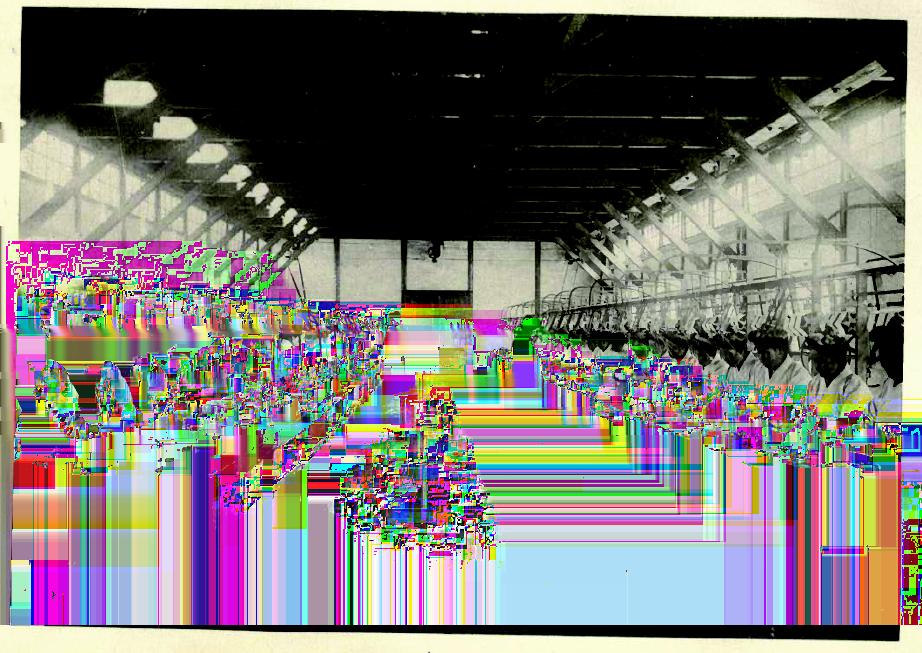
22 [...] Silk and finance Silk filatures (i.e. reeling plants) were heavily dependent on working capital: cocoons had to be purchased in the spring, reeled silk could only be shipped to the Yokohama market in the late summer. purchase of cocoons amounted to 80 percent of the operating costs of a silk filature. Silk reelers were located in remote mountain areas and could not usually borrow from (mainly Yokohama-based) city banks. However, export market for silk was concentrated in Yokohama. Local banks in Japan institutional response to this dilemma: local silk reelers associations and Yokohama silk broker had first-hand knowledge of market conditions and of the quality produced by individual silk reelers. This gave them a huge comparative advantage (relative to city banks) in lending to these local SMEs. Shinkin (cooperatives) and Sougo (mutuals) were founded by Silk merchants and by reelers cooperatives. As the silk industry was superseded by other export industries, these local banks preserved their comparative advantage in lending to SMEs. Hoffmann & Okubo () By a Silken Thread Stanford APARC, 1 Dec / 25
23 Figure: City and Regional Bank Lending Shares (pre-1990 ( ) averages) vs. number of silk filatures per head in 1895 Tokyo Yamanashi Osaka Kyoto lending share of City Banks pre 1990 Nara Fukuoka Kanagawa Saitama Miyagi Kagawa Aichi Nagasaki Ishikawa Chiba Tochigi Aomori Tokushima Toyama Hiroshima Fukui Hyogo Yamaguchi Ibaraki Kyoto Okayama Akita Gunma Shizuoka Mie Ehime Kumamoto Hokkaido Niigata Tottori Wakayama Oita Shiga Miyazaki Saga Fukushima Kagoshima Iwate Yamagata Kochi Shimane Gifu Nagano Yamanashi lending share of Shinkins pre 1990 Hokkaido Kumamoto Nara Osaka Tokyo Nagasaki Aomori Hiroshima Fukuoka Shizuoka Hyogo Wakayama Kanagawa Saitama Oita Fukui Fukushima Kagoshima Niigata Okayama Shiga Chiba Yamaguchi Miyazaki Kagawa Kochi Ehime Tokushima Tochigi Iwate Miyagi Shimane Mie Akita Gunma Ibaraki Ishikawa Aichi Toyama Saga Tottori Yamagata Gifu Nagano log # silk filatures per capita in log # silk filatures per capita in 1895 The silken thread: Regional financial integration in 1990 low in areas in with a high share of silk-exporting (reeling) firms in 1895 Hoffmann & Okubo () By a Silken Thread Stanford APARC, 1 Dec / 25
24 Panel IV regressions Table: Panel IV Regressions with filatures / head in 1895 as instrument City Regional City Regional City Regional Interactions terms Banks Banks Banks Banks Banks Banks of Post1991t with... All Shinkin All Shinkin All Shinkin SMEVA k FI k (2.15) (-2.18) (-2.08) (1.69) (-1.50) (-1.42) (1.84) (-1.81) FI k (-2.21) (2.00) (1.96) (-1.58) (1.28) (1.28) (-1.86) (1.64) (1.65) SMEVA k (-2.44) (1.80) (1.61) (-1.81) (1.39) (1.20) (-1.92) (1.73) (1.63) Controls no no no yes yes yes yes yes yes relative GDP (0.33) (-0.60) (-2.02) Core (-1.72) (-2.38) (-2.51) (-0.78) (-1.58) (-1.85) Distance to Yokohama (0.93) (1.03) (2.71) R st-Stage F-stat for SME k FI k Post1991t Kleibergen-Paap rank test The Table shows results from the IV regression gdp k t = Post1990t p-value [ α1sme k FI k + α2 FI ] k + α3sme k + α 4 Xt + µ k + τt + ɛ k t where where Post1990t is a dummy indicating the period starting in 1991, SME k is small manufacturing firm importance (value-added or employment based) and Xt is a vector of controls. SME k FI k and FI k are the first-stage fitted values of SME k FI k and FI k using SME k Silk k and Silk k as instruments, where Silk k is the log number of silk filatures per head of population in a prefecture in CoreArea is a dummy for the core economic areas (Tokyo, Osaka, Aichi, Kanagawa, Chiba, Saitama, Hyogo and Kyoto prefectures). The sample period is , t-statistics appear in parentheses. The bottom of the Table reports information on instrument relevance: the F-statistics associated with the first stage regression of the interaction term on all instruments and the Kleibergen-Paap (2006) (KP) rank statistics and its associated p-value for the hypothesis of under-identification. The KP-statistics appears in boldface (italics) if it exceeds the Stock-Yogo(2005) weak-instrument critical values of 7.03 (4.58) (see Table 5.2. in Stock and Yogo (2005), for the case of n = 2 endogenous variables and K = 2 excluded instruments), This suggests that the instruments can be taken to be sufficiently strong to ensure a maximal size of no more than 10% (15%) for a nominal 5% size Wald Test on the IV-estimates. Hoffmann & Okubo () By a Silken Thread Stanford APARC, 1 Dec / 25
25 Summary and outlook Paper studies the regional dimension of Japan s Great Recession: local bank dependence and interregional banking integration interacted in the regional spread of the crisis after The silken thread: regional differences in financial integration are extremely persistent: Comparative advantage in trade (silk) affected the particular pathway to financial development and de facto integration at the onset of the crisis of Silken thread is reflected in extremely persistent banking relationships which may have made it hard for SME to switch to nationwide banks in the trough of the crisis. Relevance for today: state-level segmentation of the US banking market till the 1980s, Regulatory and regional segmentation of banking in Europe today. Even a banking union will not make this segmentation go away! Hoffmann & Okubo () By a Silken Thread Stanford APARC, 1 Dec / 25
26 Part I Appendix
27 Bonus slides Stanford APARC, 1 Dec 2015 By a Silken Thread Appendix (27)
28 Data set Panel data set for 46 prefectures (ex Okinawa).... GDP p.c. Lending by type of bank by prefecture, Data on small manufacturing firms by prefecture, employment and value added from the Manufacturing Census. Here focus on SMEs with <300 employees. (This is also the cut-off value for Shinkin membership). Data on number of silk filatures, population etc. in 1895 from various sources Stanford APARC, 1 Dec 2015 By a Silken Thread Appendix (28)
29 Our story (I): related findings Low financial integration prohibits cross-prefectural pooling of funds (e.g. through nationwide banks internal capital markets (Cetorelli and Goldberg; JoF forthcoming)). The pattern of nationwide banks withdrawing from areas where they have low market share is reminiscent of Japanese banks behavior overseas after 1990 ((e.g. Peek and Rosengreen (1997)). Consistent with Evergreening and the Zombie hypothesis (Caballero, Hoshi and Kashyap (2008), Peek and Rosengreen (2005)): big banks could have withdrawn from their non-core areas to prop up Zombie firms in their core areas of activity. Stanford APARC, 1 Dec 2015 By a Silken Thread Appendix (29)
30 An example prefecture City lending share SME share post-1990 average growth 7 Fukushima Yamanashi Nara Fukuoka Back Stanford APARC, 1 Dec 2015 By a Silken Thread Appendix (30)
31 Proper interaction term specification Table: Interaction terms and additional controls I II III IV V VI VII VIII Interactions of Post1990t Regional City Regional City Regional City Regional City with......sme k RegionalBankShare k (-2.72) (-2.89) (-3.24)...SME k CityBankShare k (3.12) (3.20) (3.78)...RegionalBankShare k (0.82) (3.04) (3.23) (3.87)...CityBankShare k (-2.38) (-4.56) (-4.15) (-5.03)...SMEVA k (-3.87) (-2.85) (2.19) (-3.55) (2.35) (-3.66) (2.72) (-4.06) Controls: X k :...Lending/GDP (-1.31) (0.60)...CoreArea (-4.00) (-2.63) R The Table shows results from the regression gdpt k = Post1990t [ ] α0smeva k FI k + α1fi k + α2smeva k + α 3Xt k +µ k +τt +ɛ k t where Post1990t is a dummy indicating the period after 1990 ( ), SMEVAis k small-business importance based on value added, FI k is the measure of financial integration (regional and city bank share in total lending in prefecture k), as indicated in the column heading. µ k and τt are prefecture-fixed and time effects respectively. The vector X k captures various prefecture characteristics. In the regressions it is interacted with our crisis dummy Post1990t and contains prefecture-level Lending k /GDP k ( average) and CoreArea k, a dummy for the core economic areas (Tokyo, Osaka, Aichi, Kanagawa, Chiba, Saitama, Hyogo and Kyoto prefectures). The sample period is OLS estimates, t-statistics in parentheses. Standard errors are clustered by prefecture. Stanford APARC, 1 Dec 2015 By a Silken Thread Appendix (31)
32 Robustness Back to Baseline spec Table: Robustness interaction terms and additional controls I II III IV V VI Interactions of Post1990t Regional City Regional City Regional City with......sme k FI k (-3.04) (3.33) (-1.23) (2.51) (-2.06) (2.78)...FI k (3.59) (-3.72) (3.61) (0.22) (1.50) (-0.61)...SMEVA k (2.88) (-3.17) (0.80) (-0.79) (1.48) (-0.59) ( ) 2 FI k (-1.96) (-1.61) (-0.30) (-0.44)... ( 2 SMEVA) k (-0.38) (-1.33) (-0.28) (-1.49) Controls: X k :...CoreArea (-0.57) (-0.44) (-0.53) (-0.79)...Share Lowland Areas (0.62) (1.01) (0.62) (0.94)...Share of steep areas (0.44) (0.61) (0.58) (0.45)...Min. distance to core (1.04) (0.91) (1.05) (0.76)...Sectoral Specialization (1.99) (1.59) (2.28) (1.44) Z k t : Region Fixed Effect Yes Yes Yes Yes Yes Yes Stanford APARC, 1 Dec 2015 By a Silken Thread Appendix (32) 2
33 Is it financial integration or local financial development? Table: Alternative measures of financial development and financial integration City Bank Lending FI = Total Lending Interactions of Post1990t with pre1990 variables: FD = #Branches Population Area FD = Lending GDP I II III IV FI = CityBankLending GDP City Bank Lending FI = Total Lending Regional Bank Lending FD = GDP...SMEVA k (-3.82) (-3.73) (-0.81) (-4.42)...FI k (-3.89) (-2.28) (-6.76) (-5.55)...SME k FI k (3.00) (1.73) (4.07) (4.52) Regional BankLending FD = GDP FD k (0.54) (-2.09) (1.79) 0.12 SME k FD k (-0.43) (2.61) (-1.31) (0.42)...CoreArea (-2.14) (-3.43) (-4.01) R The Table shows results from the regression gdp k t = Post1991t [ α1sme k VA + α2fi k + α3sme k VA FI k + α5fd k + α6sme k VA FD k + α 7CoreArea k] +µ k +τt+ɛ k t where where Post1991t is a dummy indicating the period from 1991, SME k VAis small-business importance based on value added, and FI k and FD k are the measures of financial integration and financial development respectively as indicated in the column heading. µ k and τt are prefecture-fixed and time effects respectively. CoreArea is a dummy for the core economic areas (Tokyo, Osaka, Aichi, Kanagawa, Chiba, Saitama, Hyogo and Kyoto prefectures). The sample period is OLS estimates, t-statistics in parentheses. Standard errors are clustered by prefecture. Stanford APARC, 1 Dec 2015 By a Silken Thread Appendix (33)
34 A first set of results Great Recession is deeper and more prolonged in areas with many SME s provided financial integration is low. The effect is big: a prefecture with a 20 percent SME share would have 0.4 percent lower annual growth than the country as a whole if its banking sector is weakly integrated with the rest of the country. Financial frictions seem stronger in areas with low (pre-1990) levels of banking integration (low share of universal / high share of regional banks) Lending channel & low financial integration? City banks withdraw lending from areas to which they traditionally have weak ties Stanford APARC, 1 Dec 2015 By a Silken Thread Appendix (34)
35 Endogeneity issues Lending shares of regional / city banks might be endogenous as might be small firm importance. But: using pre-1990 data would counter most endogeneity issues. However, using pre-1990 data does not entirely preclude expectational feedbacks: If investment and growth prospects were poor in some areas, the big city banks might have started to withdraw from such regions even before the 1990s. This would lead to a high market share of regional banks. need some instrument for regional bank lending share. Stanford APARC, 1 Dec 2015 By a Silken Thread Appendix (35)
36 Silk and finance Silk filatures (i.e. reeling plants) were heavily dependent on working capital: cocoons had to be purchased in the spring, reeled silk could only be shipped to the Yokohama market in the late summer. purchase of cocoons amounted to 80 percent of the operating costs of a silk filature. Silk reelers were located in remote mountain areas and could not usually borrow from (mainly Yokohama-based) city banks. However, export market for silk was concentrated in Yokohama. Instead of banks, Yokohama silk export merchants would issue a letter of credit to small reelers who would discount it with his local silk cooperative. These local coperatives had first-hand insihjt into the quality of the output of their members, making them ideal intermediaries of credit. Local cooperatives often were at the origin of regional banks. These banks were purely regional and stayed it for more than a century. Stanford APARC, 1 Dec 2015 By a Silken Thread Appendix (36)
37 Silk export finance Yokohama merchant would advance credit to a reeler in the form of a documentary bill issued by a Yokohama bank. Reeler would obtain trade credit in the form of an advance on the bill from a local bank. These banks were often cooperative or mutual banks, founded by silk industry associations (Shinkins) or by Yokohama silk merchants. After reeling and shipping of the silk to Yokohama, Yokohama bank would issue a bill of acceptance to the reeler who would use this to discount the documentary bill with his local bank. Regional bank settled payment of the bill with the issuing bank in Yokohama. This system of credit is very much like the system of modern trade finance: ( advising ) bank of the exporter borrows and lends locally. International transactions occur only with the big Yokohama banks, which in turn have links to regional banks around the country. Regional tiering of Japan s banking system goes back to the institutions of silk export finance. Stanford APARC, 1 Dec 2015 By a Silken Thread Appendix (37)
38 Silk finance: the role of mechanization Huge relative price increase of mechanically vs. hand-reeled silk in the 1890s. Mechanization central in the quality improvement. But increased dependence on working capital it reinforced the separation of cocoon-growing and reeling. Early stages of mechanization: cooperatively organized and centralized second (mechanical) reeling process of (possibly manually reeled) silk. Centralized re-reeling allowed the implemenation of quality control system and the development of internationallly recognized brands. Quality was central in the monitoring of the credit relationship between silk producers and the Yokohama silk merchants: regional banks would provide credit ( advances ) against a documentary bill issued by Yokohama silk merchants. Ultimately, only those producers could continue to export who mechanized early. These also had access to the trade credit and export finance by the Yokohama silk merchants. The others ended up producing mainly for the domestic market. Stanford APARC, 1 Dec 2015 By a Silken Thread Appendix (38)
39 Mechanized silk filatures in 1895 Stanford APARC, 1 Dec 2015 By a Silken Thread Appendix (39)
40
41 Silk and modern-day lending shares Table: Modern day (pre-1990) lending and silk filatures Financial Integration Financial Development pre-1990 share in prefecture-level lending by City Banks Regional Banks bank branches population area Lending/GDP All (Shinkin+Sogo) Shinkins only (pre-1990) (pre-1990) filatures / population (log #) (-3.14) (-4.70) (4.22) (4.11) (4.96) (4.53) (0.87) (0.87) (-1.78) (-1.95) (-0.29) Relative GDP (pre-90) (3.32) (-0.18) (-0.24) (1.68) (4.21) (2.88) Core Dummy (2.46) (-0.02) (0.71) (-0.57) (1.88) (1.02) Distance to Yokohama (log) (-1.33) (0.66) (-0.93) (0.74) (1.25) (1.75) City Bank Lending (2.28) R The table shows regressions of modern-day (pre-1990) average prefectural lending shares by bank type on our silk instrument the number of filatures per head of population in a prefecture in The control variables are relative (pre-199) per capita GDP, the (log) distance to Yokohama and a dummy for the core areas (Tokyo, Osaka, Aichi, Kanagawa, Chiba, Saitama, Hyogo and Kyoto prefectures). Stanford APARC, 1 Dec 2015 By a Silken Thread Appendix (41)
42 The role of mechanization Table: Impact of mechanization on pre-1990 financial integration measures and founding year of first industrial cooperative bank in a prefecture. (log) share in prefecture-level lending by Founding year of first City Banks Regional Banks Shinkin in prefecture All (Shinkin+Sogo) Shinkins only (log) hand filatures (log #) (-1.38) (0.94) (-0.08) mechanized filatures (log #) (-3.35) (2.85) (4.22) (-1.89) output: hand reeled (log tons) (-0.61) (-0.42) (-0.62) (0.66) output: machine reeled (log tons) (-3.76) (2.65) (2.30) (-0.76) R Controls yes yes yes yes yes yes yes yes The table shows results from regression of pre-1991 average prefectural lending shares by bank type (left panel) and of founding year of the first industrial cooperative bank (Shinkin) in a prefecture (right panel) on our alternative silk industry instruments: the number of hand-powered and machine filatures at prefecture-level, and the output of hand-powered and machine filatures respectively. Controls are: relative GDP pre-1990, a core area dummy and log distance to Yokohama. Core areas are as described in previous tables. The founding year of the first Shinkin is normalized by 1900 (the year of the enactment of the first industrial cooperative act). We take the logarithm of this normalized measure as our dependent variable. Stanford APARC, 1 Dec 2015 By a Silken Thread Appendix (42)
43 Panel IV regressions Table: Panel IV Regressions with filatures / head in 1895 as instrument City Regional City Regional City Regional Interactions terms Banks Banks Banks Banks Banks Banks of Post1991t with... All Shinkin All Shinkin All Shinkin SMEVA k FI k (2.15) (-2.18) (-2.08) (1.69) (-1.50) (-1.42) (1.84) (-1.81) FI k (-2.21) (2.00) (1.96) (-1.58) (1.28) (1.28) (-1.86) (1.64) (1.65) SMEVA k (-2.44) (1.80) (1.61) (-1.81) (1.39) (1.20) (-1.92) (1.73) (1.63) Controls no no no yes yes yes yes yes yes relative GDP (0.33) (-0.60) (-2.02) Core (-1.72) (-2.38) (-2.51) (-0.78) (-1.58) (-1.85) Distance to Yokohama (0.93) (1.03) (2.71) R st-Stage F-stat for SME k FI k Post1991t Kleibergen-Paap rank test The Table shows results from the IV regression gdp k t = Post1990t p-value [ α1sme k FI k + α2 FI ] k + α3sme k + α 4 Xt + µ k + τt + ɛ k t where where Post1990t is a dummy indicating the period starting in 1991, SME k is small manufacturing firm importance (value-added or employment based) and Xt is a vector of controls. SME k FI k and FI k are the first-stage fitted values of SME k FI k and FI k using SME k Silk k and Silk k as instruments, where Silk k is the log number of silk filatures per head of population in a prefecture in CoreArea is a dummy for the core economic areas (Tokyo, Osaka, Aichi, Kanagawa, Chiba, Saitama, Hyogo and Kyoto prefectures). The sample period is , t-statistics appear in parentheses. The bottom of the Table reports information on instrument relevance: the F-statistics associated with the first stage regression of the interaction term on all instruments and the Kleibergen-Paap (2006) (KP) rank statistics and its associated p-value for the hypothesis of under-identification. The KP-statistics appears in boldface (italics) if it exceeds the Stock-Yogo(2005) weak-instrument critical values of 7.03 (4.58) (see Table 5.2. in Stock and Yogo (2005), for the case of n = 2 endogenous variables and K = 2 excluded instruments), This suggests that the instruments can be taken to be sufficiently strong to ensure a maximal size of no more than 10% (15%) for a nominal 5% size Wald Test on the IV-estimates. Stanford APARC, 1 Dec 2015 By a Silken Thread Appendix (43)
44 Robustness: X-sectional OLS and IV regressions Table: Cross-sectional Regressions SMEVA (output based) SMEEMP (employment based) City Banks Regional Banks City Banks Regional Banks All Shinkin All Shinkin OLS IV OLS IV OLS IV OLS IV OLS IV OLS IV SME k FI k (1.33) (1.71) (-2.12) (-1.52) (-1.68) (-1.55) (1.12) (1.70) (-2.22) (-1.78) (-1.94) (-1.87) FI k (-2.36) (-2.01) (2.15) (1.50) (1.59) (1.52) (-1.97) (-2.01) (2.18) (1.92) (1.79) (1.90) SME k (-1.79) (-1.94) (1.48) (1.25) (0.79) (1.25) (-1.51) (-1.88) (1.72) (1.43) (1.16) (1.45) Controls Core (-2.73) (-1.06) (-4.58) (-1.99) (-4.79) (-3.73) (-2.89) (-1.32) (-4.87) (-3.36) (-5.03) (-4.42) R First-Stage F-stat for SME k FI k Kleibergen-Paap rank test p-value The Table shows results from the cross-sectional OLS and IV regressions gdppost1990 k = α1sme k FI k + α2fi k + α3sme k + α 4 CoreDummy k + const + ɛ k where gdppost1990 k is average post-1990 ( ) GDPgrowth in prefecture k, SME k is small manufacturing firm importance (value-added or employment based) and FI k our measure of regional banking integration (city bank share, regional bank share, Shinkin share). CoreArea is a dummy for the core economic areas (Tokyo, Osaka, Aichi, Kanagawa, Chiba, Saitama, Hyogo and Kyoto prefectures). In the IV-regressions, SME k FI k and FI k are instrumented using SME k Silk k and Silk k, where Silk k is the log number of silk filatures per head of population in a prefecture in The F-statistics below the IV-regression pertain the the test for the significance of instruments in the first-stage regression for SME k FI k. t-statistics in parentheses. The last two rows of the table reports F-statistics associated with the first stage regression of the interaction term on all instruments and the Kleibergen-Paap (2006) rank statistics and the associated p-value for the hypothesis of under-identification. Stanford APARC, 1 Dec 2015 By a Silken Thread Appendix (44)
45 Is industry structure endogenous? RZ-approach has been criticized on the grounds that financially constrained regions have a comparative advantage in less finance-dependent industries. Hence, they should specialize in these industries. If this is the case, then we would probably tend to overestimate the aggregate effects of low financial integration. What we need is an exogenous measure of growth expectations / industry structure that is not affected by low financial integration. We turn to the literature on agglomeration externalities (Glaeser et al 1992) to proxy for the importance of knowledge externalities in manufacturing: distance to the main silk regions (as opposed to share of silk industry in local economy). Stanford APARC, 1 Dec 2015 By a Silken Thread Appendix (45)
46 Table: Disentangling financial integration & industrial structure Industrial structure Financial Integration Small manufacturing Manufacturing Share pre-1990 lending share by firm share City Banks Regional Banks in GDP in EMP in GDP in EMP All Shinkin distance to most highly mechanized silk regions (log) (-6.28) (-5.41) (-5.05) (-5.26) (-1.35) (-1.46) (-1.07) filatures / population (log #) (2.04) (2.87) (0.31) (1.87) (-4.41) (3.09) (3.60) Core Dummy (-1.68) (-1.61) (-2.03) (-2.32) (-1.96) (1.01) (-0.70) Distance to Yokohama (log) (-2.30) (-2.77) (-1.39) (-1.77) (2.53) (-0.46) (0.37) R The table shows regressions of modern-day (pre-1990) industrial structure (left) and average prefectural lending shares by bank type (right) on our two alternative silk-related variables: the (log) distance to the three prefectures with the most highly mechanized silk industry in 1895 (Kyoto, Nagano, Gifu and Shizuoka) and the (log) number of filatures per head in 1895 and a set of controls. The control variables are the (log) distance to Yokohama (the main silk market), a dummy for the Core areas (Tokyo, Osaka, Aichi, Kanagawa, Chiba, Saitama, Hyogo and Kyoto prefectures). Stanford APARC, 1 Dec 2015 By a Silken Thread Appendix (46)
47 Table: Panel IV Regressions (both credit dependence and financial integration endogenous) CD = SMEVA CD = SMEEMP CD =Manufacturing Share in GDP City Regional City Regional City Regional Interactions terms Banks Banks Banks Banks Banks Banks of Post1990t with... All Shinkin All Shinkin All Shinkin CD FI k (1.79) (-1.94) (-1.88) (1.98) (-2.06) (-2.03) (1.54) (-1.67) (-1.57) FI k (-1.93) (1.90) (1.86) (-2.08) (2.00) (2.00) (-1.64) (1.65) (1.56) CD (-1.93) (1.83) (1.72) (-2.06) (2.00) (1.92) (-1.68) (1.55) (1.46) Controls yes yes yes yes yes yes yes yes yes R st-Stage F-stat for CD k FI k Kleibergen-Paap rank test p-value [ The Table shows results from the IV regression gdpt k = Post1990t α1cd k FI k + α2 FI ] k + α3sme k + α 4 X k + µ k + τt + ɛ k t where where Post1990t is a dummy indicating the period after 1990, CD k is our measure of credit dependence as indicated in the respective column headings and X k is a vector of controls. CDk FI k and FI k are the first-stage fitted values of CD k FI k and FI k using the log numbers of filatures per head (filatures k ), the (log) distance to one of the three most mechanized silk regions and the interaction between these two as instruments. Control variates are (log) distance to Yokohama and a dummy for the core economic areas (Tokyo, Osaka, Aichi, Kanagawa, Chiba, Saitama, Hyogo and Kyoto prefectures). The sample period is t-statistics in parentheses. The bottom of the Table reports the F-statistics associated with the first stage regression of the interaction term on all instruments and the Kleibergen-Paap (2006) rank statistics and the associated p-value for the hypothesis of under-identification. Values of the KP-statistics in boldface or italics indicate that the hypothesis of weak identification is rejected. We reject if the asymptotic bias of the TSLS estimator is less than 5% (KP in bold) or 10% (KP in italics) based on the critical values tabulated in Table 5.1. of Stock and Yogo (2005). Since values for our case n = 3 endogenous variables and K = 3 instruments are not directly tabulated, we use the more conservative values for n = 3 and K = 5 which are 9.53 and 6.61 respectively. Stanford APARC, 1 Dec 2015 By a Silken Thread Appendix (47)
Monthly Report of Tuberculosis Surveillance, Japan January, 2016
 Surveillance Center, RIT, JATA Monthly Report of Tuberculosis Surveillance, Japan January, 216 The reporting and recording of tuberculosis () and Latent Infection (LI) are managed at public health centers
Monthly Report of Tuberculosis Surveillance, Japan May, 2018
 Surveillance Center, RIT, JATA Monthly Report of Tuberculosis Surveillance, Japan May, 218 The reporting and recording of tuberculosis () and Latent Infection (LI) are managed at public health centers
Monthly Report of Tuberculosis Surveillance, Japan September, 2018
 Surveillance Center, RIT, JATA Monthly Report of Tuberculosis Surveillance, Japan September, 218 The reporting and recording of tuberculosis () and Latent Infection (LI) are managed at public health centers
Number of Licensed Sites
 sites for manufacturing liquors, etc. Type of liquors sites for manufacturing liquors Licensed Sites sites for examination (included in the number mentioned) manufacturing factories manufacturers warehousing
II. Outline of wedding ceremony halls business
 II. Outline of wedding ceremony halls business - The share of the wedding ceremony hall business (main business) is increasing - Number of establishments 2,826 establishments (Compared to 22 -.9% decrease)
Intuition! Common Standards for Statistics on Inbound Domestic and Foreign Tourists by Prefecture
 Common Standards for Statistics on Inbound Domestic and Foreign Tourists by Prefecture March.2012 Hiroyuki Kamiyama Director for Tourism Statistics and Tourism Satellite Accounts Japan Tourism Agency Background
Sum up of radionuclide test results reported in FY2017 (Up-to-date Report as of 5 Jan 2018)
") Sum up of radionuclide test results reported in FY2017 (Up-to-date Report as of 5 Jan 2018) 1) The which are exceeding limits will be taken appropriate measures, such as disposing. 2) The underlined items
Sum up of radionuclide test results reported in FY2017 (Up-to-date Report as of 5 Jan 2018) 1) The which are exceeding limits will be taken appropriate measures, such as disposing. 2) The underlined items
National Survey of Alcoholic Beverages
 National Survey of Alcoholic Beverages As the government agency that has jurisdiction over the liquor industry, the National Tax Agency works to secure the safety and quality of alcoholic beverages for
The economic geography of Japanese industrialization ( )
") International Workshop on The Economic Geography of Long-Run Industrialization (ca. 1800-2010) International Institute of Social History, Amsterdam, 22-23 March 2018 The economic geography of Japanese
International Workshop on The Economic Geography of Long-Run Industrialization (ca. 1800-2010) International Institute of Social History, Amsterdam, 22-23 March 2018 The economic geography of Japanese
RIETI Policy Symposium. Frontier of Inter-firm Network Analysis: Power of network and geographical friction. Handout. Robert DEKLE
 RIETI Policy Symposium Frontier of Inter-firm Network Analysis: Power of network and geographical friction Handout Robert DEKLE Professor of Economics, University of Southern California March 8, 2016 Research
Technical Report for. Asian Barometer Survey Japan wave4
 Institute of Political Science at Academia Sinica Technical Report for Asian Barometer Survey Japan wave4 July 21, 2016 Central Research Services, Inc. 1 [RESEARCH DESIGN] - Research Method:
Epicenter of the Eastern Japan Great Earthquake
 Epicenter of the Eastern Japan Great Earthquake Epicenter The supply-demand situation and the power-saving measures taken this summer as a result of the stoppage of Nuclear Power Plants caused by the Eastern
MARCH, Result of an annual survey of international students in Japan 2016
 MARCH, 2017 Result of an annual survey of international in Japan 2016 Japan Student Services Organization(JASSO) has conducted an annual survey of international in Japan at the graduate school, university,
Shimamura Co., Ltd. (Consolidated) Consolidated Financial Summary and Forecast Consolidated Profit and loss statement
 Consolidated Financial Summary and Forecast Consolidated Profit and loss statement") Shimamura Co., Ltd. (Consolidated) Consolidated Financial Summary and Forecast Consolidated Profit and loss statement Selling, General and Administrative Expenses Consolidated quarterly Profit and loss
Shimamura Co., Ltd. (Consolidated) Consolidated Financial Summary and Forecast Consolidated Profit and loss statement Selling, General and Administrative Expenses Consolidated quarterly Profit and loss
Real estate market trends in Japan The impact of the increase in office supply and a re-evaluation of the market polarization
 Mizuho Economic Outlook & Analysis July 19, 217 Real estate market trends in Japan The impact of the increase in office supply and a re-evaluation of the market polarization < Summary > Despite signs that
15th Global Forum on Tourism Statistics November 2018, Cusco, Peru
 15th Global Forum on Tourism Statistics 28-30 November 2018, Cusco, Peru (THEME 1 REGIONAL AND SUB-NATIONAL TOURISM STATISTICS) Improving national tourism statistics designed to prepare regional tourism
Oportunidade de Negócios com Empresas Japonesas. JETRO São Paulo Atsushi Okubo
 Oportunidade de Negócios com Empresas Japonesas JETRO São Paulo Atsushi Okubo Our Mission Our strengths Quickly connecting Japanese companies to the world by making full use of our global network! JETRO:
Chapter 3 Situation of TCA Members
 Chapter 3 Situation of TCA Members Member List Member List * Symbols representing types of provided services 1. Subscriber telephone 2. ISDN (excluding switched telephone, public telephone and international
Japan s Prefectural-level KLEMS: Productivity Comparison and Service Price Differences 1
 Japan s Prefectural-level KLEMS: Productivity Comparison and Service Price Differences 1 Joji Tokui 2 Shinshu University and RIETI Takeshi Mizuta Institute of Economic Research, Hitotsubashi University
Published from. Prefectural Fisheries Research Institutes in Japan. Year
 Scientific Exchange Report from Japan Panel Oct. 2014-Sept. 2015 Collaborative Research Projects 1. Cohabitation challenge of Japanese abalone with American abalone infected by withering syndrome. Ikunari
Summary 1. The number of manufacturing establishments
 1 Summary This summary provides the number of manufacturing establishments and the value of shipments by product from establishments with four or more employees, by product category and by prefecture,
Scientific Exchange Report from Japan Panel
 Scientific Exchange Report from Japan Panel Oct. 2014-Sept. 2014 Collaborative Research Projects 1. Cohabitation challenge of Japanese abalone with American abalone infected by withering syndrome. Ikunari
Update of NICT network
 APAN 19, Bangkok 27 January, 2005 Update of NICT network IGARASHI Kiyoshi Director, International Alliance Division, NICT igarashi@nict.go.jp JGN II Japan US connection 10G from August 1, 2004 APII - Japan
Damage and Provision of Aid of Water Supply in Disaster-hit Areas, the Great East Japan Earthquake and Tsunami
 Damage and Provision of Aid of Water Supply in Disaster-hit Areas, the Great East Japan Earthquake and Tsunami By Research and Publication Department, JAPAN WATER RESEARCH CENTER () Updated Wednesday March
July 2017 Fiscal Period Earnings
 Ichigo Preserves and Improves Real Estate [Provisional Translation Only] This English translation of the original Japanese document is provided solely for information purposes. Should there be any discrepancies
The 1927 US Japan Friendship Doll Exchange
 Special Feature - History Case Study The 1927 US Japan Friendship Doll Exchange This year marks the 90 th anniversary of a famous international peace education project: the 1927 US-Japan Friendship Doll
An Analytical Model on Time Series Data in Inland Prefecture of Japan
 An Analytical Model on Time Series Data in Inland Prefecture of Japan Shoichi Kaneko Faculty of Management Information Yamanashi Gakuin University Kofu, Yamanashi, JAPAN shoichi@ygu.ac.jp Takaaki Kawanaka
An Empirical Analysis of Disasters on Regional Economy Case Study of 2000 Flood Disaster in Japan by use of regional GDP data
 An Empirical Analysis of Disasters on Regional Economy Case Study of Flood Disaster in Japan by use of regional GDP data Naoyuki Yoshino, Ph.D Dean, Asian Development Bank Institute (ADBI) Professor Emeritus,
Location Choices of Regional Financial Institutions in the Tohoku Region of Japan
 International Journal of Finance and Accounting 2015, 4(1): 71-78 DOI: 10.5923/j.ijfa.20150401.07 Location Choices of Regional Financial Institutions in the Tohoku Region of Japan Michiko Miyamoto Akita
White Paper on Tourism in Japan, Summary
 White Paper on Tourism in Japan, 2010 Summary Table of Content State of Tourism in FY2009 PartⅠ New Developments in Tourism Policy Chapter 1 Chapter 2 Promoting Tourism Policy by the Entire Government
Outline of the World Heritage World Heritage Convention The Convention was adopted by the General Conference of UNESCO in 1972, with an aim to protect
 No.4 THE World Heritage Japanese Cabinet Secretariat Outline of the World Heritage World Heritage Convention The Convention was adopted by the General Conference of UNESCO in 1972, with an aim to protect,
Economic Effect of Infrastructure : macroeconomic effects and microeconomic effects
 Economic Effect of Infrastructure : macroeconomic effects and microeconomic effects Naoyuki Yoshino, Masaki Nakahigashi, Victor Pontines and Umid Abidhadjaev Asian Development Bank Institute ADBInstitute
FY2011 JSPS Postdoctoral Fellowship for Foreign Researcher
 FY2011 JSPS Postdoctoral Fellowship for Foreign Researcher Field: Biological Sciences Note: - Regions and prefectures are listed in right-hand column. - Scroll down to find map of regions and prefectures.
Information Pack. The San-in Godo Bank, Ltd.
 Information Pack The San-in Godo Bank, Ltd. Reference Materials Reference 1. Major Statistics for San-in Prefectures Shimane Prefecture Tottori Prefecture Japan Total population: 737,000 (46th in Japan)
Financial Status of Aichi Prefecture
 Financial Status of Aichi Prefecture 愛知県 May, 2018 Aichi Prefecture Contents Highlights P2 1. Overview P4 2. Fiscal Profile P10 3. Aichi Local Government Bonds P14 4. Appendix P20 1 Highlights Outstanding
Visitors: 10,103 Professionals (No double-counts, 1 registration per 1 person)
") 2017 Show Report 2017 SHOW SUMMARY Date: November 15-17, 2017 Venue: Tokyo Big Sight East 6 Hall (8,670sqm) Scale: 130 Companies/229 Booths Visitors: 10,103 Professionals (No double-counts, 1 registration
2017 Show Report 2017 SHOW SUMMARY Date: November 15-17, 2017 Venue: Tokyo Big Sight East 6 Hall (8,670sqm) Scale: 130 Companies/229 Booths Visitors: 10,103 Professionals (No double-counts, 1 registration
 Telephone Consultation Service for Foreign Workers The Ministry of Health, Labour and Welfare has launched a "Telephone Consultation Service for Foreign Workers" to respond to requests for consultation
1. Objective of this monitoring in Hokkaido
 July 27, 2012 (i) Results of Airborne Monitoring Survey in Hokkaido and (ii) Revision to the Results of Airborne Monitoring Survey over the Eastern Part of Japan with Detailed Consideration of the Influence
 Telephone Consultation Service for Foreign Workers The Ministry of Health, Labour and Welfare has launched a "Telephone Consultation Service for Foreign Workers" to respond to requests for consultation
Financial Status of Aichi Prefecture
 Financial Status of Aichi Prefecture October, 2015 Aichi Prefecture Contents Highlights P2 1. Overview P4 2. Fiscal Profile P10 3. Aichi Prefecture Bonds P14 4. Appendix P20 1 Highlights Outstanding Economic
Japan's Aircraft Manufacturing Clusters: Promoting Collaboration Across Borders
 AVIATION WEEK MRO ASIA-PACIFIC Japan's Aircraft Manufacturing Clusters: Promoting Collaboration Across Borders November 6th 2018 Toshihiko Toda Deputy Director, Aircraft Component and Material Industries
Economic Geography of Japan. Ryoichi Imai
 Economic Geography of Japan Ryoichi Imai 1 Regional Revitalization PM Abe created a new minister position in the cabinet, titled minister of regional vitalization, and appointed Shigeru ISHIBA, his political
KOBE CITY. FY2008 Kobe City IR Seminar Presentation. - FY2007 Results - AA (Stable) Zuihouji Park, Arima
 Zuihouji Park, Arima") KOBE CITY http://www.city.kobe.jp FY2008 Kobe IR Seminar Presentation - FY2007 Results - Zuihouji Park, Arima AA (Stable) Table Contents Table Contents Overview Kobe --- P3 Acceleration Furr Reform ---
KOBE CITY http://www.city.kobe.jp FY2008 Kobe IR Seminar Presentation - FY2007 Results - Zuihouji Park, Arima AA (Stable) Table Contents Table Contents Overview Kobe --- P3 Acceleration Furr Reform ---
Results of a Condition Survey on Disaster Protection Functions of. School Facilities
 Press Release 国立教育政策研究所 National Institute for al Policy Research October 3, 2014 Results of a Condition Survey on Disaster Protection Functions of School Facilities al Facilities Research Center, National
Civil Aircraft & MRO Market in Japan: Outlook and Upcoming Challenges
 MRO AVIATION MEETINGS OKINAWA 2019 Civil Aircraft & MRO Market in Japan: Outlook and Upcoming Challenges January 29th 2019 Kensuke SAITO Director, Aircraft Component and Material Industries Office Manufacturing
Gain Panel Book ,598 respondents
 Gain Panel Book 212 71,8 respondents Page 1 of 13 Gain Panel Book 212 Our research for is panel book began in November 211 and finished in February 212. We tried to make a panel for all of our top requests
Nagatoshi Nogami 23.Sep.2012
 Meteorites in Japan Nagatoshi Nogami 23.Sep.2012 List of meteorite in Japan (stone 1) Name Date Location lat.(n) lon.(e) kg (piece) 1 Noogata 861.May.19 Fukuoka 33 44 130 45 0.472 (1) W&F 2 Minamino 1632.Sep.27
Notice Concerning Disposition of Asset ( Hotel Vista Hashimoto )
") This English translation is provided for information purpose only. If any discrepancy is identified between this translation and the Japanese original, the Japanese original shall prevail. May 23, 2013
This English translation is provided for information purpose only. If any discrepancy is identified between this translation and the Japanese original, the Japanese original shall prevail. May 23, 2013
Online Appendix to Quality Disclosure Programs and Internal Organizational Practices: Evidence from Airline Flight Delays
 Online Appendix to Quality Disclosure Programs and Internal Organizational Practices: Evidence from Airline Flight Delays By SILKE J. FORBES, MARA LEDERMAN AND TREVOR TOMBE Appendix A: Identifying Reporting
3rd Quarter Result for Fiscal year ending February 29, 2016
 Last updated: January 12, 2016 3rd Quarter Result for Fiscal year ending February 29, 2016 January 12, 2016 Gulliver International Co., Ltd. (7599) Contents Ⅰ. 3rd Quarter Result for FY 2016 Ⅱ. Status
Who cultivates the inter-firm networks in regional cluster? -Innovation and Social Networks- Ichiro Sakata
 OECD Workshop on Network approaches to Innovation December 8, 008 Who cultivates the inter-firm networks in regional cluster? -Innovation and Social Networks- Ichiro Sakata Innovation Policy Research Center
Report on Public Relations Activities. Hideaki Akamatsu Chief Examiner, Public Relations Working Group
 Report on Public Relations Activities Hideaki Akamatsu Chief Examiner, Public Relations Working Group Contents Purpose Targets Activities of 4 Years JHFC Park Introduction Results of Activities Results
Economic Effects of Infrastructure
 Economic Effects of Infrastructure Naoyuki Yoshino Dean, Asian Development Bank Institute (ADBI) Professor Emeritus Keio University nyoshino@adbi.org Infrastructure Finance: Use of long term domestic savings
SUPPLEMENTARY FILE COUNTRY N LOCATIONS PERIOD MORTALITY DATA TEMPERATURE DATA. Non-external. Statistics) Non-external
 Non-external") SUPPLEMENTARY FILE Table S1. Description of the data COUNTRY N LOCATIONS PERIOD MORTALITY DATA TEMPERATURE DATA Non-external Data from meteorological Australia 3 cities 1988-2008 causes only stations located
SUPPLEMENTARY FILE Table S1. Description of the data COUNTRY N LOCATIONS PERIOD MORTALITY DATA TEMPERATURE DATA Non-external Data from meteorological Australia 3 cities 1988-2008 causes only stations located
SHIP MANAGEMENT SURVEY* July December 2015
 SHIP MANAGEMENT SURVEY* July December 2015 1. SHIP MANAGEMENT REVENUES FROM NON- RESIDENTS Ship management revenues dropped marginally to 462 million, following a decline in global shipping markets. Germany
Results of Airborne Monitoring Survey by MEXT in Aichi, Aomori, Ishikawa, and Fukui Prefectures
 November 25, 2011 Results of Airborne Monitoring Survey by MEXT in Aichi, Aomori, Ishikawa, and Fukui Prefectures The results of the airborne monitoring survey by MEXT in Aichi, Aomori, Ishikawa, and Fukui
1 Replication of Gerardi and Shapiro (2009)
") Appendix: "Incumbent Response to Entry by Low-Cost Carriers in the U.S. Airline Industry" Kerry M. Tan 1 Replication of Gerardi and Shapiro (2009) Gerardi and Shapiro (2009) use a two-way fixed effects
Appendix: "Incumbent Response to Entry by Low-Cost Carriers in the U.S. Airline Industry" Kerry M. Tan 1 Replication of Gerardi and Shapiro (2009) Gerardi and Shapiro (2009) use a two-way fixed effects
Population Movement in the Tohoku Region after the Great East Japan Earthquake Disaster
 83 Population Movement in the Tohoku Region after the Great East Japan Earthquake Disaster Takashi ABE Abstract This paper clarifies the demographic change in the Tohoku Region after the Great East Japan
Notice Concerning Disposition of Asset ( Hotel Resol Sapporo Minaminijo )
") This English translation is provided for information purpose only. If any discrepancy is identified between this translation and the Japanese original, the Japanese original shall prevail. November 22,
This English translation is provided for information purpose only. If any discrepancy is identified between this translation and the Japanese original, the Japanese original shall prevail. November 22,
272, ,
 Over view of s Economy is the Hub of Japan s Economic Activity Population Land Area 17,9,7 Number of Employed Persons 77,97 1 9,11,89 1 Number of Establishments 1 Number of Enterprises,1, Ratio of Small
Nuclear Emergency Exercise of NPPs in Japan. IAEA/ANSN/EPR-TG Workshop. October, 2013
 Regional Workshop on Observing a Nuclear Emergency Response Exercise of a Local Government Nuclear Emergency Exercise of NPPs in Japan IAEA/ANSN/EPR-TG Workshop October, 2013 Japan Nuclear Energy Safety
Characteristic of Heavy Rainfall Disaster in Central Area of Japan on September 11 to 12, USHIYAMA Motoyuki*, TAKARA Kaoru*
 Characteristic of Heavy Rainfall Disaster in Central Area of Japan on September 11 to 12, 2000 USHIYAMA Motoyuki*, TAKARA Kaoru* *Disaster Prevention Research Institute, Kyoto University, Japan. 1. Introduction
Online Appendix for Revisiting the Relationship between Competition and Price Discrimination
 Online Appendix for Revisiting the Relationship between Competition and Price Discrimination Ambarish Chandra a,b Mara Lederman a June 23, 2017 a : University of Toronto, Rotman School of Management b
Head Office 9-1, Shinmatsudo-Higashi, Matsudo-shi, Chiba Phone: URL
 2005 Head Office 9-1, Shinmatsudo-Higashi, Matsudo-shi, Chiba Phone: +81-47-344-5111 URL http://www.matsukiyo.co.jp/ Namio Matsumoto President Matsumotokiyoshi Co., Ltd. ( the Company ) originates from
JAPAN RAIL PASS Exchange Order cannot be purchased inside Japan.
 Japan Rail Pass is the key to Convenient Sightseeing in Japan. The pass is offered by the Japan Railways Group (JR Group) that comprises of 6 railway companies. JAPAN RAIL PASS Exchange Order cannot be
健康づくりの グループ. Financial Results for the Fiscal Year Ended March 2017 Progress of Medium-term Management Plan (FY03/16 to FY03/18) Group.
 Group.") 健康づくりの Wellness Life グループ Group T O S H O Financial Results for the Fiscal Year Ended March 2017 Progress of Medium-term Management Plan (FY03/16 to FY03/18) June 2017 Financial Results Briefing for Investors
健康づくりの Wellness Life グループ Group T O S H O Financial Results for the Fiscal Year Ended March 2017 Progress of Medium-term Management Plan (FY03/16 to FY03/18) June 2017 Financial Results Briefing for Investors
GENERAL HEADQUARTERS SUPREME COMMANDER FOR THE ALLIED POWERS Public Health and Welfare Section WEEKLY BULLETIN
 GENERAL HEADQUARTERS SUPREME COMMANDER FOR THE ALLIED POWERS Public Health and Welfare Section WEEKLY BULLETIN For Period 6-12 December 1948 Number 102 SECTION PAGE I GENERAL 1 II PREVENTIVE MEDICINE 1
Statistics Catastrophe Loss, etc. Typhoon Makurazaki Sept ,756 89, ,888. Typhoon Catherine Sept ,930 9, ,743
 XII Statistics Catastrophe Loss, etc. 1. Major Catastrophe Losses (Since 1945) Major Windstorms and Floods Windstorm and Flood Time of Occurrence Number of Casualties and Property Damage Dead/Missing Buildings
INFORMATION ON STATES AND THEIR COMPETENT AUTHORITIES NOTIFIED UNDER ARTICLE 20(1) AND (2) (as of 12 NOVEMBER 2009)
 AND (2) (as of 12 NOVEMBER 2009)") IUU Regulation (EC) n 1005/2008 of 29 September 2008 INFORMATION ON STATES AND THEIR COMPETENT AUTHORITIES NOTIFIED UNDER ARTICLE 20(1) AND (2) (as of 12 NOVEMBER 2009) Below is the information on third
IUU Regulation (EC) n 1005/2008 of 29 September 2008 INFORMATION ON STATES AND THEIR COMPETENT AUTHORITIES NOTIFIED UNDER ARTICLE 20(1) AND (2) (as of 12 NOVEMBER 2009) Below is the information on third
Chapter 2 Results of the Detailed Environmental Survey in FY 2012
 Chapter 2 Results of the Detailed Environmental Survey in FY 2012 1. Purpose of the survey The Detailed Environmental Survey is implemented to provide as required under the Control Law (Law 117, 1973),
Japanese Volkssport Association (JVA),IVV-Japan
,IVV-Japan") Japanese Volkssport Association (JVA),IVV-Japan Kanda St. Bldg, 1-2-4, 3F, Yushima, Bunkyo, Tokyo, 113-8530, JAPAN Tel. +81-3-5256-7850 Fax. +81-3-5256-7856 E-Mail: jva@walking.or.jp Honorary President
Japanese Volkssport Association (JVA),IVV-Japan Kanda St. Bldg, 1-2-4, 3F, Yushima, Bunkyo, Tokyo, 113-8530, JAPAN Tel. +81-3-5256-7850 Fax. +81-3-5256-7856 E-Mail: jva@walking.or.jp Honorary President
LCC Competition in the U.S. and EU: Implications for the Effect of Entry by Foreign Carriers on Fares in U.S. Domestic Markets
 LCC Competition in the U.S. and EU: Implications for the Effect of Entry by Foreign Carriers on Fares in U.S. Domestic Markets Xinlong Tan Clifford Winston Jia Yan Bayes Data Intelligence Inc. Brookings
Data Compilation Corporate Data
 Data Compilation Corporate Data CONTENTS 1. Outline of Japan Post Holdings Co., Ltd. 1. Company Outline 96 2. Information on Shares 96 3. Number of Employees 96 4. List of Directors, s and Management Committees
SHIP MANAGEMENT SURVEY. July December 2017
 SHIP MANAGEMENT SURVEY July December 2017 INTRODUCTION The Ship Management Survey is conducted by the Statistics Department of the Central Bank of Cyprus and concentrates primarily on transactions between
JCAB Circular No
 September 30, 2005 June 30, 2011 Overall revision Partial amendment JCAB Circular No. 1-013 Director, Airworthiness Division Aviation Safety and Security Department Japan Civil Aviation Ministry of Land,
Hayato Kato. Current Position. Education. Research Interests. Publications
 Hayato Kato Curriculum Vitae Last Updated: February 21, 2018 Faculty of Economics, Keio University Mita 2-15-45, Minato-ku, Tokyo 108-8345, Japan Email: hayato.kato2@gmail.com Website: https://sites.google.com/site/hayatokato1/
Working Across political Boundaries to Realize Quality Infrastructure Investment -Case of Japan-
 Working Across political Boundaries to Realize Quality Infrastructure Investment -Case of Japan- Kazuko Ishigaki Director, International Planning for Construction Industry Ministry of Land, Infrastructure,
Crisis and Strategic Alliance in Aviation Industry. A case study of Singapore Airlines and Air India. Peter Khanh An Le
 Crisis and Strategic Alliance in Aviation Industry A case study of Singapore Airlines and Air India National University of Singapore 37 Abstract Early sights of recovery from the US cultivate hope for
Institute for Economic Studies, Keio University. Keio-IES Discussion Paper Series
 Institute for Economic Studies, Keio University KeioIES Discussion Paper Series Basic information about wardamaged cities in Japan Junichi Hasegawa 11 September, 2015 DP2015009 http://ies.keio.ac.jp/en/publications/4494
Financial Status of Aichi Prefecture
 Financial Status of Aichi Prefecture November, 2016 Aichi Prefecture Contents Highlights P2 1. Overview P3 2. Fiscal Profile P10 3. Aichi Local Government Bonds P15 4. Appendix P22 1 Highlights Outstanding
Supplementary Appendix : List of participating centers for the J-AMI registry.
 Supplementary Appendix : List of participating centers for the J-AMI registry. Aijinkai Chibune General Hospital Akanekai Tsuchiya General Hospital Akashi City Hospital Akita Kumiai General Hospital Akita
OCONUS/Foreign Per Diem Rate Changes for
 OCONUS/Foreign Rate Changes for Remarks: Post Additions: November 1, 2018, the following location is added to the Supplement: Naha, Japan; Singapore (ASEAN Summit); Port Moresby, Papua New Guinea; Cairns
Making Japan a Tourism-based Country; A beautiful country. Gist of the Japan Tourism Action Plan
 Chapter 2: Making Japan a Tourism-based Country; A beautiful country Roles and development of a Tourism-based Country Tourism provides a breath of live and comfort, adding color to people s lives. Yet
Cities Necessity to build intercity networks for their self-sustainability : Lessons learned from the Great East Japan Earthquake
 Cities Necessity to build intercity networks for their self-sustainability : Lessons learned from the Great East Japan Earthquake 2012 Annual Meeting of UGC August 21-27 TU Dortmund Masateru HINO Tohoku
The 2011 off the Pacific coast of Tohoku Earthquake. (immediate version)
") 2011.3.15 The 2011 off the Pacific coast of Tohoku Earthquake SituationReport 1 (immediate version) SEEDS Asia Map of Seismic Intensity Tohoku Earthquake of 14:46(JST), 11 March 2011 Source : Japan Meteorological
2011.3.15 The 2011 off the Pacific coast of Tohoku Earthquake SituationReport 1 (immediate version) SEEDS Asia Map of Seismic Intensity Tohoku Earthquake of 14:46(JST), 11 March 2011 Source : Japan Meteorological
Regulation, Privatization, and Airport Charges: Panel Data Evidence from European Airports. forthcoming in Journal of Regulatory Economics
 Regulation, Privatization, and Airport Charges: Panel Data Evidence from European Airports forthcoming in Journal of Regulatory Economics Volodymyr Bilotkach, Northumbria University; Joseph Cloughterty,
An Assessment on the Cost Structure of the UK Airport Industry: Ownership Outcomes and Long Run Cost Economies
 An Assessment on the Cost Structure of the UK Airport Industry: Ownership Outcomes and Long Run Cost Economies Anna Bottasso & Maurizio Conti Università di Genova Milano- IEFE-Bocconi 19 March 2010 Plan
FY2016 Results of the Radioactive Material Monitoring in the Water Environment. March 2018 Ministry of the Environment
 FY216 Results of the Radioactive Material Monitoring in the Water Environment March 218 Ministry of the Environment Contents Outline... 1 Part 1: National Radioactive Material Monitoring in the Water
Evaluation of the National Railway Reform in Japan
 Evaluation of the National Railway Reform in Japan Paris, 8 th September, 2010 Takashi Yanagawa, Kobe University Ichiro Yoshino, Nagoya University of Commerce & Business Kozo Harimaya, Ritsumeikan University
Dr. Yoichi Watanabe, M.D. Fukushima Red Cross Hospital. Vice President Director General (Dept. of Neurosurgery) Fukushima Red Cross Hospital
 Fukushima Red Cross Hospital") The 3 rd Reference Group Meeting on Nuclear & Radiological Emergency Preparedness Oct 27, 2014 Relief Activities Conducted by the Japanese Red Cross Society after the Fukushima Daiichi Nuclear Power Plant
The 3 rd Reference Group Meeting on Nuclear & Radiological Emergency Preparedness Oct 27, 2014 Relief Activities Conducted by the Japanese Red Cross Society after the Fukushima Daiichi Nuclear Power Plant
1.4: Premium Air Travel: An Important Market Segment
 CHAPTER 1.4 Premium Air Travel: An Important Market Segment SELIM ACH BRIAN PEARCE International Air Transport Association (IATA) The premium (first and business class) travel segment is an important market,
PREFERENCES FOR NIGERIAN DOMESTIC PASSENGER AIRLINE INDUSTRY: A CONJOINT ANALYSIS
 PREFERENCES FOR NIGERIAN DOMESTIC PASSENGER AIRLINE INDUSTRY: A CONJOINT ANALYSIS Ayantoyinbo, Benedict Boye Faculty of Management Sciences, Department of Transport Management Ladoke Akintola University
REGIONAL V ARIATIONS IN JAPANESE VALUES TODAY
 REGIONAL V ARIATIONS IN JAPANESE VALUES TODAY SOFUE Takao According to the Yoron chosa nenkan 1990-ban [Yearbook ofpublic Opinion Polls, 1990 Edition] edited by the Public Relations Section of the Prime
An Incentives Guide to BUSINESS IN NAGOYA
 An Incentives Guide to BUSINESS IN NAGOYA TABLE OF CONTENTS 01 A. REGIONAL OVERVIEW 02 B. LOGISTICS & INFRASTRUCTURE 03 C. INDUSTRIAL INFORMATION 04 D. BUSINESS INCENTIVES 05 E. SUBSIDY PROGRAMS 10 F.
SHIP MANAGEMENT SURVEY. January June 2018
 CENTRAL BANK OF CYPRUS EUROSYSTEM SHIP MANAGEMENT SURVEY January June 2018 INTRODUCTION The Ship Management Survey (SMS) is conducted by the Statistics Department of the Central Bank of Cyprus and concentrates
Data Compilation Corporate Data
 Data Compilation Corporate Data CONTENTS 1. Outline of Japan Post Holdings Co., Ltd. 1. Company Outline 94 2. Information on Shares 94 3. Number of Employees 94 4. List of Directors, s and Management Committees
October 18th, National Institute of Information and Communications Technology (NICT)
") October 18th, 2006 National Institute of Information and Communications Technology (NICT) JGN2 Summary -JGN2is National Project which is based on National IT policy e- Japan strategy and u-japan strategy.
October 18th, 2006 National Institute of Information and Communications Technology (NICT) JGN2 Summary -JGN2is National Project which is based on National IT policy e- Japan strategy and u-japan strategy.
The Macroeconomics of Itaipú:
 The Macroeconomics of Itaipú: Measuring the Impact of a Large Fiscal Shock Javier Charotti University of Chicago Banco Central del Paraguay Constantino Hevia Universidad T. di Tella Andy Neumeyer Universidad
JAL Group Announces Consolidated Financial Results for Full Fiscal Year 2011
 JAL Group Announces Consolidated Financial Results for Full Fiscal Year 2011 TOKYO May 14, 2012: The JAL Group (JAL) announced today the consolidated financial results for the full fiscal year of 2011
Supply of Medical and Welfare Facilities for the Elderly in Islands of the Seto Inland Sea
 Proceedings of the 12th ISAIA, Oct 23-26, 2018, Pyeongchang, Korea Supply of Medical and Welfare Facilities for the Elderly in Islands of the Seto Inland Sea Kaori Kurashita 1, Sachiko Mishima 2, Mahito