Full Year Results Presentation 17 February 2015
|
|
|
- Delphia Dinah Barnett
- 5 years ago
- Views:
Transcription


1 Hotel Wilshire, a Kimpton Hotel, Los Angeles Full Year Results Presentation 17 February
2 2014 highlights and market perspectives 2014 was an excellent year for IHG Delivered strong financial performance Made excellent strategic progress, enhancing our portfolio of preferred brands Disciplined approach to capital allocation generated over $1bn of shareholder returns Compelling industry tailwinds Globalisation of travel Emerging market middle class / outbound travellers Branded hotels increasing market share Favourable US supply / demand dynamics Uncertain macroeconomic conditions Strengthening US$ Oil price fall Eurozone: Greece, QE Continuing geopolitical concerns in Middle East 2


3 Hotel Indigo, Paris Financial Review Paul Edgecliffe-Johnson CFO 3
4 Strong underlying financial performance Reported Underlying 1 Full year 2014 Full year 2013 % change % change Revenue $1,858m $1,903m (2)% 6% Fee Revenue 2 $1,255m $1,176m 7% 7% Operating profit $651m $668m (3)% 10% Interest $(80)m $(73)m 10% Tax rate 3 31% 29% 2%pts Adjusted EPS % Weighted basic average shares 247m 264m (6)% ¹Underlying calculated at constant FY13 exchange rates (CER) and excludes individually significant liquidated damages, results from managed lease hotels, and results from owned asset disposals. 2 Group revenue excluding owned & leased hotels, managed leases and significant liquidated damages. 3 Before exceptional items. 4 Before exceptional items, underlying growth based on reported interest and tax rate. 4
5 Global demand growth for IHG branded hotels RevPAR X Rooms X Royalty Rate 2014 fee revenue 1 $1,255m, up 7% 2014 Group RevPAR growth 2014 system growth (%) 6.1% 6.0% 2.7% 2.2%pts 3.4% ADR Occupancy RevPAR 2014: 5.5% total 2 RevPAR growth Gross Net 2014: 41k rooms opened, 18k rooms removed 1 Fee revenue excludes revenue from owned and leased hotels, managed lease hotels, and significant liquidated damages receipts; growth is stated at CER. 2 All hotels, including those that have opened or exited in either FY13 or FY14, reported at CER. 5
6 Business model drives revenue growth in all regions RevPAR X Rooms X Royalty Rate 2014 fee revenue¹ growth 9.5% 7.2% 7.8% 6.8% 5.0% $22m $6m 2014 fee $1,255m $688m $173m $162m $103m revenue 1 Group 2 Americas Europe AMEA Greater China $1m $3m ¹ Fee revenue excludes revenue from owned and leased hotels, managed lease hotels, and significant liquidated damages; growth is stated at CER. ² Group fee revenue includes $129m of central revenue. 6
7 The Americas strong RevPAR and highest net rooms growth in 5 years Comparable RevPAR up 7.4%; Q4 up 7.0% US FY and Q4 7.5% Record US demand for 46 months in a row Net rooms growth 1.9% Highest net growth since 2009 Gross rooms growth 4.6% Fee revenue 1 up 7.8% 2014 Growth in fee revenue drivers 1 7.4% 7.8% $22m 1.9% RevPAR Net rooms Fee revenue 2014 Net rooms growth (k) Total underlying revenue 2 up 10% Underlying profit 2 up 8% 451 (12) Pipeline: 86k high quality rooms 38k rooms signed, most since Exits Openings At CER. 2 Underlying growth calculated at CER and excludes individually significant liquidated damages, results from managed lease hotels, and results from owned asset disposals. 7
8 The Americas high quality growth drives Holiday Inn brand family RevPAR premium 28% share of US upper midscale room openings, 7% ahead of nearest competitor 1 RevPAR growth out performance from recent openings Rate driven $5 premium to industry segment 2014 US comparable RevPAR growth for recent openings vs. respective brand portfolio (%) 2014 US total estate RevPAR ($) Holiday Inn Comparable hotels 2 Holiday Inn Express openings 3 Industry upper midscale 4 Occupancy Rate Holiday Inn brand family 1 Sourced from Smith Travel Research data 2 Excludes openings from Recent openings sample size = Holiday Inn: 107 and Holiday Inn Express: 420 hotels. 4 Based on Smith Travel Research data, excludes Holiday Inn brand family. 8
9 Europe strong performance in UK and Germany Comparable RevPAR up 5.1%; Q4 up 4.2% UK 8.9%; Germany 4.1% Net rooms growth 2.1% Gross rooms growth 5.2% Fee revenue 1 up 6.8% Total underlying revenue 2 up 1% Underlying profit 2 up 3% Reduced by InterContinental Paris Le Grand ballroom refurbishment Pipeline: 19k high quality rooms 8k rooms signed Germany signings highest ever 2014 Growth in fee revenue drivers 1 6.8% 5.1% $22m 2.1% RevPAR Net rooms Fee revenue 2014 Net rooms growth (k) (3) Re-focused UK managed business 2013 Exits Openings At CER. 2 Underlying growth calculated at CER and excludes individually significant liquidated damages, results from managed lease hotels, and results from owned asset disposals. 9
10 AMEA robust performance led by established markets Comparable RevPAR up 3.8%; Q4 up 3.1% Middle East up 5.6%; Indonesia up 9.1% Japan up 6.7%; Australia up 3.9% Total RevPAR up 2.2%; Q4 up 2.1% Increasing mix from developing markets 2014 Growth in fee revenue drivers 1 4.7% 5.0% 3.8% $22m Net rooms growth 4.7% Gross rooms growth 6.5% Fee revenue 1 up 5.0% RevPAR Net rooms Fee revenue 2014 Net rooms growth (k) 68 Underlying revenue 2 up 2% Underlying profit 2 up 5% Pipeline: 34k rooms; 8k rooms signed Further investment in (1) 2013 Exits Openings At CER. 2 Underlying growth calculated at CER and excludes individually significant liquidated damages, results from managed lease hotels, and results from owned asset disposals. 10
11 Greater China double digit underlying profit growth Comparable RevPAR up 1.6%; Q4 down (2.0%) 2.5%pts ahead of the industry Tier 1 cities up 4.1%; Q4 up 1.0% Total RevPAR down (3.4%) Mix impact from tier 2 and 3 cities Net rooms growth 14.1% Gross rooms growth 15.5% Fee revenue 1 up 9.5% 2014 Growth in fee revenue drivers % 9.5% $22m 1.6% RevPAR Net rooms Fee revenue 2014 Net rooms growth (k) 78 Total underlying revenue 2 up 3% Underlying profit 2 up 10% Pipeline: 54k rooms; 16k rooms signed Continued long-term investment in (1) 11 Exits Openings At CER. 2 Underlying growth calculated at CER and excludes individually significant liquidated damages, results from managed lease hotels, and results from owned asset disposals. 11
12 Greater China building on our leading scale position Record year for openings with 2x more than nearest competitor Increase in rooms drives growth in fee revenue 2014 room openings (k) 1 IHG Managed fee revenue progression ($m) % CAGR IHG Starwood Marriott Hilton Accor Hyatt 2009 RevPAR Rooms Competitor data from Smith Travel Research census report. 12
13 Greater China long-term mainstream opportunity in tier 2/3 cities Established in tier 1 cities with 7k more rooms than any International competitor Growth in Chinese middle class will benefit tier 2/3 cities IHG has the largest pipeline in tier 2/3 but is yet to open a hotel in +200 cities China share of middle class by city tier 1 Holiday Inn brand family open room distribution by city tier (k) 37.5 Tier 2/3 60% 84% % Tier 2/3 56% Tier 1 40% 16% Tier 1 44% 37% Based on information from 266 cities; source McKinsey report Mapping China s middle class 13
14 Fee margin progression driven by scale and efficiency benefits Fee margin up 1.5%pts to 44.7% 1 in 2014 Americas: strong RevPAR growth in our most scalable region Greater China: managed business margin improved; re-investment in 2015 AMEA: impacted by investment expected to continue into 2015 Europe: long-term benefits from streamlining of managed business Central: enhanced management information and more efficient processes in HR and Technology Foreign exchange expected to be a short-term translation headwind Scale and efficiency benefits will continue to be balanced with investment in growth 1 Fee margin calculated at actual exchange rates; excludes individually significant liquidated damages, results from managed lease hotels, and owned and leased hotels. 14
15 Capital allocation strategy disciplined approach maintains flexibility and maximises returns Efficient balance sheet with an investment grade credit rating 2.0 to 2.5x net debt / EBITDA Towards top end in favourable economic conditions Currently 2.6x post Kimpton acquisition Reduce asset intensity of the business InterContinental Paris disposal expected to complete in H Strategic review of other major owned assets continuing Three uses of cash 1. Invest in the business to drive growth, including M&A 2. Maintain sustainable ordinary dividend growth 3. Return surplus funds to shareholders 15
16 Capital expenditure philosophy Medium-term per annum capital expenditure guidance Gross: up to $350m 1 ; Net ~$150m 1 Maintenance capex & key money O&L Hotel maintenance Corporate infrastructure maintenance Key Money (return generating) Hotel maintenance reducing in line with asset intensity Key money deployed to access strategic opportunities; only used when returns attractive Medium term p.a Maintenance $60m - $85m $101m Key money $25m - $75m $53m Net total ~$150m $154m Recyclable investments Invest Investment to drive growth Recycle Establishes long-term fee revenue Support new brands and priority market growth Broadly neutral over time Medium term p.a Gross out $50m - $150m $60m* Gross in $50m - $150m $48m Net total ~$0m $12m * Includes $12m invested in InterContinental New York The Barclay System fund capital investments IHG System Fund IHG finances capital expenditure Depreciation charged to system fund not IHG Resulting system fund cash surplus flows back to IHG Broadly neutral over time Medium term p.a Gross out $35m $57m Gross in $35m $20m Net total ~$0m $37m 1 Excludes future spend related to strategic IT projects and JV investment in the refurbishment of InterContinental New York Barclay. 16
17 Shareholder returns consistent ordinary dividend growth and special dividends Total shareholder returns of over $1.0bn in 2014 Proposed total dividend of 77, 10% growth in 2014, 11% CAGR since 2004 Special dividends and share buybacks of $0.9bn completed in 2014 Annual ordinary dividend ( per share) %
18 IHG is a highly cash generative business with a disciplined approach to capital allocation Net capital expenditure of $203m covered ~3x by underlying cash from operations Shareholder returns funded by operations, disposals, and efficient balance sheet Cash inflows 2014 sources and uses of cash ($m) 1,000 Cash outflows (200) EBITDA Other operating items 1 Interest and tax Adjusted cash from operations 2 Maintenance capex and key money Recyclable / system fund capex Disposal proceeds Cashflow before exceptionals and financing Exceptional Increase in Cash items borrowings available for shareholders Ordinary dividend Special dividend and share buyback FX / other (79) Change in cash 1 Includes purchase of own shares by employee share trusts. 2 Excludes exceptional items. 18


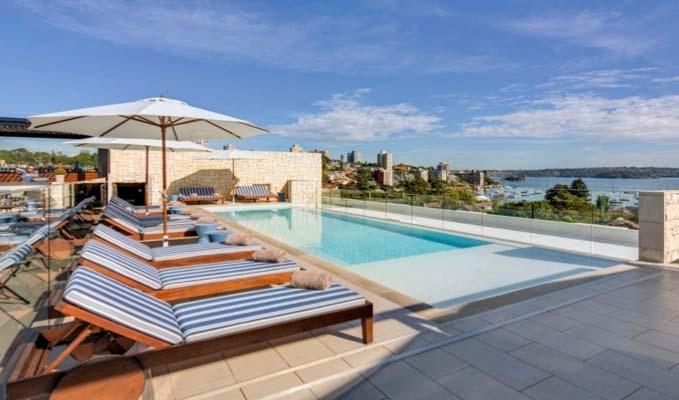
19 InterContinental Hotel, Double Bay, Sydney Operating Review Richard Solomons CEO 19


20 IHG is delivering against its winning strategy for long-term sustainable growth Value creation: superior shareholder returns Value creation: Superior shareholder returns Winning Model Targeted Portfolio Attractive markets Highest opportunity segments Managed & franchised model Disciplined execution Scale and efficiency of operations Investment in developing great talent and technology platforms Commitment to responsible business practices 20
21 We have strengthened our brand portfolio Luxury Price Point Midscale Wellbeing Family Time Romantic Getaway Short Break Experience Rest & Go Mixing Business with Pleasure Business Productivity Building Business Interactions Social Identity 21
22 Holiday Inn Brand Family World s only global mainstream hotel brand Unprecedented scale Largest global hotel brand with largest global pipeline 2x larger than nearest competitor Only global brand with meaningful presence outside of US - 20% share of non-us open rooms in segment Capturing emerging market growth Brand debut in 9 countries in past 3 years Including India, Indonesia, Russia, Singapore, Thailand & Nicaragua More than 100 open and pipeline hotels in Greater China Strongest year of signings since 2008 New markets in pipeline include Australia and El Salvador Brand debut in 4 countries in past 3 years Including Ecuador, Mauritius and Oman More than 115 open and pipeline hotels in Greater China New markets in pipeline include Peru, Vietnam and Algeria 22


23 2014 growth in new markets Holiday Inn Express, Nicaragua Holiday Inn Express, Clarke Quay, Singapore Holiday Inn Resort, Sanya Bay, China Holiday Inn Express, Voronezh, Russia 23
24 Holiday Inn Brand Family Continuing evolution of guest experience Holiday Inn Brand Innovation Open lobby delivered in 5 markets across Europe - Rollout continuing into 2015 US restaurant concept (Burger Theory) expanding to new locations - Initial pilot hotel has seen 30%+ increase in F&B revenue Holiday Inn Express Brand Innovation Express Start Breakfast enhancements implemented in US and being rolled out in Europe and Greater China - 5% pts improvement in guest satisfaction of available breakfast choices New US Holiday Inn design solution and guest room launched - To be rolled out in Americas for all new and renovated hotels from
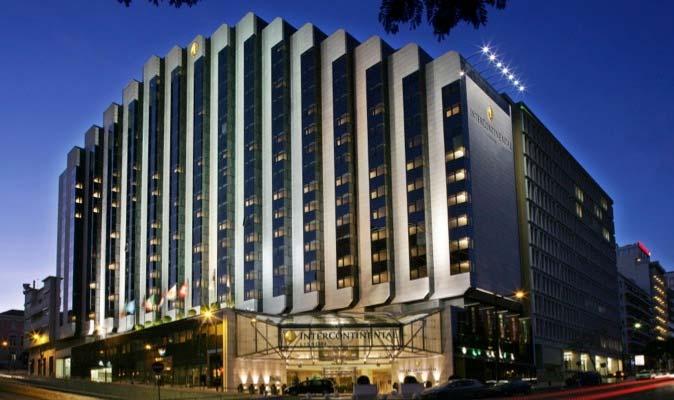
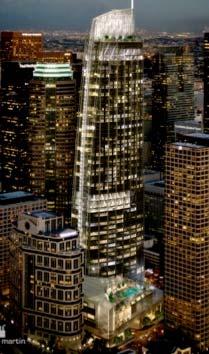
25 InterContinental Hotels & Resorts Momentum behind world s largest luxury brand Unrivalled global luxury brand 2x larger than nearest competitor Voted World s Leading Hotel Brand in World Travel Awards for 6th consecutive year Global Highlights 8 iconic openings and 11 signings - New openings include Sydney, Dublin and Lisbon - Signings include Singapore, Indonesia and Australia Landmark US signings 900 room hotel in downtown Los Angeles, part of 73-storey, $1.1 billion new-build project - Largest InterContinental hotel in Americas on opening in room hotel on waterfront in Washinton D.C., part of new build, mixed use development, signed in January


26 Landmark openings and signings 26
27 Crowne Plaza Making Business Travel Work Leading global upscale brand Opened 400th Crowne Plaza globally Pre eminent 5-star hotel brand in Greater China with more than 115 open and pipeline hotels Strong 2014 performance Total revenue up 5% - Americas revenue up 10%, largest annual increase since 2006 US RevPAR up 8.3% 27 signings, including 10 in Americas Ongoing brand refresh Guest experience enhancements rolled out in US, Canada and Europe Next generation guest room unveiled 27


28 Next Generation Guest Room Unique and innovative Next Generation Guest Room, Floor Plan 28
29 HUALUXE Hotels and Resorts Industry first in an untapped market Innovative brand developed for Chinese guest First global hotel brand designed specifically for Chinese guest Based on four Chinese guest priorities tradition, rejuvenation, status recognition and enabling spaces Developed in China by our leading China management team Opening in heart of China First hotel opened in Yangjiang on 8 February Second hotel opening in Nanchang high tech zone in first half Targeting 100 cities in Greater China in 15 to 20 years cities in Greater China with population greater than 1 million Chinese outbound opportunity 150 million outbound visitors by 2020 Future plans to introduce brand in key international destinations 29


30 First openings in the heart of China OPEN & PIPELINE HOTELS BEIJING SHANGHAI CHINA NANCHANG Opening in H Population: 5.0m* High tech zone and gateway to SE China HUALUXE Hotel & Resort, Nanchang Open hotels Pipeline hotels YANGJIANG Opened February Population: 2.8m* Popular leisure and business destination *Source: official statistics bureau 30
31 Hotel Indigo Delivering quality openings and signings Strong US business RevPAR premium to segment doubled since 2012 Entering high RevPAR markets Best year for signings since 2008 Entering attractive global markets Tripled non-us business in past 3 years 2014 debut in prime European gateway cities - Paris, Madrid, Rome and St Petersburg Opened first property in AMEA in Bangkok in January Fastest growing industry segment, over last 5 years Significant growth potential 21 signings (3,236 rooms), strongest level in 7 years - New flagship in Manhattan; first property in Bali, Indonesia Portfolio will double near-term; pipeline of more than 60 hotels 31


32 Recent openings distinctive and authentic neighbourhoods Hotel Indigo, St Petersburg Hotel Indigo, Paris Hotel Indigo, Manhattan Financial District Hotel Indigo, Bangkok Wireless Road 32
33 Kimpton hotels & restaurants Good progress post acquisition Recently closed acquisition Transaction completed on 16 January 2015 Largest independent boutique operator 62 open hotels, 16 pipeline hotels at closing Purchase price of $430m Compelling strategic rationale Creates world s largest boutique hotel business Fastest growing industry segment, over last 5 years Excellent fit within IHG s brand portfolio Presence in most attractive US markets Ability for IHG to accelerate non-us growth Good early progress Mike DeFrino appointed as CEO Key members of senior management team retained Integration process proceeding well New signing to be announced shortly 33


34 Unique hotel portfolio Hotel Monaco, a Kimpton Hotel, Philadelphia Cypress Hotel, a Kimpton Hotel, California Epic Hotel, a Kimpton Hotel, Miami FireSky Resort & Spa, a Kimpton Hotel, Scottsdale 34
35 Our winning strategy is underpinned by great technology Value creation: superior shareholder returns Value creation: Superior shareholder returns Winning Model Targeted Portfolio Attractive markets Highest opportunity segments Managed & franchised model Disciplined execution Scale and efficiency of operations Investment in developing great talent and technology platforms Commitment to responsible business practices 35
36 Our approach to technology Dream Plan Book Stay Share Insight into guest needs across the entire Guest Journey Know the market and leverage current trends to enhance the guest experience Understanding needs of different demographics, e.g. Boomers vs. Millennials Own the stay experience Focus on adding value in dream, plan, book, and share Build on IHG s track record of innovation and leadership Invest smartly control IP and data; partner where appropriate 36


37 Technology is changing engagement and ownership of the customer across the guest journey Mobile Social media Personalisation Internet of things 37
38 IHG has led the industry to create a powerful distribution platform 1 st computerised reservation system History of hotel industry innovation and firsts 1 st online bookings 1 st to introduce best price guarantee 1 st to have apps on all mobile platforms Strong direct channels deliver lowest cost revenue for owners Websites in 16 languages Social presence in over 200 countries Market leading mobile app in 13 languages 2,900 agents, 12 call centres,14 languages 38
39 Our technology roadmap drives market leading innovation across the guest journey Dream Plan Book Stay Share 1 Digital content Connect and engage with guests throughout the journey and broaden role of the brand Interface with customers 3 Data, analytics & CRM Property level capabilities Robust and efficient in hotel execution to deliver on brand promise Drive revenue and loyalty through advanced business intelligence 2 4 Flexible and scalable infrastructure Ensure solid foundations for flexible, agile and integrated technology ecosystems 39
40 Enhanced digital content is growing IHG direct channel revenue contribution 1 3 Digital content Data & analytics Dream Plan Book Stay Share Targeted digital marketing Efficient digital marketing platform enables better guest targeting at the dream and plan stage Tailored offerings for IHG Rewards Club members Personalised loyalty campaigns including over 1m automatically tailored offers Spring campaign Big Win generated $360m+ revenue Leading web presence Total digital revenue growth accelerated to 13% in Q4 More reviews for IHG hotels than any other website All brand websites to be re-launched by end of
41 Enhanced digital content is growing IHG direct channel revenue contribution 1 2 Digital content Property level capabilities Dream Plan Book Stay Share Mobile check in / out launched at over 500 hotels Mobile check-in and check-out launched at over 500 hotels Deliver in 3,300 US hotels in 2015, then roll-out globally Piloting mobile room key technology Enhanced our #1 rated mobile app IHG Translator launched allowing guests to travel like a local in 15+ languages Brand apps streamlined into single IHG app 2014 app downloads up 80% to 1.4m; total 3.5m 2014 mobile bookings of $0.9bn up 50% Introduced innovative in hotel capabilities Piloting Beacon technology which enables location based offers and information to be pushed to guest mobiles Introduced new CRM capability to offer a more personalised guest experience 41


42 Our mobile app delivers a seamless experience across the guest journey 1 Digital content Dream Plan Book Stay Share InterContinental concierge Past stays and nearby hotels Points & cash options Mobile check-in at over 500 hotels Post reviews 42
43 IHG remains well positioned for high quality growth Positive long-term industry dynamics Asset light business model delivers high quality income Excellent progress in delivering our strategy Industry leading technology platforms and digital content Disciplined approach to capital allocation Heightened macroeconomic and geopolitical uncertainty frame our outlook 43


44 Hotel Monaco, a Kimpton Hotel, Philadelphia Q&A 44


45 Holiday Inn, Sanya Bay, China Holiday Inn Express, Yancheng China Appendices 45
46 Foreign exchange translation exposure $9m impact from currency translation in 2014 Recent trends indicate further impact in 2015 Region Major non USD currency exposure Reported EBIT ($m) 2014 Foreign exchange impact on 2014 EBIT ($m) 2014 actual rates vs. Jan vs actual rates 1 actual rates Americas Canadian Dollar Europe AMEA GB Pound, Euro, Russian Rouble Japanese Yen, Australian Dollar, Singapore Dollar 89 (2) (14) 84 (3) (6) Greater China Chinese Renminbi 89 (1) - Central GB Pound (155) (3) 13 Total 651 (9) (7) 1 Based on average monthly exchange rates in each year. 2 Estimated based on exchange rates as at the end of January
47 2014/ 2015 significant one offs 2014 $7m significant liquidated damages receipt in Americas franchise $(5)m impact in Americas managed from the InterContinental New York Barclay renovation $(3)m impact in Americas managed from devaluation of the Venezuelan Bolivar 2013 $(5)m impact in Americas overheads from unusually high US healthcare claims $(5)m Europe O&L profit impact from InterContinental Paris - Le Grand renovation $(2)m impact from investment in AMEA managed $5m Greater China managed profit impact from small one-offs and cost management 2014 O&L revenue and profit from owned hotels Revenue Profit InterContinental New York Barclay (Americas) (completed H1 14) $14m $(1)m InterContinental Mark Hopkins, San Francisco (Americas) (completed H1 14) $9m - InterContinental Paris Le Grand (Europe) (expected to complete H1 15) $111m $14m 2015 $(5)m impact in Americas managed from the InterContinental New York Barclay renovation 2013 $(3)m continued investment and refurbishments in AMEA managed $(5)m in Greater China investment in operations capability 47

 Based on actual USD with the exception of group royalty drivers which are")

48 Hotel franchising Total gross revenue¹ $bn (rooms only) Group royalty drivers 2014 YoY Average rooms 0.7% RevPAR 6.1% Royalty fees 7.5% Franchise Fees 2 $m Franchise EBIT 2 $m (margin %) (85%) (85%) (84%) Based on actual USD with the exception of group royalty drivers which are calculated at constant exchange rates. ¹Total gross revenue is defined as total room revenue from franchise hotels, it is not revenue attributable to IHG. ²Franchise fees and EBIT exclude individually significant liquidated damages of $9m in 2013 and $7m in
 Management Fees² $m 2014 9.")
 Managed")
 Americas Revenue 38 34 Americas EBIT")
")


49 Hotel management Total gross revenue 1 $bn (total hotel) Management Fees² $m Managed EBIT² $m (margin %) Managed lease revenue and EBIT $m $m (59%) Americas Revenue Americas EBIT (57%) Europe Revenue Europe EBIT 2 2 AMEA Revenue (59%) AMEA EBIT 4 1 Based on actual USD ¹Total gross revenue is defined as total hotel revenue from managed hotels, it is not revenue attributable to IHG. ²Hotel management fees and EBIT exclude the results of leased properties, individually significant liquidated damages of $37m in 2013 and $nil in
 2013 398 2013 86 (22%) 2012 378 2012 76 (20%) O&L EBITDA $m O&L")


, InterContinental Mark Hopkins (sold 2014) and InterContinental")

50 Owned & Leased O&L revenue $m O&L EBIT $m (margin %) (20%) (22%) (20%) O&L EBITDA $m O&L Revenue and EBIT from disposals ($m) $m InterContinental Barclay Revenue InterContinental Barclay EBIT (1) InterContinental Mark Hopkins Revenue 9 43 InterContinental Mark Hopkins EBIT InterContinental Park Lane Revenue - 22 InterContinental Park Lane EBIT - 8 *All charts exclude results from disposed assets: Staybridge Suites Chicago Oakbrook Terrace (sold 2012), InterContinental London Park Lane (sold 2013), InterContinental Mark Hopkins (sold 2014) and InterContinental New York The Barclay (sold 2014) Revenue from these hotels was: 2014= $23m, 2013 = $140m, 2012 = $204m. Operating profit: 2014 = ($1m), 2013 = $28m, 2012 = $58m. Based on actual USD 50
Interim Results Presentation 30 July 2015
 Holiday Inn Resort, Bali Interim Results Presentation 30 July 2015 1 First half highlights and market perspective Continued strategic progress Strong underlying financial performance Growth momentum behind
Driving global growth
 Holiday Inn, Manhattan Financial District Driving global growth Paul Edgecliffe Johnson Group CFO IHG has a consistently executed, winning strategy for high quality growth Value creation: superior shareholder
Annual General Meeting 6 May 2016
 Hotel Indigo Lower East Side, New York Annual General Meeting 6 May 2016 1 Hotel Indigo Tel Aviv Diamond District, Israel Patrick Cescau Chairman 2 Hotel Monaco, a Kimpton Hotel, Philadelphia Richard Solomons
IHG. Supplementary Information 31 December 2014
 Supplementary Information 31 December 2014 Index RevPAR - 3 and 12 months to 31 December 2014 2014 Current Trading RevPAR, ADR & Occupancy Hotel & Room Count at 31 December 2014 Pipeline at 31 December
China Lodging Group (HTHT.US) Q4 and full year 2017 Earnings Call March 13, 2018
 Q4 and full year 2017 Earnings Call March 13, 2018") China Lodging Group (HTHT.US) Q4 and full year 2017 Earnings Call March 13, 2018 Agenda Strategy Review Operational and Financial Review Q & A Appendix 1 Strong RevPAR Growth Driven by ADR + Occupancy
China Lodging Group (HTHT.US) Q4 and full year 2017 Earnings Call March 13, 2018 Agenda Strategy Review Operational and Financial Review Q & A Appendix 1 Strong RevPAR Growth Driven by ADR + Occupancy
Hotel Indigo, Tianjin, Greater China Investor Presentation February 2017
 Hotel Indigo, Tianjin, Greater China Investor Presentation February 2017 Clearly defined and consistently executed strategy has driven market out-performance Rooms growth % ( 04 16 CAGR) Room revenue growth
- 5% global industry supply, 12% active industry pipeline; well positioned to deliver sustainable high quality growth. Building preferred brands
 InterContinental Hotels Group PLC Preliminary Results for the year to 31 December 2013 Strong progress in our 10 th anniversary year driven by focus on high quality growth Financial summary 1 2013 2012
MARRIOTT INTERNATIONAL 2017 SECURITY ANALYST MEETING. March 21, 2017
 MARRIOTT INTERNATIONAL 2017 SECURITY ANALYST MEETING March 21, 2017 FORWARD LOOKING STATEMENTS, NON GAAP FINANCIAL MEASURES, AND INFORMATION FOR 2016 AND 2015 This material contains forward looking statements
IHG. Supplementary Information 31 March 2016
 Supplementary Information 31 March 2016 Index RevPAR - 3 months to 31 March 2016 2016 Current Trading RevPAR, ADR & Occupancy Hotel & Room Count at 31 March 2016 Pipeline at 31 March 2016 Room Count &
FIRST QUARTER
 FIRST QUARTER 2007 1 WELCOME TO REZIDOR one of the fastest growing hotel companies in the world 300 250 200 150 100 FAST TRACK GROWTH FRESH & DYNAMIC MULTI-BRAND PORTFOLIO BRAND SEGMENT HOTELS ROOMS Upscale
For personal use only
 ASX and Media Release QANTAS DELIVERS RECORD FIRST HALF PROFIT, INVESTS IN AIRCRAFT AND TRAINING Sydney, 22 February 2018 Underlying Profit Before Tax: $976 million (up 15%) Record results for Qantas Domestic,
China Lodging Group (HTHT.US) Investor Presentation March 2016
 Investor Presentation March 2016") China Lodging Group (HTHT.US) Investor Presentation March 2016 Agenda Our Vision Who We Are Company Highlights Strategic Focus Operational and Financial Review Q & A 1 Our Vision We will build a world-class,
China Lodging Group (HTHT.US) Investor Presentation March 2016 Agenda Our Vision Who We Are Company Highlights Strategic Focus Operational and Financial Review Q & A 1 Our Vision We will build a world-class,
Your next hotel development opportunity
 Your next hotel development opportunity Welcome Leading global hotel company By remaining flexible, strategic, and focused on our brands consumer alliances, InterContinental Hotels Group (IHG ) has grown
InterContinental Brand Simon Scoot -Vice President InterContinental Brand Management. June 2010
 InterContinental Brand Simon Scoot -Vice President InterContinental Brand Management June 2010 1 Video Brand History 2 InterContinental: leading global network Americas: System = 55 hotels Pipeline = 6
China Lodging Group (HTHT.US) Q Earnings March 15, 2017
 Q Earnings March 15, 2017") China Lodging Group (HTHT.US) Q4 2016 Earnings March 15, 2017 Agenda Strategy Review Acquisition of Crystal Orange Hotel Operational and Financial Review Q & A Appendix 1 What We Have Achieved in 2016
China Lodging Group (HTHT.US) Q4 2016 Earnings March 15, 2017 Agenda Strategy Review Acquisition of Crystal Orange Hotel Operational and Financial Review Q & A Appendix 1 What We Have Achieved in 2016
2016 HALF YEAR RESULTS. Mandarin Oriental Hotel Group
 2016 HALF YEAR RESULTS Mandarin Oriental Hotel Group 2016 Half Year Results Highlights US $ m June 2016 June 2015 Combined Total Revenue * 644 641 Underlying EBITDA 71 82 * Includes revenue from the Group
China Lodging Group (HTHT.US) Q Earnings Call August 17, 2017
 Q Earnings Call August 17, 2017") China Lodging Group (HTHT.US) Q2 2017 Earnings Call August 17, 2017 Agenda Lodging Landscape in China Strategy Review Operational and Financial Review Q & A Appendix 1 Strong Demand: Domestic Travel Remains
China Lodging Group (HTHT.US) Q2 2017 Earnings Call August 17, 2017 Agenda Lodging Landscape in China Strategy Review Operational and Financial Review Q & A Appendix 1 Strong Demand: Domestic Travel Remains
Interim Results Presentation to Investors
 Interim Results Presentation to Investors SIR IAN PROSSER CHAIRMAN BASS PLC Highlights 3 Turnover + 11.2% Operating profit * + 21.2% Earnings per share * + 13.6% Dividend per share + 3.1% * Adjusted for
Six Continents PLC. Preliminary Results. For the Year ended 30th September 2001
 1 2 Six Continents PLC Preliminary Results For the Year ended 30th September 2001 3 SIR IAN PROSSER Chairman Business Results Operating Profit ( m)( 4 Six Continents Hotels 427 Up 13.6% Six Continents
InterContinental Hotels Group PLC Excellent 26% growth in operating profit driven by brand outperformance and scale efficiencies
 InterContinental Hotels Group PLC Preliminary Results for the year to 31 December 2011 Excellent 26% growth in operating profit driven by brand outperformance and scale efficiencies % YoY Financial summaryº
Q Results Stockholm, 24 April Wolfgang M. Neumann, President & CEO Knut Kleiven, Deputy President & CFO
 Q1 2014 Results Stockholm, 24 April 2014 Wolfgang M. Neumann, President & CEO Knut Kleiven, Deputy President & CFO / Stockholm - a market with solid growth Expected investment volume until 2020 in STK
PAN PACIFIC HOTELS GROUP LIMITED 2010 FULL YEAR RESULTS BRIEFING 22 FEB 2011
 PAN PACIFIC HOTELS GROUP LIMITED 2010 FULL YEAR RESULTS BRIEFING 22 FEB 2011 2010 RESULTS OVERVIEW STRATEGIC & OPERATIONS HIGHLIGHTS NEO SOON HUP CHIEF FINANCIAL OFFICER 2 CONTENTS Focus and Highlights
Media Release. Qantas Group Full Year 2017 Financial Result 1. Sydney, 25 August 2017
 Media Release Qantas Group Full Year 2017 Financial Result 1 Sydney, 25 August 2017 Underlying Profit Before Tax: $1,401 million (second highest in Qantas history) Statutory Profit Before Tax: $1,181 million
QANTAS DELIVERS STRONG FIRST HALF RESULT DESPITE HIGHER FUEL BILL
 ASX and Media Release Sydney, 21 February 2019 QANTAS DELIVERS STRONG FIRST HALF RESULT DESPITE HIGHER FUEL BILL Underlying Profit Before Tax: $780 million (down $179 million) Statutory Profit Before Tax:
1Q FY2014/15. Financial Results Presentation. 13 August 2014 S Y D N E Y M E L B O U R N E B R I S B A N E C A I R N S
 1Q FY2014/15 Financial Results Presentation 13 August 2014 S Y D N E Y M E L B O U R N E B R I S B A N E C A I R N S B E I J I N G T O K Y O O S A K A S I N G A P O R E Disclaimer This presentation on
AIRBUS H Roadshow Presentation. New York July 31 st, 2017
 AIRBUS H1 2017 Roadshow Presentation New York July 31 st, 2017 H1 2017 HIGHLIGHTS 2 Healthy commercial aircraft environment; robust backlog of 6,771 a/c supports ramp-up plans H1 financials reflect delivery
WH Smith PLC Acquisition of InMotion providing access to the world s largest travel retail market 30 October 2018
 WH Smith PLC Acquisition of InMotion providing access to the world s largest travel retail market 30 October 2018 Transaction highlights WH Smith announces acquisition of InMotion for $198m ( 155 million)
2007/08 Full Year Results Investor Briefing
 2007/08 Full Year Results Investor Briefing Highlights of Result Profit before tax up 46% to $1,408 million Up 36% on the reported result Margin improvement $3 billion of Sustainable Future Benefits achieved
2017 ANNUAL RESULTS. Mandarin Oriental Hotel Group
 2017 ANNUAL RESULTS Mandarin Oriental Hotel Group 2017 Performance and Highlights Hotels performed better in 2017 Results impacted by ongoing renovation of London property Restoration of Hotel Ritz, Madrid
Growth in annual revenue up 2.7% like-for-like and 1.5% as reported, with sustained business in emerging markets
 Press Release Paris January 17, 2013 Growth in 2012 revenue, supported by the transformation of the business model *** Another year of record development, with the opening of more than 38,000 rooms Rapid
For personal use only
 HELLOWORLD TRAVEL LIMITED RESULTS ANNOUNCEMENT Highlights for the year ended 30 June 2018 Total Transaction Value (TTV) growth of 3.5% to $6.1 billion, underpinned by strong air ticket sales volume growth.
2016 ANNUAL RESULTS. Mandarin Oriental Hotel Group
 2016 ANNUAL RESULTS Mandarin Oriental Hotel Group 2016 Annual Results Highlights US $ m 2016 2015 Combined Total Revenue * 1,324 1,335 Group s Total Revenue # 597 607 Underlying EBITDA 158 188 * Includes
Contents. The Strategic Report on pages 2 to 45 was approved by the Board on 20 February George Turner, Company Secretary
 Annual Report and Form 20-F 2016 Contents Strategic Report 2 IHG at a glance 4 Chairman s statement 6 Chief Executive Officer s review 8 Industry overview 10 Our preferred brands 12 Our business model
Minor International Public Company Limited
 Minor International Public Company Limited Management Discussion & Analysis MINT s financial performance as of 30th September 2008 Summary of Key Financial Performance 3Q08 Performance Minor International
MARRIOTT INTERNATIONAL 2017 SECURITY ANALYST MEETING. March 21, 2017
 MARRIOTT INTERNATIONAL 2017 SECURITY ANALYST MEETING March 21, 2017 FORWARD LOOKING STATEMENTS, NON GAAP FINANCIAL MEASURES, AND INFORMATION FOR 2016 AND 2015 This material contains forward looking statements
INTERCONTINENTAL HOTEL GROUP
 HOTEL NAME: INTERCONTINENTAL HOTEL GROUP GROUP PROFILE: History of Intercontinental Hotel Group: 1777 - William Bass sets up a brewery in Burton-on-Trent. The Bass business thrives, developing into one
Never Just Stay. Stay Inspired. CONRAD EMEA DEVELOPMENT BROCHURE. Conrad Dubai, UAE
 Never Just Stay. Stay Inspired. CONRAD EMEA DEVELOPMENT BROCHURE Conrad Dubai, UAE Conrad Istanbul Bosphorus, Turkey Brand Overview Conrad Hotels & Resorts is the destination for a new generation of luxury
Helloworld Travel Limited results announcement Half year ended 31 December 2017
 Helloworld Travel Limited results announcement Half year ended 31 December 2017 HIGHLIGHTS FOR THE HALF YEAR ENDED 31 DECEMBER 2017 Total Transaction Value (TTV) growth of 2.7% to $2.968 billion. Earnings
2018 full-year results
 2018 full-year results 01 Message from Chairman & CEO 02 FY 2018 Results 03 Business drivers 04 Outlook 02 FY 2018 financial results Key figures Revenue 2.85 Bn ROP 115 M Net debt 252 M Free cash flow
Thank you for participating in the financial results for fiscal 2014.
 Thank you for participating in the financial results for fiscal 2014. ANA HOLDINGS strongly believes that safety is the most important principle of our air transportation business. The expansion of slots
FORWARD-LOOKING STATEMENTS
 March 18, 2019 MARRIOTT INTERNATIONAL 2019 SECURITY ANALYST MEETING FORWARD-LOOKING STATEMENTS FORWARD LOOKING STATEMENTS, NON GAAP FINANCIAL MEASURES AND MODEL ASSUMPTIONS This material contains forward
TUI Travel PLC. Investor Day 27 January Blue Village, Hurghada, Egypt. TUI Travel PLC Investor Day January 2011 Page 1
 TUI Travel PLC Investor Day 27 January 2011 TUI Travel PLC Investor Day January 2011 Page 1 Blue Village, Hurghada, Egypt Agenda Journey So Far & Strategic Overview Mainstream Strategy Differentiated Product
SGCIB Premium Review 2018
 SGCIB Premium Review 2018 29 November 2018 Christian Labeyrie Executive Vice-President and CFO Disclaimer This presentation may contain forward-looking objectives and statements about VINCI s financial
75 Years of Thrills and Entertainment. The Rank Group Plc Preliminary Results to 30 June 2012
 75 Years of Thrills and Entertainment The Rank Group Plc Preliminary Results to 30 June 2012 Agenda Introduction Ian Burke, chairman and chief executive Review of financial results Clive Jennings, finance
COMPANY OVERVIEW Unique Ability to Manage Across All Chain Scales
 Aimbridge Hospitality, based in Dallas, is one of the largest independent management companies in the U.S. We currently manage approximately 500 hotels throughout the U.S. and Caribbean with more than
QANTAS HALF YEAR 2015 FINANCIAL RESULTS 1
 QANTAS HALF YEAR 2015 FINANCIAL RESULTS 1 Key points: Underlying Profit Before Tax: $367 million Statutory Profit After Tax: $206 million Transformation benefits: $374 million Comparable unit cost reduction:
MARRIOTT INTERNATIONAL 2017 SECURITY ANALYST MEETING. March 21, 2017
 MARRIOTT INTERNATIONAL 2017 SECURITY ANALYST MEETING March 21, 2017 FORWARD LOOKING STATEMENTS, NON GAAP FINANCIAL MEASURES, AND INFORMATION FOR 2016 AND 2015 This material contains forward looking statements
2004/05 Full Year Results Presentation to Investors
 Geoff Dixon Chief Executive Officer 2004/05 Full Year Results Presentation to Investors 18 August 2005 Group Highlights 12 months to June 2005 12 months to June 2004 Increase/ (decrease) % Sales and operating
USA Acquisition Summary. December 2010
 USA Acquisition Summary December 2010 www.roadbearrv.com Strategic Intent 1. To leverage the existing business capabilities in a significant sized and growing tourism market with a similar customer base.
Acceleration of tourism
 Belgrade 217 Tourism & Hotel Outlook Regulated by RICS Tourism & Hotel Market Outlook 217 LeRoy Realty Consultants 1 The growth of travel & tourism industry considerably outperforms that of the local economy
Building Long Term Shareholder Value
 Building Long Term Shareholder Value Gareth Evans, CFO Macquarie Conference 6 May 2011 Sustainable Returns to Shareholders Leverage dual brands to build on competitive advantage International business
Finding Rationality in an Irrational World: The Economics of Successful Hotel Negotiations
 Finding Rationality in an Irrational World: The Economics of Successful Hotel Negotiations Isaac Collazo, Vice President, Performance Strategy & Planning, InterContinental Hotels Group (IHG) Maria Lowry,
GALAXY ENTERTAINMENT GROUP
 GALAXY ENTERTAINMENT GROUP RECORD HALF YEAR GROUP ADJUSTED EBITDA OF $5.8 BILLION, UP 23% YEAR-ON-YEAR NET PROFIT ATTRIBUTABLE TO SHAREHOLDERS GREW 35% TO $4.6 BILLION FURTHER STRENGTHENED LIQUID BALANCE
Forward Looking Statements and Non GAAP Financial Measures
 Security Analyst Meeting MARRIOTT INTERNATIONAL September 8, 2014 Forward Looking Statements and Non GAAP Financial Measures This material contains forward looking statements within the meaning of federal
Peppers Docklands, Melbourne
 Peppers Docklands, Melbourne Contents Mantra Group Overview State of Market 8 3 Australian Market Mantra Group 18 24 Mantra Salt, Kingscliff Peppers Noosa, Noosa Mantra Group* CBD - RevPAR (A$) Largest
Hampton by Hilton Istanbul Atakoy, Turkey HAMPTON BY HILTON. EMEA Development Brochure
 Hampton by Hilton Istanbul Atakoy, Turkey HAMPTON BY HILTON EMEA Development Brochure Hampton by Hilton Berlin City Centre Alexanderplatz, Germany Brand overview Hampton by Hilton delivers a friendly and
Recovery on track, continued strengthening in most segments. Record Jetstar and Frequent Flyer earnings highlight value of portfolio
 Qantas Full Year 2010 Results Presentation Overview Underlying PBT 1 more than tripled to $377m in line with guidance Delivering against strategic priorities Recovery on track, continued strengthening
FIRST QUARTER 2017 RESULTS. 4 May 2017
 FIRST QUARTER 2017 RESULTS 4 May 2017 A resilient start of the year, traffic up 4.2% 20.9 million passengers carried, up 5.2%, traffic (RPK) up 4.2%, capacity (ASK) up 3.3% and load factor up 0.7pts Confirmation
GOLDEN OPPORTUNITY: Timeshare Meets Asia A T H O C C O N F E R E N C E
 GOLDEN OPPORTUNITY: Timeshare Meets Asia A T H O C C O N F E R E N C E 2 0 1 8 1 Jonathan Mills Managing Director, RCI APAC & DAE Global Jonathan Mills is the Managing Director for RCI s Asia Pacific and
Ramsay Health Care Limited Results Briefing Half Year ended 31 December 2018
 Ramsay Health Care Limited Results Briefing Half Year ended 31 December 2018 Craig McNally, Group Managing Director & Bruce Soden, Group Finance Director 28 February 2019 ramsayhealth.com Agenda Group
AIRBUS. H Roadshow Presentation. July 2018
 AIRBUS H1 2018 Roadshow Presentation July 2018 H1 18 HIGHLIGHTS 2 Robust commercial aircraft environment Backlog of ~7,200 a/c underpins ramp-up plans H1 financials reflect mainly A350 performance and
Interim results. 11 May 2010
 Interim results 11 May 2010 Introduction Andy Harrison Chief Executive Officer Strong performance despite disruption Improvement in revenue, margins and cash Continued network improvement has driven better
TUI GROUP INVESTOR PRESENTATION
 TUI GROUP INVESTOR PRESENTATION German Investment Conference UniCredit / Kepler Munich, 26-27 September 2012 Future-related statements This presentation contains a number of statements related to the future
Ramsay Health Care Limited Results Briefing Year ended 30 June 2018
 Ramsay Health Care Limited Results Briefing Year ended 30 June 2018 Craig McNally, Managing Director & Bruce Soden, Group Finance Director 30 August 2018 ramsayhealth.com Agenda Group Performance Overview
Crown Resorts Limited
 Crown Resorts Limited 2015 Full Year Results Presentation 13 August 2015 1 Crown Resorts Limited Results Overview Crown Resorts Limited (Crown) performance: Overall, the results for Crown s portfolio of
FY RESULTS ROADSHOW PRESENTATION
 1 FY RESULTS 2014 ROADSHOW PRESENTATION FY 2014 HIGHLIGHTS FOCUS ON EXECUTION 2 Strong financial performance Revenues: 61 bn, +5% vs. 2013 EBIT* before one off: 4.1 bn, +15% vs. 2013 EPS: 2.99, +61% vs.
Overview. > Normalised earnings* before taxation of, up 30% > Statutory earnings before taxation of, up 40% > Statutory net profit after taxation of
 1 Overview > Normalised earnings* before taxation of, up 30% > Statutory earnings before taxation of, up 40% > Statutory net profit after taxation of > Operating revenue of > Strong operating cash flow
Wednesday April 13, Kurt Ritter, President & CEO Puneet Chhatwal, Senior Vice President & CDO Knut Kleiven Deputy President & CFO
 Interim Results Q1-2011 Wednesday April 13, 2011 Kurt Ritter, President & CEO Puneet Chhatwal, Senior Vice President & CDO Knut Kleiven Deputy President & CFO Q1-2011 Financial highlights A continued strong
GOOD STRATEGY IMPLEMENTATION DELIVERS SHAREHOLDER VALUE
 GOOD STRATEGY IMPLEMENTATION DELIVERS SHAREHOLDER VALUE Marco Wirén, CFO and Executive Vice President 1 Wärtsilä PUBLIC ATTRACTIVE LONG-TERM INVESTMENT
Managing through disruption
 28 July 2016 Third quarter results for the three months ended 30 June 2016 Managing through disruption 3 months ended Like-for-like (ii) m (unless otherwise stated) Change 30 June 2016 30 June 2015 change
Crown Resorts Limited
 Crown Resorts Limited Annual General Meeting 20 October 2016 1 Presentation Outline F16 Year in Review 2 Crown Resorts Limited Group Result F16 Normalised $m F15 Normalised $m Variance F/(U) F16 Actual
Press Release. Bilfinger with dynamic start to financial year 2018
 Press Release May 15, 2018 Bilfinger with dynamic start to financial year 2018 Book-to-bill ratio reaches 1.2 in the first quarter Fourth consecutive growth quarter in orders received Adjusted EBITA above
Record Result. 2006/07 Full Year Results Investor Presentation. Moved on successfully following bid. Profit before tax % to $1,032 million
 2006/07 Full Year Results Investor Presentation August 16 2007 Record Result Moved on successfully following bid Profit before tax + 53.8% to $1,032 million Group returning above Cost of Capital 2 Key
2014 INTERIM RESULTS PRESENTATION
 2014 INTERIM RESULTS PRESENTATION 31 JULY 2014 1 Forward-Looking Statements Disclaimer The information contained in this presentation has not been independently verified and this presentation contains
WELCOME AND INTRODUCTION
 WELCOME AND INTRODUCTION VASANT PRABHU VICE CHAIRMAN & CHIEF FINANCIAL OFFICER THE WESTIN BUND CENTER, SHANGHAI, CHINA 5 WELL POSITIONED TO CONTINUE DELIVERING INDUSTRY LEADING RETURNS THE ADVANTAGE +
THE FIRST IN SERVICE AND TIMELESS ELEGANCE. EMEA Development Information. Waldorf Astoria Shanghai on the Bund, China
 THE FIRST IN SERVICE AND TIMELESS ELEGANCE. EMEA Development Information Waldorf Astoria Shanghai on the Bund, China Rome Cavalieri, Waldorf Astoria Hotels & Resorts, Italy BRAND OVERVIEW What was once
2017 Amadeus IT Group and its affiliates and subsidiaries. Amadeus 2016 Results. February 24, 2017
 Amadeus 2016 Results February 24, 2017 Disclaimer _ This presentation may contain certain statements which are not purely historical facts, including statements about anticipated or expected future revenue
KERRIE MATHER MANAGING DIRECTOR AND CHIEF EXECUTIVE OFFICER. Macquarie Conference 4 MAY 2016
 KERRIE MATHER MANAGING DIRECTOR AND CHIEF EXECUTIVE OFFICER Macquarie Conference 4 MAY 2016 Disclaimer General securities warning This presentation has been prepared by Sydney Airport Limited (ACN 165
FY17 Full Year Results Management Call, 13 December Robinson Club Noonu, Maldives
 Full Year Results Management Call, 3 December 207 Robinson Club Noonu, Maldives TUI Group TUI continues its strong performance track record in Third consecutive year of strong top line and earnings growth
Remaking the Holiday Inn Brand Family
 Remaking the Holiday Inn Brand Family Kevin Kowalski SVP Holiday Inn Brand Management June 2010 1 Our rifle shot brand is the Holiday Inn master brand with four sub-brands 2 2 Holiday Inn is a global icon
Minor International Public Company Limited
 Minor International Public Company Limited Management Discussion & Analysis MINT s financial performance as of 30th June 2008 Summary of Key Financial Performance 2Q08 Performance Minor International Public
A SMARTER HOTEL INVESTMENT
 A SMARTER HOTEL INVESTMENT MICROTEL 1 LETTER FROM THE MASTERBUILT TEAM 2 THE MICROTEL INN & SUITES BY WYNDHAM STORY 3 MASTERBUILT HOTELS AND WYNDHAM HOTEL GROUP 4 MICROTEL INN & SUITES BY WYNDHAM: A SMARTER
Forward-Looking Statements
 LOGOf 1 Forward-Looking Statements Statements in this presentation that are not reported financial results or other historical information are forward-looking statements within the meaning of the Private
ANA HOLDINGS Financial Results for the Year ended March 31, 2016
 ANA HOLDINGS NEWS ANA HOLDINGS Financial Results for the Year ended March 31, 2016 TOKYO, April 28, 2016 ANA HOLDINGS (hereafter ANA HD ) today reports its consolidated financial results for fiscal year
For personal use only
 ASX / MEDIA RELEASE FOR IMMEDIATE RELEASE 25 February 2016 CROWN ANNOUNCES 2016 HALF YEAR RESULTS MELBOURNE: Crown Resorts Limited (ASX: CWN) today announced its results for the half year ended 31 December
The Ascott Limited. Scales up lodging business with US$26-million investment in Indonesia s leading hotel operator TAUZIA
 The Ascott Limited Scales up lodging business with US$26-million investment in Indonesia s leading hotel operator TAUZIA 17 Sep 2018 Disclaimer This presentation may contain forward-looking statements
Agenda. Introduction Christine Ourmières-Widener. Financial Review Ian Milne. Performance Update & Outlook Christine Ourmières-Widener
 1 Agenda Introduction Christine Ourmières-Widener Financial Review Ian Milne Performance Update & Outlook Christine Ourmières-Widener 2 Strategy of regional connectivity is working Important to UK economy,
01 Amadeus at a glance
 01 Amadeus at a glance 7 Amadeus Annual Report 2011 1.1 Company s origins and development Most people associate the birth of electronic commerce distribution with the arrival of the internet. In fact,
Even Frydenberg, President & CEO Jan Johansson, CFO
 Even Frydenberg, President & CEO Jan Johansson, CFO Strong sales growth driven by more rooms in operations and the acquisition of Restel Underlying like-for-like sales growth, adjusted for calendar effects,
2014 Half Year Results Virgin Australia Holdings Limited 28 February 2014
 2014 Half Year Results Virgin Australia Holdings Limited 28 February 2014 Half year in review Australian aviation market continues to face challenging conditions, ongoing subdued consumer sentiment and
MARRIOTT INTERNATIONAL, INC. PRESS RELEASE SCHEDULES QUARTER 4, 2016 TABLE OF CONTENTS
 PRESS RELEASE SCHEDULES QUARTER 4, 06 TABLE OF CONTENTS Consolidated Statements of Income - As Reported A- Consolidated Statements of Income - Fourth Quarter Adjusted 06 Compared to Combined 05 A-3 Consolidated
Qantas Group - Positioned for Growth and Sustainable Returns
 Qantas Group - Positioned for Growth and Sustainable Returns Tino La Spina, Qantas Group Chief Financial Officer Macquarie Australia Conference 3 May 2018 Third Quarter 1 FY18 Trading Update Q3 trading
Qantas Airways Limited. Nomura Conference 30 November Qantas Group. Gareth Evans Chief Financial Officer
 Qantas Airways Limited Nomura Conference 30 November 011 Qantas Group Gareth Evans Chief Financial Officer The Qantas Group Our Operations Qantas Group is the eleventh largest airline in the world based
Annual General Meeting May 3 rd FULL YEAR RESULTS DELIVERING OUR PROMISE
 Annual General Meeting May 3 rd 2018 2017 FULL YEAR RESULTS DELIVERING OUR PROMISE Key Value Drivers By focusing on our customers, our people, our brands and our growth strategy: We continue to outperform
SET Opportunity Day #3/2011
 SET Opportunity Day #3/2011 2Q11 & 1H11 Performance & Outlook 18 August 2011 The views expressed here contain some information derived from publicly available sources that have not been independently verified.
2008 INTERIM RESULTS HIGHLIGHTS
 2008 INTERIM RESULTS HIGHLIGHTS US$m Combined Total Revenue of Hotels under Management EBITDA (US$m) June 2008 520.1 86.2 June 2007 477.4 84.5 2008 INTERIM RESULTS HIGHLIGHTS US$m June 2008 June 2007 Profit
2017 Amadeus IT Group and its affiliates and subsidiaries. Amadeus 2016 Results. February 24, 2017
 Amadeus 2016 Results February 24, 2017 Disclaimer _ This presentation may contain certain statements which are not purely historical facts, including statements about anticipated or expected future revenue
Visit LaQuintaFranchise.com or call
 Visit LaQuintaFranchise.com or call 866.832.6574 ABOUT LA QUINTA La Quinta Inns & Suites More than 42 years of success The largest owner/operator of select-service hotels Strong brand awareness A leading
GALAXY ENTERTAINMENT GROUP SELECTED UNAUDITED Q FINANCIAL DATA
 GALAXY ENTERTAINMENT GROUP SELECTED UNAUDITED Q1 2014 FINANCIAL DATA RECORD QUARTERLY GROUP ADJUSTED EBITDA OF $3.8 BILLION, UP 38% YEAR-ON-YEAR GALAXY MACAU TM PHASE 2 WELL ADVANCED, ON BUDGET AND ON
Q revenue up 2.1% like-for-like to billion. Solid growth for HotelServices, up 4.7%, and HotelInvest, up 1.2%
 Press Release Quarterly Information Paris April 17, 2014 Q1 2014 revenue up 2.1% like-for-like to 1.135 billion Solid growth for HotelServices, up 4.7%, and HotelInvest, up 1.2% Robust demand in every