Agenda. Introduction Christine Ourmières-Widener. Financial Review Ian Milne. Performance Update & Outlook Christine Ourmières-Widener
|
|
|
- Sharlene Taylor
- 5 years ago
- Views:
Transcription


1 1
2 Agenda Introduction Christine Ourmières-Widener Financial Review Ian Milne Performance Update & Outlook Christine Ourmières-Widener 2
3 Strategy of regional connectivity is working Important to UK economy, connecting businesses and people Key component of international links, connecting long-haul fights especially outside of London An increasing recognition as a significant contributor to the profitability of long-haul carriers Unique brand with strong regional customer base Growing codeshare/interlining with long-haul carriers Increased interest from legacy carriers in further cooperation Political pressure pushing for connectivity to the regions, especially into LHR 3

4 Sustainable Business Improvement Plan NETWORK, FLEET & REVENUE OPTIMISATION SALES AND MARKETING TO DRIVE REVENUE GROWTH OPERATIONAL EXCELLENCE ORGANISATIONAL EXCELLENCE TECHNOLOGY FIT FOR FLYBE COST IMPROVEMENT PROGRAMME
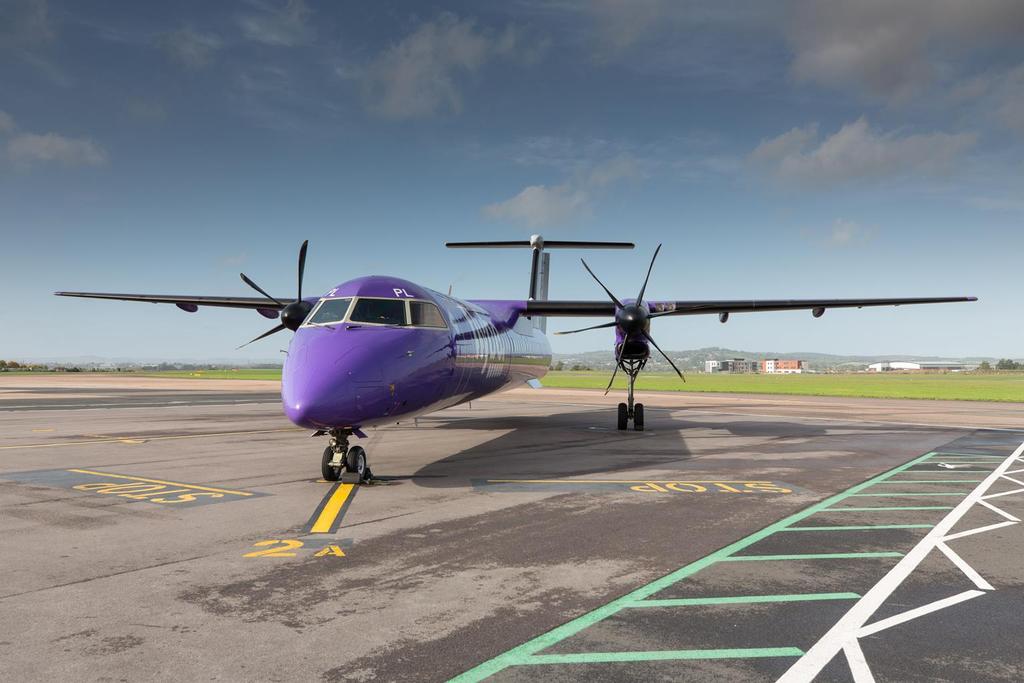
5 Mar-17 Mar-18 Mar-19 Mar-20 Target by Long-term early FY21 Fleet control - Q400 remains backbone of Flybe s fleet Reduction in fleet size allowing cancellation of unprofitable routes Q400 E175 E195 ATR72 Right-sizing the fleet driving the promised gains in RPS, load factors and yield 5

6 6 Financial review
7 2017/18 full year - financial summary SBIP commercial strategy delivering strong load factors and unit revenues Costs impacted by FX, one-offs and investments in performance improvements Further focus on costs as capacity declines Adjusted loss before tax * of 20.5m Reported loss after tax 9.4m Year end gross cash of 95m and net debt 59.1m * Excluding US loan revaluations 7
8 FY18 Group financial summary Group revenue 6.4% increase in revenue Metrics per seat Flybe UK 10.1% increase in passenger revenue 10.9% increase in operating costs including fuel * 7.9% increase in operating costs including fuel (constant currency) * Group Profit and loss 20.5m adjusted loss before tax * * 9.4m reported loss before tax 9.4m reported loss after tax Balance sheet Net assets of 93.1m, net debt 59.1m and gross cash of 95.0m * Excluding E195 onerous lease provisions and impairment of related assets * * Adjusted loss before tax is before revaluation gains or losses on USD aircraft loans 8
9 Performance in line with expectations 2017/ /17 YOY change m m m Flybe UK (16.8) (5.8) (11.0) FAS (0.3) Group costs (5.5) (4.3) (1.2) Adjusted loss before tax, USD loan revaluations and aircraft onerous leases (19.2) (6.7) (12.5) Aircraft onerous leases (1.3) (28.6) 27.3 Adjusted loss before tax and USD loan revaluations (20.5) (35.3) 14.8 Revaluation on USD loans 11.1 (13.2) 24.3 Reported loss before tax (9.4) (48.5) 39.1 Tax charge 0.0 (6.8) 6.8 Loss after tax (9.4) (55.3) 45.9 EBITDAR * loss per share (basic), pence * (4.5) (26.3) * EBITDAR and loss per share has been calculated including the E195 onerous lease provisions and impairment of related assets
10 9.1% passenger revenue growth offset by lower other revenue YOY % 2017/ /17 YOY change change m m m m Passenger revenue White Label revenue Revenue from other activities (4.1) (17.6) FAS revenue (third party) (10.8) (34.0) Revenue % 10
11 Yields and load factors up 2017/ /17 YOY % change Seats, m % Passengers, m % Load factor, % 75.6% 69.6% 6 ppt Average passenger sector length, km % Passenger yield (unit) % Sectors (000) % 2017/ /17 YOY % change per seat Passenger revenue % Other revenue, incl. white label % Total Flybe UK revenue % 11
12 m Group adjusted PBT bridge * 20.0 Includes LHR (10.0) (20.0) (30.0) (40.0) Driven by a 8.7 reduction in the YOY USD hedging 20.6 gain (7.8) (6.7) (2.2) Yield 4.3 up Fuel 1.4% price up (10.3) $92 per (6.9) tonne (14.4) (20.0) 21.0 Capacity down 0.9% and load factor up 6.0 ppts Investment drives TDR improvement (12.3) PY bonus release, IT onerous contract & adverse weather impact (19.2) (50.0) FY 2016/17 Adj. PBT FX including hedging Price Fuel hedge Volume / load factor Yield Airport Handbacks developments & other TDR investment Cost initiatives FY 2017/18 Adj. PBT before one offs One offs FY 2017/18 Adj. PBT * Excluding E195 onerous lease provisions and impairment of related assets 12
13 Flybe UK - cost per seat up 10.9%* 7.9% at constant currency* FY18 Investment in TDR and airport development (1.00) (0.55) (1.75) (0.75) (0.32) (0.38) (0.62) 0.25 (0.98) (1.48) FY 2016/17 CPS FX FY 2016/17 Inflation / Fuel price Hedge benefit Pax loads White label Line maint. Airport Handbacks development & TDR investment Fleet growth Cost initiatives FY 2017/18 CPS before one off items One offs FY 2017/18 CPS * Excluding E195 onerous lease provisions and impairment of related assets 13
14 Hedging protection into FY19 Fuel Average market price in US Dollar was up 19.1% at USD % reduction in blended price at USD499 per metric tonne USD 2.7% improvement in average market rate Blended rate decreased by 4.7% at USD1.38 Outlook Fuel: 91% of anticipated fuel requirements at USD573 per tonne for FY19 44% of anticipated fuel requirements for H1 FY20 at USD725 per tonne Currency 81% of anticipated USD requirements at USD for FY19 49% of anticipated USD requirements for H1 FY20 at USD At close of business on 14 June
15 E195 non-cash onerous lease provision E195s now treated as a separate cash generating unit following discussion with our auditors Unavoidable losses of E195s until their operating leases end Based on estimated future losses each year Reflected as prior year adjustment The 9 E195 leave over next 2 years, 3 in FY19, 5 in FY20 and the last in Q1 of FY / /17 Onerous E195 lease provision and impairment of related assets 1.3m 28.6m Year end assessment of E195 onerous lease provision Losses to FY m 24.9m
16 Year end balance sheet 95.0m gross cash (2017: 124.3m) 59.1m of net debt (2017 net debt: 64.0m), all debt asset backed 93.1m net assets (2017: 124.9m) Pension scheme already closed Triennial actuarial valuation completed; 12.2m deficit to be paid by 31 st March 2027 Deficit recovery contributions now 0.83m p.a ( 0.5m in 2016/17) IAS19 pension deficit reduced by 2.0m to 18.8m 16
17 95m of gross cash at year-end 17

18 59m of net debt at year-end 18
19 2017/18 full year - financial summary SBIP commercial strategy delivering strong load factors and unit revenues Costs impacted by FX, one-offs and investments in performance improvements Further focus on costs as capacity declines Adjusted loss before tax * of 20.5m Reported loss after tax 9.4m Year end gross cash of 95m and net debt 59.1m. * Excluding US loan revaluations 19
20 20 Performance update
21 SBIP focus for 2018/19 The SBIP pillars Sales and marketing to drive revenue growth Success factors Revenue per seat Passenger revenue per scheduled seat Cost improvement programme Cost per seat Unit cost per scheduled seat Operational excellence On time performance Departures within 15 minutes Network fleet and revenue optimisation Net promoter score Willingness of customers to recommend Flybe Organisational excellence Employee engagement Engagement rating Technology fit for Flybe e-fly New digital platform 21
22 SBIP focus The SBIP pillars Sales and marketing to drive revenue growth Success factors Revenue per seat Passenger revenue per scheduled seat Cost improvement programme Operational excellence Network fleet and revenue optimisation Organisational excellence Technology fit for Flybe 22
23 Capacity reduction driving unit revenue growth Capacity, RPS and load factor growth YoY 20% 15% 10% 5% 0% -5% -10% Q1 Q2 Q3 Q4 Q1 Q2 Q3 Q4 2016/ /18 Capacity Load factor Revenue per seat 23
24 RPS growth driven by both yield and load factor Yield Load factor ppts RPS % % / / / / / /18 24


25 Sales and marketing to drive revenue growth Brand refresh, focus on regional ties Close to you Greatly improved customer experience 25
26 SBIP focus The SBIP pillars Success factors Sales and marketing to drive revenue growth Cost improvement programme Cost per seat Unit cost per scheduled seat Operational excellence Network fleet and revenue optimisation Organisational excellence Technology fit for Flybe 26
27 Cost remains an area of focus Headwinds from sterling weakness and increasing fuel prices; strong hedging in both 2017/18 and 2018/19, but average prices will continue to rise. Focus areas include Maintenance organisation/supply chain/systems/processes.. Aircraft costs including operating lease cost reductions All supplier negotiations airports/ground handlers Cost initiatives underway for longer term savings as capacity falls 27
28 SBIP focus The SBIP pillars Success factors Sales and marketing to drive revenue growth Cost improvement programme Operational excellence On time performance Departures within 15 minutes Network fleet and revenue optimisation Organisational excellence Technology fit for Flybe 28

29 Four levers to drive operational excellence Deliver aircraft on time and ready to fly Get the first flight away on time Network schedule for successful delivery Turn the aircraft on time 29
30 TDR investment improving operational performance TDR 99.0% 99.1% 22.3% Tech. cancellations Maintenance investment improving technical performance 20.8% Restructuring of Flybe Aviation Services into Single Engineering Organisation is well underway 2016/ /18 30
31 SBIP focus The SBIP pillars Success factors Sales and marketing to drive revenue growth Cost improvement programme Operational excellence Network fleet and revenue optimisation Net promoter score Willingness of customers to recommend Flybe Organisational excellence Technology fit for Flybe 31
32 Mar-17 Mar-18 Mar-19 Mar-20 Target by Long-term early FY21 Fleet control - Q400 remains backbone of Flybe s fleet Reduction in fleet size allowing cancellation of unprofitable routes Q400 E175 E195 ATR72 32

33 Network actions driving performance 11 new Flybe operated routes launched including new LHR operation Cancelled operation on 14 unprofitable routes First year of partnership with Eastern required adjustments, relationship remains strong Ongoing network and scheduling actions to improve performance 33


34 Strategy of regional connectivity is working Franchise Airport kite partnerships Codeshare and interline White Label Selected examples: 34

35 SBIP focus The SBIP pillars Success factors Sales and marketing to drive revenue growth Cost improvement programme Operational excellence Network fleet and revenue optimisation Organisational excellence Employee engagement Engagement rating Technology fit for Flybe e-fly New digital platform to improve performance, revenue, customer insights, booking experience and customer satisfaction 35

36 Success is dependent on evolution of culture Engaged and motivated employees requirement for success Diagnostic underway, supported by company-wide engagement survey Results used to develop threeyear culture programme, requiring a sustained commitment 36
37 SBIP focus The SBIP pillars Success factors Sales and marketing to drive revenue growth Cost improvement programme Operational excellence Network fleet and revenue optimisation Organisational excellence Technology fit for Flybe e-fly New digital platform 37

38 Digital transformation underway Foundations for improvements to efficiency and customer experience Phase 1 includes replacement of core systems including airport and reservation systems Migration of the first airport to the new system completed On track for completion of core systems replacement H2 2018/19 38
39 Summary Right-sizing the fleet is driving load factors up, improving yields and revenue per seat Regional connectivity expanding through diverse portfolio of partners Sustainable Business Improvement Plan focused on five KPIs Investment in operational excellence and technology Increased focus on sustainable costs improvement 39
40 Outlook for 2018/19 Continue the fleet and capacity reduction Headwinds from fuel price and sterling volatility Continued growth in load factor and revenue per seat Organisation-wide focus on sustainable cost base Emphasis on improving operational performance Delivery of E-fly in second half of the year Strong 2018/19 H1 forward position* 8.6% planned decrease in seat capacity Yields increase by +0.3% 10.9% increase in revenue per seat 54% of seats sold compared to 49% last year * At close of business on 15 June
41 Q&A
SHAPING A SUSTAINABLE FUTURE
 SHAPING A SUSTAINABLE FUTURE Full Year Results Year ended 31 March 2017 Analyst and Investor Presentation 8 June 2017 Agenda Introduction Christine Ourmieres-Widener Financial Review Philip de Klerk Performance
Interim results. 11 May 2010
 Interim results 11 May 2010 Introduction Andy Harrison Chief Executive Officer Strong performance despite disruption Improvement in revenue, margins and cash Continued network improvement has driven better
SAS Q2 2017/2018 TELECONFERENCE
 SAS Q2 2017/2018 TELECONFERENCE 30 May 2018 Earnings as expected despite negative currency effect POSITIVES + Total revenue up MSEK 73 vs. LY + Currency adjusted yield up 0.6% vs. LY + EB-point sale revenue
Q Analyst & investor presentation. 23 January 2018
 Q1 2018 Analyst & investor presentation 23 January 2018 Strong start in 2018 Strengthening our market positions across the network Network Q1 RPS @ CC up 6.6% - positive underlying revenue trend Cost Underlying
FIRST QUARTER 2017 RESULTS. 4 May 2017
 FIRST QUARTER 2017 RESULTS 4 May 2017 A resilient start of the year, traffic up 4.2% 20.9 million passengers carried, up 5.2%, traffic (RPK) up 4.2%, capacity (ASK) up 3.3% and load factor up 0.7pts Confirmation
Q Trading update
 Q3 2018 Trading update Q3 performance Overview 1. Strong revenue trend Positive demand across Europe Benign competitor environment Strong ancillary revenue performance 2. Solid underlying cost performance
IAG results presentation. Quarter One th May 2018
 IAG results presentation Quarter One 2018 4 th May 2018 Highlights Willie Walsh, Chief Executive Officer Highlights Another strong quarter performance with an operating profit of 280m (5.6% margin, +2.3pts)
Analysts and Investors conference call. Q results. 15 May 2013
 Analysts and Investors conference call Q1 2013 results 15 May 2013 Management summary Key messages of Q1 2013 +6% +9% +3.3%p. Q1 2013 operational KPIs are in line with 109.7 116.2 6.5 7.1 82.3 85.6 expectations,
9 th November Flybe Group plc. Registered number Building a sustainable future
 9 th November Flybe Group plc Registered number 1373432 Building a sustainable future Half-yearly financial report For the six months ended 30 th September Contents Interim management report... 1 Responsibility
Air Berlin PLC 15 th June, 2016 Annual General Meeting 2016 London
 Air Berlin PLC 15 th June, 2016 Annual General Meeting 2016 London Despite headwind, airberlin made good progress in 2015 RASK +3.7% Yield +2.0% Load Factor +0.7%pt Ancillary Revenues* +9.2% ASKs -5.4%
Managing through disruption
 28 July 2016 Third quarter results for the three months ended 30 June 2016 Managing through disruption 3 months ended Like-for-like (ii) m (unless otherwise stated) Change 30 June 2016 30 June 2015 change
Q3 FY 14 IMS Analyst & Investor presentation. 3 months to 30 June 2014
 Q3 FY 14 IMS Analyst & Investor presentation 3 months to 30 June 2014 24 July 2014 1 1 Continued solid performance 1. Drive demand, conversion and yields across Europe Passenger numbers up by 9.4%; load
SAS Q3 2017/ August 2018
 SAS Q3 2017/2018 31 August 2018 Strong earnings in peak season POSITIVES Record number of passengers Total revenue up MSEK 936 vs. LY Currency adjusted yield up 1.1% vs. LY EB point sale up 27% vs. LY
Finnair Q Result
 Finnair Q1 2015 Result 7 May 2015 CEO Pekka Vauramo, Interim CFO Mika Stirkkinen 1 Turbulent market environment The weakness of the Finnish economy continued to be reflected in the demand in the first
IAG results presentation. Quarter Three st October 2014
 IAG results presentation Quarter Three 2014 31 st October 2014 Q3 financial summary OPERATING PROFIT TOTAL UNIT REVENUE PAX UNIT REVENUE 900m (reported, pre-exceptional items) -1.9% (constant FX) -0.9%
SAS Group Q Teleconference
 SAS Group Q4 2012 Teleconference December 12, 2012 1 Break-even result in 2012 despite 1.6 bn SEK higher fuel cost 23 MSEK EBT (before non-recurring items) despite 1.6 bn SEK higher fuel cost Positive
Finnair Q Result
 17 August 2016 CEO Pekka Vauramo CFO Pekka Vähähyyppä Finnair Q2 2016 Result 1 Highlights of the second quarter The seventh consecutive quarter of profit improvement Fukuoka & Guangzhou route openings
1 st Quarter Results FY
 1 st Quarter Results FY 2004-05 05 Q1 Highlights p Context 8Improving economic context 8Strong economic growth in Americas and Asia 8Modest economic recovery in Europe 8Soaring fuel prices 8IPE Brent up
Air Berlin PLC Frankfurt, 29 August 2012 DVFA Small Cap Conference
 Air Berlin PLC Frankfurt, 29 August 2012 DVFA Small Cap Conference 2012 is the transition year business transformation airberlin on its journey to sharpen its profile in the scheduled business Shape &
Air Berlin PLC AGM 06 June 2013 London
 Air Berlin PLC AGM 06 June 2013 London airberlin a strong European carrier Market position as of 31 December 2012 No. 2 in core market: Germany / Austria / Switzerland No. 7 in Europe with 33.3 m guests
SAS Q1 2016/
 SAS Q1 2016/2017 08.03.2017 Weak Q1 as expected new structural actions underway Q1 in summary Positives + Currency adjusted passenger revenue up 5% + Strong development of ancillary revenues + Passengers
Finnair Q Result
 Finnair Q2 2015 Result 14 August 2015 CEO Pekka Vauramo, Interim CFO Mika Stirkkinen 1 Market environment shows signs of improvement There were signs of a recovery in the demand for consumer and business
AEROFLOT ANNOUNCES FY 2017 IFRS FINANCIAL RESULTS
 AEROFLOT ANNOUNCES FY 2017 IFRS FINANCIAL RESULTS Moscow, 1 March 2018 Aeroflot Group ( the Group, Moscow Exchange ticker: AFLT) today publishes its audited financial statements in accordance with International
H1 2017/18 (restated) m (395.2) (409.8) 14.6 (3.6)
 m (395.2) (409.8) 14.6 (3.6)") /19 HALF YEAR RESULTS Released : 14/11/ 07:00 RNS Number : 2614H Flybe Group PLC 14 November Flybe Group plc Interim management report 14 th November Adjusted profit up despite fuel and currency headwinds
/19 HALF YEAR RESULTS Released : 14/11/ 07:00 RNS Number : 2614H Flybe Group PLC 14 November Flybe Group plc Interim management report 14 th November Adjusted profit up despite fuel and currency headwinds
SAS Q1 2017/2018. Q1 in Summary: Improved earnings CHANGE VS. Q1 FY17
 SAS 2017/2018 27.02.2018 in Summary: Improved earnings POSITIVES + Passenger revenue up 1% (FX adj.) + Cargo and EB-point sale revenue increased MSEK 109 + Efficiency program delivered MSEK 165 + Positive
Q Analyst & investor presentation. 22 January 2019
 Q1 2019 Analyst & investor presentation 22 January 2019 Q1 performance Overview 1. Positive underlying revenue trend Robust demand across Europe Strong ancillary revenue performance Moderate competitor
Q1 FY 13 IMS Analyst & Investor presentation. 3 months to 31 December 2012
 Q1 FY 13 IMS Analyst & Investor presentation 3 months to 31 December 2012 24 th January 2013 1 1 Progress against strategic objectives 1. Drive demand, conversion and yields across Europe Passenger numbers
Overview. > Normalised earnings* before taxation of, up 30% > Statutory earnings before taxation of, up 40% > Statutory net profit after taxation of
 1 Overview > Normalised earnings* before taxation of, up 30% > Statutory earnings before taxation of, up 40% > Statutory net profit after taxation of > Operating revenue of > Strong operating cash flow
EASYJET INTERIM MANAGEMENT STATEMENT FOR THE QUARTER ENDED 31 DECEMBER 2010
 20 January 2011 easyjet Interim Management Statement Page 1 of 5 20 January 2011 EASYJET INTERIM MANAGEMENT STATEMENT FOR THE QUARTER ENDED 31 DECEMBER 2010 Highlights: Total revenue up by 7.5% to 654
AIR NEW ZEALAND ANNUAL RESULTS ANNUAL RESULTS
 AIR NEW ZEALAND ANNUAL RESULTS 2008 1 HIGHLIGHTS Record operating revenue, up 9% Normalised earnings* $197m Net cash position of $1.3bn Launched direct service to Vancouver and Beijing Award winning product
Q Finnair s growth continued Pekka Vähähyyppä
 2018 Finnair s growth continued 25.10.2018 Pekka Vähähyyppä 1 We continued to develop our services and network New route to Los Angeles in 2019, two daily flights to Hong Kong New digital service for exploring
Aer Lingus Group plc. Interim Management Statement
 Aer Lingus Group plc ISE: EIL1 LSE: AERL Interim Management Statement Dublin and London, 5 th November 2010: Aer Lingus Group plc ( Aer Lingus or the Group ) today issues an un-audited interim management
Vueling Airlines 2010 Full-Year and Q4 Financial Results
 Vueling Airlines 2010 Full-Year and Q4 Financial Results Executive summary Executive Summary Vueling achieved a net profit of 46m in 2010, a 66% increase vs. 2009. In Q4, the net loss has been reduced
SAS AB Q December 2018
 SAS AB Q4 2018 4 December 2018 Q4 financial highlights Q4 POSITIVES Q4-18 CHANGE VS. Q4-17 Record number of passengers Total revenue up SEK 1bn vs. LY Yield (nominal) up 5.1% vs. LY RASK (nominal) up 7.0%
Agenda. Conclusion of Transform Key Perform 2020 initiatives. Perform 2020 financial framework. Information meeting
 Information meeting Agenda Conclusion of Transform 2015 Key Perform 2020 initiatives Perform 2020 financial framework 2 Transform 2015: first phase of group turnaround accomplished Strict capacity discipline
EASYJET INTERIM MANAGEMENT STATEMENT FOR THE QUARTER ENDED 30 JUNE 2013
 24 July 2013 easyjet Interim Management Statement Page 1 of 6 EASYJET INTERIM MANAGEMENT STATEMENT FOR THE QUARTER ENDED 30 JUNE 2013 A. HIGHLIGHTS: Total revenue for the third quarter grew by 10.5% to
2012 Result. Mika Vehviläinen CEO
 2012 Result Mika Vehviläinen CEO 1 Agenda Market environment in Q4 Business performance and strategy execution Outlook Financials 2 Market Environment According to IATA, Global air travel continues to
SAS takes forceful action in a challenging market
 SAS Q2 2013/14 1 1 SAS takes forceful action in a challenging market Q2 EBT MSEK -1,078 Disappointing result in a challenging market most European carriers struggle During the last year, capacity has outgrown
Full Year 2009 Results
 Full Year 2009 Results 1 Antonio Vázquez Chairman & Chief Executive Officer 2 Highlights 2009 Strong decrease in revenues: weak demand and yield deterioration. High competition and drop of business traffic.
EASYJET INTERIM MANAGEMENT STATEMENT FOR THE QUARTER ENDED 30 JUNE 2011
 22 July 2011 easyjet Interim Management Statement Page 1 of 5 22 July 2011 EASYJET INTERIM MANAGEMENT STATEMENT FOR THE QUARTER ENDED 30 JUNE 2011 Highlights (figures below are for the quarter ended 30
Corporate Presentation National Bank Transportation and Logistics Conference March 24, 2010
 Corporate Presentation National Bank Transportation and Logistics Conference March 24, 2010 Forwardlooking statement Certain information in this presentation and statements made during this presentation,
Quarter Interim Management Statement. 28 July 2010
 Quarter 3 2010 Interim Management Statement 28 July 2010 Week 4 priorities and initial impressions Priorities: Engage with staff, shareholders, customers and key suppliers Mitigation plan for recent operational
q Analyst & investor presentation Thursday 20 th July 2017
 q3 2017 Analyst & investor presentation Thursday 20 th July 2017 easyjet Europe Following a rigorous and comprehensive year-long process Austria was chosen as the country for easyjet Europe Austro Control
Q Fast growth continued, Comparable operating result at record high levels Pekka Vauramo
 2018 Fast growth continued, Comparable operating result at record high levels 17.7.2018 Pekka Vauramo 2 A good - Comparable operating result increased to new seasonal high Revenue Comparable operating
AIRBUS H Roadshow Presentation. New York July 31 st, 2017
 AIRBUS H1 2017 Roadshow Presentation New York July 31 st, 2017 H1 2017 HIGHLIGHTS 2 Healthy commercial aircraft environment; robust backlog of 6,771 a/c supports ramp-up plans H1 financials reflect delivery
Full Year Results. 17 November 2009
 Full Year Results 17 November 2009 1 Introduction Andy Harrison Chief Executive Officer 2 Europe s best performing airline Results in line with expectations Reduction in pre tax profit driven by: Increase
Corporate presentation CIBC Whistler Institutional Investor Conference January 21, 2010
 Corporate presentation CIBC Whistler Institutional Investor Conference January 21, 2010 Forwardlooking statement Certain information in this presentation and statements made during this presentation, including
SkyWest, Inc. Announces First Quarter 2018 Profit
 NEWS RELEASE CONTACT: Investor Relations Corporate Communications 435.634.3200 435.634.3553 Investor.relations@skywest.com corporate.communications@skywest.com SkyWest, Inc. Announces First Quarter 2018
FIRST HALF 2016 RESULTS. 27 July 2016
 FIRST HALF 2016 RESULTS 27 July 2016 Highlights of the Second Quarter 2016 Environment Operations Financial highlights High level of geopolitical uncertainties, including Brexit Terrorist attacks in Europe
EASYJET TRADING STATEMENT FOR THE QUARTER ENDED 30 JUNE 2016
 EASYJET TRADING STATEMENT FOR THE QUARTER ENDED 30 JUNE 2016 Third Quarter Performance in line; looking forward into a difficult and uncertain economic and operating environment; management actions in
FIRST QUARTER OPERATING PROFIT RISES TO $281 MILLION
 27 July 2017 Page 1 of 5 No. 03/17 27 July 2017 FIRST QUARTER OPERATING PROFIT RISES TO $281 MILLION Revenue improvement seen for all SIA Group airlines, but pressure on yields remains Earnings supported
Q3 Results 2015/ August 2016 Media Call. Tulum, Mexico
 Q3 Results 2015/16 11 August 2016 Media Call Tulum, Mexico TUI Group Vertically integrated model demonstrates resilience Good performance in the quarter further demonstrating the resilience of our vertically
THE GO-AHEAD GROUP PLC HALF YEAR RESULTS FOR THE SIX MONTHS ENDED 29 DECEMBER 2018
 THE GO-AHEAD GROUP PLC HALF YEAR RESULTS FOR THE SIX MONTHS ENDED 29 DECEMBER 2018 BUSINESS OVERVIEW Continued good progress made in all three strategic pillars: protect and grow the core; win new bus
Q3 FY 15 Analyst & Investor presentation. 3 months to 30 June 2015
 Q3 FY 15 Analyst & Investor presentation 3 months to 30 June 2015 22 July 2015 1 1 Q3 performance key messages 1. Good commercial performance Good performance from UK and beach routes across Europe Revenue
Financial overview. Adjusted operating cash flow* Annual dividend (excluding special dividend) Dollar movement. Percentage
 Dollar movement. Percentage") 1 Financial overview June 2007 June 2006 Dollar movement Percentage movement Operating revenue $4,297m $3,805m $492m 13% PBUT $268m $150m $118m 79% NPAT $214m $96m $118m 123% Adjusted operating cash flow*
1 Financial overview June 2007 June 2006 Dollar movement Percentage movement Operating revenue $4,297m $3,805m $492m 13% PBUT $268m $150m $118m 79% NPAT $214m $96m $118m 123% Adjusted operating cash flow*
First Half 2013 Results. 16 mai 2013
 First Half 2013 Results 16 mai 2013 26 July 2013 Results Increasing effects of Transform 2015 Highlights of the First Half A difficult global economic environment Transform 2015 plan roll-out on track
Finnair Group Interim Report 1 January 30 June 2008
 Finnair Group Interim Report 1 January 30 June 2008 1 08/08/2008 Presentation name / Author Airline industry at a historical turning point Fuel price has a stranglehold on the business Average ticket prices
GIAA In Flash YTD September 2015
 GIAA In Flash YTD September 2015 Garuda Indonesia Group (GIAA) Continues its Green Performance in Challenging Market Picture s source: www.google.com The 3rd quater in 2015 is a tough period for GIAA bussines.
Media Release. Qantas Group Full Year 2017 Financial Result 1. Sydney, 25 August 2017
 Media Release Qantas Group Full Year 2017 Financial Result 1 Sydney, 25 August 2017 Underlying Profit Before Tax: $1,401 million (second highest in Qantas history) Statutory Profit Before Tax: $1,181 million
AIR FRANCE-KLM RESULTS PRESENTATION
 AIR FRANCE-KLM RESULTS PRESENTATION Results as at 30 th of June 2018 1 st August 2018 SECOND QUARTER 2018: KEY HIGHLIGHTS Leveraging ongoing solid demand +0.8% +1.7% Stable operating result before strike
Heathrow (SP) Limited
 Limited") Draft v2.0 10 Feb Heathrow (SP) Limited Results for year ended 31 December 2013 24 February 2014 Strong operational and financial performance in 2013 Passenger satisfaction at record high and over 72 million
Draft v2.0 10 Feb Heathrow (SP) Limited Results for year ended 31 December 2013 24 February 2014 Strong operational and financial performance in 2013 Passenger satisfaction at record high and over 72 million
Third Quarter 2014 Results. 29 October 2014
 Third Quarter 2014 Results 29 October 2014 Highlights of the Third Quarter Operating environment Air France-KLM Economic environment remains weak Further currency volatility affecting revenues and results
INVESTOR PRESENTATION. Imperial Capital Global Opportunities Conference September 2015
 INVESTOR PRESENTATION Imperial Capital Global Opportunities Conference September 2015 Forward-looking Statements This presentation contains forward-looking statements within the meaning of the Private
Nomura Transport conference Carolyn McCall Chief Executive
 Nomura Transport conference Carolyn McCall Chief Executive 1 06-Dec 09-Dec 12-Dec 15-Dec 18-Dec 21-Dec 24-Dec 27-Dec 30-Dec 02-Jan 05-Jan 08-Jan 11-Jan 14-Jan Challenging environment Jet price up 46% in
Ramsay Health Care Limited Results Briefing Year ended 30 June 2018
 Ramsay Health Care Limited Results Briefing Year ended 30 June 2018 Craig McNally, Managing Director & Bruce Soden, Group Finance Director 30 August 2018 ramsayhealth.com Agenda Group Performance Overview
FY RESULTS ROADSHOW PRESENTATION
 1 FY RESULTS 2014 ROADSHOW PRESENTATION FY 2014 HIGHLIGHTS FOCUS ON EXECUTION 2 Strong financial performance Revenues: 61 bn, +5% vs. 2013 EBIT* before one off: 4.1 bn, +15% vs. 2013 EPS: 2.99, +61% vs.
QANTAS ANNOUNCES PROFIT RESULT HALF-YEAR ENDED 31 DECEMBER 2009
 QANTAS ANNOUNCES PROFIT RESULT HALF-YEAR ENDED 31 DECEMBER 2009 HIGHLIGHTS TWO BRAND STRATEGY DELIVERS RESILIENCE AND CONTAINS COSTS Statutory Net Profit Before Tax of $90 million Underlying Profit Before
THIRD QUARTER 2016 RESULTS. 3 November 2016
 THIRD QUARTER 2016 RESULTS 3 November 2016 Highlights of the Third Quarter 2016 Environment Operations Financial highlights Strong increase in airline industry capacity Terrorist attacks in Europe resulting
THIRD QUARTER 2017 RESULTS 3 rd of November 2017
 THIRD QUARTER 2017 RESULTS 3 rd of November 2017 2017 THIRD QUARTER 2017: STRONG OPERATING RESULT DRIVEN BY SOLID TRAFFIC AND INCREASE IN UNIT REVENUE Robust Group traffic statistics +5.1% +4.1% Strong
INVESTOR PRESENTATION. May 2015
 INVESTOR PRESENTATION May 2015 Forward-looking Statements This presentation contains forward-looking statements within the meaning of the Private Securities Litigation Reform Act of 1995 that reflect the
Finnair Group Interim Report 1 January 30 September 2008
 Finnair Group Interim Report 1 January 30 September 2008 1 31/10/2008 Presentation name / Author Airline industry at a historical turning point Expensive fuel price in the beginning of 2008 has dramatical
CONTACT: Investor Relations Corporate Communications
 NEWS RELEASE CONTACT: Investor Relations Corporate Communications 435.634.3200 435.634.3553 Investor.relations@skywest.com corporate.communications@skywest.com SkyWest, Inc. Announces Fourth Quarter 2017
Annual Results Air New Zealand
 Annual Results 2011 Air New Zealand Highlights Normalised earnings* $75m Net cash position of $860m Operating cash flow down 5% Gearingat467% at 46.7% Final dividend 2.5 cents per share (unimputed) New
AIR ARABIA PJSC Q4 AND FULL YEAR COMMENTARY 2017
 AIR ARABIA PJSC Q4 AND FULL YEAR COMMENTARY 2017 Financial highlights Full year 2017 Passengers carried reached 8.53million at a seat factor of 79%. Turnover reached AED 3.74 billion. Yield margin fell
QANTAS HALF YEAR 2015 FINANCIAL RESULTS 1
 QANTAS HALF YEAR 2015 FINANCIAL RESULTS 1 Key points: Underlying Profit Before Tax: $367 million Statutory Profit After Tax: $206 million Transformation benefits: $374 million Comparable unit cost reduction:
Half Year Results Analyst and Investor Presentation. Tuesday 13 May 2014
 Half Year Results Analyst and Investor Presentation Tuesday 13 May 2014 Introduction Carolyn McCall Chief Executive Officer PBT / seat Strategy is delivering Revenue performance in line with expectations
SAS Group Presentation Carnegie, May 22, 2012 Sture Stölen, Head of IR
 SAS Group Presentation Carnegie, May 22, 2012 Sture Stölen, Head of IR 1 This is the SAS Group 128 destinations 27,2 million passengers 28 new routes to be launched 2012 1,085 daily flights Revenues 2011,
Jet Airways (India) Ltd. Presentation on Annual Results FY06. May 2006
 Ltd. Presentation on Annual Results FY06. May 2006") Jet Airways (India) Ltd. Presentation on Annual Results FY06 May 2006 1 Agenda 1. Performance Highlights 2. Sahara Acquisition Update 3. Outlook 2 Performance Highlights 3 Domestic landscape capacity growth
Jet Airways (India) Ltd. Presentation on Annual Results FY06 May 2006 1 Agenda 1. Performance Highlights 2. Sahara Acquisition Update 3. Outlook 2 Performance Highlights 3 Domestic landscape capacity growth
2010 ANNUAL GENERAL MEETING. May 4, 2010
 2010 ANNUAL GENERAL MEETING May 4, 2010 FORWARD-LOOKING STATEMENT Certain information in this presentation and statements made during this presentation, including any question and answer session, may contain
EASYJET TRADING STATEMENT FOR THE QUARTER ENDED 31 DECEMBER easyjet delivers a good start to the year, in line with expectations
 EASYJET TRADING STATEMENT FOR THE QUARTER ENDED 31 DECEMBER 2018 easyjet delivers a good start to the year, in line with expectations Summary easyjet has delivered a good performance in the quarter with
Aer Lingus Group plc Q2 & H1 Results July 2014
 Aer Lingus Group plc Q2 & H1 Results 2015 29 July 2014 Disclaimer: Forward looking information NOT FOR RELEASE, PUBLICATION OR DISTRIBUTION, DIRECTLY OR INDIRECTLY (IN WHOLE OR IN PART) IN, INTO OR FROM
Quarter 3 Interim management Statement
 Quarter 3 Interim management Statement 3 months to 30 th June 2012 25 th July 2012 1 1 Strong Q3 performance - in a difficult market Revenue growth in line with expectations Constant currency RPS growth
Interim Management Report First Half Results 2010/11. October 29, 2010
 Interim Management Report First Half Results 2010/11 October 29, 2010 Disclaimer Certain information included in these statements is forward-looking and involves risks and uncertainties that could cause
Company background. August 2013
 Company background August 2013 1 Europe's leading short haul air travel network 58.4m passengers, 65.9 m seats flown; load factors 88.7% fleet of 214 aircraft with an average fleet age of 4.4 years leading
Ramsay Health Care Limited Results Briefing Half Year ended 31 December 2018
 Ramsay Health Care Limited Results Briefing Half Year ended 31 December 2018 Craig McNally, Group Managing Director & Bruce Soden, Group Finance Director 28 February 2019 ramsayhealth.com Agenda Group
Strengthened SAS delivers positive result in Q3
 SAS Group Q3 2012/13 1 Strengthened SAS delivers positive result in Q3 Passenger revenues up 5.3% (FX adjusted) 32 new routes introduced Capacity up 7.7% Traffic up 5.6% Yield down 0.6% Restructuring status
Flybe: Delivery and Future Direction
 Flybe Delivery and Future Direction Making Flybe Fit to Compete Update 23 May 2013 Agenda Context and Introduction Flybe UK - Making Flybe Fit to Compete Flybe Outsourcing Solutions Recap Conclusions and
CONTACT: Investor Relations Corporate Communications
 NEWS RELEASE CONTACT: Investor Relations Corporate Communications 435.634.3200 435.634.3553 Investor.relations@skywest.com corporate.communications@skywest.com SkyWest, Inc. Announces Second Quarter 2017
Full Year 2017 RESULTS 16 th of February 2018
 Full Year 2017 RESULTS 16 th of February 2018 2017 FULL YEAR 2017 MAIN ACHIEVEMENTS Robust traffic statistics Strong Full Year results +5.6% +2.0% 42% +101% 1,049 1,488 347 696 FY 2016 FY 2017 Passengers
SAS Group Q2 2012/13. Q2 Restructuring programme moving KPIs in the right direction
 SAS Group Q2 2012/13 1 Q2 Restructuring programme moving KPIs in the right direction Operating revenues +1.6%* Yield improvement of +2.7%* Forceful implementation of 4XNG plan: Unit cost down by 10.7%
SAS Q3 2016/
 SAS Q3 2016/2017 05.09.2017 A strong summer performance drives result improvements Q3 IN SUMMARY Positives + Currency adjusted passenger revenue up 6.4% + Passengers up by ~300,000 + Ancillary and cargo
Cebu Air, Inc. Annual Stockholders Briefing. 24 June cebupacificair.com
 Cebu Air, Inc. Annual Stockholders Briefing 24 June 2015 cebupacificair.com Business Updates Passengers (M) Operating Statistics 2014: Passenger traffic grew 17.5% to 16.9M. Seat capacity grew 14.8% to
Third Quarter Results
 1 Third Quarter 2010-11 Results Highlights of the Third Quarter Passenger business affected by significant disruptions Dynamic cargo activity Strong improvement in results Decline in ex-fuel unit costs
Montie Brewer, President and CEO Joshua Koshy, Executive VP and CFO UBS Transport Conference
 Montie Brewer, President and CEO Joshua Koshy, Executive VP and CFO UBS Transport Conference 1 London, England September 17, 2007 Agenda Strongly positioned international airline Investment proposition
Jet Airways (India) Ltd. Presentation on Financial Results Q3 FY th January 2008
 Ltd. Presentation on Financial Results Q3 FY th January 2008") Jet Airways (India) Ltd. Presentation on Financial Results Q3 FY08 28 th January 2008 1 1 1 Agenda Performance highlights Q3 FY08 Apr - Dec FY08 Outlook JetLite performance highlights 2 2 2 Performance
Jet Airways (India) Ltd. Presentation on Financial Results Q3 FY08 28 th January 2008 1 1 1 Agenda Performance highlights Q3 FY08 Apr - Dec FY08 Outlook JetLite performance highlights 2 2 2 Performance
Norwegian Air Shuttle ASA
 Norwegian Air Shuttle ASA Q1 2018 Presentation 26 April 2018 Highlights Q1 2018 Successfully completed private placement of NOK 1.3 billion Added two 737-800s and six 787-9s to operations Launched interline
FY key data Passenger. Cargo. Maintenance. Other. Operating result in m. Revenues in bn -10.4% 78% 11%
 Information meeting FY 2009-10 key data Revenues in bn Operating result in m 78% Passenger 16.3-13.6% -918 11% Cargo 2.4-27.8% -436 5% Maintenance 1.0-4.0% +81 6% Other 1.3-12 -10.4% 2 Our industry is
THIRD QUARTER OPERATING PROFIT UP 13% TO $330 MILLION
 13 February 2018 Page 1 of 7 ` No. 01/18 13 February 2018 THIRD QUARTER OPERATING PROFIT UP 13% TO $330 MILLION Higher carriage and load factors for all passenger airlines Strong earnings for SIA Cargo
Air China Limited 2014 Annual Results Under IFRS
 Air China Limited 2014 Annual Results Under IFRS March 2015 Agenda Part 1 Results Highlights Part 2 Business Overview Part 3 Financial Overview Part 4 Outlook Part 1 Results Highlights Gradual Global Economic
Fourth Quarter 2006 Results Presentation February 15, 2007
 Fourth Quarter 2006 Results Presentation February 15, 2007 This presentation may include forward-looking comments regarding the Company s business outlook and anticipated financial and operating results.