AIRBUS. H Roadshow Presentation. July 2018
|
|
|
- Dinah Burke
- 5 years ago
- Views:
Transcription
1 AIRBUS H Roadshow Presentation July 2018
2 H1 18 HIGHLIGHTS 2 Robust commercial aircraft environment Backlog of ~7,200 a/c underpins ramp-up plans H1 financials reflect mainly A350 performance and delivery phasing Focus on securing ramp-up 2018 Guidance maintained
 9% 2% 11% 78% 9% 16% 67 bn")


3 AIRBUS AT A GLANCE AS OF FY 2017 AS REPORTED 3 Airbus External Revenue by Division Airbus Passenger Aircraft, Freighter Conversion, Services Deliveries by Programme (units) 9% 2% 11% 78% 9% 16% 67 bn 75% Helicopters Civil/Parapublic and Military Helicopters for a wide range of missions, Support and Services A320 A350 t/o defence 9.9 bn 44% 56% A330 A380 External Revenue Split Platforms Services Commercial Aircraft Helicopters Defence and Space Defence and Space Military Aircraft, Space Systems, Comms, Intelligence and Security, Unmanned Aerial Systems External Revenue Split 70% 30% Platforms Services


4 H Roadshow Presentation Market Demand Product Portfolio H Review
5 AIR TRAFFIC AND LONG TERM FUNDAMENTALS REMAIN STRONG 5 3.0% GDP growth 81.4% Record Load factor 7.6% RPK growth +300 million passengers 8 th year of impressive airline profitability Source: ICAO, IATA, WTO, IHS Economics, Airbus GMF 2018
6 WORLD FLEET WILL MORE THAN DOUBLE OVER THE NEXT 20 YEARS 6 ~70% XL (4%) L (5%) M (15%) Growth S (76%) ~30% ~21k Replace Fleet in service 2018 ~50% Stay 2037 Notes: Passenger aircraft ( 100 seats) Jet freight aircraft (>10 tons), Rounded figures to the nearest 10 Assuming same rules as today Source: Airbus GMF 2018 Box sizes for illustrative purposes only ~37k Total New Deliveries
7 LONG-TERM GROWTH FUELLED BY MIDDLE-CLASS EXPANSION IN EMERGING ECONOMIES Trips per capital - Bubble size proportional to population Advanced Developing Emerging real GDP per capita* Source: Sabre, IHS Economics, Airbus GMF 2018 Equivalent amount of passengers flying from/to/within the country * 2010 $US at Purchasing Power Parity


8 H Roadshow Presentation Market Demand Product Portfolio H Review
9 INVESTMENTS TO PREPARE THE FUTURE AND CAPTURE GROWTH bn R&D 17 bn CapEx 5 bn Working Capital (1) ~ 40 bn Comprehensive product family and ramp-up capability (1) Mainly investment in inventory partly offset by PDPs


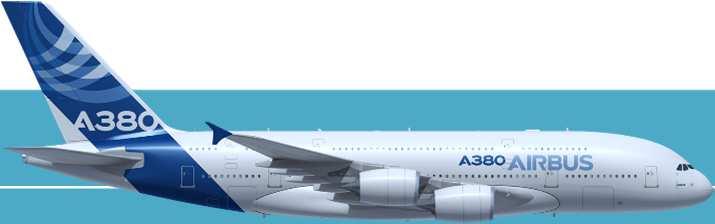
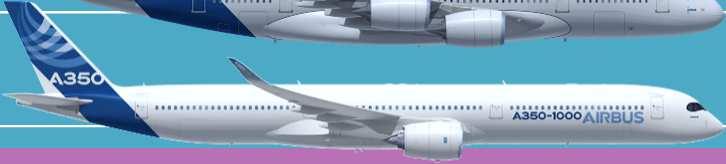
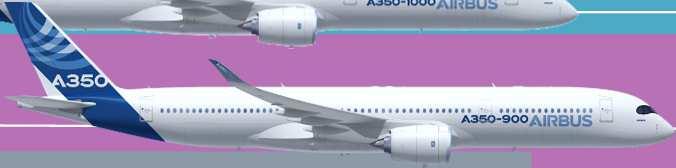
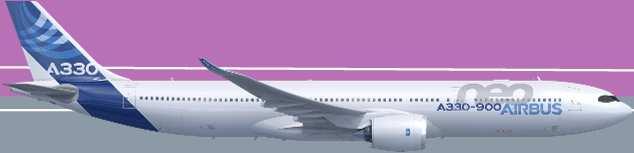
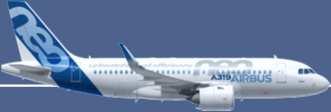
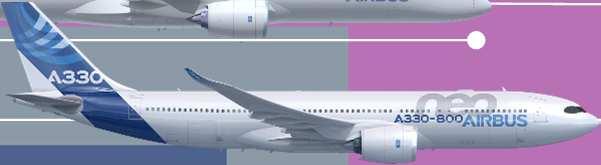
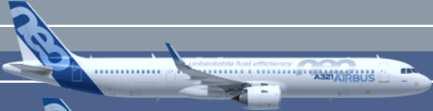
10 THE MOST COMPREHENSIVE COMMERCIAL AIRCRAFT FAMILY 10 Capacity XL L M S Range Product position is illustrative
11 WELL POSITIONED ACROSS ALL MARKET SEGMENTS 11 S M L XL Airbus Backlog share 54% 88% 52% 35% % Source: Flight Global Ascend, Airbus Passenger a/c backlog as of end 2017 Includes all manufacturers
12 ROBUST COMMERCIAL AIRCRAFT ENVIRONMENT 12 Backlog O&D 8,000 1,600 7,000 1,400 6,000 1,200 5,000 1,000 4, ,000 2,000 1, Book-to-bill Cancellations* 0.3% 2.6% 1.3% 3.4% 3.3% 1.1% 2.0% 4.3% 1.7% 1.5% 3.8% 0.9% 2.1% 1.7% Backlog Deliveries Net orders Average net order Growing backlog while ramping-up deliveries to meet customer demand
13 HELICOPTERS: MARKET AND PRODUCT POSITIONING 13 CIVIL & PARAPUBLIC MILITARY AIRCRAFT MARKET Demand impacted by softness in O&G LT market potential: ~ 22k new h/c in next 20 years UAM new market Military market supported by growing Defence budgets Successful campaigns in 2016 PRODUCT Product renewal strategy: H135, H145, H160, H175 Wide mission coverage Unique product offering addressing wide range of missions and classes Military offers based on proven Civil technology Renewed product portfolio and global market presence
14 DEFENCE AND SPACE: MARKET AND PRODUCT POSITIONING 14 MILITARY AIRCRAFT SPACE SYSTEMS CIS / UAS / OTHERS MARKET Geopolitical instability Growth in defence spending Increasing need for security Growth in space spending More connected world Increasing need for services Big data / analytics / digital Cyber protection Increasing need for autonomy and reactivity PRODUCT Multi-mission military aircraft Integrated combat systems Services around platforms Telecom satellites, ENS OneWeb (small satellites) Space services (SpaceTug - Space Utility Vehicle) Cyber Protection (Stormshield, 3 Cyber Defence Centres) Digital services and secured connectivity (HAPS) Unmanned Aerial Systems (Airbus Aerial, European MALE) Successful repositioning through portfolio reshaping


15 LEVERAGING DIGITAL IN ALL AREAS OF OUR BUSINESS 15 Skywise Data exploitation Connectivity Driving further industrial efficiency Improving reliability of assets in use for customer benefit Generating new business opportunities


16 H Roadshow Presentation Market Demand Product Portfolio H Review

17 KEY PRIORITIES 17 Deliver ~800 a/c in 2018, prepare further ramp-up potential Leverage competitive product portfolio to strengthen market position Boost efficiency and competitiveness through digital and innovation Deliver EPS and FCF growth potential Earnings and FCF taking off!


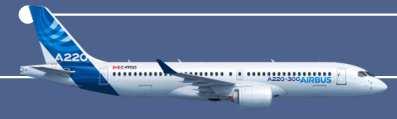
18 KEY PROGRAMME UPDATE 18 A orders since closing July 1 st A220 to be consolidated from Q3 18 A320 A320 ramp-up to rate 60 by mid-2019 ongoing Neo engine deliveries resumed in Q2. H2 recovery plan in place. Challenges remain Feasibility study to R70+ ongoing A330 A330neo EIS expected by end of summer 42 A330neo commitments in Farnborough A350 Operational reliability >99% Good progress on Recurring Cost curve. Ramp-up to rate 10 by end Breakeven expected before end of the decade A380 Industrial baseline secured at 6 deliveries p.a. from 2020 Campaigns ongoing New 2 nd hand market A400M Customer discussions ongoing to finalize contract amendment by year-end
19 H FINANCIAL PERFORMANCE 19 Revenues in bn EBIT Adjusted in bn / RoS (%) 4.7% % H H H H EPS (1) Adjusted in FCF before M&A and Customer Financing in bn H H H H (2.1) (4.0) (1) H Average number of shares: 774,129,413 compared to 773,223,614 in H Capitalised R&D: 40 m in H and 149 m in H figures are amended with IFRS15 restatements
20 H PROFITABILITY EBIT Performance in bn EBIT Adjusted H H EBIT Reported H EBIT Reported of 1.1 bn H Adjustments resulting from: - 98 m A400M provision - 21 m First H160s - 40 m PDP mismatch / BS revaluation - 40 m Compliance / Others m Airbus DS perimeter change - 42 m Net Adjustments EPS Performance in H Net Income of 496 m H Net Income Adjusted of 740 m H tax rate on core business is 28% EPS Adjusted EPS Reported H H Average number of shares: H = 774,129,413 ; H = 773,223, figures are amended with IFRS15 restatements
21 CURRENCY HEDGE POLICY 21 IN $ BILLION Forward Sales as of June 2018 Collars as of June 2018 Forward Sales and Collars as of Dec Average hedge rates 2018 remaining 6 months 1.20 vs $ Forwards/Collars (2) ( 1.25 in Dec. 17 ) ( 1.24 in Dec. 17 ) ( 1.22 in Dec. 17 ) ( 1.23 in Dec. 17 ) 2022 and beyond 1.26 ( 1.24 in Dec. 17) vs $ In H1 2018, $ 4.5 bn (1) of new Forwards were added at an average rate of 1 = $ 1.29 $ 12.7 bn (1) of hedges matured at an average rate of 1 = $ 1.29 Hedge portfolio (1) 30 June 2018 at $ 80.3 bn (vs. $ 88.7 bn in Dec. 2017), at an average rate of $ 1.23 (2) In H1, $ 3.0 bn of hedges rolled-over intra-year in 2018 to align with backloaded delivery profile. No change to FY hedge rate Approximately 60% of Airbus US$ revenues are naturally hedged by US$ procurement. Graph shows US$ Forward Sales and Collars (1) Total hedge amount contains $/ and $/ designated hedges; (2) Blended Forwards and Collars rate includes Collars at least favourable rate Mark-to-market value incl. in AOCI = 0.2 bn Closing 1.17 vs. $
22 H CASH EVOLUTION 22 IN BILLION Free Cash Flow before M&A : bn t/o Customer Financing: bn Free Cash Flow before M&A and Customer Financing bn 8.1 Net Cash position Dec Gross Cash Flow from Operations Change in Working Capital Cash used for investing activities before M&A (1) M&A Shareholder Returns ReturnS Pensions & Others Net Cash position Jun.2018 Early debt repayments of 1.6 bn, no impact to net cash (1) Thereof Capex of bn; (2) M&A transactions include acquisitions and disposals of subsidiaries and businesses
23 2018 GUIDANCE 23 As the basis for its 2018 guidance, Airbus expects the world economy and air traffic to grow in line with prevailing independent forecasts, which assume no major disruptions Airbus 2018 Earnings and guidance are prepared under IFRS 15 Airbus 2018 Earnings and FCF guidance is before M&A. It now includes the A220* integration Airbus targets to deliver around 800 commercial aircraft, without the A220 family On top, around 18 A220 deliveries are targeted for H2 Before M&A, Airbus expects EBIT Adjusted of approximately 5.2 bn in 2018: A220* integration is expected to reduce EBIT Adjusted by an estimated -0.2 bn Therefore, including A220*, Airbus expects EBIT Adjusted to be approximately 5.0 bn Compared to 2017 Free Cash Flow before M&A and Customer Financing of 2.95 bn, Airbus expects Free Cash Flow to be at a similar level in 2018 before A220 integration A220* integration is expected to reduce Free Cash Flow before M&A and Customer Financing by an estimated -0.3 bn In 2018, Airbus expects the net cash impact of the A220 integration to be largely covered by the funding arrangement as laid out in the terms of the C-Series A/C Ltd. Partnership, meaning limited cash dilution * Based on preliminary data
24 H FINANCIAL PERFORMANCE 24 Revenues in bn EBIT Adjusted in bn 5.2 A220 ~ -0.2 bn* a/c 718 a/c 303 a/c ~ 800 a/c 1.2 FY 2016 FY 2017 H Guidance FY 2016 FY 2017 H Guidance FCF before M&A and Customer Financing in bn Similar level A220 ~ -0.3 bn* FY 2016 FY 2017 H Guidance -4.0 * Based on Preliminary data 2017 figures are amended with IFRS15 restatements
25 COMMITMENT TO CASH GENERATION & SHAREHOLDER RETURNS bn Investment 12 bn FCF generation (1) 9 bn Shareholder Return (2) Dividend per Share % 39% 40% 40% 38% 40% Financial flexibility protected: Net Cash of 14 bn Increased liquidity: Gross Cash of 25 bn (4) (3) (1) incl. 4 bn M&A (2) of which 6 bn of Dividend and 3 bn of Share Buyback (3) Increased exceptionally to deliver sustained dividend growth per share (4) as of 31 Dec 2017


26 DELIVER EPS & FCF GROWTH POTENTIAL EPS Growth FCF Growth Future Growth Potential Boost Performance EPS Growth A350 Benchmark margin A350 Turning Profitable A320 Volume and Price A400M* A320 Rate potential Boost Competitiveness FX Hedging Impact Working Capital Control Investment in Digital & Innovation * A400M will continue to weigh in 2018 and 2019 Box sizes for illustration purpose only
FY 2018 ROADSHOW PRESENTATION. February 2019
 FY 2018 ROADSHOW PRESENTATION February 2019 SAFE HARBOUR STATEMENT DISCLAIMER This presentation includes forward-looking statements. Words such as anticipates, believes, estimates, expects, intends, plans,
AIRBUS H Roadshow Presentation. New York July 31 st, 2017
 AIRBUS H1 2017 Roadshow Presentation New York July 31 st, 2017 H1 2017 HIGHLIGHTS 2 Healthy commercial aircraft environment; robust backlog of 6,771 a/c supports ramp-up plans H1 financials reflect delivery
FY RESULTS ROADSHOW PRESENTATION
 1 FY RESULTS 2014 ROADSHOW PRESENTATION FY 2014 HIGHLIGHTS FOCUS ON EXECUTION 2 Strong financial performance Revenues: 61 bn, +5% vs. 2013 EBIT* before one off: 4.1 bn, +15% vs. 2013 EPS: 2.99, +61% vs.
AIRBUS. Berenberg Conference. 23 May 2018
 AIRBUS Berenberg Conference 23 May 2018 SAFE HARBOUR STATEMENT 2 DISCLAIMER This presentation includes forward-looking statements. Words such as anticipates, believes, estimates, expects, intends, plans,
AIRBUS FY 2017 ROADSHOW PRESENTATION
 AIRBUS FY 2017 ROADSHOW PRESENTATION February 2018 SAFE HARBOUR STATEMENT 2 DISCLAIMER This presentation includes forward-looking statements. Words such as anticipates, believes, estimates, expects, intends,
AIRBUS. Member States Shareholder Meeting. Toulouse 4 October 2017
 AIRBUS Member States Shareholder Meeting Toulouse 4 October 2017 SAFE HARBOUR STATEMENT 2 DISCLAIMER This presentation includes forward-looking statements. Words such as anticipates, believes, estimates,
INVESTOR MEETING. CEO Airbus Group CEO Airbus CFO Airbus Group & Airbus. Tom Enders Fabrice Bregier Harald Wilhelm PARIS AIRSHOW 2015
 1 INVESTOR MEETING PARIS AIRSHOW 2015 Tom Enders Fabrice Bregier Harald Wilhelm CEO Airbus Group CEO Airbus CFO Airbus Group & Airbus PATH TO ENHANCED VALUE 2 Healthy commercial aircraft market Transformation
Airbus. Tom Enders Airbus. 15 & 16 December 2011
 Airbus Tom Enders Airbus Global Investor Forum Global Investor Forum 15 & 16 December 2011 Safe Harbour Statement 2 Disclaimer This presentation includes forward-looking statements. Words such as anticipates,
EADS: New Stage of Maturity. Nathalie Errard VP Investor Relations
 EADS: New Stage of Maturity Nathalie Errard VP Investor Relations Lagardere Investor Day, June 1 st, 2006 1 Content Integration and Rise to Leadership 2005 Group Financials New Challenges, New Growth 2
AIRBUS Private Wealth Roadshow. London September 18 th, 2017
 AIRBUS Private Wealth Roadshow London September 18 th, 2017 SAFE HARBOUR STATEMENT 2 DISCLAIMER This presentation includes forward-looking statements. Words such as anticipates, believes, estimates, expects,
Hans-Peter Ring EADS Chief Financial Officer. Cowen Conference February 8 th 2012
 Hans-Peter Ring EADS Chief Financial Officer Cowen Conference February 8 th 2012 Safe Harbour Statement 2 Disclaimer This presentation includes forward-looking statements. Words such as anticipates, believes,
SAS AB Q December 2018
 SAS AB Q4 2018 4 December 2018 Q4 financial highlights Q4 POSITIVES Q4-18 CHANGE VS. Q4-17 Record number of passengers Total revenue up SEK 1bn vs. LY Yield (nominal) up 5.1% vs. LY RASK (nominal) up 7.0%
Transformation in Procurement. Challenges for the Global Aircraft Industry. HAL Executives Presentation Toulouse, October 13, 2014
 HAL Executives Presentation Toulouse, October 13, 2014 Transformation in Procurement Challenges for the Global Aircraft Industry Albert Varenne Airbus Agenda Business Situation and Supply Chain Challenges
aero-notes INTERVIEW WITH AIRBUS GROUP CFO HARALD WILHELM AIRBUS GROUP RESULTS 2013 Another year of operational and financial improvement AIRBUS GROUP
 LETTER TO SHAREHOLDERS NUMBER 38 MAY 2014 aero-notes 02 INTERVIEW WITH AIRBUS GROUP CFO HARALD WILHELM Philippe Balducchi, Airbus Group Head of Investor Relations and Financial Communication We are making
2012 Result. Mika Vehviläinen CEO
 2012 Result Mika Vehviläinen CEO 1 Agenda Market environment in Q4 Business performance and strategy execution Outlook Financials 2 Market Environment According to IATA, Global air travel continues to
SAS Q3 2017/ August 2018
 SAS Q3 2017/2018 31 August 2018 Strong earnings in peak season POSITIVES Record number of passengers Total revenue up MSEK 936 vs. LY Currency adjusted yield up 1.1% vs. LY EB point sale up 27% vs. LY
Santander 22 nd Annual Latin American Conference. Cancun, January 2018
 Santander 22 nd Annual Latin American Conference Cancun, January 2018 This presentation may include forward-looking comments regarding the Company s business outlook and anticipated financial and operating
Growing Horizons Global Market Forecast
 Growing Horizons Global Market Forecast 2017-2036 John Leahy Chief Operating Officer, Customers Global Market Forecast 2017: Highlights World Fleet Forecast 2016 2036 RPK (trillions) 7.0 16.5 vs. GMF16
Fourth Quarter 2015 Financial Results
 Fourth Quarter 2015 Financial Results AerCap Holdings N.V. February 23, 2016 Disclaimer Incl. Forward Looking Statements & Safe Harbor This presentation contains certain statements, estimates and forecasts
Analysts and Investors conference call. Q results. 15 May 2013
 Analysts and Investors conference call Q1 2013 results 15 May 2013 Management summary Key messages of Q1 2013 +6% +9% +3.3%p. Q1 2013 operational KPIs are in line with 109.7 116.2 6.5 7.1 82.3 85.6 expectations,
E190 REPLACEMENT & FLEET UPDATE JULY 11, 2018
 1 E190 REPLACEMENT & FLEET UPDATE JULY 11, 2018 SAFE HARBOR This presentation contains forward-looking statements within the meaning of the Private Securities Litigation Reform Act of 1995, Section 27A
SAS Q2 2017/2018 TELECONFERENCE
 SAS Q2 2017/2018 TELECONFERENCE 30 May 2018 Earnings as expected despite negative currency effect POSITIVES + Total revenue up MSEK 73 vs. LY + Currency adjusted yield up 0.6% vs. LY + EB-point sale revenue
2018 full-year results
 2018 full-year results 01 Message from Chairman & CEO 02 FY 2018 Results 03 Business drivers 04 Outlook 02 FY 2018 financial results Key figures Revenue 2.85 Bn ROP 115 M Net debt 252 M Free cash flow
Preliminary Figures FY 2016
 February 14, 2017 Preliminary Figures FY 2016 Capital Markets Day 2017 Tom Blades (CEO) Disclaimer This presentation has been produced for support of oral information purposes only and contains forwardlooking
Recovery on track, continued strengthening in most segments. Record Jetstar and Frequent Flyer earnings highlight value of portfolio
 Qantas Full Year 2010 Results Presentation Overview Underlying PBT 1 more than tripled to $377m in line with guidance Delivering against strategic priorities Recovery on track, continued strengthening
OPERATING AND FINANCIAL HIGHLIGHTS
 Copa Holdings Reports Financial Results for the Fourth Quarter of 2015 Excluding special items, adjusted net income came in at $31.7 million, or EPS of $0.73 per share Panama City, Panama --- February
OPERATING AND FINANCIAL HIGHLIGHTS. Subsequent Events
 Copa Holdings Reports Net Income of $103.8 million and EPS of $2.45 for the Third Quarter of 2017 Excluding special items, adjusted net income came in at $100.8 million, or EPS of $2.38 per share Panama
Overview. > Normalised earnings* before taxation of, up 30% > Statutory earnings before taxation of, up 40% > Statutory net profit after taxation of
 1 Overview > Normalised earnings* before taxation of, up 30% > Statutory earnings before taxation of, up 40% > Statutory net profit after taxation of > Operating revenue of > Strong operating cash flow
UBS 14 th Global Emerging Markets Conference. New York, November 2016
 UBS 14 th Global Emerging Markets Conference New York, November 2016 This presentation may include forward-looking comments regarding the Company s business outlook and anticipated financial and operating
2016 Full-Year results 28 February 2017
 2016 Full-Year results 28 February 2017 www.thalesgroup.com Business environment Aerospace Avionics: continued positive dynamics for cockpit avionics and in-flight entertainment and connectivity Space:
IAG results presentation. Quarter One th May 2018
 IAG results presentation Quarter One 2018 4 th May 2018 Highlights Willie Walsh, Chief Executive Officer Highlights Another strong quarter performance with an operating profit of 280m (5.6% margin, +2.3pts)
Ramsay Health Care Limited Results Briefing Half Year ended 31 December 2018
 Ramsay Health Care Limited Results Briefing Half Year ended 31 December 2018 Craig McNally, Group Managing Director & Bruce Soden, Group Finance Director 28 February 2019 ramsayhealth.com Agenda Group
OPERATING AND FINANCIAL HIGHLIGHTS SUBSEQUENT EVENTS
 Copa Holdings Reports Net Income of US$6.2 Million and EPS of US$0.14 for the Third Quarter of 2015 Excluding special items, adjusted net income came in at $37.4 million, or EPS of $0.85 per share Panama
OPERATING AND FINANCIAL HIGHLIGHTS. Subsequent Events
 Copa Holdings Reports Net Income of US$113.1 Million and EPS of US$2.57 for the First Quarter of 2015 Excluding special items, adjusted net income came in at US$106.0 million, or EPS of US$2.41 per share
FIRST QUARTER 2017 RESULTS. 4 May 2017
 FIRST QUARTER 2017 RESULTS 4 May 2017 A resilient start of the year, traffic up 4.2% 20.9 million passengers carried, up 5.2%, traffic (RPK) up 4.2%, capacity (ASK) up 3.3% and load factor up 0.7pts Confirmation
Agenda. Conclusion of Transform Key Perform 2020 initiatives. Perform 2020 financial framework. Information meeting
 Information meeting Agenda Conclusion of Transform 2015 Key Perform 2020 initiatives Perform 2020 financial framework 2 Transform 2015: first phase of group turnaround accomplished Strict capacity discipline
SAS Q1 2016/
 SAS Q1 2016/2017 08.03.2017 Weak Q1 as expected new structural actions underway Q1 in summary Positives + Currency adjusted passenger revenue up 5% + Strong development of ancillary revenues + Passengers
2017 Amadeus IT Group and its affiliates and subsidiaries. Amadeus 2016 Results. February 24, 2017
 Amadeus 2016 Results February 24, 2017 Disclaimer _ This presentation may contain certain statements which are not purely historical facts, including statements about anticipated or expected future revenue
Copa Holdings Reports Net Income of US$113.9 Million for the Fourth Quarter of 2013
 Copa Holdings Reports Net Income of US$113.9 Million for the Fourth Quarter of 2013 Panama City, Panama --- February 12, 2014. Copa Holdings, S.A. (NYSE: CPA), today announced financial results for the
MEDIA/ANALYST PRESENTATION FY RESULTS 11 MAY 2007
 MEDIA/ANALYST PRESENTATION FY2006-07 RESULTS 11 MAY 2007 SIA GROUP FY2006-07 07 RESULTS GROUP REVENUE FY2006/07 ($ million) ($ million) 15,000 14,494 14,000 13,000 12,000 11,000 10,515 12,013 13,341 Record
OPERATING AND FINANCIAL HIGHLIGHTS SUBSEQUENT EVENTS
 Copa Holdings Reports Financial Results for the Third Quarter of 2016 Excluding special items, adjusted net income came in at $55.3 million, or adjusted EPS of $1.30 per share Panama City, Panama --- November
OPERATING AND FINANCIAL HIGHLIGHTS. Subsequent Events
 Copa Holdings Reports Financial Results for the First Quarter of 2016 Excluding special items, adjusted net income came in at US$69.9 million, or EPS of US$1.66 per share Panama City, Panama --- May 5,
Global Market Forecast
 Presentation by: Bob Lange SVP, Market & Product Strategy Global Market Forecast 2013-2032 Drivers for Growth Topics The Market Today & forecast (GMF) Airbus product response Air travel has proved to be
Heathrow (SP) Limited
 Limited") Draft v2.0 10 Feb Heathrow (SP) Limited Results for year ended 31 December 2013 24 February 2014 Strong operational and financial performance in 2013 Passenger satisfaction at record high and over 72 million
Draft v2.0 10 Feb Heathrow (SP) Limited Results for year ended 31 December 2013 24 February 2014 Strong operational and financial performance in 2013 Passenger satisfaction at record high and over 72 million
To New Levels. Philippe Camus, CEO Rainer Hertrich, CEO Hans Peter Ring, CFO. Analyst conference call 8 th March 2004
 FY Results To New Levels Philippe Camus, CEO Rainer Hertrich, CEO Hans Peter Ring, CFO Analyst conference call 8 th March 2004 1 Safe Harbor Statement Certain of the statements contained in this document
OPERATING AND FINANCIAL HIGHLIGHTS
 Copa Holdings Reports Net Income of US$32.0 Million and EPS of US$0.72 for the Second Quarter of 2012 Excluding special items, adjusted net income came in at $58.6 million, or EPS of $1.32 per share Panama
Analyst and Investor Conference Call Q Ulrik Svensson, CFO and Member of the Executive Board
 Analyst and Investor Conference Call Q2 2017 Ulrik Svensson, CFO and Member of the Executive Board Frankfurt, 2 August 2017 Disclaimer The information herein is based on publicly available information.
Copa Holdings Reports Fourth Quarter and Full Year 2007 Results
 Copa Holdings Reports Fourth Quarter and Full Year 2007 Results Panama City, Panama --- February 21, 2008. Copa Holdings, S.A. (NYSE: CPA), parent company of Copa Airlines and Aero Republica, today announced
AIR FRANCE-KLM RESULTS PRESENTATION
 AIR FRANCE-KLM RESULTS PRESENTATION Results as at 30 th of June 2018 1 st August 2018 SECOND QUARTER 2018: KEY HIGHLIGHTS Leveraging ongoing solid demand +0.8% +1.7% Stable operating result before strike
Copa Holdings Reports Record Earnings of US$41.8 Million for 4Q06 and US$134.2 Million for Full Year 2006
 Copa Holdings Reports Record Earnings of US$41.8 Million for 4Q06 and US$134.2 Million for Full Year 2006 Panama City, Panama --- March 7, 2007. Copa Holdings, S.A. (NYSE: CPA), parent company of Copa
2017 Amadeus IT Group and its affiliates and subsidiaries. Amadeus 2016 Results. February 24, 2017
 Amadeus 2016 Results February 24, 2017 Disclaimer _ This presentation may contain certain statements which are not purely historical facts, including statements about anticipated or expected future revenue
First Half 2013 Results. 16 mai 2013
 First Half 2013 Results 16 mai 2013 26 July 2013 Results Increasing effects of Transform 2015 Highlights of the First Half A difficult global economic environment Transform 2015 plan roll-out on track
SAS Group Presentation Carnegie, May 22, 2012 Sture Stölen, Head of IR
 SAS Group Presentation Carnegie, May 22, 2012 Sture Stölen, Head of IR 1 This is the SAS Group 128 destinations 27,2 million passengers 28 new routes to be launched 2012 1,085 daily flights Revenues 2011,
Cathay Pacific Airways Interim Results 04 August Cathay Pacific Airways Interim Results 6 August 2008
 Cathay Pacific Airways 2010 Interim Results 04 August 2010 Cathay Pacific Airways 2008 Interim Results 6 August 2008 Interim Result 1H 2010 1H 2009 Group Profit/(Loss) HK$6,840m HK$812m Group Turnover
Norwegian Air Shuttle ASA
 Norwegian Air Shuttle ASA Q1 2018 Presentation 26 April 2018 Highlights Q1 2018 Successfully completed private placement of NOK 1.3 billion Added two 737-800s and six 787-9s to operations Launched interline
INVESTOR PRESENTATION. Imperial Capital Global Opportunities Conference September 2015
 INVESTOR PRESENTATION Imperial Capital Global Opportunities Conference September 2015 Forward-looking Statements This presentation contains forward-looking statements within the meaning of the Private
2017 Full-Year results 6 March 2018
 2017 Full-Year results 6 March 2018 www.thalesgroup.com Business environment Aerospace Continued positive dynamics for cockpit avionics and in-flight entertainment and connectivity Space: wait-and-see
Randy Tinseth Vice President, Marketing Boeing Commercial Airplanes
 Randy Tinseth Vice President, Marketing Boeing Commercial Airplanes June 2017. The statements contained herein are based on good faith assumptions are to be used for general information purposes only.
OPERATING AND FINANCIAL HIGHLIGHTS
 Copa Holdings Reports Financial Results for the Fourth Quarter of 2018 Excluding special items, adjusted net profit came in at $44.0 million, or Adjusted EPS of $1.04 Panama City, Panama --- February 13,
Air Berlin PLC AGM 06 June 2013 London
 Air Berlin PLC AGM 06 June 2013 London airberlin a strong European carrier Market position as of 31 December 2012 No. 2 in core market: Germany / Austria / Switzerland No. 7 in Europe with 33.3 m guests
ODDO IR Day. November 28 th, Oliver Vogelgesang Vice President Investor Relations
 ODDO IR Day November 28 th, 2011 Oliver Vogelgesang Vice President Investor Relations Safe Harbour Statement 2 Disclaimer This presentation includes forward-looking statements. Words such as anticipates,
Results 2Q17. August 9, 2017
 Results 2Q17 August 9, 2017 2Q17 Highlights Indicators 2Q17 Var. x 2Q16 ASK (BN) 10.4-3.0% Traffic (000) 7,261-1.3% RPK (BN) 8.1 +0.5% Load Factor 77.9% +2.7 p.p. Yield (R$ cents) 23.2 +4.8% Pax Revenue
Norwegian Air Shuttle ASA
 Norwegian Air Shuttle ASA Q4 2017 Presentation 15 February 2018 Highlights Q4 2017 Added one 737-800 and two 787-9s to operations Financed the first aircraft with a combination of UKEF and JOLCO Agreed
Deutsche Bank 16 th Annual Global Emerging Markets. New York, September 2017
 Deutsche Bank 16 th Annual Global Emerging Markets New York, September 2017 This presentation may include forward-looking comments regarding the Company s business outlook and anticipated financial and
EADS Reports Results of First Quarter 2010
 EADS Reports Results of First Quarter 2010 Revenues of 9.0 billion: high level of deliveries sustained EBIT* before one-off at 0.15 billion EBIT* of 83 million Net income: 103 million Net Cash at 8.8 billion
1Q13 R sults esentation
 1Q13 Results Presentation 14 May 2013 Disclaimer The presentation is dated the day it is given. The delivery of this presentation shall not, under any circumstances, create any implication that there has
01 Amadeus at a glance
 01 Amadeus at a glance 7 Amadeus Annual Report 2011 1.1 Company s origins and development Most people associate the birth of electronic commerce distribution with the arrival of the internet. In fact,
Bank of America Merrill Lynch 2018 Emerging Markets Corporate Credit Conference. Miami, May 2018
 Bank of America Merrill Lynch 2018 Emerging Markets Corporate Credit Conference Miami, May 2018 This presentation may include forward-looking comments regarding the Company s business outlook and anticipated
GOOD STRATEGY IMPLEMENTATION DELIVERS SHAREHOLDER VALUE
 GOOD STRATEGY IMPLEMENTATION DELIVERS SHAREHOLDER VALUE Marco Wirén, CFO and Executive Vice President 1 Wärtsilä PUBLIC ATTRACTIVE LONG-TERM INVESTMENT
Q1 2018/
 Q1 2018/2019 27.02.2019 Highlights Q1/19 CHANGE VS. Q1-18 Financial drivers Total revenue up 6% with broadly unchanged capacity Slight increase in passengers and load factor HIGHLIGHTS Q1/19 Improved unit
Thank you for participating in the financial results for fiscal 2014.
 Thank you for participating in the financial results for fiscal 2014. ANA HOLDINGS strongly believes that safety is the most important principle of our air transportation business. The expansion of slots
Management Discussions and Analysis for the three-month period ended 31 March 2014 and Executive Summary
 Executive Summary Overview of the global economy during the first quarter of 2015 (Q1/2015) are as following; the US economy has been in recovery mode while rapidly dollar appreciation weighs on net exports
SAS Group Q2 2012/13. Q2 Restructuring programme moving KPIs in the right direction
 SAS Group Q2 2012/13 1 Q2 Restructuring programme moving KPIs in the right direction Operating revenues +1.6%* Yield improvement of +2.7%* Forceful implementation of 4XNG plan: Unit cost down by 10.7%
INVESTOR PRESENTATION. May 2015
 INVESTOR PRESENTATION May 2015 Forward-looking Statements This presentation contains forward-looking statements within the meaning of the Private Securities Litigation Reform Act of 1995 that reflect the
Investor Presentation
 TUI Group Investor Presentation WestLB Deutschland Conference 2010 17 November 2010 TUI AG Investor Relations Seite 1 Future-related related statements This presentation contains a number of statements
2013 Annual Results Press Conference, March 13, 2014 Eric Trappier, Chairman & CEO
 2013 Annual Results Press Conference, March 13, 2014 Eric Trappier, Chairman & CEO Falcon: an expanded product line 77 Falcon delivered in 2013 : Falcon 7X Certification of EASy II cockpit Falcon 900LX
Copa Holdings Reports Net Income of $49.9 million and EPS of $1.18 for the Second Quarter of 2018
 Copa Holdings Reports Net Income of $49.9 million and EPS of $1.18 for the Second Quarter of 2018 Panama City, Panama --- Aug 8, 2018. Copa Holdings, S.A. (NYSE: CPA), today announced financial results
Investor Relations Update October 25, 2018
 General Overview Investor Relations Update Revenue The company expects its fourth quarter total revenue per available seat mile (TRASM) to be up approximately 1.5 to 3.5 percent year-over-year. Fuel Based
September 2010 Brian Pearce To represent, lead and serve the airline industry
 Cycle turns up but risks and structural challenges remain September 2010 Brian Pearce www.iata.org/economics To represent, lead and serve the airline industry Confidence was still high in July survey Airline
Fourth Quarter and Full Year 2011 Results Presentation. February 1, 2012
 Fourth Quarter and Full Year 2011 Results Presentation February 1, 2012 This presentation may include forward-looking comments regarding the Company s business outlook and anticipated financial and operating
SHAPING A SUSTAINABLE FUTURE
 SHAPING A SUSTAINABLE FUTURE Full Year Results Year ended 31 March 2017 Analyst and Investor Presentation 8 June 2017 Agenda Introduction Christine Ourmieres-Widener Financial Review Philip de Klerk Performance
ANA HOLDINGS Management Strategy Update
 ANA HOLDINGS NEWS ANA HOLDINGS Management Strategy Update TOKYO, April 28, 2017 - ANA HOLDINGS (hereafter ANA HD ) today provides an update to its FY2016-2020 Mid-Term Management Strategy, set out in January
EADS Financial Strategy: A Look to the Future
 EADS Financial Strategy: A Look to the Future Hans Peter Ring (CFO) North America Investor Forum 2004 New York December 3rd, 2004 1 Maturing with New Momentum Post Merger Phase 2000 Group Integration 2004
1.3% millionn euros. Net debt of 5.4 improvement. euros to. Financial Year. the Air. operating. equipped. ness and. also focus on.
 25 th July 2014 Financial Year 2014: First Half results SECOND QUARTER Revenues of 6.45 billion euros, upp 1.7% like-for-like; passenger unit revenue up 1.3% at constant currency thanks to strict capacity
2007/08 Full Year Results Investor Briefing
 2007/08 Full Year Results Investor Briefing Highlights of Result Profit before tax up 46% to $1,408 million Up 36% on the reported result Margin improvement $3 billion of Sustainable Future Benefits achieved
ABX. Holdings, Inc. BB&T Transportation Conference. February 2008
 ABX Holdings, Inc. BB&T Transportation Conference February 2008 1 Safe Harbor Statement Except for historical information contained herein, the matters discussed in this presentation contain forward-looking
Strengthened SAS delivers positive result in Q3
 SAS Group Q3 2012/13 1 Strengthened SAS delivers positive result in Q3 Passenger revenues up 5.3% (FX adjusted) 32 new routes introduced Capacity up 7.7% Traffic up 5.6% Yield down 0.6% Restructuring status
MRO Market Update & Industry Trends
 January 25-26, 2017 Cancun, Mexico Presented by: Jonathan M. Berger Vice President ICF jberger@icf.com MRO Market Update & Industry Trends 0 Today s Agenda Fleet & MRO Forecast 2016: What a long strange
Third Quarter Results
 1 Third Quarter 2010-11 Results Highlights of the Third Quarter Passenger business affected by significant disruptions Dynamic cargo activity Strong improvement in results Decline in ex-fuel unit costs
Airbus market forecast for India. Presented by Joost van der Heijden Head of Airline Marketing India, South-East Asia, Japan & Africa
 Airbus market forecast for India Presented by Joost van der Heijden Head of Airline Marketing India, South-East Asia, Japan & Africa The Airbus product line A380 Family A350 Family A330 Family A320 Family
Emirates Group announces half-year performance for
 Final Emirates Group announces half-year performance for 2018-19 Group: Revenue up 10% to AED 54.4 billion (US$ 14.8 billion), and profit of AED 1.1 billion (US$ 296 million), down 53%. Results impacted
Finnair Q Result
 Finnair Q1 2015 Result 7 May 2015 CEO Pekka Vauramo, Interim CFO Mika Stirkkinen 1 Turbulent market environment The weakness of the Finnish economy continued to be reflected in the demand in the first
Copa Holdings Reports Earnings of US$30.3 Million and EPS of US$0.70 for 3Q08
 Copa Holdings Reports Earnings of US$30.3 Million and EPS of US$0.70 for 3Q08 Panama City, Panama --- November 13, 2008. Copa Holdings, S.A. (NYSE: CPA), parent company of Copa Airlines and Aero Republica,
Aviation industry outlook
 Euro Aviation ICT Forum Thursday 29 October, 2015 Divani Caravel Hotel, Athens Aviation industry outlook Jonathan Wober, Chief Financial Analyst The leading independent supplier of global aviation knowledge
Information meeting. 12 September 2011
 Information meeting 12 September 2011 Full Year 2010-11 key data April 2010-March 2011 Revenues in billions Operating result in millions 77% Passenger 18.10 +11.3% -44 +874 13% Cargo 3.16 +29.5% +69 +505
Copa Holdings Reports Net Income of US$51.9 Million for the Fourth Quarter of 2008 and US$152.2 Million for Full Year 2008
 Copa Holdings Reports Net Income of US$51.9 Million for the Fourth Quarter of 2008 and US$152.2 Million for Full Year 2008 Panama City, Panama --- February 19, 2009. Copa Holdings, S.A. (NYSE: CPA), parent
Cebu Air, Inc. Annual Stockholders Briefing. 24 June cebupacificair.com
 Cebu Air, Inc. Annual Stockholders Briefing 24 June 2015 cebupacificair.com Business Updates Passengers (M) Operating Statistics 2014: Passenger traffic grew 17.5% to 16.9M. Seat capacity grew 14.8% to
SGCIB Premium Review 2018
 SGCIB Premium Review 2018 29 November 2018 Christian Labeyrie Executive Vice-President and CFO Disclaimer This presentation may contain forward-looking objectives and statements about VINCI s financial
J.P. Morgan Aviation, Transportation and Industrials Conference
 J.P. Morgan Aviation, Transportation and Industrials Conference March 3, 08 Scott Kirby President Safe Harbor Statement Certain statements included in this presentation are forward-looking and thus reflect
Agenda. Introduction Christine Ourmières-Widener. Financial Review Ian Milne. Performance Update & Outlook Christine Ourmières-Widener
 1 Agenda Introduction Christine Ourmières-Widener Financial Review Ian Milne Performance Update & Outlook Christine Ourmières-Widener 2 Strategy of regional connectivity is working Important to UK economy,