2014 INTERIM RESULTS PRESENTATION
|
|
|
- Gerald Chapman
- 5 years ago
- Views:
Transcription

1 2014 INTERIM RESULTS PRESENTATION 31 JULY

2 Forward-Looking Statements Disclaimer The information contained in this presentation has not been independently verified and this presentation contains various forward-looking statements that reflect management s current views with respect to future events and financial and operational performance. The words anticipate, target, expect, estimate, intend, plan, goal, believe and similar expressions or variations on such expressions identify certain of these forward-looking statements. Others can be identified from the context in which the statements are made. These forward-looking statements involve known and unknown risks, uncertainties, assumptions, estimates and other factors, which may be beyond Merlin Entertainments plc s (the Group s ) control and which may cause actual results or performance to differ materially from those expressed or implied from such forward-looking statements. All statements (including forward-looking statements) contained herein are made and reflect knowledge and information available as of the date of preparation of this presentation and the Group disclaims any obligation to update any forward-looking statements, whether as a result of new information, future events or results or otherwise. There can be no assurance that forwardlooking statements will prove to be accurate, as actual results and future events could differ materially from those anticipated in such statements. Accordingly, readers should not place undue reliance on forward-looking statements due to the inherent uncertainty therein. Nothing in this document should be construed as a profit forecast. 2


3 Agenda Overview Financial Results Strategic Update Nick Varney Andrew Carr Nick Varney 3
 Revenue: 513m (+11.2% CC 1, +6.")

 Dividend: 2.")


4 Summary Group Performance Visitors: 27.5m (+6.6%) Revenue: 513m (+11.2% CC 1, +6.1% reported) Like for like revenue growth: +8.1% EBITDA: 120m (+14.3% CC 1, +7.5% reported) Net Income: 29m (2013: loss of 11m) Dividend: 2.0p A strong start to On track for full year expectations. Throughout the presentation, all numbers are presented on an underlying basis, excluding exceptional and non-trading items, unless otherwise stated. 1 Constant currency based on year to date 2014 average foreign exchange rates. 4

5 Summary Op. Group Performance Like for like revenue growth: +8.1% Midway Attractions +1.9% LEGOLAND Parks +19.0% Resort Theme Parks +7.7% Madame Tussauds Wuhan Portfolio benefits highlighted during periods of differing divisional performance 5

6 Progress on Strategic Growth Drivers Capex cycle CBeebies Land Alton Towers Legends of Chima waterpark LEGOLAND California Penguin Ice Adventure SLC Birmingham Synergies VIP Pass launch Ticketing trials Destination positioning LEGOLAND Deutschland new hotel and LEGOLAND Billund hotel extension Azteca hotel in Chessington Midway roll out 5 opened year to date MT Singapore to open in Nov/Dec LLP Developments LEGOLAND Dubai planned for 2016 LEGOLAND Japan planned for 2017 Strategic Acquisitions CBeebies Land at Alton Towers Continued delivery on strategic growth drivers 6


7 Progress on Strategic Growth Drivers Capex cycle CBeebies Land Alton Towers Legends of Chima waterpark LEGOLAND California Penguin Ice Adventure SLC Birmingham Synergies VIP Pass launch Ticketing trials Destination positioning LEGOLAND Deutschland new hotel and LEGOLAND Billund hotel extension Azteca hotel in Chessington Midway roll out 5 opened year to date MT Singapore to open in Nov/Dec LLP Developments LEGOLAND Dubai planned for 2016 LEGOLAND Japan planned for 2017 Strategic Acquisitions Continued delivery on strategic growth drivers 6

8 Progress on Strategic Growth Drivers Capex cycle CBeebies Land Alton Towers Legends of Chima waterpark LEGOLAND California Penguin Ice Adventure SLC Birmingham Synergies VIP Pass launch Ticketing trials Destination positioning LEGOLAND Deutschland new hotel and LEGOLAND Billund hotel extension Azteca hotel in Chessington Midway roll out 5 opened year to date MT Singapore to open in Nov/Dec LLP Developments LEGOLAND Dubai planned for 2016 LEGOLAND Japan planned for 2017 Strategic Acquisitions 68-room King s Castle hotel at LEGOLAND Deutschland Continued delivery on strategic growth drivers 6

9 Progress on Strategic Growth Drivers Capex cycle CBeebies Land Alton Towers Legends of Chima waterpark LEGOLAND California Penguin Ice Adventure SLC Birmingham Synergies VIP Pass launch Ticketing trials Destination positioning LEGOLAND Deutschland new hotel and LEGOLAND Billund hotel extension Azteca hotel in Chessington Midway roll out 5 opened year to date MT Singapore to open in Nov/Dec LLP Developments LEGOLAND Dubai planned for 2016 LEGOLAND Japan planned for 2017 Strategic Acquisitions Opening weekend at MT Beijing Continued delivery on strategic growth drivers 6

10 Progress on Strategic Growth Drivers Capex cycle CBeebies Land Alton Towers Legends of Chima waterpark LEGOLAND California Penguin Ice Adventure SLC Birmingham Synergies VIP Pass launch Ticketing trials Destination positioning LEGOLAND Deutschland new hotel and LEGOLAND Billund hotel extension Azteca hotel in Chessington Midway roll out 5 opened year to date MT Singapore to open in Nov/Dec LLP Developments LEGOLAND Dubai planned for 2016 LEGOLAND Japan planned for 2017 Strategic Acquisitions Continued delivery on strategic growth drivers 6
11 Financial Results 7
12 Merlin Reporting Cycle Event Date % revenue 2 Disclosure Delivery Q1 IMS May 15 th 22% - Group level revenue growth Conf. call Interims July 31 st 41% Q3 IMS Pre-close update September 18 th 77% - Full P&L - Detail by Op. Group - Op. Group level revenue growth Audio Webcast Meeting December 2 nd 94% - Group level revenue growth - Prelims February 27 th 100% - Full P&L - Detail by Op. Group Meeting Note: Subject to change 1 Based on 2014 announced schedule 2 Shows cumulative revenue up to the end of the reporting period 8
13 Summary millions, unless stated H H Reported Growth Constant FX Growth Like for like Growth Revenue % 11.2% 8.1% EBITDA % 14.3% Margin 23.3% 23.0% Operating Profit % 18.0% PBT 40 (11) Net Income 29 (11) Dividend 2.0p n/a Further growth in visitors, revenue and profits 9
14 Revenue Bridge H H1 14 Like for like 8.1% (22) 37 Net New Business Development: 15m H Revenue FX LFL Accomm. Midway roll out LLP Dev. Acquisitions Central H Revenue Revenue growth driven by like for like. NBD growth H2-weighted. 1 Like for like growth based on those sites owned and operated before These contributed 450m of revenue in H
15 Midway Financials millions, unless stated H1 14 H1 13 Reported Constant Currency Revenue (0.6)% 5.6% Like for like growth 1 1.9% 9.3% EBITDA (1.1)% 3.7% Operating Profit (1.7)% 2.2% Five new sites opened in H1 MT Singapore to open in Nov/Dec LFL Growth below long term trend: Strong H1 13 comparatives Political disruption in Bangkok Polar vortex on US attractions FX headwind Deferred high year capex projects in two sites Existing Estate Capex % Underlying growth despite difficult comparables like for like growth is based on 2013 and 2012 figures, on a constant currency basis using 2013 exchange rates. 11
16 LEGOLAND Parks Financials millions, unless stated H1 14 H1 13 Reported Constant Currency Revenue % 22.8% Like for like growth % 1.2% EBITDA % 41.0% Operating Profit % 54.1% Existing Estate Capex % Impact of LEGO movie: Successful marketing and promotion Greatest impact in US parks Some uplift in Europe and LDCs Uplift in retail spend implications for margins Weather more favourable throughout Easter, particularly in LEGOLAND Windsor Strong Group promotional activity Hotel extension at LEGOLAND Billund and new hotel at LEGOLAND Deutschland have traded well Capex projects on track and budget Growth boosted by LEGO movie and more favourable weather like for like growth is based on 2013 and 2012 figures, on a constant currency basis using 2013 exchange rates. 12
17 Resort Theme Parks Financials millions, unless stated H1 14 H1 13 Reported Constant Currency Revenue % 8.4% Like for like growth 1 7.7% 0.0% EBITDA Good performance from Heide Park (high year capex) CBeebies Land at Alton Towers Weather more favourable throughout Easter New Azteca hotel at Chessington expected to open in August Capex projects on track and budget Operating Loss (12) (12) (0.1)% (0.6)% Existing Estate Capex % Trading on track ahead of peak season like for like growth is based on 2013 and 2012 figures, on a constant currency basis using 2013 exchange rates. 13
18 Summary Underlying P&L millions, unless stated H1 14 H1 13 % P&L Guidance Op. Group EBITDA % Central Costs (17) (13) (30.3)% EBITDA % D&A (49) (47) (4.1)% Operating profit % Net finance costs (31) (75) 59.0% PBT 40 (11) - Tax (11) - - Net profit / (loss) 29 (11) - Share-based payments now allocated to Op. Groups - split approximately 50:50 between Op. Groups and Central Central costs of between 30-35m in FY2014 D&A to remain at 8-9% of revenue 2014 senior facility costs of 4.4% 7m of finance lease interest 6m non-cash amortisation of financing costs Strong trading in US: Effective Tax Rate of 28% in 2014, and Cash Tax Rate of 24% FX: FY2013 EBITDA 21m lower if based upon latest rates Overall, on track to meet full year expectations 14
19 Capital Expenditure millions, unless stated H1 14 H1 13 Existing Estate New Business Accommodation 17 9 Midway LLP Development 0 0 Year-on-year increase in EE capex driven by phasing H1 guidance in line with expectations FY2014 guidance raised to m Reflects LEGOLAND Japan capex of 5-10m Total Capex Acquisitions 0 1 Total Capex and Acquisitions Investment consistent with strategic objectives 15
20 Cashflow 38 (20) (101) Movement in Net Debt December 2013 (1,006) Net cash flow 6 FX 25 Other (2) June 2014 (977) 120 (30) (1) 6 H EBITDA Working capital Cash tax Capex Net financing costs Other Net cash flow Small cash inflow reflects seasonality of capex vs profit generation 16
21 Strategic Update 17


 Merlin to invest 53m with target cash ROIC of at least 20%")
22 LEGOLAND Japan Summer 2017 opening Located in centre of country, between Tokyo and Osaka. Catchment area of 20m+ people Good infrastructure and transport links. No local competition Strongest theme park market in Asia Developed theme park market High density of population Highly affluent market Good LEGO brand awareness - huge upside in worlds 2 nd largest toy market Strong support from KIRKBI (property investment) and City of Nagoya (infrastructure) Merlin to invest 53m with target cash ROIC of at least 20% EBITDA margins of 15-20% 22 18

23 LEGOLAND Japan Expansion Initial park Parking Smaller footprint than other parks, but significant scope for expansion long term Best practice from existing six LEGOLAND parks Concept has been evolved and upgraded for the Japanese market 23 19
24 LEGOLAND Parks Developments Successful track record of openings Florida opened on time and on budget in October 2011 Performance has been ahead of expectations On track for at least 20% ROIC Malaysia opened in September 2012 Management contract c 2-3m EBITDA, no capex Future Developments Existing LEGOLAND Parks Announced openings Opportunities Dubai expected to open in 2016 LEGOLAND Japan expected to open in summer of 2017 Potential for up to 20 LEGOLAND parks across the world. Targeting at least one opening every 3 years. 20
25 Summary and Outlook Summary Good start to the year Early peak season trading has been positive Outlook Continued growth in existing estate More challenging comparatives in H2 Op. Group like for like trading differences YTD likely to remain, but narrow in balance of 2014 NBD plans on track for both Midway and accommodation Well placed for growth in 2014 and beyond 21

26 Q&A 22

27 Appendix 23
28 Revenue Bridge H1 13 H1 14 Like for like 8.1% (1) 10 (22) Contribution in H from those sites opened after 2012 and therefore excluded from the like for like calculation Denominator for 2014 like for like calculation Gross New Business Development: 26m H Revenue FX 2012 closing estate in Visitors RPC Other Accomm. Midway roll out LLP Dev. Acq's Central H Revenue 1 Like for like growth of 8.1% ( 37m) is based upon the 2012 closing estate revenue contribution in 2013, translated at constant currency 2014 rates. In H1 2013, 11m of revenue was generated from those sites opened after the end of 2012, and these are therefore excluded from the like for like calculation. 24
 (147) Credit Ratings Corporate Family Rating S&P: BB")

29 Net Debt Banks loans and borrowings Cash and cash equivalents June 2014 June ,161 1,370 (268) (147) Credit Ratings Corporate Family Rating S&P: BB Moody s: Ba3 Net bank debt 893 1,223 Finance lease obligations Net debt 977 1, m reduction in Net Debt from IPO proceeds and cash generation 25
30 FX Sensitivity - Revenue H1 13 average FX rates H1 14 average FX rates % change Revenue impact EUR (3.3)% (3) USD (8.2)% (9) AUD (21.3)% (6) Other (4) Total (22) 26
31 FX Sensitivity - EBITDA H1 13 average FX rates H1 14 average FX rates % change EBITDA impact EUR (4.6)% (1) USD (8.7)% (3) AUD (20.2)% (1) Other (2) Total (7) 27
32 Operating Group financials Midway Attractions LEGOLAND Parks Resort Theme Parks Group % % % % Statutory visitors (m) % % % % Revenue per cap ( ) (2.4)% (0.7)% (1.0)% % Visitor revenue ( m) % % % % Other revenue ( m) 9 12 (18.4)% % % % Total revenue ( m) (0.6)% % % % LFL revenue growth 1.9% 9.3% % 1.2% - 7.7% 0.0% - 8.1% 4.3% - EBITDA ( m) (1.1)% % % Op. Profit ( m) (1.7)% % (12) (12) (0.1)% % EE. Capex ( m) % % % % All figures are based on interim results. EE = Existing Estate Statutory Visitors exclude LEGOLAND Malaysia and joint ventures 28
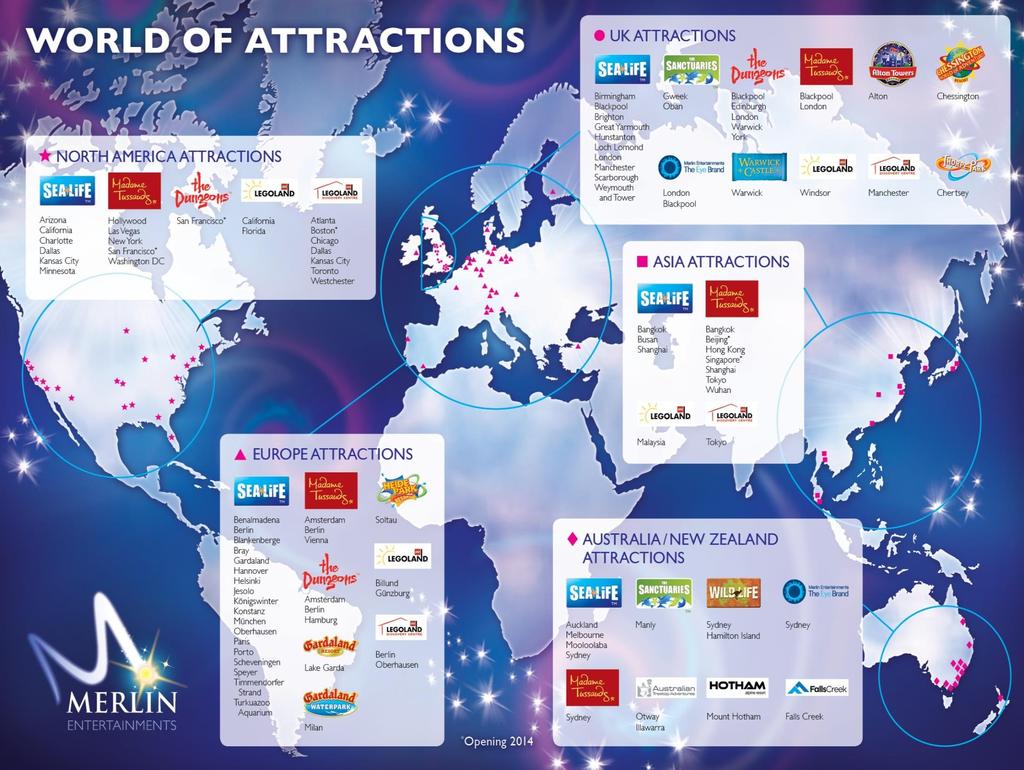
33 Attraction Count UK Cont. Europe Americas Asia Pacific Group 3 May 2014 Mov t 28 June May 2014 Mov t 28 June May 2014 Mov t 28 June May 2014 Mov t 28 June May 2014 Mov t 28 June 2014 SEA LIFE Madame Tussauds Dungeons LDC Eye Other Midway LLP RTP Group
34 30

35 31
2014 IMS PRESENTATION
 2014 IMS PRESENTATION 18 SEPTEMBER 2014 1 Forward-Looking Statements Disclaimer The information contained in this presentation has not been independently verified and this presentation contains various
2015 SEPTEMBER TRADING UPDATE. 17 September 2015
 2015 SEPTEMBER TRADING UPDATE 17 September 2015 FORWARD-LOOKING STATEMENTS DISCLAIMER The information contained in this presentation has not been independently verified and this presentation contains various
MERLIN ENTERTAINMENTS PLC 2018 SUMMER TRADING. Nick Varney Chief Executive Officer. Peppa Pig World of Play, Shanghai
 MERLIN ENTERTAINMENTS 2018 SUMMER TRADING UPDATE Nick Varney Chief Executive Officer MERLIN ENTERTAINMENTS PLC Peppa Pig World of Play, Shanghai FORWARD-LOOKING STATEMENTS DISCLAIMER The information contained
2018 INTERIM RESULTS PRESENTATION Anne-Françoise Nesmes, Chief Financial Officer MERLIN ENTERTAINMENTS PLC. Peppa Pig Land, Gardaland, Italy
 MERLIN ENTERTAINMENTS 2018 INTERIM RESULTS PRESENTATION Anne-Françoise Nesmes, Chief Financial Officer MERLIN ENTERTAINMENTS PLC Peppa Pig Land, Gardaland, Italy FORWARD-LOOKING STATEMENTS DISCLAIMER The
2016 PRELIMINARY RESULTS PRESENTATION
 2016 PRELIMINARY RESULTS PRESENTATION 2 MARCH 2017 2016 HIGHLIGHTS Results in line with expectations Confident in our growth strategy and outlook 2016 performance testament to the benefits of a diverse
2017 PRELIMINARY RESULTS PRESENTATION
 LEGOLAND Discovery Centre - Shanghai 2017 PRELIMINARY RESULTS PRESENTATION 1 MARCH 2018 2017 HIGHLIGHTS Visitors EBITDA EPS 66.0m 3.5% 474m 9.5% 20.5p 5.5% 383 New accommodation rooms Six New Midway attractions
Merlin Entertainments plc Trading Update
 Merlin Entertainments plc Trading Update Further growth despite difficult trading conditions in certain key markets 2020 milestones on track 29 tember Merlin Entertainments (the Group ) today reports its
Merlin Entertainments plc Trading Update
 Merlin Entertainments plc Trading Update New Business Development drives revenue growth Difficult summer trading after strong early momentum Intention to reallocate capital to reflect current market context
Merlin Entertainments plc Trading Update
 Merlin Entertainments plc Trading Update Performance year to date in line with expectations outlook unchanged 1 ober Merlin Entertainments (the Group ) today reports its trading performance for the 40
Parques Reunidos Corporate Presentation March 2016
 Parques Reunidos Corporate Presentation March 216 Disclaimer The information contained in this presentation (the Presentation ), including but not limited to forward-looking statements, is provided as
IAG results presentation. Quarter One th May 2018
 IAG results presentation Quarter One 2018 4 th May 2018 Highlights Willie Walsh, Chief Executive Officer Highlights Another strong quarter performance with an operating profit of 280m (5.6% margin, +2.3pts)
WH Smith PLC Acquisition of InMotion providing access to the world s largest travel retail market 30 October 2018
 WH Smith PLC Acquisition of InMotion providing access to the world s largest travel retail market 30 October 2018 Transaction highlights WH Smith announces acquisition of InMotion for $198m ( 155 million)
Analyst and Investor Conference Call Q Ulrik Svensson, CFO and Member of the Executive Board
 Analyst and Investor Conference Call Q2 2017 Ulrik Svensson, CFO and Member of the Executive Board Frankfurt, 2 August 2017 Disclaimer The information herein is based on publicly available information.
Half Year F1 Results. November 4, 2015
 Half Year F1 Results November 4, 2015 F17 Q1 Results 20 JULY 2016 Q1 BUSINESS HIGHLIGHTS Passenger growth of 18% to 5.8m pax on 17% seat growth Record underlying profit of 38.6m (+14%) despite Easter effect
PAN PACIFIC HOTELS GROUP LIMITED 2010 FULL YEAR RESULTS BRIEFING 22 FEB 2011
 PAN PACIFIC HOTELS GROUP LIMITED 2010 FULL YEAR RESULTS BRIEFING 22 FEB 2011 2010 RESULTS OVERVIEW STRATEGIC & OPERATIONS HIGHLIGHTS NEO SOON HUP CHIEF FINANCIAL OFFICER 2 CONTENTS Focus and Highlights
M2 Group Ltd 2014 Interim Results
 M2 Group Ltd 2014 Interim Results 24 February 2014 Geoff Horth, CEO Presentation Content Record Financial Performance Strong Organic Growth FY14 Priorities and Guidance Slide 2, 24 February 2014 Record
INVESTOR PRESENTATION. May 2015
 INVESTOR PRESENTATION May 2015 Forward-looking Statements This presentation contains forward-looking statements within the meaning of the Private Securities Litigation Reform Act of 1995 that reflect the
Management Presentation. March 2016
 Management Presentation March 2016 Forward looking statements This presentation as well as oral statements made by officers or directors of Allegiant Travel Company, its advisors and affiliates (collectively
Managing through disruption
 28 July 2016 Third quarter results for the three months ended 30 June 2016 Managing through disruption 3 months ended Like-for-like (ii) m (unless otherwise stated) Change 30 June 2016 30 June 2015 change
Highlights from the Annual Results December 2007
 Highlights from the Annual Results December 2007 Disclaimer The information in this document is taken from the BAA 2007 Annual Results ( the Results ) which were published on 11 March 2008 and other public
JAPAN AIRLINES Co., Ltd. Financial Results 1 st Quarter Mar/2017(FY2016) July 29, 2016
 July 29, 2016") JAPAN AIRLINES Co., Ltd. Financial Results Mar/2017(FY2016) July 29, 2016 Today s Topics P.1 P.2 P.13 From the first quarter of this fiscal year, figures for Revenue Passengers Carried, ASK, RPK and Load
JAPAN AIRLINES Co., Ltd. Financial Results Mar/2017(FY2016) July 29, 2016 Today s Topics P.1 P.2 P.13 From the first quarter of this fiscal year, figures for Revenue Passengers Carried, ASK, RPK and Load
INVESTOR PRESENTATION. Imperial Capital Global Opportunities Conference September 2015
 INVESTOR PRESENTATION Imperial Capital Global Opportunities Conference September 2015 Forward-looking Statements This presentation contains forward-looking statements within the meaning of the Private
Management Presentation. November 2011
 Management Presentation November 2011 Forward looking statements This presentation as well as oral statements made by officers or directors of Allegiant Travel Company, its advisors and affiliates (collectively
Heathrow (SP) Limited
 Limited") Draft v2.0 10 Feb Heathrow (SP) Limited Results for year ended 31 December 2013 24 February 2014 Strong operational and financial performance in 2013 Passenger satisfaction at record high and over 72 million
Draft v2.0 10 Feb Heathrow (SP) Limited Results for year ended 31 December 2013 24 February 2014 Strong operational and financial performance in 2013 Passenger satisfaction at record high and over 72 million
Corporate Presentation
 No. 58019-U Corporate Presentation CLSA IF2017 Hong Kong September 2017 1 OVERVIEW 2 3 4 FINANCIAL HIGHLIGHTS DOMESTIC OPERATIONS RESORTS WORLD GENTING GENTING INTEGRATED TOURISM PLAN OVERSEAS OPERATIONS
FIRST QUARTER 2017 RESULTS. 4 May 2017
 FIRST QUARTER 2017 RESULTS 4 May 2017 A resilient start of the year, traffic up 4.2% 20.9 million passengers carried, up 5.2%, traffic (RPK) up 4.2%, capacity (ASK) up 3.3% and load factor up 0.7pts Confirmation
Management Presentation. November 2018
 Management Presentation November 2018 Forward looking statements This presentation as well as oral statements made by officers or directors of Allegiant Travel Company, its advisors and affiliates (collectively
Cebu Air, Inc. 4 th Quarter and Full Year 2017 Results of Operations. cebupacificair.com
 Cebu Air, Inc. 4 th Quarter and Full Year 2017 Results of Operations cebupacificair.com Disclaimer The information provided in this presentation is provided only for your reference. Such information has
Quarterly Interim Management Statement. Three Months to June 30, 2015
 Quarterly Interim Management Statement Three Months to June 30, 2015 BUSINESS HIGHLIGHTS FOR Q1 Record Q1 profitability despite negative Easter effect Lower unit costs further increasing our cost advantage
Crown Limited Full Year. Results Presentation. 25 August 2011
 Crown Limited 2011 Full Year Results Presentation 25 August 2011 1 Crown Limited Overview Normalised 1 NPAT up 18.0% to $340.3 million, Reported NPAT $335.9 million, up 14.9% Australian casinos performance:
GAMING INVESTMENT FORUM AT G2E. September 26, 2016
 GAMING INVESTMENT FORUM AT G2E September 26, 2016 Dan D Arrigo EVP & Chief Financial Officer MGM Resorts International MGM RESORTS INTERNATIONAL Strong Domestic Operating Results Las Vegas Trends Maximizing
Wizz Air aims to increase market share with F17 capacity growth of 20% Q3 passenger growth of 20%, Load Factor of 88% (+2.3ppt)
") Q3 F17 FINANCIAL RESULTS 1 FEBRUARY 2017 BUSINESS HIGHLIGHTS Current market conditions favour ULCCs Wizz Air aims to increase market share with F17 capacity growth of 20% Q3 passenger growth of 20%, Load
Q3 F17 FINANCIAL RESULTS 1 FEBRUARY 2017 BUSINESS HIGHLIGHTS Current market conditions favour ULCCs Wizz Air aims to increase market share with F17 capacity growth of 20% Q3 passenger growth of 20%, Load
Q3 FY18 Business Highlights
 Q3 FY18 RESULTS Q3 FY18 Business Highlights 1 2 3 4 5 6 7 Record passengers 7.1m, record revenues 423m Investing in growth 24% passenger growth in Q3 Disciplined cost management flat ex-fuel CASK Largest
Management Presentation. September 2011
 Management Presentation September 2011 Forward looking statements This presentation as well as oral statements made by officers or directors of Allegiant Travel Company, its advisors and affiliates (collectively
WÄRTSILÄ S STRONG FINANCIAL POSITION. RAIMO LIND Executive Vice President, CFO
 WÄRTSILÄ S STRONG FINANCIAL POSITION Executive Vice President, CFO 1 Wärtsilä 29 March 212 Contents Topic 3 Growth over the cycle fulfils targeted levels 4 Net sales emphasis on high growth areas 5 Net
Heathrow (SP) Limited
 Limited") 28 April 2014 Heathrow (SP) Limited Results for three months ended 31 March 2014 Strong operational and financial performance at the outset of the new regulatory period Highest ever passenger satisfaction
28 April 2014 Heathrow (SP) Limited Results for three months ended 31 March 2014 Strong operational and financial performance at the outset of the new regulatory period Highest ever passenger satisfaction
Ramsay Health Care Limited Results Briefing Half Year ended 31 December 2018
 Ramsay Health Care Limited Results Briefing Half Year ended 31 December 2018 Craig McNally, Group Managing Director & Bruce Soden, Group Finance Director 28 February 2019 ramsayhealth.com Agenda Group
Gatwick Airport Limited. Results for six months ended 30 September 2012
 Gatwick Airport Limited Results for six months ended 30 September 2012 28 November 2012 Operational and financial performance Highlights Traffic growth + 1.2% EBITDA + 4.8% Capital expenditure 119.1m Despite
Tiger Airways Holdings Limited FY11 Results
 Tiger Airways Holdings Limited FY11 Results May 2011 Financial Year Ended 31 March 2011 Disclaimer The information contained in this presentation (the "Information") is provided by Tiger Airways Holdings
Investor Meeting Presentation. 4 June 2014
 Investor Meeting Presentation 4 June 2014 COMPANY OVERVIEW 1Q2014 RESULTS OVERVIEW OPERATION HIGHLIGHTS Q&A 2 Founded in 1963, listed on the Singapore Exchange in 1964 Three core businesses: - Property
Crown Resorts Limited
 Crown Resorts Limited 2015 Full Year Results Presentation 13 August 2015 1 Crown Resorts Limited Results Overview Crown Resorts Limited (Crown) performance: Overall, the results for Crown s portfolio of
Virgin Australia Holdings Limited (ASX: VAH) H1 FY18 Results 1
 H1 FY18 Results 1") Virgin Australia Holdings Limited (ASX: VAH) H1 FY18 Results 1 Summary of H1 FY18 Group Outcomes 2 Group Underlying Profit Before Tax of $102.5 million up 142.3% Group Statutory Profit After Tax of $4.4
Virgin Australia Holdings Limited (ASX: VAH) H1 FY18 Results 1 Summary of H1 FY18 Group Outcomes 2 Group Underlying Profit Before Tax of $102.5 million up 142.3% Group Statutory Profit After Tax of $4.4
Thank you for participating in the financial results for fiscal 2014.
 Thank you for participating in the financial results for fiscal 2014. ANA HOLDINGS strongly believes that safety is the most important principle of our air transportation business. The expansion of slots
Annual Results. Year ended 28 April June 2018
 1 Annual Results Year ended 28 April 2018 28 June 2018 Cautionary statement 2 This document is solely for use in connection with a briefing on the group headed by Stagecoach Group plc ( the Group ). This
The Manager Company Announcements Australian Stock Exchange Limited Sydney NSW Dear Sir. Demerger of BHP Steel
 The Manager Company Announcements Australian Stock Exchange Limited Sydney NSW 2000 Dear Sir Demerger of BHP Steel At the time of the announcement of the creation of the DLC between BHP Limited and Billiton
Management Presentation. November 2013
 Management Presentation November 2013 Forward looking statements This presentation as well as oral statements made by officers or directors of Allegiant Travel Company, its advisors and affiliates (collectively
Interim results. 11 May 2010
 Interim results 11 May 2010 Introduction Andy Harrison Chief Executive Officer Strong performance despite disruption Improvement in revenue, margins and cash Continued network improvement has driven better
AerCap Holdings N.V. Aengus Kelly, CEO. January 2017
 AerCap Holdings N.V. Aengus Kelly, CEO January 2017 Industry Update Looking Back PASSENGER TRAFFIC GROWTH Air traffic growth in 2016 remained robust, short-haul at 5.6% and long-haul at 6.4% 1 CHINA SLOWING
RESULTS RELEASE 20 August GENTING HONG KONG GROUP ANNOUNCES FIRST HALF RESULTS FOR 2015 Highlights
 RESULTS RELEASE 20 August 2015 FOR IMMEDIATE RELEASE INTERNATIONAL GENTING HONG KONG GROUP ANNOUNCES FIRST HALF RESULTS FOR 2015 Highlights The commentary below is prepared based on a comparison of the
Interim Report 3m Bilfinger Berger SE, Mannheim May 10, 2012 Joachim Müller, CFO
 Interim Report 3m 2012 Bilfinger Berger SE, Mannheim May 10, 2012 Joachim Müller, CFO Bilfinger Berger SE Interim report 3m 2012 May 10, 2012 Page 1 3m 2012: Highlights Growth in output volume and orders
NEWCREST LOOKING TO THE FUTURE
 NEWCREST LOOKING TO THE FUTURE Sandeep Biswas Managing Director and Chief Executive Officer Disclaimer Forward Looking Statements This presentation includes forward looking statements. Forward looking
First Quarter Results August 31 st, 2006
 First Quarter Results 2006-07 August 31 st, 2006 Key features of the First Quarter Market context Sustained global economic growth, and a recovery in Europe Average jet fuel price of 691 $/t, up 25% year-on-year
2012 Full Year Results Briefing. 28 February 2013
 2012 Full Year Results Briefing 28 February 2013 1 KEY FINANCIALS & STRATEGY BUSINESS REVIEW OUTLOOK Q&A 2 UOL GROUP LIMITED KEY FINANCIALS & STRATEGY GWEE LIAN KHENG GROUP CHIEF EXECUTIVE 3 S$m FY 2012
Quarterly Meeting# 2/2017
 Quarterly Meeting# 2/2017 1Q17 Performance & Outlook 16 May 2017 1 2017 ERAWAN. All rights reserved. The views expressed here contain some information derived from publicly available sources that have
Financial Results 3 rd Quarter MAR/2016 (FY2015)
") Financial Results MAR/2016 (FY2015) January 29 th, 2016 CONTENTS P.1 P.2 P.3 P.4~ Overview of FY MAR/16 Results Operating Revenue Operating Profit 1,030 1,020 1,010 +1.0Bn 1,022.3 1,023.4 (+0.1%) 180 160
Financial Results MAR/2016 (FY2015) January 29 th, 2016 CONTENTS P.1 P.2 P.3 P.4~ Overview of FY MAR/16 Results Operating Revenue Operating Profit 1,030 1,020 1,010 +1.0Bn 1,022.3 1,023.4 (+0.1%) 180 160
Forward-Looking Statements Statements in this presentation that are not historical facts are "forward-looking" statements and "safe harbor
 2017 Annual Meeting of Shareholders Presentation May 2017 Forward-Looking Statements Statements in this presentation that are not historical facts are "forward-looking" statements and "safe harbor statements"
Corporate Presentation
 No. 58019-U Corporate Presentation January 2018 1 1 OVERVIEW 2 3 4 FINANCIAL HIGHLIGHTS DOMESTIC OPERATIONS RESORTS WORLD GENTING GENTING INTEGRATED TOURISM PLAN OVERSEAS OPERATIONS UNITED KINGDOM UNITED
NYSE: SIX Short Recommendation
 NYSE: SIX Short Recommendation Tim Krauter 2018 Amy Ran 2019 Nick Palmer 2020 Sean Lee 2020 Yash Bhate 2020 1 Agenda Negative a. Season Pass Penetration b. Rival Parks c. International Expansion d. Taxes
2005 Q3 investor update. 25 August 2005
 2005 Q3 investor update 25 August 2005 1 This communication is directed only at (i) persons having professional experience in matters relating to investments who fall within the definition of investment
Alberto Calderon Group Executive and Chief Executive Aluminium, Nickel and Corporate Development
 Port Hedland, Iron Ore, Australia Alberto Calderon Group Executive and Chief Executive Aluminium, Nickel and Corporate Development Economic and Social Outlook Conference 1 November 2012 Disclaimer Forward
FY17 Full Year Results Management Call, 13 December Robinson Club Noonu, Maldives
 Full Year Results Management Call, 3 December 207 Robinson Club Noonu, Maldives TUI Group TUI continues its strong performance track record in Third consecutive year of strong top line and earnings growth
Air China Limited Annual Results. March Under IFRS
 Air China Limited 21 Annual Results Under IFRS March 211 Agenda Part 1 Highlights Part 2 Business Overview Part 3 Financial Overview Part 4 Outlook 2 Part 1 Highlights Steady Economic Growth; Asia Pacific
1Q 2017 EARNINGS PRESENTATION APRIL 25, 2017
 1 1Q 2017 EARNINGS PRESENTATION APRIL 25, 2017 SAFE HARBOR This presentation contains forward-looking statements within the meaning of the Private Securities Litigation Reform Act of 1995, Section 27A
Management Presentation. May 2013
 Management Presentation May 2013 Forward looking statements This presentation as well as oral statements made by officers or directors of Allegiant Travel Company, its advisors and affiliates (collectively
JAPAN AIRLINES Co., Ltd. Financial Results 1 st Quarter Mar/2017(FY2016) July 29, 2016
 July 29, 2016") JAPAN AIRLINES Co., Ltd. Financial Results Mar/2017(FY2016) July 29, 2016 Today s Topics P.1 P.2 P.13 From the first quarter of this fiscal year, figures for Revenue Passengers Carried, ASK, RPK and Load
JAPAN AIRLINES Co., Ltd. Financial Results Mar/2017(FY2016) July 29, 2016 Today s Topics P.1 P.2 P.13 From the first quarter of this fiscal year, figures for Revenue Passengers Carried, ASK, RPK and Load
FY18 H1 Results 9 MAY TUI Cruises, Preikestolen plateau. Norway
 FY18 H1 Results 9 MAY 2018 TUI Cruises, Preikestolen plateau. Norway FORWARD-LOOKING STATEMENTS This presentation contains a number of statements related to the future development of TUI. These statements
2017 Half-Yearly Results
 2017 Half-Yearly Results Presentation 4th August 2017 Agenda Speakers: Robert Wong, Chief Executive & Simon Dixon, Chief Financial Officer 1. 2017 Half-Yearly Highlights 2. Investment Properties 3. Development
JET AIRWAYS (I) LTD. Presentation on Financial Results Q4 FY08
 LTD. Presentation on Financial Results Q4 FY08") JET AIRWAYS (I) LTD Presentation on Financial Results Q4 FY08 June 24, 2008 1 1 1 Agenda Domestic operating environment Jet Airways performance highlights JetLite performance highlights Consolidated Jet
JET AIRWAYS (I) LTD Presentation on Financial Results Q4 FY08 June 24, 2008 1 1 1 Agenda Domestic operating environment Jet Airways performance highlights JetLite performance highlights Consolidated Jet
INTRODUCTION TO MERLIN ENTERTAINMENTS PLC MARCH MERLIN ENTERTAINMENTS PLC : Introduction to Merlin Entertainments
 INTRODUCTION TO MERLIN ENTERTAINMENTS PLC MARCH 2018 CONTENTS 1. Summary Investment Highlights 2. Introduction to Merlin 3. Six Strategic Growth Drivers 4. Brands and Assets 5. Financial Dynamics and Performance
Recovery on track, continued strengthening in most segments. Record Jetstar and Frequent Flyer earnings highlight value of portfolio
 Qantas Full Year 2010 Results Presentation Overview Underlying PBT 1 more than tripled to $377m in line with guidance Delivering against strategic priorities Recovery on track, continued strengthening
For personal use only
 ASX and Media Release QANTAS DELIVERS RECORD FIRST HALF PROFIT, INVESTS IN AIRCRAFT AND TRAINING Sydney, 22 February 2018 Underlying Profit Before Tax: $976 million (up 15%) Record results for Qantas Domestic,
AEROFLOT ANNOUNCES FY 2017 IFRS FINANCIAL RESULTS
 AEROFLOT ANNOUNCES FY 2017 IFRS FINANCIAL RESULTS Moscow, 1 March 2018 Aeroflot Group ( the Group, Moscow Exchange ticker: AFLT) today publishes its audited financial statements in accordance with International
Financial Results 1 st Quarter Mar/2016 (FY2015) 30 July, 2015
 30 July, 2015") Financial Results Mar/2016 (FY2015) 30 July, 2015 Today s Topics P.2 P.3 P.15 1 Overview of FY Mar/2016 Financial Results Operating Revenue Operating Profit 320 307.0 +4.9Bn (+1.6%) 312.0 50 +17.6Bn (+94.6%)
Financial Results Mar/2016 (FY2015) 30 July, 2015 Today s Topics P.2 P.3 P.15 1 Overview of FY Mar/2016 Financial Results Operating Revenue Operating Profit 320 307.0 +4.9Bn (+1.6%) 312.0 50 +17.6Bn (+94.6%)
KOREAN AIR 4Q17 FINANCIAL RESULTS
 KOREAN AIR 4Q17 FINANCIAL RESULTS 1 Disclaimer This presentation is for informational purposes only, contains preliminary financial and other information about Korean Air Lines Co., Ltd. and is subject
AerCap Holdings N.V. April 11, 2015
 AerCap Holdings N.V. April 11, 2015 Disclaimer Incl. Forward Looking Statements & Safe Harbor This presentation contains certain statements, estimates and forecasts with respect to future performance and
Centurion Corporation Limited
 Centurion Corporation Limited Corporate Presentation 6 January 2014 Disclaimer This presentation and the accompanying presentation materials (if any) ("Presentation") are made for informational purposes,
2017 Amadeus IT Group and its affiliates and subsidiaries. Amadeus 2016 Results. February 24, 2017
 Amadeus 2016 Results February 24, 2017 Disclaimer _ This presentation may contain certain statements which are not purely historical facts, including statements about anticipated or expected future revenue
JAPAN AIRLINES Co., Ltd. Financial Results 1 st Quarter Mar/2018(FY2017)
") JAPAN AIRLINES Co., Ltd. Financial Results Mar/2018(FY2017) July 31, 2017 Today s Topics P.1 P.2 P.3 P.4 P.6 P.15 Overview of Financial Results for (FY2017) 1 st quarter resulted in an increase in both
JAPAN AIRLINES Co., Ltd. Financial Results Mar/2018(FY2017) July 31, 2017 Today s Topics P.1 P.2 P.3 P.4 P.6 P.15 Overview of Financial Results for (FY2017) 1 st quarter resulted in an increase in both
Q Earnings Financial Results for the First Quarter Ended June 30, July 28, 2016 OMRON Corporation
 Q1 2016 Earnings Financial Results for the First Quarter Ended June 30, 2016 July 28, 2016 OMRON Corporation Summary Q1 Results Both sales and operating income are in line with internal plan (decreased
2017 Amadeus IT Group and its affiliates and subsidiaries. Amadeus 2016 Results. February 24, 2017
 Amadeus 2016 Results February 24, 2017 Disclaimer _ This presentation may contain certain statements which are not purely historical facts, including statements about anticipated or expected future revenue
HATTEN LAND LIMITED. Shaping the Future, Melaka and Beyond. FY2017 Results. Corporate Presentation 17 August 2017
 HATTEN LAND LIMITED Shaping the Future, Melaka and Beyond FY2017 Results Corporate Presentation 17 August 2017 Disclaimer Information in this presentation may contain forward-looking statements that reflect
2016 HALF YEAR RESULTS. Mandarin Oriental Hotel Group
 2016 HALF YEAR RESULTS Mandarin Oriental Hotel Group 2016 Half Year Results Highlights US $ m June 2016 June 2015 Combined Total Revenue * 644 641 Underlying EBITDA 71 82 * Includes revenue from the Group
ABX. Holdings, Inc. BB&T Transportation Conference. February 2008
 ABX Holdings, Inc. BB&T Transportation Conference February 2008 1 Safe Harbor Statement Except for historical information contained herein, the matters discussed in this presentation contain forward-looking
75 Years of Thrills and Entertainment. The Rank Group Plc Preliminary Results to 30 June 2012
 75 Years of Thrills and Entertainment The Rank Group Plc Preliminary Results to 30 June 2012 Agenda Introduction Ian Burke, chairman and chief executive Review of financial results Clive Jennings, finance
TUI GROUP INVESTOR PRESENTATION
 TUI GROUP INVESTOR PRESENTATION German Investment Conference UniCredit / Kepler Munich, 26-27 September 2012 Future-related statements This presentation contains a number of statements related to the future
Parques Reunidos Expands to Australia with the Acquisition of Wet n Wild Sydney July 2018
 Parques Reunidos Expands to Australia with the Acquisition of Wet n Wild Sydney July 2018 Disclaimer This document does not constitute or form part of any purchase, sales or exchange offer, nor is it an
Q3 Results 2015/ August 2016 Media Call. Tulum, Mexico
 Q3 Results 2015/16 11 August 2016 Media Call Tulum, Mexico TUI Group Vertically integrated model demonstrates resilience Good performance in the quarter further demonstrating the resilience of our vertically
2016 ANNUAL RESULTS. Mandarin Oriental Hotel Group
 2016 ANNUAL RESULTS Mandarin Oriental Hotel Group 2016 Annual Results Highlights US $ m 2016 2015 Combined Total Revenue * 1,324 1,335 Group s Total Revenue # 597 607 Underlying EBITDA 158 188 * Includes
THE GO-AHEAD GROUP PLC HALF YEAR RESULTS FOR THE SIX MONTHS ENDED 29 DECEMBER 2018
 THE GO-AHEAD GROUP PLC HALF YEAR RESULTS FOR THE SIX MONTHS ENDED 29 DECEMBER 2018 BUSINESS OVERVIEW Continued good progress made in all three strategic pillars: protect and grow the core; win new bus
AerCap Holdings N.V. Keith Helming Chief Financial Officer. Wachovia Securities Equity Conference June 23, 2008
 AerCap Holdings N.V. Keith Helming Chief Financial Officer Wachovia Securities Equity Conference June 23, 2008 Forward Looking Statements & Safe Harbor This presentation contains certain statements, estimates
1Q FY2014/15. Financial Results Presentation. 13 August 2014 S Y D N E Y M E L B O U R N E B R I S B A N E C A I R N S
 1Q FY2014/15 Financial Results Presentation 13 August 2014 S Y D N E Y M E L B O U R N E B R I S B A N E C A I R N S B E I J I N G T O K Y O O S A K A S I N G A P O R E Disclaimer This presentation on
2011 Full Year Result
 2011 Full Year Result 23 February 2012 CEO Brett Chenoweth CFO Peter Myers 1 Financial results for 2011 FY 2011 AUD millions 2011 2010 Δ% Revenue 1,072.4 1,059.1 1% EBITDA* 208.9 244.3 (14%) EBIT* 171.4
SAS AB Q December 2018
 SAS AB Q4 2018 4 December 2018 Q4 financial highlights Q4 POSITIVES Q4-18 CHANGE VS. Q4-17 Record number of passengers Total revenue up SEK 1bn vs. LY Yield (nominal) up 5.1% vs. LY RASK (nominal) up 7.0%
Norwegian Air Shuttle ASA
 Norwegian Air Shuttle ASA Q1 2018 Presentation 26 April 2018 Highlights Q1 2018 Successfully completed private placement of NOK 1.3 billion Added two 737-800s and six 787-9s to operations Launched interline
Annual Results Air New Zealand
 Annual Results 2011 Air New Zealand Highlights Normalised earnings* $75m Net cash position of $860m Operating cash flow down 5% Gearingat467% at 46.7% Final dividend 2.5 cents per share (unimputed) New
IAG results presentation. Quarter Three st October 2014
 IAG results presentation Quarter Three 2014 31 st October 2014 Q3 financial summary OPERATING PROFIT TOTAL UNIT REVENUE PAX UNIT REVENUE 900m (reported, pre-exceptional items) -1.9% (constant FX) -0.9%
Quarter Interim Management Statement. 28 July 2010
 Quarter 3 2010 Interim Management Statement 28 July 2010 Week 4 priorities and initial impressions Priorities: Engage with staff, shareholders, customers and key suppliers Mitigation plan for recent operational
Main Points in the Results for FY2015
 0 1 2 Main Points in the Results for FY2015 Operating profit increased to 75.4 billion yen, exceeding the goal of 75.0 billion yen for the final year of the medium-term management plan in the first year
Aer Lingus Group plc. Interim Management Statement
 Aer Lingus Group plc ISE: EIL1 LSE: AERL Interim Management Statement Dublin and London, 4 th May 2010: Aer Lingus Group plc ( Aer Lingus or the Group ) today issues an un-audited interim management statement
QANTAS DELIVERS STRONG FIRST HALF RESULT DESPITE HIGHER FUEL BILL
 ASX and Media Release Sydney, 21 February 2019 QANTAS DELIVERS STRONG FIRST HALF RESULT DESPITE HIGHER FUEL BILL Underlying Profit Before Tax: $780 million (down $179 million) Statutory Profit Before Tax: