NYSE: SIX Short Recommendation
|
|
|
- Archibald Richards
- 6 years ago
- Views:
Transcription


1 NYSE: SIX Short Recommendation Tim Krauter 2018 Amy Ran 2019 Nick Palmer 2020 Sean Lee 2020 Yash Bhate
2 Agenda Negative a. Season Pass Penetration b. Rival Parks c. International Expansion d. Taxes and Cash Usages 2


3 1 Season Pass Penetration 2 Rival Domestic Parks 3 International Expansion 4 Taxes and Cash Usage Misrepresentation of attendance growth and failure to account for season pass revenue recognition change SIX s largest park Great Adventure is vulnerable to rival park American Dream Unrealistic projected ticket prices and goals and inability to reach Project 750 Overleveraged and lack of future tax redemption Price Target Base case weighted price target of $34.91, implying a 43.2% downside 3

4 4


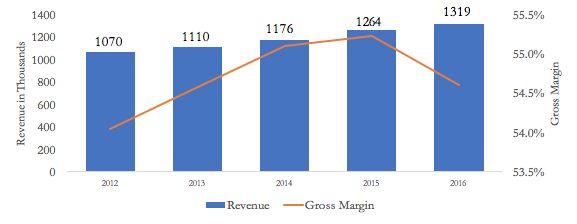
5 Products and Offerings Revenue and Profitability Revenue Breakdown Theme Park Admissions Food & Merchandise Sponsorship, Licensing & Fees Accommodations Revenue Seasonal 54% 40% 5% 1% The business is also inherently seasonal with ~72% of SIX s revenues coming in Q2/Q3 Set to change with new revenue recognition standards 5


6 Historical Growth SIX stated it will not build new domestic parks and growth has been by creative means like: Introducing off-season events Selling non - core assets Licensing the SIX brand to third parties Regional Focus Bankruptcy June 2009: Filed for Chapter 11 bankruptcy due to: Excessive leverage of 11.8x EBITDA Economic recession Attendance, revenue, and EBITDA were down 6%, 11%, and 28%, respectively Restrictive covenants, put in place to avoid future defaults, will make financing cash obligations challenging 16 regional parks in the United States 2 in Mexico and Canada Serves as a local attraction with 85% of guests residing within 150 miles of each park 6


7 Broad Set of Competitors Competes for discretionary spending dollars with a broad set of entertainment providers including: Family entertainment Gaming zones Sports venues Highly susceptible to swings in discretionary income: a. $ mm to build a typical park b. High maintenance Capex c. Considerable fixed costs Shift to International Parks Outlook Sensitivity to capacity utilizatio New locations: China and Dubai International parks historically take 3-5 years to achieve operating profitability Challenges exporting American theme park concept to international markets New attractions drive repeat attendance since domestic growth opportunities are limited Top 25 theme parks in the U.S. with YoY attendance declines Similar trends in APAC and EMEA Catalsts 7

8 8


9 Season Passes Higher Penetration SIX is increasing the penetration of season tickets by lowering prices Effectively SIX is lowering unique attendance by 5% per year, which is the true driver of revenue Revenue Recognition SIX recognizes new season pass revenue based on attendance, but recurring passes are booked as even monthly subscription This effectively smoothes revenue and EPS, but all analyst still model revenue recognition based on attendance leading to catastrophic misses for Q2 and Q3 9


10 Rival Parks Three New Parks Three new rival parks are opening in 2018 and 2019 near Six Flag Parks SIX s largest park Great Adventure, which brings in 21% of revenue, is extremely vulnerable to a planned rival park called American Dream American Dream Two indoor theme parks, Lego-land Discovery Center, indoor ski slope, and indoor water park Integrated shopping malls, restaurants, and ice rink and a full Sea Life Aquarium 10

11 Rival Parks American Dream American Dream is on average a one hour closer drive for 75% of Great Adventure s population basin Surveys indicate a 20-30% drop in attendance and comps show a possible 40-60% drop in attendance High fixed cost could lead to 25% reduction in FCF Analyst Miss Only recently was the park reconfigured as a theme park Only recently became fully funded SIX has never mentioned the park in an investor call and has continuously denied the possibility of a new rival park 11

12 International Expansions Unreasonable Franchising Expectation Unrealistic Project 750 Goal in Licensing Key to Reaching Project Heavy Reliance on Success in Dubai 3 International Expansion to Disappoint Assuming $100m EBITDA growth in U.S. Parks, international licensing fees have to provide at least $105m to meet Project 750 Wells Fargo Analyst: Each international park is expected to contribute $10MM-$20MM/year post-opening = Improbable Expectations 12


13 International Expansions Flawed Pricing of Upcoming Dubai Park Significant Competition IMG World of Adventure Opened in 2016 Ferrari World Abu Dhabi a. Forecasts less than half visitors than Six Flags b. Boasts Formula Rossa, world s fastest rollercoaster at 149mph c. Indoors vs. Six Flags Dubai being outdoors Seaworld Abu Dhabi Opening in 2022 Legoland Water Park Hollywood Theme Park Warner Bros. Park 13


14 Taxes and Cash Usages NOL Carryover $1.2 B of NOLs on the balance sheet from bankruptcy Expected to start paying an effective tax rate of 33.6%, a huge hit to cash flow Significant Cash Usages SIX has significant cash requirement due to: a. Capital intensive rides b. New rides driving re-attendance c. Maintaining existing rides Cannot cut capital expenditures without sacrificing revenue and attendance Dividend Unsustainability Payout ratio of 250% Leveraging for an unstable dividend Share repurchases Repurchase shares to partially offset SBC dilution Since SIX is levered 4.7x (highest in industry), they: Cut dividends Decrease share repurchases Reduce capital expenditure 14

15 15
16 Valution Drivers and Assumptions Drivers Key Assumptions: Base Case Attendance Unique attendance and season pass penetration Attendance Use management guidance on season passes & reduce attendance from rival parks In Park In park spending on food and merchandise In Park We reduce in park spending at a rate lower than the reduction in attendance Costs Operating cost, taxes, and CapEx Costs Fixed cost compress margins, tax rate increases to 33%, and CapEx says flat Key Assumptions: Bear Case Key Assumptions: Bull Case Attendance Attendance falls more dramatically as all rival parks are successful Attendance Attendance increases as rival parks do not open In Park In park spending at a faster rate than the reduction in attendance In Park In park spending increases due to new brands and IP Costs Fixed cost compress margins, tax rate increases to 33%, and CapEx says flat Costs Margins stays constant, tax rate increases to 33%, and CapEx stays flat 16


17 Base, Bear, and Bull Case Sensitivity Analysis Bear Target: $31.31 Implied Upside: % Base Target: $34.91 Implied Upside: % Bull Target: $70.55 Implied Upside: 14.20% Comps Analysis Outcome 17
United Continental Holdings, Inc (NYSE: UAL) ONE YEAR PRICE RANGE : $ LAST PRICE: $ ANALYST RATING: Sell
 ONE YEAR PRICE RANGE : $ LAST PRICE: $ ANALYST RATING: Sell") United Continental Holdings, Inc (NYSE: UAL) ONE YEAR PRICE RANGE : $61.91 68.76 LAST PRICE: $68.39 ANALYST RATING: Sell VALUATION DATE: August 3, 2017 NEXT EARNINGS DATE: October 17, 2017 Investment Thesis:
United Continental Holdings, Inc (NYSE: UAL) ONE YEAR PRICE RANGE : $61.91 68.76 LAST PRICE: $68.39 ANALYST RATING: Sell VALUATION DATE: August 3, 2017 NEXT EARNINGS DATE: October 17, 2017 Investment Thesis:
1Q 2017 Earnings Call. April 18, 2017
 1Q 2017 Earnings Call April 18, 2017 Safe Harbor Statement Certain statements included in this presentation are forward-looking and thus reflect our current expectations and beliefs with respect to certain
2Q 2017 Earnings Call. July 19, 2017
 2Q 2017 Earnings Call July 19, 2017 Safe Harbor Statement Certain statements included in this presentation are forward-looking and thus reflect our current expectations and beliefs with respect to certain
Mark Shapiro Chief Executive Officer
 Mark Shapiro Chief Executive Officer Forward Looking Statements The information contained in this presentation, other than historical information, consists of forward-looking statements within the meaning
Investor Relations Update October 25, 2018
 General Overview Investor Relations Update Revenue The company expects its fourth quarter total revenue per available seat mile (TRASM) to be up approximately 1.5 to 3.5 percent year-over-year. Fuel Based
Southwest Airlines Co. (NYSE: LUV) ONE YEAR PRICE RANGE : $ $73.62 LAST PRICE: $ ANALYST RATING: Long. VALUATION DATE: July 13, 2017
 ONE YEAR PRICE RANGE : $ $73.62 LAST PRICE: $ ANALYST RATING: Long. VALUATION DATE: July 13, 2017") Southwest Airlines Co. (NYSE: LUV) ONE YEAR PRICE RANGE : $69.66 - $73.62 LAST PRICE: $62.08 ANALYST RATING: Long VALUATION DATE: July 13, 2017 NEXT EARNINGS DATE: July 27, 2017 Investment Thesis: Dominant
Southwest Airlines Co. (NYSE: LUV) ONE YEAR PRICE RANGE : $69.66 - $73.62 LAST PRICE: $62.08 ANALYST RATING: Long VALUATION DATE: July 13, 2017 NEXT EARNINGS DATE: July 27, 2017 Investment Thesis: Dominant
Investor Relations Update January 25, 2018
 General Overview Investor Relations Update Accounting Changes On January 1, 2018, the company adopted two new Accounting Standard Updates: (ASUs): ASU 2014-9: Revenue from Contracts with Customers (the
American Airlines Group Inc.
 American Airlines Group Inc. Deutsche Bank Leveraged Finance Conference October 4, 2017 Tom Weir Vice President, Treasurer Cautionary Statement Regarding Forward-Looking Statements and Information This
J.P. Morgan Aviation, Transportation and Industrials Conference
 J.P. Morgan Aviation, Transportation and Industrials Conference March 3, 08 Scott Kirby President Safe Harbor Statement Certain statements included in this presentation are forward-looking and thus reflect
2014 INTERIM RESULTS PRESENTATION
 2014 INTERIM RESULTS PRESENTATION 31 JULY 2014 1 Forward-Looking Statements Disclaimer The information contained in this presentation has not been independently verified and this presentation contains
Amadeus Jan-Jun 2017 Results. July 28, 2017
 Amadeus Jan-Jun 2017 Results July 28, 2017 Disclaimer This presentation may contain certain statements which are not purely historical facts, including statements about anticipated or expected future revenue
Parques Reunidos Corporate Presentation March 2016
 Parques Reunidos Corporate Presentation March 216 Disclaimer The information contained in this presentation (the Presentation ), including but not limited to forward-looking statements, is provided as
Results 2Q17. August 9, 2017
 Results 2Q17 August 9, 2017 2Q17 Highlights Indicators 2Q17 Var. x 2Q16 ASK (BN) 10.4-3.0% Traffic (000) 7,261-1.3% RPK (BN) 8.1 +0.5% Load Factor 77.9% +2.7 p.p. Yield (R$ cents) 23.2 +4.8% Pax Revenue
Corporate Presentation 2012/13 Interim Results
 Corporate Presentation 2012/13 Interim Results 26 February 2013 0 Disclaimer The information contained in this presentation is intended solely for your personal reference. Such information is subject to
OPERATING AND FINANCIAL HIGHLIGHTS. Subsequent Events
 Copa Holdings Reports Net Income of $103.8 million and EPS of $2.45 for the Third Quarter of 2017 Excluding special items, adjusted net income came in at $100.8 million, or EPS of $2.38 per share Panama
OPERATING AND FINANCIAL HIGHLIGHTS SUBSEQUENT EVENTS
 Copa Holdings Reports Financial Results for the Third Quarter of 2016 Excluding special items, adjusted net income came in at $55.3 million, or adjusted EPS of $1.30 per share Panama City, Panama --- November
FIRST QUARTER
 FIRST QUARTER 2007 1 WELCOME TO REZIDOR one of the fastest growing hotel companies in the world 300 250 200 150 100 FAST TRACK GROWTH FRESH & DYNAMIC MULTI-BRAND PORTFOLIO BRAND SEGMENT HOTELS ROOMS Upscale
Management Presentation. November 2018
 Management Presentation November 2018 Forward looking statements This presentation as well as oral statements made by officers or directors of Allegiant Travel Company, its advisors and affiliates (collectively
Minor International Public Company Limited
 Minor International Public Company Limited Management Discussion & Analysis MINT s financial performance as of 30th September 2008 Summary of Key Financial Performance 3Q08 Performance Minor International
Summary of Results for the First Quarter of FY2015/3
 Summary of for the First Quarter of FY2015/3 August 8, 2014 Tokyu Corporation (9005) http://www.tokyu.co.jp/ Contents Ⅰ.Executive Summary 2 Ⅱ.Conditions in Each Business 4 Ⅲ.Details of Financial for the
2014 IMS PRESENTATION
 2014 IMS PRESENTATION 18 SEPTEMBER 2014 1 Forward-Looking Statements Disclaimer The information contained in this presentation has not been independently verified and this presentation contains various
2007/08 Full Year Results Investor Briefing
 2007/08 Full Year Results Investor Briefing Highlights of Result Profit before tax up 46% to $1,408 million Up 36% on the reported result Margin improvement $3 billion of Sustainable Future Benefits achieved
OPERATING AND FINANCIAL HIGHLIGHTS SUBSEQUENT EVENTS
 Copa Holdings Reports Net Income of US$6.2 Million and EPS of US$0.14 for the Third Quarter of 2015 Excluding special items, adjusted net income came in at $37.4 million, or EPS of $0.85 per share Panama
Corporate Presentation
 Corporate Presentation 2010/11 Interim Results 22 February 2011 Bossini International Holdings Limited 堡獅龍國際集團有限公司 Disclaimer The information contained in this presentation is intended solely for your
CREDIT SUISSE GLOBAL INDUSTRIALS CONFERENCE DECEMBER 4, 2014
 CREDIT SUISSE GLOBAL INDUSTRIALS CONFERENCE DECEMBER 4, 2014 1 1 SAFE HARBOR This presentation contains statements of a forward-looking nature which represent our management's beliefs and assumptions concerning
Southwest Airlines (LUV) Analyst: Rebekah Zsiga Fall Recommendation: BUY Target Price until (12/31/2016): $62
 Analyst: Rebekah Zsiga Fall Recommendation: BUY Target Price until (12/31/2016): $62") Recommendation: BUY Target Price until (12/31/2016): $62 1. Reasons for the Recommendation After detailed analysis of Southwest Airlines Company I recommend that we move to buy further shares of stock
Recommendation: BUY Target Price until (12/31/2016): $62 1. Reasons for the Recommendation After detailed analysis of Southwest Airlines Company I recommend that we move to buy further shares of stock
Management Presentation. March 2016
 Management Presentation March 2016 Forward looking statements This presentation as well as oral statements made by officers or directors of Allegiant Travel Company, its advisors and affiliates (collectively
INVESTOR PRESENTATION. Imperial Capital Global Opportunities Conference September 2015
 INVESTOR PRESENTATION Imperial Capital Global Opportunities Conference September 2015 Forward-looking Statements This presentation contains forward-looking statements within the meaning of the Private
Thank you for participating in the financial results for fiscal 2014.
 Thank you for participating in the financial results for fiscal 2014. ANA HOLDINGS strongly believes that safety is the most important principle of our air transportation business. The expansion of slots
Investment Highlights
 Second Quarter 2014 Investment Highlights 1 Mexican airport portfolio positioned to take full advantage of global growth. 2 Diversified business model contributing to earnings resilience. 3 Well-defined
Summary of Results for the First Three Quarters FY2015/3
 Summary of Results for the First Three Quarters FY2015/3 February 10, 2015 Tokyu Corporation (9005) http://www.tokyu.co.jp/ Contents Ⅰ.Executive Summary 2 Ⅱ.Conditions in Each Business 5 Ⅲ.Details of Financial
Management Presentation. May 2013
 Management Presentation May 2013 Forward looking statements This presentation as well as oral statements made by officers or directors of Allegiant Travel Company, its advisors and affiliates (collectively
2017 Amadeus IT Group and its affiliates and subsidiaries. Amadeus 2016 Results. February 24, 2017
 Amadeus 2016 Results February 24, 2017 Disclaimer _ This presentation may contain certain statements which are not purely historical facts, including statements about anticipated or expected future revenue
1Q 2018 Earnings Call. April 18, 2018
 1Q 2018 Earnings Call April 18, 2018 Safe Harbor Statement Certain statements included in this presentation are forward-looking and thus reflect our current expectations and beliefs with respect to certain
JAPAN AIRLINES Co., Ltd. Financial Results 1 st Quarter Mar/2017(FY2016) July 29, 2016
 July 29, 2016") JAPAN AIRLINES Co., Ltd. Financial Results Mar/2017(FY2016) July 29, 2016 Today s Topics P.1 P.2 P.13 From the first quarter of this fiscal year, figures for Revenue Passengers Carried, ASK, RPK and Load
JAPAN AIRLINES Co., Ltd. Financial Results Mar/2017(FY2016) July 29, 2016 Today s Topics P.1 P.2 P.13 From the first quarter of this fiscal year, figures for Revenue Passengers Carried, ASK, RPK and Load
MERLIN ENTERTAINMENTS PLC 2018 SUMMER TRADING. Nick Varney Chief Executive Officer. Peppa Pig World of Play, Shanghai
 MERLIN ENTERTAINMENTS 2018 SUMMER TRADING UPDATE Nick Varney Chief Executive Officer MERLIN ENTERTAINMENTS PLC Peppa Pig World of Play, Shanghai FORWARD-LOOKING STATEMENTS DISCLAIMER The information contained
MGM Resorts International Reports Second Quarter Financial Results
 NEWS RELEASE MGM Resorts International Reports Second Quarter Financial Results 8/5/2014 Consolidated Adjusted EBITDA Increased 8%, Led By 10% Growth In Wholly Owned Domestic Resorts MGM China Declares
OPERATING AND FINANCIAL HIGHLIGHTS. Subsequent Events
 Copa Holdings Reports Financial Results for the First Quarter of 2016 Excluding special items, adjusted net income came in at US$69.9 million, or EPS of US$1.66 per share Panama City, Panama --- May 5,
Investment Highlights
 Third Quarter 2014 Investment Highlights 1 Mexican airport portfolio positioned to take full advantage of global growth. 2 Diversified business model contributing to earnings resilience. 3 Well-defined
Third Quarter 2015 Results
 Third Quarter 2015 Results Investment Highlights Positioned to take full advantage of global growth Diversified business model Well-defined strategy to capitalize on favorable industry dynamic Successful
2018 Amadeus IT Holding and its affiliates and subsidiaries. Amadeus 2017 Results. Feb 28, 2018
 Amadeus 2017 Results Feb 28, 2018 Disclaimer _ This presentation may contain certain statements which are not purely historical facts, including statements about anticipated or expected future revenue
AIR CANADA REPORTS THIRD QUARTER RESULTS
 AIR CANADA REPORTS THIRD QUARTER RESULTS THIRD QUARTER OVERVIEW Operating income of $112 million compared to operating income of $351 million in the third quarter of 2007. Fuel expense increased 49 per
Forward-looking Statements
 September 21, 2011 Forward-looking Statements This presentation contains certain forward-looking statements with respect to the Corporation. These forward-looking statements, by their nature, necessarily
IAG results presentation. Quarter One th May 2018
 IAG results presentation Quarter One 2018 4 th May 2018 Highlights Willie Walsh, Chief Executive Officer Highlights Another strong quarter performance with an operating profit of 280m (5.6% margin, +2.3pts)
Interim results. 11 May 2010
 Interim results 11 May 2010 Introduction Andy Harrison Chief Executive Officer Strong performance despite disruption Improvement in revenue, margins and cash Continued network improvement has driven better
Q Earnings Financial Results for the Third Quarter Ended December 31, January 29, 2015 OMRON Corporation
 Q3 2014 Earnings Financial Results for the Third Quarter Ended December 31, 2014 January 29, 2015 OMRON Corporation Contents 1. Summary 2. Q1-Q3 Results P. 2 P. 4 3. Full-Year Forecast P. 13 4. Corporate
OPERATING AND FINANCIAL HIGHLIGHTS
 Copa Holdings Reports Financial Results for the Fourth Quarter of 2015 Excluding special items, adjusted net income came in at $31.7 million, or EPS of $0.73 per share Panama City, Panama --- February
Analyst and Investor Conference Call Q Ulrik Svensson, CFO and Member of the Executive Board
 Analyst and Investor Conference Call Q2 2017 Ulrik Svensson, CFO and Member of the Executive Board Frankfurt, 2 August 2017 Disclaimer The information herein is based on publicly available information.
2007/08 Interim Results
 Bossini International Holdings Limited 2007/08 Interim Results For the six months ended 31 December 2007 Corporate Presentation 19 March 2008 0 Agenda Results Highlights Review of Operations Future Plans
OPERATING AND FINANCIAL HIGHLIGHTS
 Copa Holdings Reports Financial Results for the Fourth Quarter of 2018 Excluding special items, adjusted net profit came in at $44.0 million, or Adjusted EPS of $1.04 Panama City, Panama --- February 13,
Bank of America Merrill Lynch2016Transportation Conference
 Bank of America Merrill Lynch2016Transportation Conference United Continental Holdings, Inc. Doug Leo SVP Revenue Management, Pricing and Network Jonathan Ireland Managing Director Investor Relations May
Managing through disruption
 28 July 2016 Third quarter results for the three months ended 30 June 2016 Managing through disruption 3 months ended Like-for-like (ii) m (unless otherwise stated) Change 30 June 2016 30 June 2015 change
Summary o f Results for the First Half of FY2018
 Summary o f Results for the First Half of FY2018 November 9, 2018 (9005) https://www.tokyu.co.jp/ Contents Ⅰ.Executive Summary 2 Ⅱ.Conditions in Each Business 6 Ⅲ.Details of Financial Results for the 13
Interim Report 6m 2014
 August 11, 2014 Interim Report 6m 2014 Investors and Analysts Conference Call on August 11, 2014 Joachim Müller, CFO Latest ad-hoc release (August 4, 2014) Reduction of forecast, primarily due to a further
Analyst Presentation Schiphol Group 2006 Interim Financial Results
 Analyst Presentation Schiphol Group 2006 Interim Financial Results 24 August 2006 Interim Results Disclaimer This release may contain certain forward-looking statements with respect to the financial condition,
China Lodging Group (HTHT.US) Q4 and full year 2017 Earnings Call March 13, 2018
 Q4 and full year 2017 Earnings Call March 13, 2018") China Lodging Group (HTHT.US) Q4 and full year 2017 Earnings Call March 13, 2018 Agenda Strategy Review Operational and Financial Review Q & A Appendix 1 Strong RevPAR Growth Driven by ADR + Occupancy
China Lodging Group (HTHT.US) Q4 and full year 2017 Earnings Call March 13, 2018 Agenda Strategy Review Operational and Financial Review Q & A Appendix 1 Strong RevPAR Growth Driven by ADR + Occupancy
Q Earnings Financial Results for the First Quarter Ended June 30, July 28, 2016 OMRON Corporation
 Q1 2016 Earnings Financial Results for the First Quarter Ended June 30, 2016 July 28, 2016 OMRON Corporation Summary Q1 Results Both sales and operating income are in line with internal plan (decreased
2018 INTERIM RESULTS PRESENTATION Anne-Françoise Nesmes, Chief Financial Officer MERLIN ENTERTAINMENTS PLC. Peppa Pig Land, Gardaland, Italy
 MERLIN ENTERTAINMENTS 2018 INTERIM RESULTS PRESENTATION Anne-Françoise Nesmes, Chief Financial Officer MERLIN ENTERTAINMENTS PLC Peppa Pig Land, Gardaland, Italy FORWARD-LOOKING STATEMENTS DISCLAIMER The
Investor Update September 2017 PARTNER OF CHOICE EMPLOYER OF CHOICE INVESTMENT OF CHOICE
 Investor Update September 2017 PARTNER OF CHOICE EMPLOYER OF CHOICE INVESTMENT OF CHOICE 1 Forward Looking Statements In addition to historical information, this presentation contains forward-looking statements
OPERATING AND FINANCIAL HIGHLIGHTS
 Copa Holdings Reports Net Income of US$32.0 Million and EPS of US$0.72 for the Second Quarter of 2012 Excluding special items, adjusted net income came in at $58.6 million, or EPS of $1.32 per share Panama
Corporate Presentation 2015/16 Interim Results
 Corporate Presentation 2015/16 Interim Results 24 February 2016 0 Disclaimer The information contained in this presentation is intended solely for your personal reference. Such information is subject to
RESULTS RELEASE 20 August GENTING HONG KONG GROUP ANNOUNCES FIRST HALF RESULTS FOR 2015 Highlights
 RESULTS RELEASE 20 August 2015 FOR IMMEDIATE RELEASE INTERNATIONAL GENTING HONG KONG GROUP ANNOUNCES FIRST HALF RESULTS FOR 2015 Highlights The commentary below is prepared based on a comparison of the
Leveraging Kiwi capability on the world stage. David Banfield/Deidre Campbell
 Leveraging Kiwi capability on the world stage David Banfield/Deidre Campbell February March 2016 Early insights - January 2014 Business declining in a growing market Business that needed support and to
Amadeus Jan-Jun 2018 Results
 2018 Amadeus IT Holding and its affiliates and subsidiaries Amadeus Jan-Jun 2018 Results July 27, 2018 Disclaimer This presentation may contain certain statements which are not purely historical facts,
AIR CANADA REPORTS FIRST QUARTER RESULTS
 AIR CANADA REPORTS FIRST QUARTER RESULTS As a result of the deconsolidation of Jazz effective May 24, 2007, Air Canada s consolidated results for the first quarter of 2008 are not directly comparable to
AIR CANADA REPORTS SECOND QUARTER RESULTS
 AIR CANADA REPORTS SECOND QUARTER RESULTS SECOND QUARTER OVERVIEW Passenger revenue increased 5 per cent to $2.5 billion, due to growth in traffic and yield. Excluding fuel expense, unit cost declined
2017 Annual Meeting of Stockholders
 2017 Annual Meeting of Stockholders Doug Parker Chairman and Chief Executive Officer American Airlines Group Inc. June 14, 2017 Cautionary Statement Regarding Forward-Looking Statements This document includes
Amadeus Jan-Mar 2018 Results
 Amadeus Jan-Mar 2018 Results May 4, 2018 Disclaimer This presentation may contain certain statements which are not purely historical facts, including statements about anticipated or expected future revenue
CONTACT: Investor Relations Corporate Communications
 NEWS RELEASE CONTACT: Investor Relations Corporate Communications 435.634.3200 435.634.3553 Investor.relations@skywest.com corporate.communications@skywest.com SkyWest, Inc. Announces Second Quarter 2017
OPERATING AND FINANCIAL HIGHLIGHTS. Subsequent Events
 Copa Holdings Reports Net Income of US$113.1 Million and EPS of US$2.57 for the First Quarter of 2015 Excluding special items, adjusted net income came in at US$106.0 million, or EPS of US$2.41 per share
Management Presentation. September 2015
 Management Presentation September 2015 Forward looking statements This presentation as well as oral statements made by officers or directors of Allegiant Travel Company, its advisors and affiliates (collectively
Copa Holdings Reports Net Income of $49.9 million and EPS of $1.18 for the Second Quarter of 2018
 Copa Holdings Reports Net Income of $49.9 million and EPS of $1.18 for the Second Quarter of 2018 Panama City, Panama --- Aug 8, 2018. Copa Holdings, S.A. (NYSE: CPA), today announced financial results
E190 REPLACEMENT & FLEET UPDATE JULY 11, 2018
 1 E190 REPLACEMENT & FLEET UPDATE JULY 11, 2018 SAFE HARBOR This presentation contains forward-looking statements within the meaning of the Private Securities Litigation Reform Act of 1995, Section 27A
Mr. Adel Al-Banwan Deputy CEO
 The 8th Forum for Listed Companies and Analysts ALAFCO Aviation Lease and Finance Co. Mr. Adel Al-Banwan Deputy CEO (18 th April 2016) ALAFCO Aviation Lease and Finance Company K.S.C.P. ALAFCO Aviation
Financial Results 1 st Quarter Mar/2016 (FY2015) 30 July, 2015
 30 July, 2015") Financial Results Mar/2016 (FY2015) 30 July, 2015 Today s Topics P.2 P.3 P.15 1 Overview of FY Mar/2016 Financial Results Operating Revenue Operating Profit 320 307.0 +4.9Bn (+1.6%) 312.0 50 +17.6Bn (+94.6%)
Financial Results Mar/2016 (FY2015) 30 July, 2015 Today s Topics P.2 P.3 P.15 1 Overview of FY Mar/2016 Financial Results Operating Revenue Operating Profit 320 307.0 +4.9Bn (+1.6%) 312.0 50 +17.6Bn (+94.6%)
CONTACT: Investor Relations Corporate Communications
 NEWS RELEASE CONTACT: Investor Relations Corporate Communications 435.634.3200 435.634.3553 Investor.relations@skywest.com corporate.communications@skywest.com SkyWest, Inc. Announces Fourth Quarter 2017
2010 ANNUAL GENERAL MEETING. May 4, 2010
 2010 ANNUAL GENERAL MEETING May 4, 2010 FORWARD-LOOKING STATEMENT Certain information in this presentation and statements made during this presentation, including any question and answer session, may contain
10TH ANNUAL WOLFE RESEARCH GLOBAL TRANSPORTATION CONFERENCE MAY 23, 2017
 1 10TH ANNUAL WOLFE RESEARCH GLOBAL TRANSPORTATION CONFERENCE MAY 23, 2017 SAFE HARBOR This presentation contains forward-looking statements within the meaning of the Private Securities Litigation Reform
INVESTOR PRESENTATION FOURTH QUARTER 2017 RESULTS
 INVESTOR PRESENTATION FOURTH QUARTER 2017 RESULTS This presentation may contain forward-looking information and statements. Forward-looking statements are statements that are not historical facts. These
N o r w e g i a n C r u i s e L i n e H o l d i n g s
 N o r w e g i a n C r u i s e L i n e H o l d i n g s N A S D A Q : N C L H B U Y a t ( $ 5 8. 7 4 ) October 21 st, 2017 3J Capital Jordan Li, Senior Associate Email : Jordan.Li@mail.utoronto.ca Jodie
Istanbul Technical University Air Transportation Management, M.Sc. Program Aviation Economics and Financial Analysis Module 2 November 2014
 Sources of Finance Istanbul Technical University Air Transportation Management, M.Sc. Program Aviation Economics and Financial Analysis Module 2 November 2014 Outline A. Introduction to airline finance
Copa Holdings Reports Record Earnings of US$41.8 Million for 4Q06 and US$134.2 Million for Full Year 2006
 Copa Holdings Reports Record Earnings of US$41.8 Million for 4Q06 and US$134.2 Million for Full Year 2006 Panama City, Panama --- March 7, 2007. Copa Holdings, S.A. (NYSE: CPA), parent company of Copa
Presentation on Results for the 2nd Quarter FY Idemitsu Kosan Co.,Ltd. November 14, 2018
 Presentation on Results for the 2nd Quarter FY 2018 Idemitsu Kosan Co.,Ltd. November 14, 2018 Table of Contents 1. FY 2018 2nd Quarter Financials (1) Overview (2) Segment Information 2. Reference Materials
ASUR 2Q11 PASSENGER TRAFFIC UP 2.89% YOY
 In Mexico ASUR Lic. Adolfo Castro (52) 5552-84-04-08 acastro@asur.com.mx In the U.S. Breakstone Group Susan Borinelli (646) 330-5907 sborinelli@breakstone-group.com ASUR 2Q11 PASSENGER TRAFFIC UP 2.89%
2016 PRELIMINARY RESULTS PRESENTATION
 2016 PRELIMINARY RESULTS PRESENTATION 2 MARCH 2017 2016 HIGHLIGHTS Results in line with expectations Confident in our growth strategy and outlook 2016 performance testament to the benefits of a diverse
Forward-looking Statements
 March 23, 2011 Forward-looking Statements This presentation contains certain forward-looking statements with respect to the Corporation. These forward-looking statements, by their nature, necessarily involve
Copa Holdings Reports Net Income of US$51.9 Million for the Fourth Quarter of 2008 and US$152.2 Million for Full Year 2008
 Copa Holdings Reports Net Income of US$51.9 Million for the Fourth Quarter of 2008 and US$152.2 Million for Full Year 2008 Panama City, Panama --- February 19, 2009. Copa Holdings, S.A. (NYSE: CPA), parent
CONTACT: Investor Relations Corporate Communications
 NEWS RELEASE CONTACT: Investor Relations Corporate Communications 435.634.3200 435.634.3553 Investor.relations@skywest.com corporate.communications@skywest.com SkyWest, Inc. Announces Second Quarter 2016
AIR CANADA REPORTS 2010 THIRD QUARTER RESULTS; Operating Income improved $259 million or 381 per cent from previous year s quarter
 AIR CANADA REPORTS 2010 THIRD QUARTER RESULTS; Operating Income improved $259 million or 381 per cent from previous year s quarter MONTRÉAL, November 4, 2010 Air Canada today reported operating income
UBS Latin American New Opportunities Conference. June 11 th -12 th, 2007
 UBS Latin American New Opportunities Conference June 11 th -12 th, 2007 Company Overview OMA operates a diversified portfolio of 13 airports distributed throughout Northern and Central Mexico and is diversified
China Lodging Group (HTHT.US) Investor Presentation March 2016
 Investor Presentation March 2016") China Lodging Group (HTHT.US) Investor Presentation March 2016 Agenda Our Vision Who We Are Company Highlights Strategic Focus Operational and Financial Review Q & A 1 Our Vision We will build a world-class,
China Lodging Group (HTHT.US) Investor Presentation March 2016 Agenda Our Vision Who We Are Company Highlights Strategic Focus Operational and Financial Review Q & A 1 Our Vision We will build a world-class,
OPERATING AND FINANCIAL HIGHLIGHTS
 Copa Holdings Reports Net Income of US$18.6 Million and EPS of US$0.42 for the Second Quarter of 2010 Excluding special items, adjusted net income came in at $26.3 million, or $0.60 per share Panama City,
M2 Group Ltd 2014 Interim Results
 M2 Group Ltd 2014 Interim Results 24 February 2014 Geoff Horth, CEO Presentation Content Record Financial Performance Strong Organic Growth FY14 Priorities and Guidance Slide 2, 24 February 2014 Record
USD thousand Q Q Change % Change 12M 2015
 EBITDA POSITIVE IN FIRST-QUARTER EBITDA positive by USD 1.1 million, as compared to a negative outcome of USD 2.3 million last year Positive impact of low fuel prices on performance 21% increase in passenger
Azul Increases Net Income by R$152 Million in 1Q18 Operating margin was a record 12.5% despite the 21% increase in oil year over year
 Azul Increases Net Income by R$152 Million in 1Q18 Operating margin was a record 12.5% despite the 21% increase in oil year over year São Paulo, May 10, Azul S.A., Azul, (B3:AZUL4, NYSE:AZUL) the largest
Creating Happiness. Business Model. Business Mission
 Business Model Creating Happiness Oriental Land Co., Ltd. (OLC) was established with a strong aspiration to create a large-scale recreational facility, right here in Japan when Maihama was still a part
INVESTOR PRESENTATION. May 2015
 INVESTOR PRESENTATION May 2015 Forward-looking Statements This presentation contains forward-looking statements within the meaning of the Private Securities Litigation Reform Act of 1995 that reflect the
UBS 14 th Global Emerging Markets Conference. New York, November 2016
 UBS 14 th Global Emerging Markets Conference New York, November 2016 This presentation may include forward-looking comments regarding the Company s business outlook and anticipated financial and operating
Spirit Airlines Reports First Quarter 2017 Results
 Spirit Airlines Reports First Quarter 2017 Results MIRAMAR, Fla., April 28, 2017 - Spirit Airlines, Inc. (NASDAQ: SAVE) today reported first quarter 2017 financial results. GAAP net income for the first