Group Presentation. April 2012
|
|
|
- Phillip Morgan
- 5 years ago
- Views:
Transcription
1 Group Presentation April 2012
2 Key Investment highlights Leading infrastructure player in Greece with an increasing international footprint Healthy capital structure Well-balanced diversified portfolio of activities Significant growth prospects from participation in Eldorado Gold / Hellas Gold Unrivalled construction knowhow (backlog c. 3bn) Growth prospects in Waste Management and Renewable Energy Strong expected dividend stream from mature concessions (Attiki Odos, Rio Antirio bridge)
3 Recent developments New developments regarding GOLD ELLAKTOR sold a stake 7.07 to Qatar Holding (October 2011) ELLAKTOR indirectly controls 2.7% in Eldorado Gold ( ELD ) Working towards resolving the issues of the suspended BOT projects of Olympia Odos and Aegean Motorway Arranging the financing of the awarded PPP waste management project at St Petersburg 9eld0029 3
4 Table of contents 1. Group overview Pages 5~8 2. Undisputed leader in the Greek construction sector Pages 9~11 3. Leading player in Greek concessions Pages 12~15 4. Market leader in Waste Management Services Pages 16~18 5. Significant growth prospects in the Energy sector Pages 19~21 6. Real Estate & Other Investments Pages 22~23 7. Group financials & Shareholder information Pages 24~29 9eld0029 4
5 Key milestones in the ELLAKTOR Group history 1950 s & 1960 s Establishment of TEB, ELLINIKI TECHNODOMIKI and AKTOR Concession for ATTIKI ODOS and RION-ANTIRION Bridge signed Merger of TEB, ELLINIKI TECHNODOMIKI and AKTOR Entry in the Renewable Energy sector (ELTECH ANEMOS) Construction activities spun-off under AKTOR Set up of the Real Estate arm of the Group: REDS Acquisition of a stake in MONT PARNES CASINO Entry in the Waste Management sector (HELECTOR) Acquisition of a stake in HELLAS GOLD First construction contracts awarded in Romania and the Middle East (Kuwait) Establishment of AKTOR, subsidiary in the Middle East area Acquisition of HERHOF by HELECTOR Participation in 3 out of 5 concession projects awarded in Greece Acquisition of PANTECHNIKI, leading to controlling stake in ATTIKI ODOS (59.2%) Concession activities spun off as AKTOR CONCESSIONS Swapped a 30% stake in HELLAS GOLD with a 20% stake in EUROREAN GOLDFIELDS Change of name from ELLINIKI TECHNODOMIKI TEB SA to ELLAKTOR SA Commencement of MOREAS, OLYMPIA ODOS and AEGEAN MOTORWAY concessions HELECTOR SA - AKTOR SA - AKTOR CONCESSIONS SA has signed contract for the project Construction and Operation of the Household Waste Management System in Saint Petersburg Final EIS (Environmental Impact Study, which concerns HELLAS GOLD mining) has been approved by the Ministry of Environment & Climate Change, on 26th of July 2011, sale of a 7.07% stake in EGU to Qatar Holding (Oct.2011) European Goldfields ( EGU ) agreed to proceed to a transaction with Eldorado Gold ( ELD ) (Dec. 2011) and the transaction was approved by EGU s and ELD s Extraordinary General Meetings (21st February 2012) 9eld0029 5
6 Ellaktor Group organisational structure Construction Concessions Waste management Energy Real estate Other holdings 100% AKTOR SA 100% AKTOR CONCESSIONS 80% HELECTOR SA 86% ELLINIKI TECHNODOMIKI ANEMOS 21.95% ELPEDISON POWER 55.46% REDS 15.3% HELLENIC CASINO OF PARNITHA 100% (1) HELLENIC QUARRIES 2.7 % ELDORADO 5% HEL. GOLD (2) 100% BIOSAR No 1 in Greece No 1 in Greece Leader in Greece & Cyprus Significant growth prospects Additional significant real estate portfolio Hidden values 4,054 full time employees with activities in more than 14 countries Listed on the ASE with a market capitalization of ~ 225 m (3) (1) Indirect participation via AKTOR (2) Direct and indirect participation (via AKTOR) (3) As of 28 th of March eld Ellaktor is the leading, diversified, regional infrastructure player
7 Ellaktor Group key financials (Amounts in m) Revenues EBIT (1) Profit Before Tax Net profit after Minorities eld Notes : (1) Operating profit (EBIT) of 2011 includes 261 ml profit from the sale of a 7,07% stake in EGU to Qatar Holdings and from reclassifying the remaining participation in EGU and Hellas Gold as financial assets available for sale, provisions for doubtful receivables of 77 mln and adjustments for revised profitability of construction backlog
8 Ellaktor Group key financials (continued) (Amounts in m) Total assets Total equity Net debt Corporate net debt (1) Notes : (1) Excluding debt and cash / cash equivalents of non recourse BOT related projects 9eld0029 8
 Key priorities Improving operating margins")
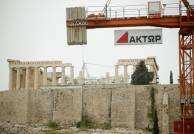
9 Construction segment overview 60 years in construction AKTOR SA, (a 100% subsidiary), is the undisputed market leader in Greece with unmatched technical know-how Emphasis on building our international backlog also due to the current Greek sovereign debt crisis ~ 45% of backlog is in the Middle East and other countries (mostly in Europe) Key priorities Improving operating margins Re-starting the BOT projects (Olympia Odos and Aegean Motorway) 1% 1% 1% 4% Revenues include all Groups activities Significant prospects from 23% 29% ELDORADO GOLD development of the Kassandra goldmines Construction of Photovoltaics (through BIOSAR ENERGY SA); current backlog of 184m ( 169m in Greece & 15m abroad) 41% FY2011 revenues : 830 m 9eld0029 9
10 Construction backlog at 3 bn as of (1) Backlog Analysis by sector (m ) Backlog by geography Oman Project currently on hold 1, ,005 1,202 International 45% Greece 55% , Concessions currently on hold 108 Backlog Evolution ( m) ,005 Infrastructure (2) Projects Greece Notes: (1) HELECTOR has backlog of ~ 220 m not included in the backlog of 3 bn (~ 150 m from St Petersburg Project and ~ 70 m from other projects) (2) Includes BIOSAR ENERGY backlog of ~ 169 m (in Greece) 1,802 Private International Total Backlog eld
11 Construction Backlog : Selective projects Key current Greek projects Key current International projects Infra astructure Projects Project Participation Amount (%) ( m) ERGOSE Project Lianokladi - Domokos Distribution networks PPC Aposelemi Dam Psittaleia STP: Operation and Maintenance Expansion of Macedonia airport North Road section in Crete Waste pipe east & west sector in Thriasio 1st Pfase of the 2nd Landfill in Fyli (Attiki) 100% 100% 100% 48% 30% 100% 100% 78% Fuel pipe in Suda (Crete) 100% 11 Egnatia Highway: Prefectures of Florina 33,33% 28 Tunnel in Kiato Aigio (Peloponnese) 100% 6 New generation access networks OTE 50% 13 SE Europe Project Participation Amount (%) ( m) Tunnel in the road section Tirane Elbasan (ALB) 100% 50 Road Section Tirane-Elbasan (ALB) Design & Build of National Road 18 BAIA (RO) Thrakia Ring Road Nova Zagora-Yambol (BG) Highway Section Crvena Reca-Ciflic (SR) Highway Srpska Kuca-Donji Neradovac (SR) Waste processing plant in Saint Petersburg (RU) AES Solar Bulgaria Labrinovo Biosar (BG) Highway E80, Section Prosec-Crvena Reka (SR) Highway Struma Lot 4 (BG) Railway line Micasasa- Coslariu Simeria (RO) section Brasov -SIMERIA, 49% % % % % 19 30% % % % 29 51% 86 Building Projects BOT Chalkida General Hospital Three level Building Complex in Paiania (Attiki ) National Museum of modern art Airport Expansion Building in Ioannina Korinthos Tripoli Kalamata (Moreas) Elefsina Patra Tsakona (Olympia) Maliakos Kleidi (Aegean) 75% % % 13 48% % % % 73 Gulf Region & Other countries Project Wastewater Treatment Plan IZMIR (TUR) Blue City (Oman) New Doha Airport (Qatar) Fujairah Freeway (UAE) 1st Ring Roads (Kuwait) Participation Amount (%) ( m) 51% 13 50% % % 9 50% 7 9eld
12 Concessions segment overview AKTOR CONCESSIONS S.A., a 100% subsidiary of ELLAKTOR, is the largest concession holder in Greece Holds mature assets (59.2% in Attiki Odos and 22.0% in Rion-Antirrion Bridge) Participates in three major concession projects under construction in Greece (Moreas, Olympia Odos and Aegean Motorway) Participates in concessions of 6,800 parking spaces (5,000 already in operation) Concluding underway negotiations for the reinitiation of the BOT projects of Olympia Odos and Aegean Motorway (currently suspended) is a key priority Aiming to internationalise our concession portfolio mostly in partnership with international players awarded (with HELECTOR) a PPP mandate for a waste management plant in St. Petersburg, Russia (currently arranging the financing) No significant progress is expected in new Greek BOT or PPP projects before the forthcoming elections (early next May). Preferred Bidder for the Police Department headquarters in Piraeus ( 40m construction budget) 9eld
13 Overview of ELLAKTOR s Concession portfolio Ioannina Larissa Igoumenitsa Trikala Karditsa Lamia Aegean Motorway (Maliakos Klidi Highway) Under construction 1,300m budget 20% stake Gefyra (Rion Antirrion Bridge) In operation since m budget 22% stake Patra Aegio Korinthos Tripoli Athens Attiki Odos (Athens Ring Road) In operation since ,244m budget 59% stake Olympia Odos (Athens Patra Tsakona Highway) Under construction 2,900m budget 17% stake Sparta Kalamata Moreas (Korinthos Tripoli Kalamata Highway) Under construction 1,100m budget 72% stake Successful in 3 out of 5 (major highway projects ) of the 2 nd generation concession projects awarded in Greece, with 1 controlling stake and 2 minority stakes 9eld
 2011 revenue 2011 net profit Dividend payout starts in Operator Toll ring road in Athens 59.2% 65.")
14 Operating Concessions assets Low risk mature assets with high expected dividend streams Type of concession AKTOR Concessions (%) Total length Commencement of operation End of concession Total investment IRR on equity Average daily traffic (2011) 2011 revenue 2011 net profit Dividend payout starts in Operator Toll ring road in Athens 59.2% 65.2Km March 2001 September ,244ml (431 state contr, 174 equity, 639 loan) 13.1% ~250,200 vehicles 203m 49m 2012 ATTIKES DIADROMES: 47.4% Toll bridge 22.0% 2.3Km (1) August 2004 December ml (400 state contr, 65 equity, 370 loan) 13% ~ 12,700 vehicles 42m 6m 2007 (2010 Dividend : 9 m) GEFYRA LEITOURGIA: 23.1% Note: (1) 8.2 Km total length, which includes access bridges, toll plaza and the connections with the national roads network 9eld
 but the key priority of the group is to reinitiate the Aegean Motorway and the Olympia Odos")


15 Concessions under Construction... Moreas is progressing smoothly (completion to date ~ 72%) but the key priority of the group is to reinitiate the Aegean Motorway and the Olympia Odos projects Type of concession Korinthos-Tripoli-Kalamata Motorway Maliakos - Kleidi Motorway Elefsina -Korinthos-Patra- Pyrgos Motorway AKTOR Concessions (%) 71.67% 20.00% 17.00% Other Shareholdings 15.00% J&P-Avax 13.33% Intracom 35.00% Hochtief 13.75% Vinci 16.25% J&P-Avax 10.00% Aegek 5.00% Athina 29.90% Vinci 17.00% Hochtief 17.00% J&P-Avax 17.00% Gek Terna 2.10% Athina Total length 205 Km 230 Km 379 Km Commencement of operation March 2008 March 2008 August 2008 Duration of concession 30 Years 30 Years 30 Years Total investment 1,016m 1,198m 2,245m Average daily traffic (2010) ~29,000 vehicles ~52,000 vehicles ~72,500 vehicles Operator The Concessionaire The Concessionaire OLYMPIA ODOS LEITOURGIA (shareholdings as in concession company) 9eld
16 Overview of Waste Management Services ( HELECTOR ) HELECTOR SA, a 80% subsidiary of ELLAKTOR, is the market leader in Waste Management and Waste-to-Energy sectors in Greece and Cyprus extensive know-how in designing, developing, operating and maintaining landfills, incinerators and recycling plants own worldwide patented technologies for Mechanical Biological Treatment (MBT) the only landfill biogas producer in Greece with 30MW in operation and ~10MW under development in licensing stage for two biomass fired power plants for a ~60MW installed capacity Total HELECTOR backlog : 220 m Recurring operational revenue : ~ 61 m p.a. Significant prospects in Greece once the sovereign debt crisis has been addressed announced Concessionaire in the first waste management concession project in Greece (Imathia 100k tons p.a.) a number of Concession / PPP projects in Greece are expected to come on stream Significant prospects internationally signed a Waste Management PPP contract in St. Petersburg (Russia) (capacity 350,000 t/a pa) Signed two projects in Croatia (WM plants & residual landfill) and one in Jordan (landfill biogas) Announced preferred subcontractor in St. Sebastian (Spain) PPP project (Preferred Bidder JV FCC / Veolia / Serbitzu, Capacity 205,000 t/a) Prospects in Nicosia (200k tons p.a.), Limassol (200k tons p.a.), etc. 9eld
17 Overview of the Waste Management market... the Greek market has better growth prospects compared to its EU peers 100% 80% 60% 40% 20% 0% EU Municipal Waste Treatment, 2007 (% of total waste) R om a nia Lithuania M alta Po lan d C y prus Latv ia Greece Source: Eurostat News release, 9 March % 175.0% 150.0% 125.0% 100.0% 75.0% 50.0% 25.0% 0.0% C z ec h R ep Slov ak ia H ung ary Es tonia Ire lan d Portugal Spain U K F in lan d Italy F ranc e Lux em b urg Aus tria D en m ark Belgium Sw eden N ethe rland s G e rm any Landfilled Incinerated Recycled Composted % of BMW (1) land-filled in 2007 vs 1995 Promising potential in Greece from a move towards waste treatment (vs. landfill disposal) and power generation from biogas Concession / PPP pipeline in Greece includes Athens WM project - more than 1.3 million tons p.a. Serres WM project - 125k tons p.a. (Prequalified) Patras WM project 170k tones p.a. Thessaloniki WM project 400k tons p.a. W. Macedonia WM project - 150k tons p.a. (Submitted prequalification application) Peloponnesse WM project 200k tons p.a. On a regional basis, market prospects are also promising given low market penetration in South Eastern Europe and the Balkans, where HELECTOR is already making inroads (Bulgaria, Romania, Croatia, Skopje, Russia) (1) Biodegradable Municipal Waste Source: Eurostat eld

18 Current Waste Management Portfolio Project type Description Location Country Capacity Ownership Status Comments Landfill & Leachate Treatment plants Construction & Management Mechanical Biological Plants Hospital Waste Mgt Plants Construction of landfill Ano Liossia, Attica Greece 2,000 kt/y n/a Restoration - " " Fyli, Attica " " 2,500 kt/y n/a Under construction - " " Tagarades, Salonica " " 720 kt/y n/a Restoration - " " Mavrorachi, Salonica " " 540 kt/y n/a Operation - " " Livadia " " 50 kt/y " " Under construction - " " Thiva " " 70 kt/y " " Under construction - " " Limnos " " 40 kt/y " " Operation - Management of landfill Paphos Cyprus 70 kt/y 100% Operating 10-year concession since 2005 Management of landfill Larnaka " " 50 kt/y 100% Operating 10-year concession since 2010 Management of leachate treatment plant Fyli & A. Liossia Greece 750 m 3 / day 100% Operating 6 years operation contract Management of leachate treatment plant Pafos Cyprus 230 m 3 / day 100% Operating 6 years operation contract Herhof Recycling Osnabrueck Berlin MBT Trier MBT Larnaka MBT Imathia MBT A. Liosia Recycling & Compost Plant Anaerobic Digestion Plants Croatia MBT Plants Apotefrotiras (Hospital Waste Incinerator) Osnabrueck Berlin Trier Larnaka Vergina, Imathia Attica Schloßvippach, Kessel, Ulzen, Dorpen Mariscina & Kastijun Germany " " " " Cyprus Greece Greece Germany Germany 105 kt/y 180 kt/y 180 kt/y 220kt/y 100 kt/y 300 kt/y Total 89 kt/y Total 190 kt/y 100% n/a n/a 100% 100% 70% n/a n/a Operating Operating " " " " Contract signed Contract signed 1 st completed, 2 nd 3 th under construction Contract signed 17-year concession since 2006 Turnkey for third party Turnkey for third party 10 year concession since year concession 3+3 -years operating contract Ano Liossia, Attica Greece 12 kt/y 70% (a) Operating 9-year concession since Turnkey for third party Fyli Recycling plant Fyli, Attica Greece 100 kt/y 20% Operating Private investment Recycling Plants Koropi recycling plant Koropi, Attica Greece 75 kt/y 20% Operating Private investment Waste to Energy Plants Wind Energy 9eld BEAL: landfill biogas-fired plant (b) Ano Liossia, Attica Greece 23.5MW 50% (c) Operating 20-year PPA since 2004 Tagarades: landfill biogas-fired plant Tagarades, Salonica " " 5.0MW 100% Operating 20-year PPA since 2007 Fyli: landfill biogas-fired plant Fyli, Attica " " 10 MW 100% Production license Awarded in 2009 Jordan: landfill biogas-fired plant Amman Jordan Up to 6 MW 100% Signed contract Turnkey for third party + 5y operation Aeiforiki Dodekanisou Rhodes, Kos, Patmos " " 7.8MW 99,5% Operating 20-year PPA since 2007 Note: (a) Remaining 20% controlled by Arsi SA; 10% by Polyeco (b) Largest in Europe (c) Remaining 50% controlled by EDL
19 Renewables segment ( ELTECH Anemos )... favorable framework, for a growing market that faces however limitations in securing funding Favourable regulatory framework RES must cover 20% of total energy consumption & 40% of electricity by 2020 Guaranteed contracts (PPAs) for 20 years with HTSO or PPC Subsidies 20% to 40%(L 3299/04) on CAPEX or +20% premium on electricity sale prices if no utilisation of subsidy funds Prospective target capacity of wind and solar generated power in Greece until 2020 : 7,500 MW and 2,450 MW respectively ELLAKTOR entered the renewable energy sector in 2000 through its 86% subsidiary ELTECH Anemos Total installed capacity: is 129 MW (10 wind farms and 1 photovoltaic plant) 101 MW are currently under construction, MW of which will be operational in 2012 Execution model design, development and supervision in-house maintenance and daily operations outsourced Greece will continue to be our base market : target a 20% market share within the next 3 years Explore attractiveness of foreign markets Tracking of technological advances in RES is key core focus remains on wind, including offshore wind parks open to other RES technologies like photovoltaic plants, hybrid projects and solar thermal plants Excellent relations with wind turbine suppliers 9eld
20 RES assets overview and key economics Wind Project Key Economics CAPEX/MW ~ 1.30m Equity/MW (25%- 40% CAPEX) 0.32m 0.52 m Tariffs : Interconnected /MWh Non interconnected /ΜWh Subsidies : Either on CAPEX (20-40%) 0.26 m 0.52m / MW or on tariff /MWh + 20% Annual revenue/mw wind farms w/o tariff uplift 180, ,000 with +20% tariff uplift 215, ,000 Overview of ELTECH Anemos portfolio Yearly Average Wind Speed 0-4 m/sec m/sec m/sec m/sec Evaluation for Production Permit Production License (RAE) 181 Environmental License 69 Installation License 101 Under Construction 129 Operation m/sec m/sec m/sec > 10 m/sec Operating Under Construction Installation License Production License & Environmental Terms Evaluation for Production Permit 9eld
 and Halcor (1.")

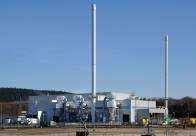
21 ELLAKTOR also has a ~ 22% stake in Elpedison Power Ellaktor is present in the thermal electricity generation sector through Elpedison Power, the 2 nd largest electricity producer in Greece Following the agreement signed in July 2008, HE&D owns a 22.74% stake of Elpedison Power set up together with the Hellenic Petroleum/Edison Joint Venture (75.78%) and Halcor (1.48%) Elpedison Power, aims at enhancing its generation portfolio and remain a key player in the Greek electricity market: 1 gas-fired 390MW CCGT in operation in Thessaloniki (T-Power) 1 gas-fired 420MW CCGT in operation in Thisvi Additional thermal power plants under development Further power generation opportunities considered in Greece and the Balkans ELLAKTOR 96.56% 3.44% HE&D HE&D and Halcor jointly have the institutional minority rights INTRACOM 24.22% Halcor HELLENIC PETROLEUM ELPEDISON POWER Elpedison 75.78% Thessaloniki Power (390MW) Thisvi Power (420MW) Other Assets/Activities EDISON 50% 50% 9eld
 (1) that controls 95% of Hellas Gold ELD is listed")
 Robust Asset Base (2) Mine and Project Locations (2)")
: The data are from ELDORADO s presentation Growing the Leading")
22 Significant values expected from GOLD ELLAKTOR indirectly controls 2.7% in ELDORADO GOLD ( ELD ) (1) that controls 95% of Hellas Gold ELD is listed on Toronto, NYSE and ASX with ~US$ 9.4 bn market cap (28/3/2012) Robust Asset Base (2) Mine and Project Locations (2) Note (1) : Note (2): The data are from ELDORADO s presentation Growing the Leading Global Gold Producer BMO Capital Markets 2012 Global Metals & Mining Conference February 27-29, eld
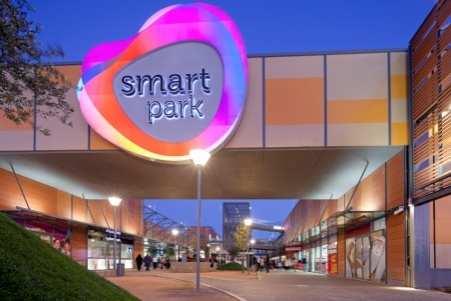
 REDS enjoys a high quality Property portfolio (~ 133m, Book Value at 31/12/2011) Smart Park is operational as of 20/10/2011 Signed leases for 80% of GLA Long term project funding in")
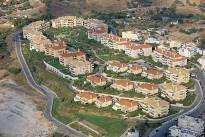
23 Real Estate and other Assets REDS ELLAKTOR holds a 55.46% stake in R.E.D.S. SA Listed on ASE with a market cap : 30.4 m (28/3/2012) REDS enjoys a high quality Property portfolio (~ 133m, Book Value at 31/12/2011) Smart Park is operational as of 20/10/2011 Signed leases for 80% of GLA Long term project funding in place Second phase extension is being prepared (Village Cinemas) Presidential decree for the zoning permission of Kantza Mall has been issued Development of international assets in Romania is suspended until there is more clarity on the market prospects MONT PARNES CASINO ELLAKTOR holds an indirect 15.3% stake in Hellenic Casino Parnitha Non-core asset Initial investment : 33 m Dividends received to date : 20m Other shareholders Regency Entertainment : 35.7% Greek State: 49.0% Revamping of facilities is underway tables will increase to 110 slot machines to 1, Key financials revenues: 122.4m profit after tax: 7.8m ELLAKTOR 30% REGENCY ENTERTAINMENT 70% HELLENIC REPUBLIC ATHENS RESORT CASINO AE 51% 49% ATHENS MONT PARNES CASINO AE 9eld
24 Consolidated P&L (IFRS in m) 31/12/ /12/2011 Change (%) Revenues 1, , % EBITDA % EBITDA margin (%) 15.0% 21.3% EBIT % EBIT margin (%) 8.6% 12.5% Profits/ (Loss) from Associates % Profit/ (Loss) before Tax % Profit Before Tax margin (%) 5.1% 7.5% Profit/ (Loss) after Tax before Minorities % Net Profit/ (loss) after Minorities n/m Earnings/ (Loss) per share (1) n/m Notes : (1) Weighted average number of shares : 172,431,279 (2010 and 2011) The 31.3% decrease in Group revenues is mainly attributed to reduced revenues in Construction by ~ 527 m concession revenues decreased by ~ 21 m environment revenues decreased by ~ 7 m Group Operating Profit (ΕΒΙΤ) reached m and includes 261 m profit from the sale of a 7.07% stake in EGU to Qatar Holdings and from reclassifying the remaining participation in EGU and Hellas Gold as financial assets available for sale (and therefore recording the investment at fair value) provisions for doubtful receivables of 77 m and adjustments for the revised profitability of construction backlog Profit before Tax reached 90.0 m and Net Profit after Minorities increased to 72.8 m 9eld
25 Consolidated Balance Sheet (IFRS in m) 31/12/ /12/2011 Change (%) Long Term Assets (1) 2, , % Cash and Cash Equivalent % Other Current Assets (2) 1, , % Total Assets 4, , % Short Term Debt % Other Short Term Liabilities % Long Term Debt 1, , % Other Long Term Liabilities % Total Liabilities 3, , % Shareholders Equity 1, , % Shareholders Equity (excluding minorities) , % The increase in non current assets is mainly due to the reclassification of the group s remaining participation in EGU and Hellas Gold as Financial Assets Available for Sale ( 284 m) The decrease of current assets is attributed to the decrease in receivables from 1,146 m to 900 m mainly as a result of adjusting the backlog profitability and provisions booked in 2011 that impacted Amounts Due from Customers for Contract Work the decrease in the state s financial contribution receivable to 56.8 m (vs 102,5m as of 31/12/2010) Notes: (1) Long Term Assets as of 31/12/2011 include bonds held to maturity of 88.2 m (2) Receivables (Other Current Assets) as of 31/12/2011 and 31/12/2010 include bonds held to maturity of 94.4 m and 87.7 m respectively while as of 31/12/2010 time deposits over 3 months of m are included 9eld
26 Segmental analysis of 2011 Results (IFRS in m) Construction & Quarries Real Estate Concessions Environment Wind Farms Other Total Revenues ,204.3 EBITDA EBITDA margin (%) 9.6% -35.9% 53.7% 35.4% 68.9% % 21.3% EBIT EBIT margin (%) 6.0% -51.3% 30.7% 28.2% 45.3% % 12.5% Profit before Tax Profit before Tax margin (%) 3.8% -84.1% 20.9% 27.3% 19.2% % 7.5% Net Profit (before minorities) Net Profit margin (before minorities) (%) 4.6% % 15.2% 20.7% 14.1% % 6.1% Net Profit (after minorities) eld
27 Segmental analysis of 2010 Results (IFRS in m) Construction & Quarries Real Estate Concessions Environment Wind Farms Other Total Revenues 1, ,753.1 EBITDA EBITDA margin (%) 4.7% -68.7% 56.3% 30.3% 64.4% 11.7% 15.0% EBIT EBIT margin (%) 1.7% -78.4% 35.6% 24.1% 42.2% -66.9% 8.6% Profit before Tax Profit before Tax margin (%) 0.2% -98.5% 23.4% 23.2% 32.0% % 5.1% Net Profit (before minorities) Net Profit margin (before minorities) (%) -1.6% % 13.0% 13.3% 19.6% % 1.1% Net Profit (after minorities) eld
28 Ellaktor s debt profile ( m, as of )... the group has a healthy capital structure and despite the current turmoil can finance its activities Ellaktor s key debt statistics Debt maturity profile + + = - = Long-term debt: 1,413.6 Short-term debt: Total debt: 1,891.6 Non Recourse Debt 1,023.3 Corporate related Debt Between 1 and 2 years 21.5% Between 2 and 5 years 34.5% Over 5 years 44% + - = Cash & equivalent 1,036.7 Corporate related Net Debt (Cash) (1) / Gearing ratio (2) (1) Total equity + net debt Source: Company financial statements 9eld Cash & equivalent 1,036.7 Non recourse related Cash Corporate related Cash Corporate related Net debt : 596 Shareholder s equity: 1,315 Total capital(1): 1,911 Capital leverage ratio: 31.2% % 31.2% % 30% % 20% % % 31/12/ /12/ /12/ /12/2011 Net Debt /(Cash) Gearing Ratio Notes : (1) Corporate related Net Debt = (Short and Long Term Debt excluding BOT related Debt) (Cash & Cash Equivalents, incl. time deposits over 3 months under receivables and bonds held to maturity but excl. cash & cash equivalents of BOT related projects) (2) Gearing ratio = Corporate related Net Debt / (Equity + Corporate Related Net Debt) 60% 50% 40%
29 Share price performance and shareholder structure Shareholder structure (March 2012) Treasury Stock 2.6% Share price performance LTM (28/3/2011 ~ 28/3/2012) Retail 33.5% Greek Institutional Investors 11.9% Foreign Institutional Investors 13.8% Management Team 38.2% ELLAKTOR share weighting on Indices (29/3/2012) ATHEX ELLAKTOR CONSTRUCTION 20% 10% 0% 0,91% ASE General Idex 11,96% ASE Construction Idex 1,24% FTSE-20 Idex Reuters ticker: HELr.AT Bloomberg ticker: ELLAKTOR:GA 9eld
Group Presentation. November 2011
 Group Presentation November 2011 Key Investment highlights Leading infrastructure player in Greece with an increasing international footprint Healthy capital structure Well-balanced diversified portfolio
Group Presentation. April 2008
 Group Presentation April 2008 TABLE OF CONTENTS 1. Group overview 2. Undisputed leader in the Greek construction sector 3. Leading player in Greek concessions 4. Waste Management Services 5. Significant
Group Presentation. September 2016
 Group Presentation September 2016 Recent Developments / 1 st H2016 Financial Highlights Positive news in 6M2016 included the restructuring of the Moreas BOT project that took effect on 23.02.2016 and the
Group Presentation. December 2015
 Group Presentation December 2015 Recent Developments / 9M 2015 Financial Highlights 9Μ2015 Group results have been impacted by increased macroeconomic and political uncertainty revenues reached 1,097.6
Group Presentation. September 2008
 Group Presentation September 2008 TABLE OF CONTENTS 1. Group overview 2. Undisputed leader in the Greek construction sector 3. Leading player in Greek concessions 4. Waste Management Services 5. Significant
Group Presentation. May 2017
 Group Presentation May 2017 Recent Developments / FY2016 Financial Highlights In 2016 the construction phase of the Moreas BOT project was successfully completed (on 12/12/2016) on 31/3/2017 the Commencement
Group Presentation. March 2009
 Group Presentation March 2009 TABLE OF CONTENTS 1. Group overview 2. Undisputed leader in the Greek construction sector 3. Leading player in Greek concessions 4. Waste Management Services 5. Significant
Group Presentation. March 2009
 Group Presentation March 2009 TABLE OF CONTENTS 1. Group overview 2. Undisputed leader in the Greek construction sector 3. Leading player in Greek concessions 4. Waste Management Services 5. Significant
Group Presentation. September 2017
 Group Presentation September 2017 Recent Developments / 6M2017 Financial Highlights 6M2017 Highlights : in August 2017 construction at Olympia Odos and Maliakos was concluded, and the BOT projects are
Group Presentation May 2018
 Group Presentation May 2018 Recent Developments / FY2017 Financial Highlights Signs of stabilization and gradual improvement in 2017 : construction at Olympia Odos and Maliakos was concluded and the BOT
How, when, what & why to access Structural Funds in Romania
 How, when, what & why to access Structural Funds in Romania 1. STRUCTURAL FUNDS AND ROMANIA The European Commission adopted the Partnership Agreement" with Romania, in the context of mobilization of the
Strategic investment of 47.37% * in ATHENA
 Strategic investment of 47.37% * in * subsequently increased to 75.94% September 2007 2 Disclaimer This presentation has been prepared solely for information purposes and is not to be construed as a solicitation
Corporate Presentation
 Corporate Presentation April 2016 Intracom Holdings / The Shareholder One of the leading construction groups in Greece A major European IT solutions and services group Greece's largest manufacturer of
Corporate Presentation
 Corporate Presentation July 2016 Intracom Holdings / The Shareholder One of the leading construction groups in Greece A major European IT solutions and services group Greece's largest manufacturer of defense
Interim Report 3m Bilfinger Berger SE, Mannheim May 10, 2012 Joachim Müller, CFO
 Interim Report 3m 2012 Bilfinger Berger SE, Mannheim May 10, 2012 Joachim Müller, CFO Bilfinger Berger SE Interim report 3m 2012 May 10, 2012 Page 1 3m 2012: Highlights Growth in output volume and orders
INTRAKAT ANALYST PRESENTATION FY RESULTS 2013
 INTRAKAT ANALYST PRESENTATION FY RESULTS 2013 1 INTRAKAT Presentation Agenda 1. Company Overview 2. Financial Data 3. Main Projects 2 INTRAKAT KEY MILESTONES 1987 2001 Established in 1987 Member of the
Greek Interoperable Tolling Systems (GRITS) Interoperability Travel faster and more conveniently using only one transponder
 Interoperability Travel faster and more conveniently using only one transponder") Greek Interoperable Tolling Systems (GRITS) Interoperability Travel faster and more conveniently using only one transponder The service that makes your journey faster and more convenient, allowing you
Greek Interoperable Tolling Systems (GRITS) Interoperability Travel faster and more conveniently using only one transponder The service that makes your journey faster and more convenient, allowing you
Ferrovial increases net profit by 12%, to 287 million euro
 All-time record backlog: 23.695 billion euro Ferrovial increases net profit by 12%, to 287 million euro Revenues expanded by 2.8% to 3.758 billion euro, supported by solid performance in the international
MEGAPROJECT Case Study
 SECTION 1 - BASIC PROJECT INFORMATION MEGAPROJECT Case Study Case compiled by: Dr. Athena Romboutsos Contact details: athena@aegean.gr Basic Project Information Project Title Athens Ring Road Location
PRESS RELEASE Financial Results. Rising passenger traffic at 12.5m Exceeding 1bn in consolidated revenue
 PRESS RELEASE 2016 Financial Results Rising passenger traffic at 12.5m Exceeding 1bn in consolidated revenue Kifissia, 23 March 2017 AEGEAN reports full year 2016 results with consolidated revenue at 1,020m,
Related Expertise Concession Projects - PPP
 Related Expertise Concession Projects - PPP IMPETUS-ISIS for Attiki Odos ISIS and Impetus developed a traffic model for the offer that Attiki Odos, SA had provided in the bidding process and won the contract
Athens International Airport. A successful PPP & attractive investment
 Athens International Airport A successful PPP & attractive investment Konrad Adenauer Stiftung-IOBE Athens, January 24 th, 2013 AIA is a pioneer PPP greenfield project Hellenic Republic Asset Development
Interim Report 6m 2014
 August 11, 2014 Interim Report 6m 2014 Investors and Analysts Conference Call on August 11, 2014 Joachim Müller, CFO Latest ad-hoc release (August 4, 2014) Reduction of forecast, primarily due to a further
Corporate Presentation
 Corporate Presentation November 2017 Intracom Holdings / The Shareholder One of the leading construction groups in Greece A major European IT solutions and services group Greece's largest manufacturer
PRESS RELEASE. First Half 2017 Financial Results Higher Load Factors and traffic lead to a significant rebound in second quarter profitability
 PRESS RELEASE First Half 2017 Financial Results Higher Load Factors and traffic lead to a significant rebound in second quarter profitability Kifissia, 12 September 2017 AEGEAN announces first half 2017
FY RESULTS ROADSHOW PRESENTATION
 1 FY RESULTS 2014 ROADSHOW PRESENTATION FY 2014 HIGHLIGHTS FOCUS ON EXECUTION 2 Strong financial performance Revenues: 61 bn, +5% vs. 2013 EBIT* before one off: 4.1 bn, +15% vs. 2013 EPS: 2.99, +61% vs.
Bilfinger Berger: Entering new growth phase
 Bilfinger Berger: Entering new growth phase Deutsche Bank German, Swiss & Austrian Conference, May 15 to 16, 2012 Roland Koch, CEO Andreas Müller, Head of Accounting and IR Bilfinger Berger SE Company
ACI-NA/World Conference & Exhibition. PPPs: Will it work for your Airport?
 ACI-NA/World Conference & Exhibition PPPs: Will it work for your Airport? Dr. Yiannis Paraschis CEO Athens International Airport & Chairman ACI World September 12 th 2012 Forms & level of privatisation
2018 full-year results
 2018 full-year results 01 Message from Chairman & CEO 02 FY 2018 Results 03 Business drivers 04 Outlook 02 FY 2018 financial results Key figures Revenue 2.85 Bn ROP 115 M Net debt 252 M Free cash flow
FOURTH QUARTER AND FULL-YEAR RESULTS February 2008
 FOURTH QUARTER AND FULL-YEAR RESULTS 2 1 February 2 AGENDA CEO review Financial review Operating review of Mobile Concluding remarks Harri Koponen Lars Nilsson Harri Koponen Harri Koponen 2 29-2-1 Fourth
Summary of Results for the First Quarter of FY2015/3
 Summary of for the First Quarter of FY2015/3 August 8, 2014 Tokyu Corporation (9005) http://www.tokyu.co.jp/ Contents Ⅰ.Executive Summary 2 Ⅱ.Conditions in Each Business 4 Ⅲ.Details of Financial for the
AIRBUS. H Roadshow Presentation. July 2018
 AIRBUS H1 2018 Roadshow Presentation July 2018 H1 18 HIGHLIGHTS 2 Robust commercial aircraft environment Backlog of ~7,200 a/c underpins ramp-up plans H1 financials reflect mainly A350 performance and
GATWICK AIRPORT JOINS VINCI AIRPORTS December 2018
 GATWICK AIRPORT JOINS VINCI AIRPORTS December 2018 Asset presentation Gatwick is the 2 nd largest airport in the UK and the 8 th busiest in Europe with 46 mpax Key features 46 mpaxin FY18, in the wealthiest
INTRAKAT. Analyst Presentation June 2012
 Analyst Presentation June 2012 Agenda 1. Company Overview 2. Main Projects 3. Financial Data Key Milestones Established in 1987. Member of the Intracom Holdings Group Listed in the Athens Exchange in November
TUI GROUP FACTBOOK. May 2015
 TUI GROUP FACTBOOK May 2015 Pro Forma Turnover 2012/13 & 2013/14 m FY 12/13 Q1 13/14 Q2 13/14 Q3 13/14 Q4 13/14 FY 13/14 Northern Region 6,037.2 1,047.6 922.0 1,660.0 2,571.2 6,200.8 Central Region 5,524.8
OPERATING AND FINANCIAL HIGHLIGHTS. Subsequent Events
 Copa Holdings Reports Net Income of $103.8 million and EPS of $2.45 for the Third Quarter of 2017 Excluding special items, adjusted net income came in at $100.8 million, or EPS of $2.38 per share Panama
IMPORTANT NOTES TO THE UNAUDITED CONSOLIDATED FINANCIAL STATEMENTS OF THE KRKA GROUP FOR 2006
 Pursuant to the Rules of the Ljubljana Stock Exchange and the Securities Market Act (ZTVP-1, Official Gazette of the Republic of Slovenia, no 56/99), Krka, d.d., Novo mesto, Šmarješka cesta 6, 8501 Novo
The re-emergence of Greece s Upstream Oil & Gas sector:
 8 th South East Europe Energy Dialogue 12 June 2014 The re-emergence of Greece s Upstream Oil & Gas sector: Hellenic Petroleum experience Yannis Grigoriou E&P D. General Manager Hellenic Petroleum S.A.
Investment Highlights
 Third Quarter 2014 Investment Highlights 1 Mexican airport portfolio positioned to take full advantage of global growth. 2 Diversified business model contributing to earnings resilience. 3 Well-defined
Novelty and opportunities in the Greek PPP market
 Novelty and opportunities in the Greek PPP market Leonidas Korres Special Secretary for Public Private Partnerships Ministry of Economy and Finance Greece Overview Market-friendly environment 3.1 bn Euros
Ramsay Health Care Limited Results Briefing Half Year ended 31 December 2018
 Ramsay Health Care Limited Results Briefing Half Year ended 31 December 2018 Craig McNally, Group Managing Director & Bruce Soden, Group Finance Director 28 February 2019 ramsayhealth.com Agenda Group
Joachim Müller, CFO Bettina Schneider, Deputy Head IR
 December 03, 2013 Successful evolution into a leading international Engineering and Services Group Credit Suisse European Business Services Conference Joachim Müller, CFO Bettina Schneider, Deputy Head
Copa Holdings Reports Record Earnings of US$41.8 Million for 4Q06 and US$134.2 Million for Full Year 2006
 Copa Holdings Reports Record Earnings of US$41.8 Million for 4Q06 and US$134.2 Million for Full Year 2006 Panama City, Panama --- March 7, 2007. Copa Holdings, S.A. (NYSE: CPA), parent company of Copa
2006 Preliminary Results. 7 March 2007
 2006 Preliminary Results 7 March 2007 Anthony Rabin 16 Headline numbers 2005 2006 Revenue 4,938m 5,852m +19% Pre-tax profit* 134m 152m +13% Adjusted eps* 24.1p 27.3p +13% Full-year proposed dividend 8.1p
Highlights from the Annual Results December 2007
 Highlights from the Annual Results December 2007 Disclaimer The information in this document is taken from the BAA 2007 Annual Results ( the Results ) which were published on 11 March 2008 and other public
Summary of Results for the First Three Quarters FY2015/3
 Summary of Results for the First Three Quarters FY2015/3 February 10, 2015 Tokyu Corporation (9005) http://www.tokyu.co.jp/ Contents Ⅰ.Executive Summary 2 Ⅱ.Conditions in Each Business 5 Ⅲ.Details of Financial
HALF YEAR REPORT February Leighton Holdings Limited
 HALF YEAR REPORT February 2009 PRESENTATION OUTLINE Results highlights Operational update Financial statements Strategy and outlook 2 Half Year Report I 12 February 2009 I RESULTS HIGHLIGHTS 3 Half Year
AIRBUS H Roadshow Presentation. New York July 31 st, 2017
 AIRBUS H1 2017 Roadshow Presentation New York July 31 st, 2017 H1 2017 HIGHLIGHTS 2 Healthy commercial aircraft environment; robust backlog of 6,771 a/c supports ramp-up plans H1 financials reflect delivery
Bilfinger Berger: Preliminary Report on the 2004 Financial Year
 Bilfinger Berger AG Carl-Reiss-Platz 1-5 68165 Mannheim Germany www.bilfingerberger.com Contact: Sascha Bamberger Phone: +49 6 21/4 59-24 55 Fax: +49 6 21/4 59-25 00 E-mail: sbam@bilfinger.de Date: February
Elvan S.A. COMPANY PROFILE. 20 km Lavriou Ave., Peania, Greece
 February 2015 Elvan S.A. 20 km Lavriou Ave., Peania, 19002 Greece Phone: +30-210- 6644161 / +30-210 6646091 Fax: +30-210 6644166 http://www.elvan.gr e-mail: info@elvan.gr 2 / 17 Basic Information Founded
Summary o f Results for the First Half of FY2018
 Summary o f Results for the First Half of FY2018 November 9, 2018 (9005) https://www.tokyu.co.jp/ Contents Ⅰ.Executive Summary 2 Ⅱ.Conditions in Each Business 6 Ⅲ.Details of Financial Results for the 13
Analysts and Investors conference call. Q results. 15 May 2013
 Analysts and Investors conference call Q1 2013 results 15 May 2013 Management summary Key messages of Q1 2013 +6% +9% +3.3%p. Q1 2013 operational KPIs are in line with 109.7 116.2 6.5 7.1 82.3 85.6 expectations,
2017 Amadeus IT Group and its affiliates and subsidiaries. Amadeus 2016 Results. February 24, 2017
 Amadeus 2016 Results February 24, 2017 Disclaimer _ This presentation may contain certain statements which are not purely historical facts, including statements about anticipated or expected future revenue
Co-operative Systems in Infrastructure Operation
 SAFE STRIP 1 st PAN-EUROPEAN WORKSHOP Thessaloniki, 27 September 2017 Co-operative Systems in Infrastructure Operation Bill M. Halkias, PE, MSCE, F. ASCE, F. ITE Managing Director & CEO, Attikes Diadromes
Executive Directors Review
 Financial Summary Turnover for the year ended 31 December 2011 amounted to HK$571.4 million ( 47.6 million) (2010: HK$706.8 million ( 58.7 million)). The turnover was principally attributable to the recognition
OPERATING AND FINANCIAL HIGHLIGHTS
 Copa Holdings Reports Net Income of US$32.0 Million and EPS of US$0.72 for the Second Quarter of 2012 Excluding special items, adjusted net income came in at $58.6 million, or EPS of $1.32 per share Panama
MGM Resorts International Reports Second Quarter Financial Results
 NEWS RELEASE MGM Resorts International Reports Second Quarter Financial Results 8/5/2014 Consolidated Adjusted EBITDA Increased 8%, Led By 10% Growth In Wholly Owned Domestic Resorts MGM China Declares
OPERATING AND FINANCIAL HIGHLIGHTS. Subsequent Events
 Copa Holdings Reports Net Income of US$113.1 Million and EPS of US$2.57 for the First Quarter of 2015 Excluding special items, adjusted net income came in at US$106.0 million, or EPS of US$2.41 per share
Copa Holdings Reports Net Income of $136.5 million and EPS of $3.22 for the First Quarter of 2018
 Copa Holdings Reports Net Income of $136.5 million and EPS of $3.22 for the First Quarter of 2018 May 9, 2018 PANAMA CITY, May 9, 2018 /PRNewswire/ -- Copa Holdings, S.A. (NYSE: CPA), today announced financial
OPERATING AND FINANCIAL HIGHLIGHTS. Subsequent Events
 Copa Holdings Reports Financial Results for the First Quarter of 2016 Excluding special items, adjusted net income came in at US$69.9 million, or EPS of US$1.66 per share Panama City, Panama --- May 5,
Preliminary Figures FY 2016
 February 14, 2017 Preliminary Figures FY 2016 Capital Markets Day 2017 Tom Blades (CEO) Disclaimer This presentation has been produced for support of oral information purposes only and contains forwardlooking
Welcome to the General Shareholders Meeting Turning Vision into Value.
 Welcome to the General Shareholders Meeting 2008 1 Strategic Milestones in 2007 Budapest Airport San Francisco-Oakland Bay Bridge Hirschgarten Center, Munich Strategic Milestones in 2007 Continuing with
Copa Holdings Reports Net Income of $49.9 million and EPS of $1.18 for the Second Quarter of 2018
 Copa Holdings Reports Net Income of $49.9 million and EPS of $1.18 for the Second Quarter of 2018 Panama City, Panama --- Aug 8, 2018. Copa Holdings, S.A. (NYSE: CPA), today announced financial results
2017 Amadeus IT Group and its affiliates and subsidiaries. Amadeus 2016 Results. February 24, 2017
 Amadeus 2016 Results February 24, 2017 Disclaimer _ This presentation may contain certain statements which are not purely historical facts, including statements about anticipated or expected future revenue
AGENDA. Group overview. Financial highlights. Operational highlights. Expansion plans
 1 AGENDA Group overview Financial highlights Operational highlights Expansion plans 2 3 CURRENT FOOTPRINT Kenya 12 stores 2 DCs Tanzania 2 stores Number of stores 31-Dec-16 31-Dec-17 Increase: Dec-16 to
Cairo, May 21, TMG Holding reports EGP BN consolidated revenue, EGP 161 MN consolidated net profit
 First Quarter ending Earning Release Cairo, May 21, - reports EGP 1.139 BN consolidated revenue, EGP 161 MN consolidated net profit after minority and EGP 2.2 BN of new sales value for the first quarter
THIRD QUARTER RESULTS 2018
 THIRD QUARTER RESULTS 2018 KEY RESULTS In the 3Q18 Interjet total revenues added $ 6,244.8 million pesos that represented an increase of 7.0% over the revenue generated in the 3Q17. In the 3Q18, operating
Copa Holdings Reports Net Income of US$113.9 Million for the Fourth Quarter of 2013
 Copa Holdings Reports Net Income of US$113.9 Million for the Fourth Quarter of 2013 Panama City, Panama --- February 12, 2014. Copa Holdings, S.A. (NYSE: CPA), today announced financial results for the
2005 Interim Results. September 7, 2005
 2005 Interim Results September 7, 2005 Outline First-Half 2005 Results Business activity at August 31, 2005 Update on the Real Estate and Expansion Strategies 2 First-half 2005 +22.8% Solid growth in interim
Interim Release Q3/9M 2017
 Overview by the Executive Board November 2, 207 In the first nine months of 207, the airports of the Fraport Group recorded strong passenger development. At approximately 48.9 million, passenger numbers
2007/08 Interim Results
 Bossini International Holdings Limited 2007/08 Interim Results For the six months ended 31 December 2007 Corporate Presentation 19 March 2008 0 Agenda Results Highlights Review of Operations Future Plans
OPERATING AND FINANCIAL HIGHLIGHTS
 Copa Holdings Reports Financial Results for the Fourth Quarter of 2015 Excluding special items, adjusted net income came in at $31.7 million, or EPS of $0.73 per share Panama City, Panama --- February
HOPEWELL HOLDINGS LIMITED ANNOUNCES FY 2018/19 INTERIM RESULTS
 Press Release HOPEWELL HOLDINGS LIMITED ANNOUNCES FY 2018/19 INTERIM RESULTS Highlights 1H FY19 (1 April to 30 September 2018) First financial year after the change of financial year end date from 30 June
OPERATING AND FINANCIAL HIGHLIGHTS SUBSEQUENT EVENTS
 Copa Holdings Reports Financial Results for the Third Quarter of 2016 Excluding special items, adjusted net income came in at $55.3 million, or adjusted EPS of $1.30 per share Panama City, Panama --- November
P esent n atio i n o n f or o H alf l Y e Y ar E n E d n e d d d 31 D ecemb m e b r 2 008
 Queensland WA & QLD Report Summary Strong revenue growth of 61.8% to $234.5m Strong cash flow from operations of $20.9m Net debt to equity 23.2% Underlying net profit of $8.2m (before goodwill impairment
Copa Holdings Reports Fourth Quarter and Full Year 2007 Results
 Copa Holdings Reports Fourth Quarter and Full Year 2007 Results Panama City, Panama --- February 21, 2008. Copa Holdings, S.A. (NYSE: CPA), parent company of Copa Airlines and Aero Republica, today announced
1Q 2012 Results. Conference Call - 9 May 2012
 1Q 2012 Results Conference Call - 9 May 2012 1 1Q 2012 RESULTS Main items Positive performance of Q1 results despite strong seasonality effects linked to the harsh winter conditions that have impacted
TUI Group Investor Presentation
 TUI Group Investor Presentation WestLB Deutschland Conference Frankfurt, 18-19 November 2009 TUI AG Investor Relations Seite 1 Agenda I. Group overview II. Financials III. Outlook 2009 IV. Financing update
2012 Result. Mika Vehviläinen CEO
 2012 Result Mika Vehviläinen CEO 1 Agenda Market environment in Q4 Business performance and strategy execution Outlook Financials 2 Market Environment According to IATA, Global air travel continues to
Output volume and order backlog at record levels Renewed significant increases in net profit and operating profit Dividend bonus announced
 Bilfinger Berger AG Carl-Reiss-Platz 1-5 68165 Mannheim Germany www.bilfingerberger.com Contact: Sascha Bamberger Phone: +49 6 21/4 59-24 55 Fax: +49 6 21/4 59-25 00 E-mail: sbam@bilfinger.de Date: February
Cebu Air, Inc. Annual Stockholders Briefing. 24 June cebupacificair.com
 Cebu Air, Inc. Annual Stockholders Briefing 24 June 2015 cebupacificair.com Business Updates Passengers (M) Operating Statistics 2014: Passenger traffic grew 17.5% to 16.9M. Seat capacity grew 14.8% to
SEA BOARD OF DIRECTORS: 2017 STATUTORY FINANCIAL STATEMENTS AND NON-FINANCIAL REPORT APPROVED
 SEA BOARD OF DIRECTORS: 2017 STATUTORY FINANCIAL STATEMENTS AND NON-FINANCIAL REPORT APPROVED SEA Group results Passenger traffic: 31.6 million, up 8.9% (22 million at Milan Malpensa, growth of 14.1%)
OPERATING AND FINANCIAL HIGHLIGHTS
 Copa Holdings Reports Financial Results for the Fourth Quarter of 2018 Excluding special items, adjusted net profit came in at $44.0 million, or Adjusted EPS of $1.04 Panama City, Panama --- February 13,
NEWSLETTER MARINA, HIGHWAY PRIVATIZATIONS
 GREECE CONFIDENCE RETURNS MARINA, HIGHWAY PRIVATIZATIONS CALLING ON AUSTRALIAN INVESTORS The newsletter is a monthly publication of Enterprise Greece, the national trade and investment promotion agency.
Corporate Presentation. December 2015
 Corporate Presentation December 2015 Quality & Award winning airline Weathering through the crisis and positioning for strong Full Service Carrier Focus on quality, efficiency, productivity 10.1m passengers
Investor update presentation. November 2016
 Investor update presentation November 2016 Content Update on Q3 2016 financial performance 3-8 Recap on ATG Evolution 9-10 Update on hospitality strategic business unit 11-14 Update on online travel and
INTESA SANPAOLO VITA RESULTS AT 31 MARCH 2017 APPROVED:
 INTESA SANPAOLO VITA RESULTS AT 31 MARCH 2017 APPROVED: Assets under management at 145,908.2 million euros (143,735.3 million euros at December 2016 +1.5%) Financial liabilities (unit and index linked)
EADS: New Stage of Maturity. Nathalie Errard VP Investor Relations
 EADS: New Stage of Maturity Nathalie Errard VP Investor Relations Lagardere Investor Day, June 1 st, 2006 1 Content Integration and Rise to Leadership 2005 Group Financials New Challenges, New Growth 2
THIRD QUARTER RESULTS 2017
 THIRD QUARTER RESULTS 2017 KEY RESULTS In the 3Q17 Interjet total revenues added $5,835.1 million pesos that represented an increase of 22.0% over the revenue generated in the 3Q16. In the 3Q17, operating
Cathay Pacific Airways Interim Results 04 August Cathay Pacific Airways Interim Results 6 August 2008
 Cathay Pacific Airways 2010 Interim Results 04 August 2010 Cathay Pacific Airways 2008 Interim Results 6 August 2008 Interim Result 1H 2010 1H 2009 Group Profit/(Loss) HK$6,840m HK$812m Group Turnover
Annual General Meeting of Bilfinger Berger SE on Tuesday, May 31, 2011, 10:00 a.m., Mannheim
 Page 1 of 22 Annual General Meeting of Bilfinger Berger SE on Tuesday, May 31, 2011, 10:00 a.m., Mannheim Speech by Herbert Bodner, Chairman of the Executive Board -------------------------------------------------------------------------------------
Cairo, November 15, 2016 TMG holding reports EGP 3.9 BN consolidated revenues, EGP 616 MN consolidated net profit
 Nine Months and Third Quarter ending September 30, Earning Release Cairo, November 15, TMG holding reports EGP 3.9 BN consolidated revenues, EGP 616 MN consolidated net profit after minority and EGP 5.5
01 Amadeus at a glance
 01 Amadeus at a glance 7 Amadeus Annual Report 2011 1.1 Company s origins and development Most people associate the birth of electronic commerce distribution with the arrival of the internet. In fact,
Investment Highlights
 Second Quarter 2014 Investment Highlights 1 Mexican airport portfolio positioned to take full advantage of global growth. 2 Diversified business model contributing to earnings resilience. 3 Well-defined
ERW. 022/ ACC003/ th February Subject: Management's Discussion and Analysis period ending 31 st December 2012
 ERW. 022/ ACC003/56 26 th February 2013 Subject: Management's Discussion and Analysis period ending 31 st December 2012 Attention: The President, The Stock Exchange of Thailand Dear Sir, The Erawan Group
Crown Resorts Limited
 Crown Resorts Limited 2016 Half Year Results Presentation 25 February 2016 1 Crown Resorts Limited Results Overview Crown Resorts Limited (Crown) performance: The 2016 First Half results across Crown s
Road Safety Campaigns in Greece
 ASECAP 2011 ROAD SAFETY EVENT ATHENS, 1 MARCH 2011 Road Safety Campaigns in Greece Bill M. Halkias, PE, F.ASCE, F.ITE President, Hellenic Institute of Transport Engineers Chief Executive Officer, Attica
Great Portland Estates Trading Update Strong Operational Performance
 Press Release 6 July 2017 Great Portland Estates Trading Update Strong Operational Performance Great Portland Estates plc ( GPE ) today publishes its trading update for the quarter to 30 June 2017. Continued
Investor Presentation
 TUI Group Investor Presentation WestLB Deutschland Conference 2010 17 November 2010 TUI AG Investor Relations Seite 1 Future-related related statements This presentation contains a number of statements
Copa Holdings Reports Net Income of $57.7 million and EPS of $1.36 for the Third Quarter of 2018
 Copa Holdings Reports Net Income of $57.7 million and EPS of $1.36 for the Third Quarter of 2018 November 14, 2018 PANAMA CITY, Nov. 14, 2018 /PRNewswire/ -- Copa Holdings, S.A. (NYSE: CPA), today announced