1Q 2012 Results. Conference Call - 9 May 2012
|
|
|
- May Alexandrina Johns
- 5 years ago
- Views:
Transcription


1 1Q 2012 Results Conference Call - 9 May
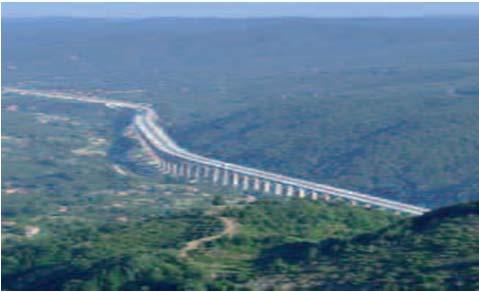
2 1Q 2012 RESULTS Main items Positive performance of Q1 results despite strong seasonality effects linked to the harsh winter conditions that have impacted Central and Eastern Europe. Production recovery is already under way in Q2. Total revenues: +2.2% up to 522.3M EBIT up to 44.9M (+1.2%), EBIT margin at 8.6% Net profit: +2.5% up to 17.7M Strong order intake with over 900M of new orders. Orders backlog at 20bn of which booked orders amount to 10.4bn. Net debt at 536M vs. 480M at Dec reflects seasonality and 103M of investments, of which 87M in concession. Turkish Milas-Bodrum International Airport to be inaugurated in May
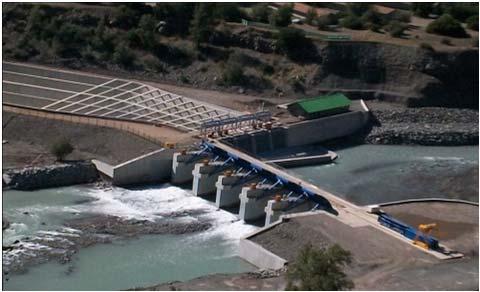
3 1Q 2012 RESULTS Income statement ( /000) 1Q 2012 % 1Q 2011 % y-o-y (%) Total revenues 522, % 510, % +2.2% EBITDA 53, % 56, % (4.3)% EBIT 44, % 44, % +1.2% EBT 28, % 27, % +3.0% Net income 17, % 17, % +2.5% EBT also includes 3M from concession activities: Profitability from operations in Mestre Hospital and 5 Car Parks (both in Italy) and the first contribution from the operation of the Chacayes hydroelectric power plant in Chile amounting to 2M as equity participation. Construction revenues main trends: Italy: positive trend mainly in the highways and hospital sector. Central and Eastern Europe and Turkey: despite strong seasonality effect, the levels of production have been positive. Algeria: good progress on railway projects. EBITDA affected by a different mix of direct vs. indirect cost. The effect is normalized at the EBIT level. EBIT: profitability in line with latest trend. The contribution from concession is expected to increase over 2012 as the Bodrum Airport in Turkey will enter the operational stage for which approx. 20M of revenues are expected for the rest of the current year. 3

4 1Q 2012 RESULTS Revenues by geography 1Q 2012 Revenues 1Q 2011 Revenues Italy Europe America 4% 10% 11% 44% 19% 3% 9% 47% Asia (Middle East) Africa (Algeria) 31% 22% Italy accounts for 44% of total revenues and the trend is for it to stand at 40% in the coming years. Central and Eastern Europe is becoming stronger as projects in Poland and in Russia enter the full production stage. The trend will improve as projects in pipeline in Turkey will start production (i.e. Gebze-Izmir Highway and Etlik Hospital in Ankara). Middle East: ongoing transfer of commercial activities from the oil&gas sector (closed) to the transport infrastructure sector. Latin America: Venezuela, as planned, shows the further progressive reduction in production levels not yet fully offset by the positive trend in Chile and Peru, especially in the new mining sector, which will reach full production levels during
 Milan Subway Line 5 (Italy): 128M due to the increase in Astaldi stake in the SPV up to")
: 450M (Astaldi share) Further initiatives in transport")
5 1Q 2012 RESULTS Order Backlog Strong order intake: 907M CONCESSION Milan Subway Line 4 (Italy): 200M (Astaldi share) Milan Subway Line 5 (Italy): 128M due to the increase in Astaldi stake in the SPV up to 38% Mestre Hospital (Italy): 36M due to the increase in Astaldi stake in the SPV up to 34.5% CONSTRUCTION Milan Subway Line 4 (Italy): 450M (Astaldi share) Further initiatives in transport infrastructures: 93M 5
6 UPDATE ON ONGOING INITIATIVES TURKEY: In Turkey, the Government approved a law that has adjusted the local legal framework to international standards to facilitate project finance. This is expected to pave the way for an acceleration on the start of activities on both the Gebze-Izmir Highway and the Etlik Hospital in Ankara. ITALY A4 Highway: Astaldi together with other private shareholders of A4 Holding have signed an agreement aimed at bringing together all their shareholdings in A4 Holding into a single special purpose vehicle (SPV) which controls the absolute majority of A4 Holding. The objective is to refocus and further develop the activities of the concession company in the motorway concession sector. At the end, Astaldi s total investment amounts to 120M and it holds, through the said SPV, approx. 12% stake of the highway concession. One of the first outcomes from this participation is: Nogara-Mare Highway: greenfield project for the construction and concession of 107km of new highway in which Astaldi (23% stake) together with other partners is Sponsor of the initiative, with right of first refusal. The total investment amounts to approx. 1.9bn. Tender process should start in 1H There are 2 additional greenfield initiatives in which Astaldi aims to participate for approx. 3bn. Ancona Port Highway Junction ( 140M in construction works and 600M in concession, Astaldi share): the second stage of the tender process has taken place and no additional bids were submitted. We are waiting for awarding within

 3.5bn construction 3.7bn concession Middle East 0.")
7 1Q 2012 RESULTS Order Backlog including ongoing initiatives amounts to approx. 20bn Traditional market Recently opened market Astaldi has opened Canada Area Latin America 2.5bn construction 1.3bn concession Construction Total Backlog 10.4bn USA 0.1bn construction Concession 4.4 ITALY 4.6bn construction 3bn concession Algeria 0.7bn construction bn Central Europe (Romania, Poland, Russia, Turkey) 3.5bn construction 3.7bn concession Middle East 0.4bn construction 20bn of Soft Backlog March 2012 Orders Backlog Construction orders won/in pipeline Concession orders won/in pipeline "Soft" Backlog 7
8 CONSTRUCTION PORTFOLIO 2.9bn in Italy Contracts in execution 50% of average completion % of completion of most important projects in Italy Mar Order Backlog ( /000) Ending year Rome Subway Line C 45% 548 > 2014 Jonica National Road DG41 0% 474 > 2014 Milan Subway Line 5 47% 369 > 2014 Milan Subway Line 4 0% 450 > 2014 Jonica National Road DG22 76% 69 > 2014 Pedemontana Lombarda Highway 19% Bologna H S Railway Station 79% School of Italian Police Officers in Florence 58% Four Hospitals in Tuscany 57% Parma La Spezia Railway 60% Turin Railway Hub 88%
9 CONSTRUCTION PORTFOLIO 4.4bn abroad 35% of average completion Contracts in execution % of completion of most important projects outside Italy Algeria Saida Moulay Slissen Railway 41% Algeria Saida Tiaret Railway 3% Mar Order backlg ( /000) Ending year > 2014 Oman BidBid Sur Road 4% Poland Warsaw Subway Line 2 25% 267 > 2014 Poland Warsaw Lodz Railway Project 1% 132 > 2014 Poland National Road 8 51% Romania Otopeni International Airport (Phase n. 3) 82% Romania Bucarest Subway Line 5 6% Romania Orastie Sibiu Highway (Lot 4) 20% Russia Pulkovo International Airport in St. Petersbourg 9% Turkey Milas Bodrum International Airport 93% Turkey Halic Bridge 51% Chile Chuquicamata Mining Project 0% 111 > 2014 Peru Cerro del Aguila Hydroelectric Power Plant 2% 239 > 2014 Romania Cernavoda Medgidia Highway 24% Venezuela Puerto Cabello La Encrucijada Railway 50% 873 > 2014 Venezuela San Juan de Los Morros San Fernando de Apure Railway 59% 333 > 2014 Venezuela Chaguaramas Cabruta Railway 40% 215 >
10 1Q 2012 RESULTS Financial Items ( /000) 1Q 12 FY 11 1Q 11 Net fixed assets 501, , ,125 Working capital 554, , ,951 Total funds (29,475) (37,085) (30,539) Net invested capital 1,025, , ,537 Net financial debt (702,981) (623,651) (632,169) Receivables arising from concession 163, , ,537 Total financial debt (*) (539,422) (482,701) (531,632) Net equity 486, , ,905 (*) Figures expressed inclusive of treasury shares. Slight increase in net fixed assets in 1Q linked to investments in concession sector. Good performance of working capital benefiting from positive payment collection. Receivables from concession increase to 163.5M mainly due to the acceleration on the construction on Turkish Milas-Bodrum International Airport due to be inaugurated in May D/E stands at 1.1x. Construction D/E stands at 0.6 x. 10
11 ( /M) Q 2012 RESULTS Net debt by segment CAPEX in construction amounted to 14.4M (2.75% of total revenues) in support of production activities in Algeria, Chile, Oman and Peru Gross CAPEX in concession amounted to 87M in 1Q mainly referred to Turkish projects (Milas- Bodrum International Airport and Gebze-Izmir concession highway) FY 2009 FY 2010 Q FY 2011 Q Business Plan Construction Concession Total Net Debt The extension of the maturity of the credit line allows to better allign uses of funds with the returns of the investments Committed Lines ( /M) ~ % 16% Extended to 2016 the maturity of the credit line of 325mn 6% 7% FY > % 11
12 1Q 2012 NET FINANCIAL POSITION Concession business /000 31/12/2011 1Q /03/2012 Equity investments 165,041 5, ,696 Intangibles 39,989 22,495 62,484 Change in working capital 24,104 (21,030) 3,074 Semi equity 16,963 35,507 52,470 Financial receivables 140,485 23, ,558 Total invested capital in concession 386,582 65, ,282 Financial receivables (140,485) (23,073) (163,558) Semi equity (16,963) (35,507) (52,470) Total net financial position of concession 229,134 7, ,254 12
13 1Q 2012 RESULTS Cash-flow In 2010 and 2011 the construction sector has produced more that 230M of self-financing and 2012 is planned to have the same performance. CONSTRUCTION CONCESSIONS OVERALL Net indebtedness (251) (229) (480) Self financing Change in net working capital (58) 18 (40) Capex (16) (87) (103) Operating cash flow (49) (66) (115) Change in receivables arising from concessions (*) Change in semi equity Cash flow (49) (7) (56) 18M Milas- Bodrum Airport 5M further initiatives in Italy and abroad 33M Gebze- Izmir Highway 3M further initiatives Total net financial position March 2012 (300) (236) (536) (*) According to IFRIC accounting criteria. 13
14 A FOCUS ON ASTALDI CONCESSION 14
15 ASTALDI Business Model based on a Dual Approach integrating Construction and Concession Construction Italy Construction RoW Concession (SPV/Equity invest.) Transport infrastructures Water and Energy Civil and industrial buildings Transport infrastructures Water and Energy Civil and industrial buildings Healthcare Highways and Subways Airports Energy The Group leverages on the strong commercial network and on the extensive know-how as General Contractor to promote new initiatives both in construction and concession Dual Approach integrating Construction (EPC) + Concession 15
16 ASTALDI CONCESSION Leverage on know-how GREENFIELD MODEL BROWNFIELD MODEL Screening Financing Design & Construction Ramp Up Operation Refinancing Extension- Renovation ASTALDI CONSTRUCTION Leverage on commercial, contracting skills matured as a general contractor in construction ADD VALUE Manage risks during all phases (from opportunities screening to the launch) ASTALDI CONCESSION Manage day-to-day operations reducing costs and improving services to the community LEAD OPERATIONS Propose improvements and find refinancing opportunities BALANCE RISK Source: Astaldi Concessioni internal data Limited market risk thanks to minimum fee 16


17 ASTALDI CONCESSION TRANSPORT INFRASTRUCTURES WATER & ENERGY HEALTHCARE Km Highways Subways Power in MW 100% # of Beds > MARKET TRENDS CORRELATED BUSINESS Brescia-Padova Highway + increasing demand for new highway investments Turkey s airports report traffic growth of 14,2% in 2011 Service Area Royalties Automated Tolling Advertising Commercial duty-free areas Non-OECD energy consumption expected +68% higher by 2030, avg. 2.6% p.a. growth from Accounts for 93% of global energy growth Other power generation plants Renewable energy Public expenditure on healthcare in the EU could jump from 8% of GDP in 2000 to 14% in 2030 and continue to grow beyond that date Parking Hotels Generic services for patients Source: Astaldi Concessioni internal data; Turkish Government, British Petroleum 2013 energy outlook ; The future of healthcare in Europe by the Economist 17
18 ASTALDI CONCESSION Markets in which we operate Target market Current market CANADA ITALY (country risk: A2) 5 Car parks (Turin,Bologna,Verona): 3,700 lots Mestre Hospital: 680 beds Massa Carrara Hospital in Tuscany: 426 beds Lucca Hospital in Tuscany: 492 beds Pistoia Hospital in Tuscany: 466 beds Prato Hospital in Tuscany: 635 beds Milan Subway Line 5: 12km and 19 stations Milan Subway Line 4: 15km and 21 stations Highway Brescia-Padova S.p.A.: 180Km Highway Link of Ancona Port: 11Km Nogara-Mare Highway: 107km ITALY POLAND TURKEY TURKEY (country risk: Ba2) Etlik Hospital in Ankara: 3,200 beds Milas-Bodrum International Airport: 3,000,000 passengers per year Gebze-Izmir Highway: 421km 21 PPP/PF projects in portfolio 10 operational CHILE CHILE (country risk: Aa3) Chacayes hydroelectric project: 111MW Further opportunities in energy sector Relaves Mining Project Source: Astaldi Concessioni internal data, 18

19 ASTALDI CONCESSION A time hedged portfolio Build Growth (Ramp-up) Mature Today 2013 Relaves MM5 Bodrum Airport 4 Hospitals in Tucany 2 Hospitals in Tuscany Etlik Hospital Gebze-Izmir Highway Chacayes Plant Agua de San Pedro Sula 5 car parks Mestre Hospital Chacayes Plant MM5 Bodrum Airport 2 Hospitals in Tuscany Relaves 5 car parks Agua de San Pedro Sula Mestre Hospital Brescia- Padova Highway Brescia- Padova Highway 2015 Etlik Hospital Gebze-Izmir Highway Nogara-Mare Highway Gebze-Izmir Highway MM4 MM5 5 Car parks Brescia-Padova Highway 4 Hospitals in Tuscany Relaves Bodrum Airport Chacayes Plant Concession investments are financed 80/20-70/30 Debt/Equity 19


20 ASTALDI CONCESSION Portfolio description PROJECTS IN OPERATION Project Description Location Inflation indexed revenues (Y/N) 5 Car Parks 5 Carparks for 3,700 lots Turin, Bologna, Verona ITALY Guarantee on revenues Astaldi stake Start of Operations Exp. IRR % Yes 70-80% 100% In 20s 15-20% Brescia- Padova Highway 146Km + 36Km Northern Italy Yes 10% Operating 8-10% Mestre Hospital 680 beds Venice ITALY Yes 95% 34.5% % Chacayes Hydro Plant Hydrolectric Project 111MW Chile Yes 60% 27,3% % 20


21 ASTALDI CONCESSION Portfolio description PROJECTS IN CONSTRUCTION LATE STAGE Project Description Location Inflation indexed revenues (Y/N) Bodrum Int. Airport 3 mln passengers x year Guarantee on revenues Astaldi stake Start of Operations Exp. IRR % Turkey Yes 65% 92.9% 2012 T.B.D. (*) Milan Subway Line 5 (Stretch 1) 5 km, 9 stations Milan ITALY Yes 68% 40% % 4 Hospitals in Tuscany Massa Carrara: 426 beds; Lucca: 492 beds; Pistoia: 466 beds; Prato, 635 beds Tuscany ITALY Yes 95% 35% % (*) The concession agreement is presently under review. 21


 7 km, 10")


22 ASTALDI CONCESSION Portfolio description PROJECTS IN CONSTRUCTION - EARLY STAGE Project Description Location Inflation indexed revenues (Y/N) Milan Subway Line 5 (Stretch 2) 7 km, 10 stations Milan ITALY Yes Guarantee on revenues 100% on availability of the line Astaldi stake Start of Operations Exp. IRR % 31% % Gezbe-Izmir Highway 421 km Turkey Yes 85% 1 year; 55% following years 15.8% % Etlik Hospital in Ankara 3,200 beds Turkey Yes 85% 51% % Milan Subway Line 4 15 km, 21 stations Milan ITALY Yes 100% 9,7% % 22
23 APPENDIX 23

24 1Q 2012 ORDER BACKLOG AT 10.4BN 10.4bn ORDERS BACKLOG 4.4bn CONSTRUCTION BACKLOG (ABROAD) 24


25 1Q 2012 REVENUES AT 505M REVENUES BY GEOGRAPHICAL AREA REVENUES BY BUSINESS LINE 25
Ferrovial increases net profit by 12%, to 287 million euro
 All-time record backlog: 23.695 billion euro Ferrovial increases net profit by 12%, to 287 million euro Revenues expanded by 2.8% to 3.758 billion euro, supported by solid performance in the international
Interim Report 3m Bilfinger Berger SE, Mannheim May 10, 2012 Joachim Müller, CFO
 Interim Report 3m 2012 Bilfinger Berger SE, Mannheim May 10, 2012 Joachim Müller, CFO Bilfinger Berger SE Interim report 3m 2012 May 10, 2012 Page 1 3m 2012: Highlights Growth in output volume and orders
FY 2016 RESULTS BOLOGNA, MARCH 20 TH 2017
 RESULTS BOLOGNA, MARCH 20 TH GROUP 2 GROUP OVERVIEW STRONG GROWTH TRACK RECORD AND MOMENTUM STRATEGIC LOCATION AND WEALTHY CATCHMENT AREA Among top 50 airports in Europe # 7 airport in Italy by passengers
Agenda. Conclusion of Transform Key Perform 2020 initiatives. Perform 2020 financial framework. Information meeting
 Information meeting Agenda Conclusion of Transform 2015 Key Perform 2020 initiatives Perform 2020 financial framework 2 Transform 2015: first phase of group turnaround accomplished Strict capacity discipline
SGCIB Premium Review 2018
 SGCIB Premium Review 2018 29 November 2018 Christian Labeyrie Executive Vice-President and CFO Disclaimer This presentation may contain forward-looking objectives and statements about VINCI s financial
Third Quarter 2014 Results. 29 October 2014
 Third Quarter 2014 Results 29 October 2014 Highlights of the Third Quarter Operating environment Air France-KLM Economic environment remains weak Further currency volatility affecting revenues and results
Revenue is broken down below by geographical area: North America and the Pacific Area Italy Other European countries
 1.3 Business Revenue by geographical area Revenue is broken down below by geographical area: (Em) 2013 2012 2012 North America and the Pacific Area exchange rates 2,077.7 2,124.9 (2.2%) 1.3% Italy 1,154.1
J.P. Morgan 2019 Global Emerging Markets Corporate Conference. Miami, February 2019
 J.P. Morgan 2019 Global Emerging Markets Corporate Conference Miami, February 2019 This presentation may include forward-looking comments regarding the Company s business outlook and anticipated financial
Interim Report 6m 2014
 August 11, 2014 Interim Report 6m 2014 Investors and Analysts Conference Call on August 11, 2014 Joachim Müller, CFO Latest ad-hoc release (August 4, 2014) Reduction of forecast, primarily due to a further
PRESS RELEASE VINCI QUARTERLY INFORMATION AT 30 SEPTEMBER 2014
 Rueil Malmaison, 23 October PRESS RELEASE VINCI QUARTERLY INFORMATION AT 30 SEPTEMBER Revenue at 30 September 1 : 28.4 billion (-1.5% like-for-like) Good performance in Concessions 1 : - VINCI Autoroutes
Bilfinger Berger: Entering new growth phase
 Bilfinger Berger: Entering new growth phase Deutsche Bank German, Swiss & Austrian Conference, May 15 to 16, 2012 Roland Koch, CEO Andreas Müller, Head of Accounting and IR Bilfinger Berger SE Company
SEA BOARD OF DIRECTORS: 2017 STATUTORY FINANCIAL STATEMENTS AND NON-FINANCIAL REPORT APPROVED
 SEA BOARD OF DIRECTORS: 2017 STATUTORY FINANCIAL STATEMENTS AND NON-FINANCIAL REPORT APPROVED SEA Group results Passenger traffic: 31.6 million, up 8.9% (22 million at Milan Malpensa, growth of 14.1%)
Q Results Stockholm, 24 April Wolfgang M. Neumann, President & CEO Knut Kleiven, Deputy President & CFO
 Q1 2014 Results Stockholm, 24 April 2014 Wolfgang M. Neumann, President & CEO Knut Kleiven, Deputy President & CFO / Stockholm - a market with solid growth Expected investment volume until 2020 in STK
FIRST QUARTER 2017 RESULTS. 4 May 2017
 FIRST QUARTER 2017 RESULTS 4 May 2017 A resilient start of the year, traffic up 4.2% 20.9 million passengers carried, up 5.2%, traffic (RPK) up 4.2%, capacity (ASK) up 3.3% and load factor up 0.7pts Confirmation
Full go towards year end
 Beni Stabili: 9-month 2017 rents Full go towards year end Milan: October 24 th, 2017 Growth in operating metrics 1.5% L-f-L rental growth excl. TI assets 95.5% financial occupancy 93.1% excluding TI portfolio
H RESULTS BOLOGNA, SEPTEMBER 4 TH 2017
 H1 RESULTS BOLOGNA, SEPTEMBER 4 TH H1 GROUP 2 GROUP OVERVIEW STRONG GROWTH TRACK RECORD AND MOMENTUM STRATEGIC LOCATION AND WEALTHY CATCHMENT AREA H1 Among top 50 airports in Europe # 7 airport in Italy
Flughafen Wien Group Maintains Upward Trend: Passenger Growth and Strong Earnings Improvement in the First Nine Months of 2016
 Flughafen Wien Group Maintains Upward Trend: Passenger Growth and Strong Earnings Improvement in the First Nine Months of 2016 REVENUE increase to 545.4 million (+10.2%), EBITDA rise to 306.5 million (+13.1%
IAG results presentation. Quarter One th May 2018
 IAG results presentation Quarter One 2018 4 th May 2018 Highlights Willie Walsh, Chief Executive Officer Highlights Another strong quarter performance with an operating profit of 280m (5.6% margin, +2.3pts)
Santander 22 nd Annual Latin American Conference. Cancun, January 2018
 Santander 22 nd Annual Latin American Conference Cancun, January 2018 This presentation may include forward-looking comments regarding the Company s business outlook and anticipated financial and operating
FY 2018 RESULTS BOLOGNA, MARCH 15 TH 2019
 RESULTS BOLOGNA, MARCH 15 TH GROUP 2 BOLOGNA S AIRPORT MAIN CHARACTERISTICS 8.5 MILLION PAX 76.8% INTERNATIONAL PAX THE HIGHEST CONNECTIVITY GROWTH IN EU 2004-2014 +984% ACI Europe 2014 Airport Industry
Bologna, August 28th H Results
 Bologna, August 28th 2015 H1 2015 Results TABLE OF CONTENTS 1 COMPANY DESCRIPTION p. 3 2 H1 FINANCIALS p. 12 2 1. COMPANY DESCRIPTION 3 GROUP HIGHLIGHTS WEALTHY CATCHMENT AREA # 7 airport in Italy by passengers
AIRBUS H Roadshow Presentation. New York July 31 st, 2017
 AIRBUS H1 2017 Roadshow Presentation New York July 31 st, 2017 H1 2017 HIGHLIGHTS 2 Healthy commercial aircraft environment; robust backlog of 6,771 a/c supports ramp-up plans H1 financials reflect delivery
FY RESULTS ROADSHOW PRESENTATION
 1 FY RESULTS 2014 ROADSHOW PRESENTATION FY 2014 HIGHLIGHTS FOCUS ON EXECUTION 2 Strong financial performance Revenues: 61 bn, +5% vs. 2013 EBIT* before one off: 4.1 bn, +15% vs. 2013 EPS: 2.99, +61% vs.
SAS Q2 2017/2018 TELECONFERENCE
 SAS Q2 2017/2018 TELECONFERENCE 30 May 2018 Earnings as expected despite negative currency effect POSITIVES + Total revenue up MSEK 73 vs. LY + Currency adjusted yield up 0.6% vs. LY + EB-point sale revenue
Information meeting. Jean-Cyril Spinetta Chairman and CEO
 Information meeting Jean-Cyril Spinetta Chairman and CEO Forward-looking statements The information herein contains forward-looking statements about Air France-KLM and its business. These forward-looking
AIRBUS. H Roadshow Presentation. July 2018
 AIRBUS H1 2018 Roadshow Presentation July 2018 H1 18 HIGHLIGHTS 2 Robust commercial aircraft environment Backlog of ~7,200 a/c underpins ramp-up plans H1 financials reflect mainly A350 performance and
AIR ARABIA PJSC Q4 AND FULL YEAR COMMENTARY 2017
 AIR ARABIA PJSC Q4 AND FULL YEAR COMMENTARY 2017 Financial highlights Full year 2017 Passengers carried reached 8.53million at a seat factor of 79%. Turnover reached AED 3.74 billion. Yield margin fell
PRESS RELEASE VINCI - QUARTERLY INFORMATION AT 30 SEPTEMBER 2013
 Rueil Malmaison, 24 October 2013 PRESS RELEASE VINCI - QUARTERLY INFORMATION AT 30 SEPTEMBER 2013 Year-to-date 2013 revenue: 29.5 billion (+4.7% actual; +3.6% comparable basis) Confirmation of VINCI Autoroutes
9M 2018 RESULTS BOLOGNA, NOVEMBER 15 TH 2018
 9M RESULTS BOLOGNA, NOVEMBER 15 TH 9M GROUP 2 BOLOGNA S AIRPORT MAIN CHARACTERISTICS 9M 8.2 MILLION PAX 76.3% INTERNATIONAL PAX THE HIGHEST CONNECTIVITY GROWTH IN EU 2004-2014 +984% ACI Europe 2014 Airport
Bank of America Merrill Lynch 2018 Emerging Markets Corporate Credit Conference. Miami, May 2018
 Bank of America Merrill Lynch 2018 Emerging Markets Corporate Credit Conference Miami, May 2018 This presentation may include forward-looking comments regarding the Company s business outlook and anticipated
Preliminary Figures FY 2016
 February 14, 2017 Preliminary Figures FY 2016 Capital Markets Day 2017 Tom Blades (CEO) Disclaimer This presentation has been produced for support of oral information purposes only and contains forwardlooking
Interim results. 11 May 2010
 Interim results 11 May 2010 Introduction Andy Harrison Chief Executive Officer Strong performance despite disruption Improvement in revenue, margins and cash Continued network improvement has driven better
AIRBUS. Berenberg Conference. 23 May 2018
 AIRBUS Berenberg Conference 23 May 2018 SAFE HARBOUR STATEMENT 2 DISCLAIMER This presentation includes forward-looking statements. Words such as anticipates, believes, estimates, expects, intends, plans,
STAR Conference 2010, Milan. 18th March, 2010
 STAR Conference 2010, Milan 18th March, 2010 Acotel Group at a glance Technological Know How One of the leading players in the Information Society Growth based on technological competences and business
COMPANY PRESENTATION STAR CONFERENCE MILAN, MARCH 21 ST 2017
 COMPANY PRESENTATION STAR CONFERENCE MILAN, MARCH 21 ST GROUP 2 GROUP OVERVIEW STRONG GROWTH TRACK RECORD AND MOMENTUM STRATEGIC LOCATION AND WEALTHY CATCHMENT AREA Among top 50 airports in Europe # 7
SAS Group Presentation Carnegie, May 22, 2012 Sture Stölen, Head of IR
 SAS Group Presentation Carnegie, May 22, 2012 Sture Stölen, Head of IR 1 This is the SAS Group 128 destinations 27,2 million passengers 28 new routes to be launched 2012 1,085 daily flights Revenues 2011,
PPP MODEL FOR REFURBISHING AND MANAGING PRAGUE CENTRAL STATION
 PPP MODEL FOR REFURBISHING AND MANAGING PRAGUE CENTRAL STATION Andrea Odoardi CEO, Grandi Stazioni Ceska republika, Czech Republic Session 1A: Governance and financing: a new approach Content 2 The Mission
First Half 2013 Results. 16 mai 2013
 First Half 2013 Results 16 mai 2013 26 July 2013 Results Increasing effects of Transform 2015 Highlights of the First Half A difficult global economic environment Transform 2015 plan roll-out on track
German Investment Seminar
 January 2018 German Investment Seminar Dr. Matthias Zieschang, CFO Tanja Nagel, IR Disclaimer This document has been prepared by Fraport solely for use in this presentation. The information contained in
FLUGHAFEN WIEN AG. Q1/2017 Results
 FLUGHAFEN WIEN AG Q1/2017 Results Q1/2017 characterised by passenger growth and improved earnings Q1 passenger growth in Vienna of +3.7% (Group: +6.6%) despite later Easter (already in March in 2016, first
SAS Q3 2017/ August 2018
 SAS Q3 2017/2018 31 August 2018 Strong earnings in peak season POSITIVES Record number of passengers Total revenue up MSEK 936 vs. LY Currency adjusted yield up 1.1% vs. LY EB point sale up 27% vs. LY
Ramsay Health Care Limited Results Briefing Half Year ended 31 December 2018
 Ramsay Health Care Limited Results Briefing Half Year ended 31 December 2018 Craig McNally, Group Managing Director & Bruce Soden, Group Finance Director 28 February 2019 ramsayhealth.com Agenda Group
Deutsche Bank 16 th Annual Global Emerging Markets. New York, September 2017
 Deutsche Bank 16 th Annual Global Emerging Markets New York, September 2017 This presentation may include forward-looking comments regarding the Company s business outlook and anticipated financial and
PRESS RELEASE AEROPORTO GUGLIELMO MARCONI DI BOLOGNA S.p.A.: The Board of Directors approves the group results for the first nine months of 2017:
 PRESS RELEASE AEROPORTO GUGLIELMO MARCONI DI BOLOGNA S.p.A.: The Board of Directors approves the group results for the first nine months of 2017: Traffic growth continues with 6.3 million passengers (+6.7%
UBS 14 th Global Emerging Markets Conference. New York, November 2016
 UBS 14 th Global Emerging Markets Conference New York, November 2016 This presentation may include forward-looking comments regarding the Company s business outlook and anticipated financial and operating
AIRBUS FY 2017 ROADSHOW PRESENTATION
 AIRBUS FY 2017 ROADSHOW PRESENTATION February 2018 SAFE HARBOUR STATEMENT 2 DISCLAIMER This presentation includes forward-looking statements. Words such as anticipates, believes, estimates, expects, intends,
FOURTH QUARTER & FY 2012 EARNINGS RESULTS March 13, 2013
 FOURTH QUARTER & FY 2012 EARNINGS RESULTS March 13, 2013 Forward-Looking Statements This presentation may contain forward-looking statements, projections and estimates regarding circumstances or events
Norwegian Air Shuttle ASA
 Norwegian Air Shuttle ASA Q4 2017 Presentation 15 February 2018 Highlights Q4 2017 Added one 737-800 and two 787-9s to operations Financed the first aircraft with a combination of UKEF and JOLCO Agreed
H RESULTS BOLOGNA, SEPTEMBER 3 RD 2018
 H1 RESULTS BOLOGNA, SEPTEMBER 3 RD H1 GROUP 2 BOLOGNA S AIRPORT MAIN CHARACTERISTICS H1 8.2 MILLION PAX 76.3% INTERNATIONAL PAX THE HIGHEST CONNECTIVITY GROWTH IN EU 2004-2014 +984% ACI Europe 2014 Airport
Heathrow (SP) Limited
 Limited") Draft v2.0 10 Feb Heathrow (SP) Limited Results for year ended 31 December 2013 24 February 2014 Strong operational and financial performance in 2013 Passenger satisfaction at record high and over 72 million
Draft v2.0 10 Feb Heathrow (SP) Limited Results for year ended 31 December 2013 24 February 2014 Strong operational and financial performance in 2013 Passenger satisfaction at record high and over 72 million
Investor Presentation
 TUI Group Investor Presentation WestLB Deutschland Conference 2010 17 November 2010 TUI AG Investor Relations Seite 1 Future-related related statements This presentation contains a number of statements
Thank you for participating in the financial results for fiscal 2014.
 Thank you for participating in the financial results for fiscal 2014. ANA HOLDINGS strongly believes that safety is the most important principle of our air transportation business. The expansion of slots
Full Year 2009 Results
 Full Year 2009 Results 1 Antonio Vázquez Chairman & Chief Executive Officer 2 Highlights 2009 Strong decrease in revenues: weak demand and yield deterioration. High competition and drop of business traffic.
Record results driven by traffic growth and its positive dynamic, which has supported all key economic margins.
 PRESS RELEASE AEROPORTO GUGLIELMO MARCONI DI BOLOGNA: The Board of Directors approves draft and consolidated financial statements as at December, 31 2016. Record results driven by traffic growth and its
SAS Q1 2016/
 SAS Q1 2016/2017 08.03.2017 Weak Q1 as expected new structural actions underway Q1 in summary Positives + Currency adjusted passenger revenue up 5% + Strong development of ancillary revenues + Passengers
Unlocking the Value of Flexible Generation
 Unlocking the Value of Flexible Generation PJM SUMMIT September 7 th 2016 Matti Rautkivi 1 Wärtsilä INTERNAL 9/8/2016 Project IRR Unleveraged project IRR in PJM with simple cycle machine! Project IRR PJM
OPERATING AND FINANCIAL HIGHLIGHTS SUBSEQUENT EVENTS
 Copa Holdings Reports Financial Results for the Third Quarter of 2016 Excluding special items, adjusted net income came in at $55.3 million, or adjusted EPS of $1.30 per share Panama City, Panama --- November
Fourth Quarter and Full Year 2009
 Investor and analyst meeting: Fourth Quarter and Full Year 29 25 th February 21 2 The views expressed here contain some information derived from publicly available sources that have not been independently
For personal use only HILLS HOLDINGS HALF YEAR RESULTS FY2013
 HILLS HOLDINGS HALF YEAR RESULTS FY2013 TODAY KEY HIGHLIGHTS OUR FY13 FIRST HALF RESULTS GROUP PERFORMANACE FIRST HALF NPAT 1 $8.2M IN LINE WITH NOVEMBER AGM GUIDANCE. STRONG MANAGEMENT OF WORKING CAPITAL
SAS Group Q2 2012/13. Q2 Restructuring programme moving KPIs in the right direction
 SAS Group Q2 2012/13 1 Q2 Restructuring programme moving KPIs in the right direction Operating revenues +1.6%* Yield improvement of +2.7%* Forceful implementation of 4XNG plan: Unit cost down by 10.7%
Fourth Quarter and Full Year 2011 Results Presentation. February 1, 2012
 Fourth Quarter and Full Year 2011 Results Presentation February 1, 2012 This presentation may include forward-looking comments regarding the Company s business outlook and anticipated financial and operating
FY revenue on target, with growth of 6.5% (3.9% organic)
") Paris, November 14, 2014 FY revenue on target, with of 6.5% (3.9% organic) Contract Catering & Support Services revenue up 8.2%, reflecting solid 3.4% organic for French and international operations combined,
Paris, November 14, 2014 FY revenue on target, with of 6.5% (3.9% organic) Contract Catering & Support Services revenue up 8.2%, reflecting solid 3.4% organic for French and international operations combined,
JAPAN AIRLINES Co., Ltd. Financial Results 1 st Quarter Mar/2017(FY2016) July 29, 2016
 July 29, 2016") JAPAN AIRLINES Co., Ltd. Financial Results Mar/2017(FY2016) July 29, 2016 Today s Topics P.1 P.2 P.13 From the first quarter of this fiscal year, figures for Revenue Passengers Carried, ASK, RPK and Load
JAPAN AIRLINES Co., Ltd. Financial Results Mar/2017(FY2016) July 29, 2016 Today s Topics P.1 P.2 P.13 From the first quarter of this fiscal year, figures for Revenue Passengers Carried, ASK, RPK and Load
Vueling Airlines 2009 Fourth-Quarter, Full-Year Financial Results. The 100-milion turnaround story
 Vueling Airlines 2009 Fourth-Quarter, Full-Year Financial Results The 100-milion turnaround story Barcelona, February 23 rd, 2009 Introduction Revenues Operations and costs Outlook for 2010 Vueling has
Norwegian Air Shuttle ASA
 Norwegian Air Shuttle ASA Q1 2018 Presentation 26 April 2018 Highlights Q1 2018 Successfully completed private placement of NOK 1.3 billion Added two 737-800s and six 787-9s to operations Launched interline
Flughafen Wien Group Continues on Success Path in the First Quarter of 2016
 Flughafen Wien Group Continues on Success Path in the First Quarter of 2016 Upward revaluation of stake in Malta Airport and good business development lead to strong increase in the net profit for the
OPERATING AND FINANCIAL HIGHLIGHTS
 Copa Holdings Reports Net Income of US$32.0 Million and EPS of US$0.72 for the Second Quarter of 2012 Excluding special items, adjusted net income came in at $58.6 million, or EPS of $1.32 per share Panama
2018 full-year results
 2018 full-year results 01 Message from Chairman & CEO 02 FY 2018 Results 03 Business drivers 04 Outlook 02 FY 2018 financial results Key figures Revenue 2.85 Bn ROP 115 M Net debt 252 M Free cash flow
2007/08 Full Year Results Investor Briefing
 2007/08 Full Year Results Investor Briefing Highlights of Result Profit before tax up 46% to $1,408 million Up 36% on the reported result Margin improvement $3 billion of Sustainable Future Benefits achieved
PRESS RELEASE THE BOARD OF DIRECTORS APPROVES THE CONSOLIDATED HALF-YEARLY FINANCIAL REPORT OF 30 JUNE 2017
 PRESS RELEASE THE BOARD OF DIRECTORS APPROVES THE CONSOLIDATED HALF-YEARLY FINANCIAL REPORT OF 30 JUNE 2017 DATA EXCEED FORECASTS: STRONG GROWTH FOR EBITDA (+31%), EBIT (+51%) AND NET INCOME OF THE GROUP
Q Earnings Financial Results for the First Quarter Ended June 30, July 28, 2016 OMRON Corporation
 Q1 2016 Earnings Financial Results for the First Quarter Ended June 30, 2016 July 28, 2016 OMRON Corporation Summary Q1 Results Both sales and operating income are in line with internal plan (decreased
2005 Interim Results. September 7, 2005
 2005 Interim Results September 7, 2005 Outline First-Half 2005 Results Business activity at August 31, 2005 Update on the Real Estate and Expansion Strategies 2 First-half 2005 +22.8% Solid growth in interim
Management Presentation. November 2011
 Management Presentation November 2011 Forward looking statements This presentation as well as oral statements made by officers or directors of Allegiant Travel Company, its advisors and affiliates (collectively
GATWICK AIRPORT JOINS VINCI AIRPORTS December 2018
 GATWICK AIRPORT JOINS VINCI AIRPORTS December 2018 Asset presentation Gatwick is the 2 nd largest airport in the UK and the 8 th busiest in Europe with 46 mpax Key features 46 mpaxin FY18, in the wealthiest
EADS: New Stage of Maturity. Nathalie Errard VP Investor Relations
 EADS: New Stage of Maturity Nathalie Errard VP Investor Relations Lagardere Investor Day, June 1 st, 2006 1 Content Integration and Rise to Leadership 2005 Group Financials New Challenges, New Growth 2
Managing through disruption
 28 July 2016 Third quarter results for the three months ended 30 June 2016 Managing through disruption 3 months ended Like-for-like (ii) m (unless otherwise stated) Change 30 June 2016 30 June 2015 change
OPERATING AND FINANCIAL HIGHLIGHTS
 Copa Holdings Reports Financial Results for the Fourth Quarter of 2015 Excluding special items, adjusted net income came in at $31.7 million, or EPS of $0.73 per share Panama City, Panama --- February
Minor International Public Company Limited
 Minor International Public Company Limited Management Discussion & Analysis MINT s financial performance as of 30th June 2008 Summary of Key Financial Performance 2Q08 Performance Minor International Public
Balance sheets and additional ratios
 Balance sheets and additional ratios amounts in millions unless otherwise stated Consolidated balance sheets Dutch guilders USD* June 30, December 31, June 30, December 31, 1997 1996 1997 1996 Fixed assets
Italo - Nuovo Trasporto Viaggiatori
 Italo - Nuovo Trasporto Viaggiatori Introduction to Italo Company profile Introduction First, private high-speed operator in the European passenger rail industry operating in Italy under the Italo brand
Q Earnings Financial Results for the Third Quarter Ended December 31, January 29, 2015 OMRON Corporation
 Q3 2014 Earnings Financial Results for the Third Quarter Ended December 31, 2014 January 29, 2015 OMRON Corporation Contents 1. Summary 2. Q1-Q3 Results P. 2 P. 4 3. Full-Year Forecast P. 13 4. Corporate
Investment Highlights
 Third Quarter 2014 Investment Highlights 1 Mexican airport portfolio positioned to take full advantage of global growth. 2 Diversified business model contributing to earnings resilience. 3 Well-defined
Financial Results 3 rd Quarter MAR/2016 (FY2015)
") Financial Results MAR/2016 (FY2015) January 29 th, 2016 CONTENTS P.1 P.2 P.3 P.4~ Overview of FY MAR/16 Results Operating Revenue Operating Profit 1,030 1,020 1,010 +1.0Bn 1,022.3 1,023.4 (+0.1%) 180 160
Financial Results MAR/2016 (FY2015) January 29 th, 2016 CONTENTS P.1 P.2 P.3 P.4~ Overview of FY MAR/16 Results Operating Revenue Operating Profit 1,030 1,020 1,010 +1.0Bn 1,022.3 1,023.4 (+0.1%) 180 160
2005 Q3 investor update. 25 August 2005
 2005 Q3 investor update 25 August 2005 1 This communication is directed only at (i) persons having professional experience in matters relating to investments who fall within the definition of investment
Financial Results 1 st Quarter Mar/2016 (FY2015) 30 July, 2015
 30 July, 2015") Financial Results Mar/2016 (FY2015) 30 July, 2015 Today s Topics P.2 P.3 P.15 1 Overview of FY Mar/2016 Financial Results Operating Revenue Operating Profit 320 307.0 +4.9Bn (+1.6%) 312.0 50 +17.6Bn (+94.6%)
Financial Results Mar/2016 (FY2015) 30 July, 2015 Today s Topics P.2 P.3 P.15 1 Overview of FY Mar/2016 Financial Results Operating Revenue Operating Profit 320 307.0 +4.9Bn (+1.6%) 312.0 50 +17.6Bn (+94.6%)
J.P. Morgan 9 th Annual Global Emerging Markets Corporate Conference. Miami, February 2018
 J.P. Morgan 9 th Annual Global Emerging Markets Corporate Conference Miami, February 2018 This presentation may include forward-looking comments regarding the Company s business outlook and anticipated
Management Presentation. May 2013
 Management Presentation May 2013 Forward looking statements This presentation as well as oral statements made by officers or directors of Allegiant Travel Company, its advisors and affiliates (collectively
Fourth Quarter and Full Year 2009 Results Presentation January 27, 2010
 Fourth Quarter and Full Year 2009 Results Presentation January 27, 2010 This presentation may include forward-looking comments regarding the Company s business outlook and anticipated financial and operating
Fourth Quarter 2006 Results Presentation February 15, 2007
 Fourth Quarter 2006 Results Presentation February 15, 2007 This presentation may include forward-looking comments regarding the Company s business outlook and anticipated financial and operating results.
NORWEGIAN AIR SHUTTLE ASA QUARTERLY REPORT SECOND QUARTER 2006 [This document is a translation from the original Norwegian version]
![NORWEGIAN AIR SHUTTLE ASA QUARTERLY REPORT SECOND QUARTER 2006 [This document is a translation from the original Norwegian version]](/thumbs/74/71229964.jpg "NORWEGIAN AIR SHUTTLE ASA QUARTERLY REPORT SECOND QUARTER 2006 [This document is a translation from the original Norwegian version]") NORWEGIAN AIR SHUTTLE ASA QUARTERLY REPORT SECOND QUARTER 2006 SECOND QUARTER IN BRIEF had earnings before tax of MNOK 24.8 (20.6) in the second quarter. The operating revenue increased by 44 % this quarter,
NORWEGIAN AIR SHUTTLE ASA QUARTERLY REPORT SECOND QUARTER 2006 SECOND QUARTER IN BRIEF had earnings before tax of MNOK 24.8 (20.6) in the second quarter. The operating revenue increased by 44 % this quarter,
AIRBUS. Member States Shareholder Meeting. Toulouse 4 October 2017
 AIRBUS Member States Shareholder Meeting Toulouse 4 October 2017 SAFE HARBOUR STATEMENT 2 DISCLAIMER This presentation includes forward-looking statements. Words such as anticipates, believes, estimates,
Fourth quarter 2018 Martin Lundstedt, President and CEO
 Martin Lundstedt, President and CEO FOURTH QUARTER HIGHLIGHTS NET SALES SEK bn 91.6 12 months 391 bn 105.8 Net sales +SEK 14.2 bn, up 16% (+10% excl. currency) Adjusted operating income increased to SEK
2014 FULL-YEAR RESULTS
 2014 FULL-YEAR RESULTS ARNAUD LAGARDÈRE General and Managing Partner MARCH 11, 2015 2014 FULL YEAR RESULTS Ongoing implementation of our strategy 2014 FULL-YEAR RESULTS / MARCH 11, 2015 MEGATRENDS ANALYSIS
Analyst and Investor Conference Call Q Ulrik Svensson, CFO and Member of the Executive Board
 Analyst and Investor Conference Call Q2 2017 Ulrik Svensson, CFO and Member of the Executive Board Frankfurt, 2 August 2017 Disclaimer The information herein is based on publicly available information.
FIRST HALF 2016 RESULTS. 27 July 2016
 FIRST HALF 2016 RESULTS 27 July 2016 Highlights of the Second Quarter 2016 Environment Operations Financial highlights High level of geopolitical uncertainties, including Brexit Terrorist attacks in Europe
PRESS RELEASE Financial Results. Rising passenger traffic at 12.5m Exceeding 1bn in consolidated revenue
 PRESS RELEASE 2016 Financial Results Rising passenger traffic at 12.5m Exceeding 1bn in consolidated revenue Kifissia, 23 March 2017 AEGEAN reports full year 2016 results with consolidated revenue at 1,020m,
Heathrow (SP) Limited
 Limited") 28 April 2014 Heathrow (SP) Limited Results for three months ended 31 March 2014 Strong operational and financial performance at the outset of the new regulatory period Highest ever passenger satisfaction
28 April 2014 Heathrow (SP) Limited Results for three months ended 31 March 2014 Strong operational and financial performance at the outset of the new regulatory period Highest ever passenger satisfaction
Management Presentation. September 2011
 Management Presentation September 2011 Forward looking statements This presentation as well as oral statements made by officers or directors of Allegiant Travel Company, its advisors and affiliates (collectively
26 October 2017 Icelandair Group Interim Report NET PROFIT USD 101 MILLION IN THIRD QUARTER
 NET PROFIT USD 101 MILLION IN THIRD QUARTER Total income in Q3 up by 10% between years, to USD 536.0 million Passenger revenue higher than expected EBITDA unchanged year on year, at USD 161.1 million Passenger
PRESS RELEASE AEROPORTO GUGLIELMO MARCONI DI BOLOGNA S.p.A.: the Board of Directors approves the Group Q Results.
 PRESS RELEASE AEROPORTO GUGLIELMO MARCONI DI BOLOGNA S.p.A.: the Board of Directors approves the Group Q1 2017 Results. Passenger traffic reached approx. 1.6 million passengers (+4.6% versus 2016), thanks