4. Didymo: An Otago context
|
|
|
- Annabella Robinson
- 5 years ago
- Views:
Transcription

1 11 4. Didymo: An Otago context The Didymo infected watercourses of Otago can be separated into three main categories: flow regulated rivers, unregulated rivers, and lakes. Key! = Regulated rivers with Didymo.! = Unregulated Rivers with Didymo.! = Lakes with Didymo.! = No known Didymo incursion. Figure 4.1 Otago Rivers infected with Didymo. Unregulated rivers with Didymo are shown in red, regulated rivers with Didymo are shown in green, infected lakes are in light blue

2 Didymo and flow regulated rivers of Otago Flow regulated rivers are those that have a relatively stable flow regime. Such rivers tend to have some form of control structure such as a dam or weir or a flow controlling lake. The five flow regulated rivers in Otago infected by Didymo are Diamond Creek and the Hawea, Greenstone Clutha River/Mata-Au and Fraser Rivers. Though not in Otago, the Waitaki River also needs to be acknowledged as large amounts of water are taken from it and used in the Otago region for irrigation (Figure 4.1) Hawea River The Hawea River was the first river in Otago to be identified as infected by Didymo (September 25) and is located in the upper Clutha catchment (Figure 4.1). The Hawea River flows from Lake Hawea and joins the Clutha River/Mata-Au at Albert Town. Flows in the Hawea River are controlled at Hawea Dam and vary between 8 and 2 cumecs. Due to large flow fluctuations in the Hawea River, Didymo is only present in the permanently wetted area of the river (Figure 4.2) and not visible from the bank during high flows. Figure 4.2 Thick cover of Didymo in the Hawea River visible at low flows (G. Martin) There have been several observations of unusual thin grey mats of Didymo in the lower Hawea River near Hawea Domain. Laboratory analysis revealed that the mats were comprised almost entirely of dead stalk material and cells. It is likely that these mats were baked onto rocks during lower than normal flows when they were exposed to the air for an extended period of time (Figure 4.3). A subsequent high flow event appears to have caused a moderate amount of bed movement as shown by the clean rocks in Figure 4.3.
 There are six consented water takes from the Hawea River; four for irrigation, one for town supply and one for communal stock water. 4.1.")
3 13 Figure 4.3 The unusual growth form of Didymo observed in the lower Hawea River (G. Martin) There are six consented water takes from the Hawea River; four for irrigation, one for town supply and one for communal stock water Clutha River/Mata-Au Once Didymo was established in the Hawea River, it was inevitable that the infestation would move down the catchment to the Clutha River/Mata-Au. By the time the Hawea incursion was discovered, Didymo was already present in the Clutha River/Mata-Au and had moved down to Lake Dunstan. The Clutha/Mata-Au between Alexandra and Lake Roxburgh was infected during the summer of 26. By July 26, Didymo was observed in the lower Clutha River/Mata- Au at Roxburgh and Beaumont and is now believed to infest the entire river (Figure 4.2). It is interesting to note that Didymo appears to have moved through or around two lakes (Dunstan and Roxburgh) as it has moved down the system. It is unknown if it simply drifted through the lake or was transported below the lakes by human activity. Monitoring is currently being undertaken by the Otago Regional Council in an attempt to answer this question. There are 5 consented water takes from the main stem of the Clutha River/Mata-Au, the majority of which are used for irrigation. It should also be noted that takes of under 1 l/s are a permitted activity under the Otago Regional Council Regional Plan: Water and do not require formal consent. So the actual number of irrigation takes on the Clutha River/Mata-Au is likely to be much higher than 5. There have been reports from the Upper Clutha River/Mata-Au of Didymo clogging intake screens and center pivot nozzles (T Banks, G Martin, pers. comm.).
4 Fraser River Didymo cells were first found in the Fraser River in early May 26, before any visible colonies were present. A detailed drift net survey undertaken in July 26 found that Didymo was only present downstream of a pipe that brings water into the river from Lake Dunstan (Figure 4.2 & Figure 5.4), indicating that Didymo had in fact moved through the lake and that the lake was the source of the infection. A detailed description of Didymo in the Fraser River is provided in the Fraser River Monitoring Study (Chapter 5.2). There are six consented water takes from the Fraser River, all of which are for irrigation and frost fighting Waitaki River Although the Waitaki River is not within the Otago Region, there is a substantial amount of water taken from the river to irrigate land in North Otago. The three largest Otago water takes from the Waitaki River are the Waitaki Plains Irrigation Scheme, North Otago Irrigation Company and Horse Gully Irrigation Scheme Diamond Creek Diamond Creek is an outlet of Lake Reid and is a tributary of the Rees River in the Queenstown Lakes District. Didymo was first discovered in Diamond Creek in January 27 approximately 2 m upstream of the Rees confluence at a fishing access point. Flows in Diamond Creek are likely to be relatively stable as it is lake-fed, but the severity of the bloom is unclear. There are no consented water takes from Diamond Creek Greenstone River The Greenstone River is an outlet of Lake McKellar and is a tributary of Lake Wakatipu. It is characterised by a high degree of naturalness and is relatively free of disturbance from human activities. The Greenstone is a highly valued trout fishery and is also a popular tramping destination. There are four consented water takes from the Greenstone River to provide drinking water to Department of Conservation huts. 4.2 Didymo and unregulated rivers in Otago Unregulated rivers are those that do not drain a lake or have no upstream control structure and typically have much more variable flow regimes. The 1 unregulated rivers in Otago that are currently infected with Didymo are the Von, Matukituki, Makarora, Wilkin, Lindis, Motatapu, Young, Cardrona, Kakanui and Dart Rivers. As yet there have been no reports received by ORC of Didymo reaching nuisance levels in any of Otago s unregulated rivers.
5 Von River The Von River flows into Lake Wakatipu and was the first unregulated river known to be infected in Otago (October 25). The Von is a highly valued trout fishery and it is more than likely that this incursion was a result of anglers using contaminated gear from the nearby Mararora River in Southland. There are no consented abstractions in the Von catchment Matukituki River The Matukituki River flows into the west side of Lake Wanaka and is popular with anglers, trampers and jet boaters. Although there are no consented takes for irrigation from the Matukituki main stem, there are takes from tributaries of the Matukituki for power generation, domestic supply and snow making Makarora River The Makarora River flows into the head of Lake Wanaka and is frequently used by anglers, kayakers and jet boaters. There are no consented takes for irrigation on the Makarora main stem, though a small amount of water is taken from some of its tributaries for domestic supply Wilkin River The Wilkin River is a tributary of the Makarora River, with its confluence approximately five km upstream of Lake Wanaka, which is heavily used by jet boaters, anglers, kayakers and trampers. There are no consented abstractions in the Wilkin catchment Motatapu River The Motapatu River is a tributary of the Matukituki River and is used mainly by anglers, trampers and kayakers. There are no consented water takes from the main stem of the Motatapu River, though there are takes from some of its tributaries for the purposes of domestic supply and snow making Young River The Young River is a tributary of the Makarora River, is used mainly by trampers and anglers and has no consented water takes. It is likely that Didymo was brought into the Young catchment by anglers or jet boaters moving up from the Makarora River Lindis River The Lindis River is a tributary of the Clutha River/Mata-Au and is used mainly by anglers. Water abstraction from the Lindis for irrigation is extremely high, with the lower reaches completely drying for several weeks during the irrigation season. Didymo was first found in the Lindis River in January 27 at Ardgour Rd Bridge, although the full extent of the infection is not known at this stage.
6 Cardrona River The Cardona River is a tributary of the upper Clutha River/Mata-Au, and is heavily abstracted for irrigation. There are 38 consented water takes from the Cardrona Catchment. The Cardrona River is also an important spawning river for brown and rainbow trout from the Clutha River/Mata-Au and Lake Dunstan Dart River The Dart is a glacial-fed river that flows into the head of Lake Wakatipu, and is used heavily by jet boaters and trampers. There is a substantial amount of glacial flour suspended in the water column, giving the water a milky appearance. There are no consented water takes in the Dart River Kakanui River The Kakanui is a coastal river that flows into the Pacific Ocean approximately 1km south of Oamaru. The Kauru River, which is the main tributary of the Kakanui, supports the largest population of New Zealand s most endangered freshwater fish, the lowland long-jawed galaxiid. The Kakanui supports an adult brown trout fishery and is also heavily allocated, with 32 consented surface water takes. 4.3 Didymo and lakes in Otago Didymo colonies have been observed growing in two Otago lakes, Wakatipu and Dunstan. Lake Wanaka is also considered infected due to inflows from the Matukituki and Makarora Rivers (Figure 4.1). As yet there have been no reports received by ORC of Didymo reaching nuisance levels in lakes except where it is washed in from tributaries Lake Dunstan Didymo was first found in Lake Dunstan in November 25, presumably having moved down the Clutha River/Mata-Au from the Hawea infestation. Following blooms in the Clutha River/Mata-Au, masses of dead stalk material have been observed settling in the upper sections of the lake and smothering large beds of the invasive macrophyte Lagarosiphon major. In areas with reasonable flow, Didymo has also been observed growing on Lagarosiphon, causing significant dieback (G Martin, pers. comm.). Although there have been several reports of Didymo drifting into Lake Dunstan from the Clutha/Mata-Au and becoming a nuisance to anglers, this does not seem to have adversely affected the trout fishery (M Trotter, pers. comm.). It is apparent that most of the Didymo biomass that enters Lake Dunstan from the Upper Clutha River/Mata-Au settles out relatively quickly once flow is reduced.
7 17 There are 17 consented water takes from Lake Dunstan, most of which are used for irrigation. As with the Clutha/Mata-Au, any takes under 1 l/s are considered a permitted activity and so the actual number of takes is likely to be greater than this figure Lake Wakatipu Didymo was first observed growing on the margins of Lake Wakatipu near the mouth of the Von River in November 25. Subsequent colonies have also been found opposite the mouth of the Greenstone River near Pigeon Island and Queenstown Bay (Figure 2.5). There are nine consented takes from Lake Wakatipu; three for irrigation and six for domestic or communal supply. As with Lake Dunstan and the Clutha/Mata-Au, water takes less than 1 l/s are considered a permitted activity under the Regional Plan: Water so the actual number of takes from the lake are likely to be substantially higher.
8 18 5. Otago Regional Council Didymo projects 5.1 Photographic monitoring of Didymo in selected rivers in Otago Introduction Although several large research projects on the ecological effects of Didymo have been funded by Biosecurity New Zealand, much of its basic ecology is still unknown. Seasonal growth patterns, preferred habitat and growth rates have been based on reports from the northern hemisphere. Much of the anecdotal evidence available from New Zealand does not support these assumptions. With this in mind, the Otago Regional Council established a series of reference photo sites in an attempt to track changes in Didymo growth in the Hawea River after it was discovered there in November 25. Although uninfected at this time, a site was also established on the Fraser River in April 26 on the assumption that Didymo would move down the Clutha River/Mata-Au and enter the Fraser River through the Lake Dunstan augmentation pipe. The photographic records for the Clutha River/Mata-Au, Fraser and Hawea River were combined with hydrographs for each river to provide an indication of the flow conditions at each sampling time Hawea River Flows in the Hawea fluctuated between 1 and 2 cumecs from mid June to 12 August when they dropped to approximately 5 cumecs (Figure 5.1). From 3 September, flows reduced further to approximately 12 cumecs and remained stable until mid-january. The photographs (Appendix 1) show that no Didymo could be seen on the substrate at the beginning of monitoring in early April. The photograph taken on the 23 June shows streamers of Didymo caught up in vegetation, but it is not until late July that live Didymo colonies are first visible. A substantial increase in visible Didymo colonies coincides with the beginning of the stable flow period in September. There was also a significant increase in biomass during early January, which is clearly shown on 12 January and 22 January photographs (Appendix 1). River Flow (Cumecs) Photo Taken at Clutha River/Mata-Au Confluence 1/3/6 1/4/6 1/5/6 1/6/6 1/7/6 1/8/6 1/9/6 1/1/6 1/11/6 1/12/6 Date Figure 5.1 Hydrograph of the flow in the Hawea River. Pink squares indicate when the photographs in Appendix 1 were taken
9 Clutha River/Mata-Au at Maori Point Rd The flow patterns in the Clutha River/Mata-Au (Figure 5.2) were largely driven by inflows from the Hawea River until 1 September 26. After this flows in the Hawea River were minimal and constant, with most of the flow variability of the Clutha River/Mata-Au being driven by inflows from Lake Wanaka and the Cardrona River. Didymo was evident in the photographs (Appendix 2) from the initial monitoring in April 26. The May 12 photograph shows a distinct increase in biomass which can be seen to be sloughing off by 2 June. On 21 July small colonies are once again visible, which are seen to grow rapidly. The photograph of August 14 again shows a high biomass which is evident throughout the September photographs. After September flows are high and it is difficult to gauge the extent of Didymo cover, although the photograph of October 3 shows Didymo caught around the stake which suggests sloughing had occurred. The photograph taken on October 9 still shows a substantial amount of Didymo attached to rocks. By 15 December it appears new colonies are forming which have spread to cover the entire rock surface by January 12. River Flow (Cumecs) Photo Taken at Maori Pt Rd 1/3/6 1/4/6 1/5/6 1/6/6 1/7/6 1/8/6 1/9/6 1/1/6 1/11/6 1/12/6 Date Photographed Figure 5.2 Hydrograph of the flow in the Clutha River/Mata-Au. Pink squares indicate when the photographs in Appendix 2 were taken Fraser River at Marshall Rd The Fraser River was subject to very stable flows (between 2 and 3 cumecs) from January 26 and the end of September 26 (Figure 5.3), as much of the water from the upper catchment was captured by the Fraser Dam. Flows from October through to January 27 were highly variable as the Fraser Dam overtopped, with several flood events between 1 and 18 cumecs.
10 2 River Flow (Cumecs) Photo Taken at Marshall Rd 1/3/6 1/4/6 1/5/6 1/6/6 1/7/6 1/8/6 1/9/6 1/1/6 Date Photographed Figure 5.3 Hydrograph of the flow in the Fraser River. Pink squares indicate when the photographs in Appendix 3 were taken Didymo was initially absent from the Fraser River, but can clearly be seen in the photographs (Appendix 3) from May 12. The July 24 photograph shows the presence of small colonies, and by August 14 it can be seen that there has been a substantial increase in biomass. There was a large increase in flow on October 13 (3 to 17 cumecs), which is depicted in the photographs. However, this didn t seem to have affected Didymo on the channel margins. Field observations during this period indicate a substantial amount of sloughing and bed moving occurred mid-channel during this event Conclusions Although analysis of reference photos is difficult during high flows, the results indicate that Didymo growth is favoured by periods of stable flow and is not necessarily affected by seasonal limitations (e.g. temperature or photoperiod). High Didymo biomass was not observed in the Hawea River until stable flows in September after four months of highly variable flows. In the Fraser River, Didymo reached its highest biomass after an extended period of stable flow from January to the end of September. Highly variable flows from October to January caused a significant decrease of Didymo biomass in the middle of the channel; this was less pronounced closer to the margins. High Didymo growth was also observed in the Clutha River/Mata-Au during periods of stable flow. However, large flow fluctuations at this site made discerning any strong patterns difficult.
11 Growth patterns of Didymo: A case study of the Fraser River Since Didymo was discovered in New Zealand in 24, intensive research has been undertaken by a variety of organisations in an attempt to ascertain its effects on river ecosystems and assess methods of detection and control. However, several areas of basic ecology of Didymo in New Zealand have not been reported. These include two questions: What are the seasonal growth patterns of Didymo? What conditions trigger a Didymo bloom? By July 26, there had been no studies completed in response to this knowledge gap, or to track a new incursion in a NZ context. In response to this, photo reference work on the Fraser River was upgraded to a more detailed monitoring study to help answer some of these basic questions and allow for better informed management decisions in the future The Fraser River environment Water from the upper Fraser River is substantially regulated by Pioneer Energy at Fraser Dam. Water is released from Fraser Dam to a smaller secondary dam at the top of Fraser Gorge, and from here is piped to a turbine at the bottom of the gorge. This drastically reduces flows through the Fraser Gorge except during periods of high flow in the upper catchment when the dam is over-topped. Water is dropped through the turbine where it enters the river again at the bottom of the gorge. Downstream of the turbine outlet most of the water is directed into an irrigation raceway operated by the Earnscleugh Irrigation Company (EIC). To augment flows below the EIC take during the irrigation season, up to 1 m 3 /s is piped from Lake Dunstan to maintain flow in the lower Fraser River (Figure 5.4). Because of the differing physio-chemistry and hydrology of the upper and lower sections of the Fraser River it is not feasible to establish control sites above the Didymo incursion. The lack of control sites makes an impact assessment of Didymo invasion difficult, but still provides an excellent opportunity to undertake a descriptive study of growth and colonisation of Didymo over time in a newly infected system Monitoring sites Initial water column sampling indicated that Didymo was not present upstream of the Lake Dunstan pipe outlet at Fraser Domain. Four monitoring sites were selected between the Fraser Domain and the confluence of the Fraser and Clutha River/Mata-Au; Fraser Rd, Laing Rd, Earnscleugh Rd and Marshall Rd (Figure 5.4).


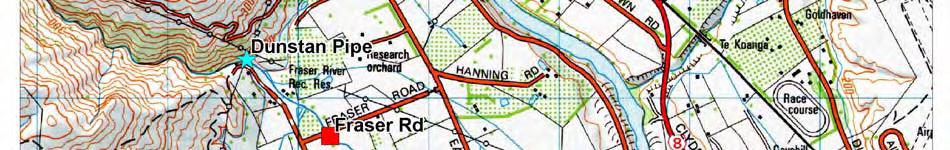
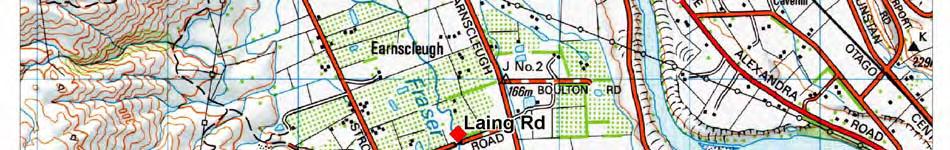
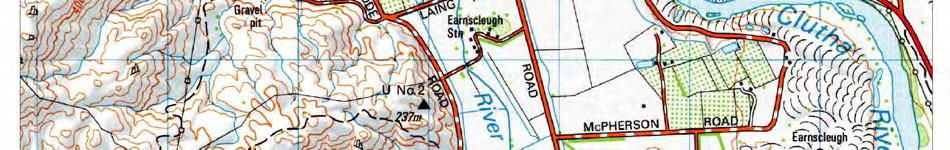
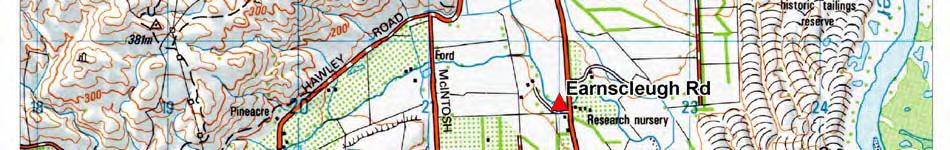
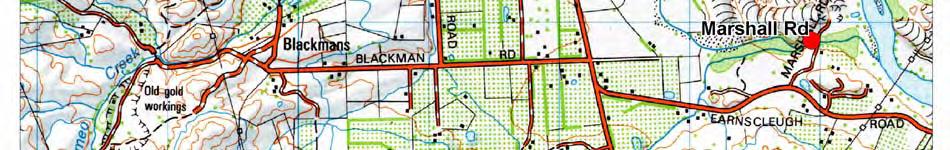
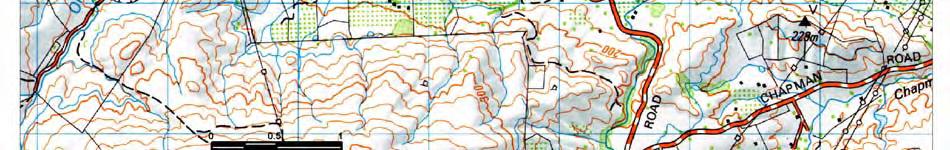
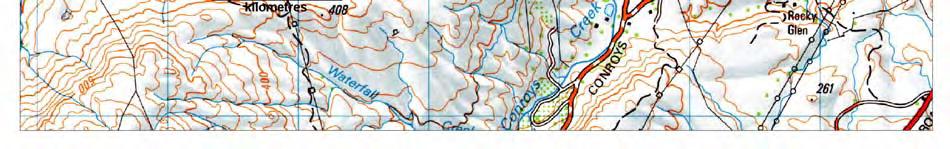
12 22 Figure 5.4 Fraser River monitoring sites (shown in red) and Lake Dunstan augmentation discharge (shown in blue)
 and high velocities towards the middle of the channel.")
 is located approximately 5m upstream of the Earnscleugh Rd Bridge, with a relatively wide channel ( 1 m).")
13 Site descriptions The Marshall Rd monitoring site (Figure 5.5) is located approximately 3m upstream of the confluence of the Fraser River and Clutha River/Mata-Au Rivers. This site differs from those further upstream by its relatively narrow confined channel ( 6m) and high velocities towards the middle of the channel. It is also the most shaded of the sites, with willows lining most of the bank. Figure 5.5 Marshall Rd monitoring site The Earnscleugh Rd site (Figure 5.6) is located approximately 5m upstream of the Earnscleugh Rd Bridge, with a relatively wide channel ( 1 m). Shading is minimal and channel velocities are low with more laminar flow across the entire channel. Figure 5.6 Earnscleugh Rd monitoring site
 is located approximately 5m downstream of the Laing Rd Bridge and is characterised by its shallow, wide (>15 m), and un-shaded channel.")
 is located 3m upstream of the Fraser Rd Bridge and is characterised by its narrow (<8 m) channel and large substrate size (Figure 5.9).")
14 24 The Laing Rd monitoring site (Figure 5.7) is located approximately 5m downstream of the Laing Rd Bridge and is characterised by its shallow, wide (>15 m), and un-shaded channel. Figure 5.7 Laing Rd monitoring site The Fraser Rd site (Figure 5.8) is located 3m upstream of the Fraser Rd Bridge and is characterised by its narrow (<8 m) channel and large substrate size (Figure 5.9). Due to this narrow channel, flows are relatively high but the substrate is very stable with minimal bed movement during high flows. Figure 5.8 Fraser Rd monitoring site
15 Substrate composition Substrate composition was sampled using a Wolman sampler (Wolman, 1954) and the percentage of each size class calculated (Figure 5.9). The substrate at Earnscleugh Rd is comprised mainly of medium gravels, which is homogeneous across the entire channel. The substrate composition at Fraser Rd consists predominantly of a well-armoured layer of large cobbles and boulders (85% of total bed composition) with small pockets of gravel. The substrate at Laing Rd is dominated by small gravels and sand which is largely homogeneous across the entire channel. Marshall Rd is characterised by having stable margins comprised of cobbles and a largely mobile mid-channel area of cobbles interspersed with sand and small gravels. Substrate size composition (%) <8mm² mm² mm² mm² mm² mm² mm² mm² mm² mm² mm² >256mm² Earnscluegh Rd Fraser Rd Laing Rd Marshall Rd Site Figure 5.9 Substrate composition of monitoring sites Near-bed velocities A transect of 5 velocity measurements were taken at a depth of.5m from the stream bed during each sampling run (Figure 5.1). Results indicate that near-bed velocity is driven largely by the interaction of channel width and substrate size. Earnscleugh Rd, with its wide channel and moderate substrate size has the lowest mean near-bed velocity of.3 m/s. Although Fraser Rd has a narrow channel and high surface velocities, the large substrate size creates significant turbulence closer to the bottom which drastically reduces near-bed velocities to an average of.31 m/s. Although Laing Rd has the widest channel of all four monitoring sites, its shallow riffled nature and small substrate size produce a relatively high average near-bed velocity of.5 m/s. The high near-bed velocities measured at Marshall Rd (.6 m/s) are largely due to the relatively steep gradient and narrow channel width of this site as well as the lack of stable mid-channel substrate.
16 26 Mean near-bed velocity (m/s) Earncleugh Rd Fraser Rd Laing Rd Marshall Rd Site Figure 5.1 Mean near-bed velocities at all sites Temperature The temperature logger placed at Marshall Rd shows an overall increasing trend in temperature over the study period (Figure 5.11), although overall temperatures remained relatively stable. This is most likely due to the influence of the Lake Dunstan flow augmentation. 16 Mean daily temperature (ºC) /8/6 22/8/6 12/9/6 3/1/6 24/1/6 14/11/6 5/12/6 26/12/6 16/1/7 Date Figure 5.11 Mean daily temperature at Marshall Rd Hydrology Flows in the Fraser River were very stable from January to late August, with the exception of two small fluctuations during maintenance of the augmentation pipe. The Fraser Dam overtopped in early September due to snow melt and an increase of over 2 cumecs occurred (Figure 5.12). Flows varied between 3.5 and 6.5 cumecs throughout early October before a 17 cumec event on October 13. Since that event until the end of the study the Fraser Dam continued to overtop and flows varied between 2.2 and 12.2 cumecs (Figure 5.12).
17 Flow at Laing Rd (cumecs) /3/26 2/4/26 9/6/26 29/7/26 17/9/26 6/11/26 26/12/26 14/2/27 Date Figure 5.12 Flows in the Fraser River at Laing Rd Fortnightly monitoring of Didymo distribution and biomass The monitoring program was initiated to map distribution of Didymo as it colonises the river and to assess the speed and severity of infection at each site. Visual estimations of the percentage cover of Didymo, native periphyton and bare rock have been made and biomass has been estimated using the Quantitative Visual Biovolume Index (QVBI Appendix 1). To calculate QVBI, five rocks are selected from three transects at each site and the percentage cover of Didymo for each of the colony thickness categories (, <1mm, 1-5mm, 6-15mm, 16-3mm, >3mm) is estimated as well as the percentage cover of native periphyton. Each of the colony thickness categories is allocated a index number (Native =, =, <1mm = 1, 1-5mm = 2, 6-15mm = 3, 16-3mm = 4, >3mm = 5), and the QVBI for each rock is calculated by multiplying the percentage cover of each colony thickness class by its corresponding index number, giving a value of between (no Didymo present) and 5 (1% cover of >3mm colonies). This figure is then averaged between the 15 rocks at each site to give an overall QVBI for the site. The QVBI differs significantly from the Visual Biovolume Index (VBI) and the Quantitative Visual Index (QVI) used in previous studies by Kilroy (25b). The QVI uses up to 16 size classes, to the nearest mm for colonies less than 1 mm thick and to the nearest 5 mm thereafter. Although the QVBI only uses six size classes, its advantage is that the percentage of each size class per rock is calculated as opposed to a measuring the mat thickness at one point in the centre of each rock. The VBI also uses six size classes, but as with the QVI, only one measurement of mat thickness is made at the centre point of each rock.
18 28 Reference photos of five quadrats were taken at each site. These quadrats were located on Didymo colonies so that their growth could be monitored. If no colonies were present at the beginning of the study the quadrats were relocated as new colonies appeared. Drift sampling was undertaken using drift nets (43 µm mesh size) and Ash Free Dry Mass (AFDM) was calculated for each sample as a measure of Didymo biomass in the water column. Didymo colonisation rates were measured by taking scrapings from artificial substrates placed at each site. Three paving blocks were placed at each site with sheets of artificial substrate secured to their upper surface. On a fortnightly basis these sheets were replaced by clean substrates and Didymo cells per cm² were calculated. Temperature loggers were placed at the Fraser Rd and Marshall Rd sites and NIWA s flow recorder at Laing Rd was used to provide flow data. ph and conductivity (as a measurement of dissolved nutrients) were also measured at each site Results Results indicate that high Didymo biomass is very closely linked to stable flows (Figure 5.13) and native algae is more suited to variable flow regimes (Figure 5.14 and Figure 5.15). Interaction between substrate composition, channel width, and velocity also strongly influences Didymo biomass Benthic Didymo biomass Reference photos taken in early May have shown that small Didymo colonies were present at Marshall Rd as early as May 26. A site visit in July 26 showed small colonies were still present at Marshall Rd, as well as Laing Rd, Earnscleugh Rd and Fraser Rd (Figure 5.13). Didymo Biomass (QVBI) Figure 5.13 Earnscleugh Rd Fraser Rd Laing Rd Marshall Rd Flow at Laing Rd Visible Didymo colonies present 1/5/6 14/5/6 3/5/6 14/6/6 3/6/6 12/7/6 15/7/6 3/7/6 1/8/6 24/8/6 6/9/6 2/9/6 Date 5/1/6 18/1/6 31/1/6 15/11/6 29/11/6 14/12/6 3/1/7 17/1/7 31/1/7 Changes in Didymo biomass plotted over river flow at Laing Rd Flow at Laing Rd (cumecs)
19 29 Benthic biomass of Didymo was very closely linked to flow at Marshall Rd, Earnscleugh Rd and Laing Rd, with biomass decreasing in response to high flow variability (Figure 5.13). The same trend was not observed at Fraser Rd, with only moderate response to October s high flows and no observable response to subsequent flow variations Marshall Rd QVBI values were much lower at Marshall Rd than at any other site in the river for the entire duration of the study. Although biomass did not respond strongly to the small increase in flow in early September, the 16 cumec event in mid-october caused biomass to drop as low as 25 QBVI and did not recover significantly until the completion of the study in February. 1 9 Bare Native Didymo Flow at Laing Rd 2 18 Average % cover Flow at Laing Rd (cumecs) 1/8/26 24/8/26 6/9/26 2/9/26 5/1/26 18/1/26 31/1/26 Date 15/11/26 29/11/26 14/12/26 3/1/27 17/1/27 31/1/27 Figure 5.14 Percentage cover of Didymo and native algae at Marshall Rd As can be seen in Figure 5.14, native periphyton colonised the substrate very quickly after Didymo is removed by high flows. Following the large bed-moving event in early October, native algae became the dominant component of the periphyton community under a variable flow regime, covering up to 85% of the available substrate in December. As flows stabilised over January, percentage cover of Didymo increased, although native algae was still dominant when the last sample was taken on 17 January Earnscleugh Rd Didymo biomass at Earnscleugh Rd responded very strongly to increases in flow throughout the monitoring period. Even the one cumec event in mid-september caused a decrease in QVBI from 335 to 265, which is more than twice that of any other site. The 16 cumec event in mid-october caused a large decrease in biomass at Earnscleugh Rd from 33 to 9 QVBI. Variable flows from October to January kept Didymo biomass below 17 QVBI with a noticeable recovery in mid-january due to slightly more stable flows.
20 3 Average % cover 12 Bare Native Didymo Flow at Laing Rd /8/26 24/8/26 6/9/26 2/9/26 5/1/26 18/1/26 31/1/26 15/11/26 29/11/26 14/12/26 3/1/27 17/1/27 31/1/ Flow at Laing Rd (cumecs) Date Figure 5.15 Percentage cover of Didymo and native algae at Earnscleugh Rd Didymo cover at Earnscleugh Rd remained above 9% from August to September before the 16 cumec event on October 13 scoured most of the substrate clean. During the period of variable flow following this event, native algae has re-colonised 15% to 4% of the available substrate, while Didymo cover has remained below 6% for most of this time. The variable flows have also caused a relatively high proportion of bare substrate, which is most likely due to high bed mobility at the sampling site Laing Rd Although Didymo biomass at Laing Rd showed a minimal response to the one cumec event in September, high flows in October caused a substantial decrease in biomass of 2 QVBI (Figure 5.13). During the subsequent period of high flow variability, Didymo biomass at Laing Rd was relatively stable at around 25 QVBI, showing much less fluctuation than at any other site along the river.
21 31 12 Bare Native Didymo Flow at Laing Rd 2 Average % cover Flow at Laing Rd (cumecs) 1/8/6 24/8/6 6/9/6 2/9/6 5/1/6 18/1/6 31/1/6 Date 15/11/6 29/11/6 14/12/6 3/1/7 17/1/7 31/1/7 Figure 5.16 Percentage cover of Didymo and native algae at Laing Rd Total cover of Didymo at Laing Rd was above 9% throughout most of the study with the exception of September 18, when a substantial amount of sloughing and bed movement occurred after the 17 cumec flood event on September 13. Unlike the Marshall Rd and Earnscleugh Rd sites, very little native algae has been present at any time during study Fraser Rd Didymo biomass at Fraser Rd has also remained relatively stable throughout the duration of the study (Figure 5.13). After reaching a peak of 287 QVBI at the end of August, there was only a slight decrease in biomass after the small event in September. The highly variable flows throughout October did not have the dramatic effect that was seen further downstream and Didymo biomass at Fraser Rd has now returned to the peak levels observed in late September.
22 32 Average % cover 12 1 Figure /8/6 24/8/6 Bare Native Didymo Flow at Laing Rd 6/9/6 2/9/6 5/1/6 18/1/6 Date 31/1/6 15/11/6 29/11/6 14/12/6 3/1/7 17/1/7 31/1/7 Percentage cover of Didymo and native algae at Fraser Rd Flow at Laing Rd (cumecs) Total Didymo cover remained high throughout the study (Figure 5.17), with only small amounts of native algae present throughout August and September. In late September Didymo covered 1% of the available substrate, and although a small amount of scouring occurred from October through to January, no native algae was observed at Fraser Rd during this period. 5.3 Discussion Although most sites respond strongly to increases in flow, the degree to which the increase in flow affects near-bed velocities is largely driven by the interactions of channel morphology and substrate composition. Temperatures remained relatively stable throughout the study period and did not appear to be limiting Didymo growth. Substrate composition seems to be the most important of these factors, and it is likely that it can explain most of the biomass variability at each site. Although sloughing of Didymo occurs on larger substrates, the movement of smaller substrates during high flows is likely to have a much greater effect on Didymo biomass. Large substrate also increases the water friction and turbulence close to the stream bed and thus reduces near-bed velocities. The lack of response of biomass to moderate increases in flow at Laing Rd in September is most likely due to the armoring of the gravel by thick mats of Didymo (Figure 3.3), and the relatively wide channel which reduces near-bed velocity and allows a large buildup of Didymo biomass. Near-bed velocities during the 17 cumec event in October were much higher than at any other time since Didymo s incursion into the Fraser River, and was enough to scour away all but a few fragments of the Didymogravel matrix (Figure 5.18).

23 33 Figure 5.18 Remnant Didymo-gravel matrix at Laing Rd after high flows in October The Didymo-gravel matrix did not form at Earnscleugh Rd and is the most likely explanation as to why this site responded more strongly to the small increases in flow observed in September. The near identical response and recovery time after October s high flows is an indication of the very similar substrate size at Laing and Earnscleugh Rd. The low level of response of Didymo to high flows at Fraser Rd is most likely due to the large substrate size at this site. Although high flows are likely to cause moderate short-term reductions in biomass due to sloughing, the boulders and cobbles at Fraser Rd are very stable and are unlikely to be moved by all but the largest flood events. This stable substrate allows for the persistence of remnant Didymo colonies after a high flow event, allowing for a much faster recovery. The large substrate size also creates a high amount of turbulence and greatly reduces near-bed velocities which allows for a greater persistence of Didymo mats during high flows. The low Didymo biomass observed at Marshall Rd throughout the study period is most likely due to the high degree of shading from riparian vegetation and the instability of the substrate towards the middle of the channel. Figure 5.13 shows an almost complete lack of recovery of Didymo biomass after the high flows of October, with relatively low QVBI values throughout the period of high flow variability from October to January. It is possible that this lack of recovery of Didymo at Marshall Rd, and to a lesser extent Earnscleugh Rd, is due to the colonisation of a substantial proportion of the substrate by an unidentified native alga. It is unclear if this algae was responding to the clearing of Didymo by high velocities (and is able to out-compete it under these conditions), or to seasonal factors such as photoperiod or water temperature.
24 34 This pattern was also observed at Earnscleugh Rd, which is much less shaded than the Marshall Rd site. This indicates that the native algae is better adapted to the natural flow conditions experienced in October and is able to out-compete Didymo under conditions where the substrate is unstable (Figure 5.14 and Figure 5.15). 5.4 Conclusions There is a strong indication that Didymo biomass and percentage cover is largely controlled by variations in near-bed velocity, with both of these variables able to attain much greater levels due to the regulated nature of the Fraser River over the winter period while the Fraser Dam is being filled. This is supported by anecdotal observations of extremely large buildups of Didymo in the Hawea, Clutha/Mata-Au, Waitaki, Waiau and Mararoa Rivers (G Martin, G Hughes, S Sutherland, R Fitzpatrick, pers. comm.). Rivers with unregulated flow regimes such as the Von, Matukituki, Motatapu, Makarora and Wilkin Rivers have not experienced these large buildups of Didymo biomass due to the large increases in velocities during high flow periods. This raises the possibility of using flushing flows in regulated rivers and irrigation races to reduce the buildup of Didymo biomass and prevent it reaching nuisance levels. This study also suggests that native algae may be able to better compete with Didymo under more natural flow regimes.
DIDYMO SURVEY, LOWER FRYINGPAN RIVER, BASALT, COLORADO 2015
 DIDYMO SURVEY, LOWER FRYINGPAN RIVER, BASALT, COLORADO 2015 Second Annual Report PREPARED FOR: ROARING FORK CONSERVANCY PREPARED BY: COLORADO MOUNTAIN COLLEGE NATURAL RESOURCE MANAGEMENT PROGRAM TIMBERLINE
Gatwick Stream Riverside Garden Park, Horley
 Gatwick Stream Riverside Garden Park, Horley An Advisory Visit by the Wild Trout Trust January 2014 1 1. Introduction This report is the output of a Wild Trout Trust visit to the Gatwick Stream in Horley,
Significant Natural Area Assessment. Property Name: Hillend Station
 Private Bag 50072, Queenstown 9348, New Zealand QUEENSTOWN, 10 Gorge Road, Phone +64 3 441 0499, Fax +64 3 450 2223 WANAKA, 47 Ardmore Street, Phone +64 3 443 0024, Fax +64 3 450 2223 Significant Natural
CONGESTION MONITORING THE NEW ZEALAND EXPERIENCE. By Mike Curran, Manager Strategic Policy, Transit New Zealand
 CONGESTION MONITORING THE NEW ZEALAND EXPERIENCE 26 th Australasian Transport Research Forum Wellington New Zealand 1-3 October 2003 By, Manager Strategic Policy, Transit New Zealand Abstract New Zealand
GLACIER STUDIES OF THE McCALL GLACIER, ALASKA
 GLACIER STUDIES OF THE McCALL GLACIER, ALASKA T John E. Sater* HE McCall Glacier is a long thin body of ice shaped roughly like a crescent. Its overall length is approximately 8 km. and its average width
Typical avalanche problems
 Typical avalanche problems The European Avalanche Warning Services (EAWS) describes five typical avalanche problems or situations as they occur in avalanche terrain. The Utah Avalanche Center (UAC) has
APPENDIX D: SUSTAINABLE TRAIL DESIGN. APPENDICES Town of Chili Parks and Recreation Master Plan Update
 APPENDIX D: SUSTAINABLE TRAIL DESIGN APPENDICES Town of Chili Parks and Recreation Master Plan Update Sustainable Trail Construction Sustainable trails are defined by the US Forest Service as trails having
The search results explanations of hydrological data
 Introduction The search results explanations of hydrological data Depending on the parameter, the instrumental measuring or visual observation method is used for the hydrological observations. Instrumentally
Mark West Creek Flow Study Report
 Mark West Creek Flow Study Report Biology and Geology of Mark West Creek The headwaters of Mark West Creek are located in the Mayacamas Mountain range, which border Napa and Sonoma County, where it then
KP Lasnaya 1 River
 KP 370.2 Lasnaya 1 River The Lasnaya 1 River crossing is protected by Reno mattings and a gabion wall on the north bank (Photo 1). The south bank consists of natural river gravel deposits on top of Reno
Title/Name of the area: Chwaka Bay, Zanzibar
 Title/Name of the area: Chwaka Bay, Zanzibar Presented by: Dr. Charles Lugomela, Ag. Head, Department of Aquatic Sciences and Fisheries, University of Dar es Salaam, P.O. Box 35064 Dar es Salaam, Tanzania
HEATHROW COMMUNITY NOISE FORUM
 HEATHROW COMMUNITY NOISE FORUM 3Villages flight path analysis report January 216 1 Contents 1. Executive summary 2. Introduction 3. Evolution of traffic from 25 to 215 4. Easterly departures 5. Westerly
MANAGING FRESHWATER INFLOWS TO ESTUARIES
 MANAGING FRESHWATER INFLOWS TO ESTUARIES Yuna River Hydrologic Characterization A. Warner Warner, A. (2005). Yuna River Hydrologic Characterization. University Park, Pennsylvania: The Nature Conservancy.
Hydro-Electric Schemes Compliance Report June June 2013
 File Reference: 4.00212 Significance of Decision: Receives Only - No Decisions Report To: Operations, Monitoring and Regulation Committee Meeting Date: 20 June 2013 Report From: Nick Zaman, Pollution Prevention
Lake Trout Population Assessment Wellesley Lake 1997, 2002, 2007
 Lake Trout Population Assessment Wellesley Lake Prepared by: Lars Jessup Fish and Wildlife Branch November 2009 Lake Trout Population Assessment Wellesley Lake Yukon Fish and Wildlife Branch TR-09-01 Acknowledgements
Climate Change Impact on Water Resources of Pakistan
 Pakistan Water and Power Development Authority (WAPDA) Climate Change Impact on Water Resources of Pakistan Glacier Monitoring & Research Centre Muhammad Arshad Pervez Project Director (GMRC) Outline of
Independent Technical Reference Group Wild Horse Damage around Currango Homestead Made by: Friends of Currango Inc. (FoC) Date: 13 April 2015
 Date: 13 April 2015") Submission to: Dr Mark Lonsdale Independent Chair Independent Technical Reference Group Re: Wild Horse Damage around Currango Homestead Made by: Friends of Currango Inc. (FoC) Date: 13 April 2015 Background
Submission to: Dr Mark Lonsdale Independent Chair Independent Technical Reference Group Re: Wild Horse Damage around Currango Homestead Made by: Friends of Currango Inc. (FoC) Date: 13 April 2015 Background
Regional impacts and vulnerability mountain areas
 Regional impacts and vulnerability mountain areas 1 st EIONET workshop on climate change vulnerability, impacts and adaptation EEA, Copenhagen, 27-28 Nov 2007 Klaus Radunsky 28 Nov 2007 slide 1 Overview
Tidewater Glaciers: McCarthy 2018 Notes
 Tidewater Glaciers: McCarthy 2018 Notes Martin Truffer, University of Alaska Fairbanks June 1, 2018 What makes water terminating glaciers special? In a normal glacier surface mass balance is always close
How much did the airline industry recover since September 11, 2001?
 Catalogue no. 51F0009XIE Research Paper How much did the airline industry recover since September 11, 2001? by Robert Masse Transportation Division Main Building, Room 1506, Ottawa, K1A 0T6 Telephone:
International Osoyoos Lake Board of Control Annual Report to the International Joint Commission
 International Osoyoos Lake Board of Control 2013 Annual Report to the International Joint Commission TABLE OF CONTENTS ACTIVITIES OF THE BOARD... 1 HYDROLOGIC CONDITIONS IN 2013... 2 Drought Criteria...
Specification for Grip blocking using Peat Dams
 Technical Guidance Note 1 Specification for Grip blocking using Peat Dams 1. Introduction Moorland drains (grips) have been dug across much of the Yorkshire upland peatlands. Many of these grips have become
Observing Subtleties: Traditional Knowledge and Optimal Water Management of Lake St. Martin
 Observing Subtleties: Traditional Knowledge and Optimal Water Management of Lake St. Martin Myrle Traverse and Richard Baydack Abstract Lake St. Martin First Nation is an Anishinaabe community situated
NORTH CASCADE SLACIER CLIMATE PROJECT Director: Dr. Mauri S. Pelto Department of Environmental Science Nichols College, Dudley MA 01571
 NORTH CASCADE SLACIER CLIMATE PROJECT Director: Dr. Mauri S. Pelto Department of Environmental Science Nichols College, Dudley MA 01571 INTRODUCTION The North Cascade Glacier-Climate Project was founded
Figure 1.1 St. John s Location. 2.0 Overview/Structure
 St. John s Region 1.0 Introduction Newfoundland and Labrador s most dominant service centre, St. John s (population = 100,645) is also the province s capital and largest community (Government of Newfoundland
ARRIVAL CHARACTERISTICS OF PASSENGERS INTENDING TO USE PUBLIC TRANSPORT
 ARRIVAL CHARACTERISTICS OF PASSENGERS INTENDING TO USE PUBLIC TRANSPORT Tiffany Lester, Darren Walton Opus International Consultants, Central Laboratories, Lower Hutt, New Zealand ABSTRACT A public transport
HEATHROW COMMUNITY NOISE FORUM. Sunninghill flight path analysis report February 2016
 HEATHROW COMMUNITY NOISE FORUM Sunninghill flight path analysis report February 2016 1 Contents 1. Executive summary 2. Introduction 3. Evolution of traffic from 2005 to 2015 4. Easterly departures 5.
A trip to Steindalen. - geology and landscape on the way to the glacier. Geoffrey D. Corner
 A TRIP TO STEINDALEN Excursion guide Please take this with you on your trip, but don t leave it behind as litter. A trip to Steindalen - geology and landscape on the way to the glacier A part of Geologiskolen,
Hydrology Input for West Souris River IWMP
 Hydrology Input for West Souris River IWMP Prepared by: Mark Lee Manitoba Water Stewardship 1 1 1 Overall view of: drainage area watershed characteristics gauging stations meteorological stations Runoff
A. CONCLUSIONS OF THE FGEIS
 Chapter 11: Traffic and Parking A. CONCLUSIONS OF THE FGEIS The FGEIS found that the Approved Plan will generate a substantial volume of vehicular and pedestrian activity, including an estimated 1,300
IATA ECONOMIC BRIEFING DECEMBER 2008
 ECONOMIC BRIEFING DECEMBER 28 THE IMPACT OF RECESSION ON AIR TRAFFIC VOLUMES Recession is now forecast for North America, Europe and Japan late this year and into 29. The last major downturn in air traffic,
Benefits and costs of tourism for remote communities
 Benefits and costs of tourism for remote communities Case study for the Carpentaria Shire in north-west Queensland Chapter 2 1 THE CARPENTARIA SHIRE COMMUNITY AND TOURISM... 2 Plate 5: Matilda Highway
Species: Wildebeest, Warthog, Elephant, Zebra, Hippo, Impala, Lion, Baboon, Warbler, Crane
 INTRODUCTION Gorongosa National Park is a 1,570-square-mile protected area in Mozambique. Decades of war, ending in the 1990s, decimated the populations of many of Gorongosa s large animals, but thanks
Hydrological study for the operation of Aposelemis reservoir Extended abstract
 Hydrological study for the operation of Aposelemis Extended abstract Scope and contents of the study The scope of the study was the analytic and systematic approach of the Aposelemis operation, based on
GOOSENECK SWAMP INFORMATION DAY - Saturday 14 th December 2013
 GOOSENECK SWAMP INFORMATION DAY - Saturday 14 th December 2013 Progress of a restoration trial at Gooseneck Swamp - Grampians National Park, Victoria Gooseneck Swamp is situated at the far south-eastern
SeagrassNet Monitoring in Great Bay, New Hampshire, 2016
 University of New Hampshire University of New Hampshire Scholars' Repository PREP Reports & Publications Institute for the Study of Earth, Oceans, and Space (EOS) 9-28-2017 SeagrassNet Monitoring in Great
Commercial Accommodation Monitor: April 2017
 Commercial Accommodation Monitor: April 2017 Hawke s Bay i Reproduction of material Material in this report may be reproduced and published, provided that it does not purport to be published under government
X. WHATCOM CREEK SMA. X.1 Watershed Analysis. X.1.1 Landscape Setting
 X. WHATCOM CREEK SMA Summary: The entire length of Whatcom Creek is located within the City of Bellingham. SMA jurisdiction associated with this creek is approximately 300 acres. Land use is dominated
Wilts & Berks Canal. Appendix E: Hydrology and Hydraulics CONTENTS 1. INTRODUCTION 2 2. HYDROLOGY 2 3. HYDRAULIC MODEL 2 4.
 Wilts & Berks Canal Melksham River Route Study Appendix E: Hydrology and Hydraulics CONTENTS 1. INTRODUCTION 2 2. HYDROLOGY 2 3. HYDRAULIC MODEL 2 4. CANAL OPERATION 3 5. WEIR DESIGN 4 6. FLOOD RISK 5
Commercial Accommodation Monitor: December 2017
 Commercial Accommodation Monitor: December 2017 Queenstown i Reproduction of material Material in this report may be reproduced and published, provided that it does not purport to be published under government
Analysing the performance of New Zealand universities in the 2010 Academic Ranking of World Universities. Tertiary education occasional paper 2010/07
 Analysing the performance of New Zealand universities in the 2010 Academic Ranking of World Universities Tertiary education occasional paper 2010/07 The Tertiary Education Occasional Papers provide short
Chapter 7 Snow and ice
 Chapter 7 Snow and ice Throughout the solar system there are different types of large ice bodies, not only water ice but also ice made up of ammonia, carbon dioxide and other substances that are gases
Commercial Accommodation Monitor: October 2017
 Commercial Accommodation Monitor: October 2017 Hawke s Bay i Reproduction of material Material in this report may be reproduced and published, provided that it does not purport to be published under government
Minnesota Department of Natural Resources
 Minnesota Department of Natural Resources Fisheries Management VERSION - PRELIMINARY DATA (AS OF 7/6/25) Lake Name: Imogene Survey Type: Standard Survey DOW Number: 46-2- Survey ID Date: 7/3/25 Lake Identification
Appendix A Appendix A (Project Specifications) Auk Auk / Black Diamond (Trail 44) Reroute
 Auk Auk / Black Diamond (Trail 44) Reroute") Appendix A (Project Specifications) Auk Auk / Black Diamond (Trail 44) Reroute I. Proposed Action: This project proposes to reroute approximately 1,800 feet of a 50 inch wide trail, off of private property
Appendix A (Project Specifications) Auk Auk / Black Diamond (Trail 44) Reroute I. Proposed Action: This project proposes to reroute approximately 1,800 feet of a 50 inch wide trail, off of private property
Theme: Predominately natural/natural appearing; rustic improvements to protect resources. Size*: 2,500 + acres Infrastructure**:
 Recreation Opportunity Spectrum (ROS) Classes The Recreation Opportunity Spectrum (ROS) provides a way to describe the variations in the degree of isolation from the sounds and influences of people, and
Visual and Sensory Aspect
 Updated All Wales LANDMAP Statistics 2017 Visual and Sensory Aspect Final Report for Natural Resources Wales February 2018 Tel: 029 2043 7841 Email: sw@whiteconsultants.co.uk Web: www.whiteconsultants.co.uk
International Osoyoos Lake Board of Control Annual Report to the International Joint Commission
 International Osoyoos Lake Board of Control 2015 Annual Report to the International Joint Commission Cover: Northern extent of Osoyoos Lake, where the Okanagan River enters the lake, 2015. View is to the
Minnesota Department of Natural Resources
 Lake Name: Orono Minnesota Department of Natural Resources Fisheries Management DRAFT VERSION - PRELIMINARY DATA Survey Type: Re-Survey DOW Number: 7-- Survey Date: 8/4/8 Lake Identification Alternate
CAMPER CHARACTERISTICS DIFFER AT PUBLIC AND COMMERCIAL CAMPGROUNDS IN NEW ENGLAND
 CAMPER CHARACTERISTICS DIFFER AT PUBLIC AND COMMERCIAL CAMPGROUNDS IN NEW ENGLAND Ahact. Early findings from a 5-year panel survey of New England campers' changing leisure habits are reported. A significant
Natural Factors Affecting the Level of Osoyoos Lake
 Natural Factors Affecting the Level of Osoyoos Lake Background Osoyoos Lake is operated under conditions prescribed by the International Joint Commission (IJC) and Figure 1 shows the ranges within which
Peace Project Water Use Plan
 Peace Project Water Use Plan Williston Reservoir Trial Tributaries Implementation Year 5 Reference: GMSWORKS-19 6 Mile 2016 Engineering Inspection Report Study Period: 2016 KERR WOOD LEIDAL Site Inspection
Biodiversity Studies in Gorongosa
 INTRODUCTION Gorongosa National Park is a 1,570-square-mile protected area in Mozambique. Decades of war, ending in the 1990s, decimated the populations of many of Gorongosa s large animals, but thanks
The Portland State University study of shrinking Mt. Adams glaciers a good example of bad science.
 The Portland State University study of shrinking Mt. Adams glaciers a good example of bad science. Don J. Easterbrook, Dept. of Geology, Western Washington University, Bellingham, WA The recent Portland
Geomorphology. Glacial Flow and Reconstruction
 Geomorphology Glacial Flow and Reconstruction We will use simple mathematical models to understand ice dynamics, recreate a profile of the Laurentide ice sheet, and determine the climate change of the
PHYSICAL GEOGRAPHY GEOGRAPHY EARTH SYSTEMS COASTAL SYSTEMS FLUVIAL SYSTEMS
 PHYSICAL GEOGRAPHY EARTH SYSTEMS FLUVIAL SYSTEMS COASTAL SYSTEMS PHYSICAL GEOGRAPHY CORRIES / CIRQUES A Corrie or Cirque is the armchair shaped hollow that was the birthplace of a glacier. It has steep,
Climate change impacts on stand production and survival, and adaptation strategies to build resilience
 Climate change impacts on stand production and survival, and adaptation strategies to build resilience Jody Bruce, Michael Battaglia and Libby Pinkard July 14 CSIRO LAND AND WATER Potential impact Exposure
Shrubs and alpine meadows represent the only vegetation cover.
 Saldur river General description The study area is the upper Saldur basin (Eastern Italian Alps), whose elevations range from 2150 m a.s.l. (location of the main monitoring site, LSG) and 3738 m a.s.l.
Appendix 8.D Water Vole and Otter Survey Report
 Appendix 8.D Water Vole and Otter Survey Report Entec UK Limited Entec UK Limited Water Vole and Otter Survey Report June 2009 Final Client Job Name Report title File reference E.ON Renewables Ltd Water
LITTLE LOST MAN CREEK (LLM) (formerly USGS Gaging Station No )
 (formerly USGS Gaging Station No )") LITTLE LOST MAN CREEK (LLM) (formerly USGS Gaging Station No. 11482468) LOCATION: In Redwood National and State Park approximately 0.8 miles upstream from confluence with Prairie Creek and 3.2 miles northeast
LITTLE LOST MAN CREEK (LLM) (formerly USGS Gaging Station No. 11482468) LOCATION: In Redwood National and State Park approximately 0.8 miles upstream from confluence with Prairie Creek and 3.2 miles northeast
Fifty-Year Record of Glacier Change Reveals Shifting Climate in the Pacific Northwest and Alaska, USA
 Fact Sheet 2009 3046 >> Pubs Warehouse > FS 2009 3046 USGS Home Contact USGS Search USGS Fifty-Year Record of Glacier Change Reveals Shifting Climate in the Pacific Northwest and Alaska, USA Fifty years
HOTFIRE WILDLIFE MANAGEMENT MODEL A CASE STUDY
 1 HOTFIRE WILDLIFE MANAGEMENT MODEL A CASE STUDY Sub-theme: Economics / business venture, livelihood strategies Format: Poster Bruce Fletcher Hotfire Hunting and Fishing Safaris P O Box 11 Cathcart 5310
HYDRAULIC DESIGN OF THE TOURISTIC BERTHING IN ASWAN CITY
 HYDRAULIC DESIGN OF THE TOURISTIC BERTHING IN ASWAN CITY Dr. Hossam El-Sersawy Researcher, Nile Research Institute (NRI), National Water Research Center (NWRC), Egypt E-mail: h_sersawy@hotmail.com Dr.
IATA ECONOMIC BRIEFING FEBRUARY 2007
 IATA ECONOMIC BRIEFING FEBRUARY 27 NEW AIRCRAFT ORDERS KEY POINTS New aircraft orders remained very high in 26. The total of 1,834 new orders for Boeing and Airbus commercial planes was down slightly from
5 Demography and Economy
 5 Demography and Economy Demography People have probably lived on Great Barrier Island (Aotea) since the 13 th century. There are few written observations about the number of Maori settled here but these
Wakatipu Area Strategy Plan
 Wakatipu Area Strategy Plan September 2009 Executive Summary The Ministry of Education has developed an area strategy plan in response to population growth in the Wakatipu area. The Ministry predicts that
DOW Number: Survey ID Date: 08/21/2018. Windom Southern
 Fisheries Management DRAFT VERSION PRELIMINARY DATA (AS OF /4/) Lake Name: Hall Survey Type: Standard Survey DOW Number: 4-- Survey ID Date: // Lake Identification Alternate Lake Name: Primary Lake Class
Chapter 7 Geography and the Early Settlement of Egypt, Kush, and Canaan
 Chapter 7 Geography and the Early Settlement of Egypt, Kush, and Canaan How did geography affect early settlement in Egypt, Kush, and Canaan? Section 7.1 - Introduction RF/NASA//Corbis This satellite photograph
6 Road infrastructure
 6 Road infrastructure 51 ƨƨsummary New Zealand does not score highly for its road infrastructure when compared to other developed nations. This may partly be due to geography and population size, which
Minnesota Department of Natural Resources
 Minnesota Department of Natural Resources Fisheries Management LAKE SURVEY REPORT DRAFT VERSION - PRELIMINARY DATA (AS OF 7//26) Lake Name: Loon Survey Type: Standard Survey DOW Number: 32-2- Survey ID
LAKE SURVEY REPORT DRAFT VERSION PRELIMINARY DATA (AS OF 07/24/2018) Fisheries Management. DOW Number: Survey ID Date: 07/16/2018
 Fisheries Management. DOW Number: Survey ID Date: 07/16/2018") Fisheries Management LAKE SURVEY REPORT DRAFT VERSION PRELIMINARY DATA (AS OF 7/2/2) Lake Name: Long Survey Type: Standard Survey DOW Number: 3-- Survey ID Date: 7/6/2 Lake Identification Alternate Lake
Fisheries Management LAKE SURVEY REPORT DRAFT VERSION PRELIMINARY DATA (AS OF 7/2/2) Lake Name: Long Survey Type: Standard Survey DOW Number: 3-- Survey ID Date: 7/6/2 Lake Identification Alternate Lake
THE ICs INTERNATIONAL BRISBANE AREA AQUA PARK PROPOSAL
 Contacts: Mr Evan Pryor, Ph 38702756, evanpryor2002@yahoo.com.au Mr Bob Beatty, Ph 32883101, BobBeatty@BOSMIN.com Web Address: http://www.bosmin.com/ics/icharter.htm Postal Address: GPO Box 2927, Brisbane,
Reservoir Tin workings
 The workings are quite over-grown and covered in moss, suggesting that they date to the earliest period of mining. This is supported by the fact that their head race was cut off by the reservoir (D49/47)
Hydraulic Report. Trail 5 Snowmobile Trail Over Mulligan Creek. Prepared By: COLEMAN ENGINEERING COMPANY Karisa V. Falls, P.E.
 Prepared for: Prepared by: Marquette County Road Commission Coleman Engineering Company Marquette, Michigan Iron Mountain, MI December 2011 Hydraulic Report Trail 5 Snowmobile Trail Over Mulligan Creek
Appendix A: Summary of findings drawn from an analysis of responses to the questionnaire issued to all households in Trimley St Martin
 Transport and Works Act 1992 The Network Rail (Felixstowe Branch Line Improvements Level Crossing Closure) Order Trimley St Martin Parish Council Statement of Case The statement of Case of the Parish Council
ESS Glaciers and Global Change
 ESS 203 - Glaciers and Global Change Friday January 5, 2018 Outline for today Please turn in writing assignment and questionnaires. (Folders going around) Questions about class outline and objectives?
Instream intrinsic values of the Te Puna Creek catchment
 Instream intrinsic values of the Te Puna Creek catchment J. Benn Technical Support Department of Conservation Canterbury Conservancy Christchurch (25 October 2011) Draft/living document Disclaimer This
TEACHER PAGE Trial Version
 TEACHER PAGE Trial Version * After completion of the lesson, please take a moment to fill out the feedback form on our web site (https://www.cresis.ku.edu/education/k-12/online-data-portal)* Lesson Title:
Mood of the Nation New Zealanders' perceptions of international visitors. March 2018
 Mood of the Nation New Zealanders' perceptions of international visitors March 2018 Contents 1 Background and approach 3 2 Key insights 6 3 Detailed insights 10 4 Appendix: measures by region 31 2 1 Background
AURORA WILDLIFE RESEARCH
 AURORA WILDLIFE RESEARCH Kim Poole 2305 Annable Rd. Nelson, BC, V1L 6K4 Canada Tel: (250) 825-4063; Fax: (250) 825-4073 e-mail: klpoole@shaw.ca 27 April 2005 Mike Gall Conservation Specialist and Glenn
Airport Capacity, Airport Delay, and Airline Service Supply: The Case of DFW
 Airport Capacity, Airport Delay, and Airline Service Supply: The Case of DFW Faculty and Staff: D. Gillen, M. Hansen, A. Kanafani, J. Tsao Visiting Scholar: G. Nero and Students: S. A. Huang and W. Wei
Miner & Silverstein Appraisal Company Division of Miner & Silverstein, LLP
 Miner & Silverstein Appraisal Company Division of Miner & Silverstein, LLP Marina Market Analysis Upper Connecticut River Marina Market Study Winter 2005-2006 The following presents a winter 2005-06 market
Case study: outbound tourism from New Zealand
 66 related crime, less concerned about the stability and certainty offered by booking a package holiday, and may choose to be independent travellers, organizing their travel and itinerary themselves. Tourists
Bear Creek Habitat Improvement Project
 06/10/10 Bear Creek Habitat Improvement Project El Paso County, Colorado Pike National Forest and Colorado Springs Utilities Owned Land Report prepared by: Eric Billmeyer Executive Director Rocky Mountain
Exemplar for Internal Achievement Standard Geography Level 1. Conduct geographic research, with direction
 Exemplar for internal assessment resource Geography for Achievement Standard 91011 Exemplar for Internal Achievement Standard Geography Level 1 This exemplar supports assessment against: Achievement Standard
Juvenile coho salmon use of constructed off-channel habitats in two Lower Klamath River tributaries: McGarvey Creek & Terwer Creek
 Juvenile coho salmon use of constructed off-channel habitats in two Lower Klamath River tributaries: McGarvey Creek & Terwer Creek Prepared by: Yurok Tribal Fisheries Program PO Box 1027, Klamath, CA Spring
Introduction. The System. Model Limitations, Assumptions, and Parameters. Optional Services Tech Memo
 Optional Services Tech Memo Introduction This technical memo evaluates the impact of a tide gate to be installed at the confluence of the Left Bank Tributary of Thalia Creek and Lake Windsor. Specifically,
Authentic Assessment in Algebra NCCTM Undersea Treasure. Jeffrey Williams. Wake Forest University.
 Undersea Treasure Jeffrey Williams Wake Forest University Willjd9@wfu.edu INTRODUCTION: Everyone wants to find a treasure in their life, especially when it deals with money. Many movies come out each year
Canberra Airport Aircraft Noise Information Report
 Canberra Airport Aircraft Noise Information Report Quarter 1 2016 (January to March) 1 Version Control Version Number Detail Prepared by Date 1 - Environment June 2016 Airservices Australia. All rights
Chapter 7. Geography and the Early Settlement of Egypt, Kush, and Canaan
 Chapter 7 Geography and the Early Settlement of Egypt, Kush, and Canaan Chapter 7 Geography and the Early Settlement of Egypt, Kush, and Canaan How did geography affect early in Egypt Kush, and Canaan?
WALKER SWAMP INFORMATION DAY Saturday 23 rd June 2018
 WALKER SWAMP INFORMATION DAY Saturday 23 rd June 2018 Introduction to the Upper Wannon River Floodplain wetlands and the new Walker Swamp Restoration Reserve Mark Bachmann and Greg Kerr, Nature Glenelg
An experimental habitat enhancement effort for a sandy river: San Rafael River restoration project
 An experimental habitat enhancement effort for a sandy river: San Rafael River restoration project Samuel Lyster Department of Watershed Sciences, Utah State University Brian G. Laub Department of Watershed
LESOTHO HIGHLANDS DEVELOPMENT AUTHORITY
 LESOTHO HIGHLANDS DEVELOPMENT AUTHORITY ANNUAL FLOW RELEASES INSTREAM FLOW REQUIREMENT (IFR) IMPLEMENTATION AND MONITORING (October 2004 to September 2005) TOWER ON MALIBAMATŠO RIVER @ KAO REPORT N0.6
TRENDS IN DEMAND FOR TOURIST SPOTS
 TRENDS IN DEMAND FOR TOURIST SPOTS C. D. Johny Economics of tourism in Kerala a study of selected tourist spots Thesis. Department of Economics, Dr. John Mathai Centre Thrissur, University of Calicut,
Load-following capabilities of Nuclear Power Plants. Erik Nonbøl
 Load-following capabilities of Nuclear Power Plants Erik Nonbøl Outline Why load-following Modes of power operation BWR technique for load-following PWR technique for load-following Effects on components
Recrystallization of snow to form LARGE. called FIRN: like packed snowballs. the weight of overlying firn and snow.
 Chapter 11 Glaciers BFRB P. 103-104, 104, 108, 117-120120 Process of Glacier Formation Snow does NOT melt in summer Recrystallization of snow to form LARGE crystals of ice (rough and granular) called
EXPO 88 IMPACT THE IMPACT OF WORLD EXPO 88 ON QUEENSLAND'S TOURISM INDUSTRY QUEENSLAND TOURIST AND TRAVEL CORPORATION GPO BOX 328, BRISBANE, 4001
 EXPO 88 IMPACT THE IMPACT OF WORLD EXPO 88 ON QUEENSLAND'S TOURISM INDUSTRY QUEENSLAND TOURIST AND TRAVEL CORPORATION GPO BOX 328, BRISBANE, 4001 Prepared by The National Centre for Studies in Travel and
NEW ZEALAND REGIONAL TOURISM FORECASTS
 NEW ZEALAND REGIONAL TOURISM FORECASTS 21-216 QUEENSTOWN RTO AUGUST 21 www.tourismresearch.govt.nz Tourism Strategy Group Ministry of Economic Development Contents Introduction 1 1. Summary for Queenstown
Finn Creek Park. Management Direction Statement Amendment
 Finn Creek Park Management Direction Statement Amendment November 2013 Management Direction Statement Amendment Approved by: Jeff Leahy Regional Director, Thompson Cariboo BC Parks November 12, 2013 Date
Minnesota Department of Natural Resources
 Minnesota Department of Natural Resources Fisheries Management DRAFT VERSION - PRELIMINARY DATA (AS OF 6/2/2) Lake Name: Yankton Survey Type: Population Assessment DOW Number: 2-7- Survey ID Date: 6/6/2