powering the world Aegean Marine Petroleum Network Inc. Investor Presentation January 2009
|
|
|
- Heather Richardson
- 5 years ago
- Views:
Transcription


1 powering the world Aegean Marine Petroleum Network Inc. Investor Presentation January 2009
2 Disclosure Today s presentation and discussion will contain forward-looking statements within the meaning of the Private Securities Litigation Reform Act of Words such as expects, anticipates, intends, estimates, or similar expressions are intended to identify these forward-looking statements. These statements are based on Aegean Marine Petroleum Network Inc. s current plans and expectations and involve risks and uncertainties that could cause future activities and results of operations to be materially different from those set forth in the forward-looking statements. Important factors that could cause actual results to differ include our future operating or financial results, our ability to manage growth, adverse conditions in the marine fuel supply industries, and increased levels of competition. For further information, please refer to Aegean Marine Petroleum Network Inc. s reports and filings with the Securities and Exchange Commission. 2


3 .powering the world 3
4 Agenda Company Industry Performance/Financials Appendix Contact Information 4
5 Company 5
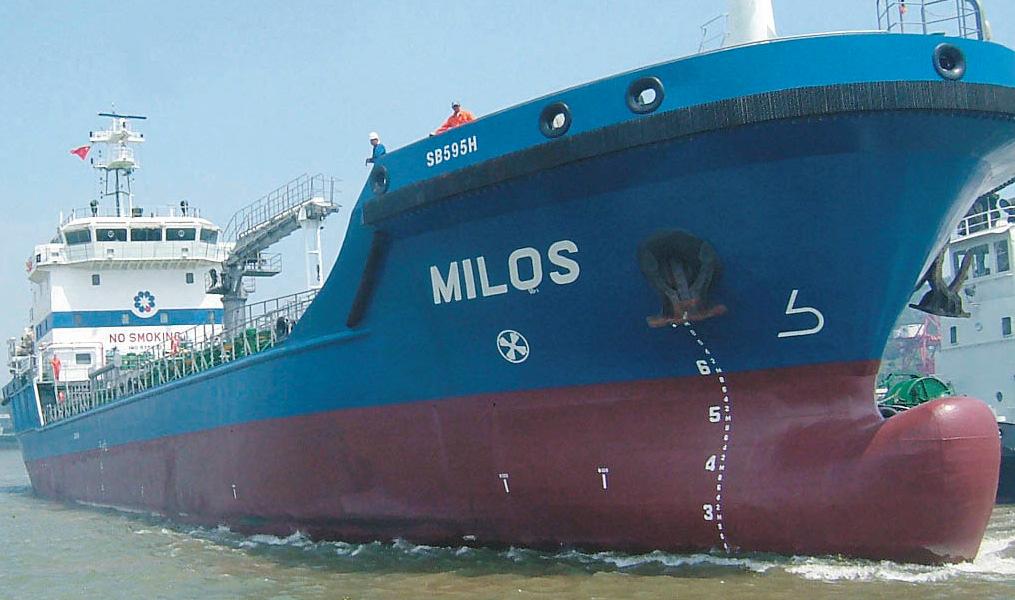
6 Company: Overview Company Name Business Description Equity Ticker / Exchange Aegean Marine Petroleum Network Inc. Aegean is a global marine fuel logistics company which markets and physically supplies refined marine fuel and lubricants to ships in port and at sea. ANW / NYSE Dahlman Rose & Company, LLC. Johnson Rice & Company L.L.C. Simmons & Company International Wall Street Research Coverage Jefferies & Company, Inc. Sidoti & Company, LLC Stephens Inc. 6

")
 Montreal")

 Athens /")
")
 Tangiers")
")
")
")
 Markets")
7 Company: Global Operations Northern Europe (2007) Vancouver (2008) Montreal (2008) New York Gibraltar (1998) U.K. (2008) Athens / Greece (1995) Mexico (2008) Miami Jamaica (2005) Tangiers (2009e) U.A.E (2001) Trinidad & Tobago (2009e) West Africa (2008) Singapore (2006) Markets Headquarters Executive / Finance / Sales Business Development 7
8 Company: Delivery Fleet (1) # of Ves ssels Current count is 32. (as of January 2009) CAGR = 34.1% e 2010e SH DH (1) Delivery fleet includes both vessels and barges. 8
9 Company: Management Peter C. Georgiopoulos Chairman of the Board E. Nikolas Tavlarios President Dimitris Melisanidis Head of Corporate Development Spyros Fokas Director, Corporate Secretary & General Counsel Spyros Gianniotis Chief Financial Officer Chairman of Aegean since IPO (December 2006). Founder and Chairman of General Maritime (NYSE: GMR), a NY-based owner and operator of oil tankers. Founder and Chairman of Genco Shipping and Trading (NYSE: GNK), a NY-based owner and operator of drybulk carriers. GMR and GNK have returned over $1.25 billion to investors. President of Aegean since IPO. Former Vice President, General Maritime- directed business development, maintained relationships with major oil companies, and commissioned Portugal office. Former Manager, General Maritime Management (GMM) Hellas. Former Executive Director of Rockefeller Center for Tishman Speyer- created over $1 billion in NAV. Head of Corporate Development since January Founded Aegean in 1995 and acted as CEO until IPO. Corporate Secretary and General Counsel for Aegean since January 2005 and has acted as Legal Counsel since Founder of Associated Piraeus Law Offices. Member of Greek Maritime Law Association and Hellenic Society of Maritime Lawyers. Chief Financial Officer for Aegean since September Former Assistant General Manager and Head of Shipping at Piraeus Bank, A.E. Former Vice President, Senior Relationship Manager at Citibank N.A. 9
10 Industry 10
11 Industry: Historical Physical Supply of Marine Fuel (1) 90% 55% 10% 45% Oil Majors/Nationals Independents Oil Majors/Nationals Independents (1) Aegean management estimates and Lloyd s Marine Intelligence Unit/Sea Searcher 11
12 Industry: Environmental (1) Issues and impacts: Oil Pollution Spills: Prestige: Exxon Valdez: Erika: Hebei Spirit: (2) 60k mt of heavy fuel oil 35k mt of crude oil 20k mt of heavy fuel oil 11k mt of crude oil Emissions: Annual CO2 emissions generated estimated at 847mmt (4% of global CO2 emissions). Without regulatory action emissions from seaborne trade could increase by 72% over the next 12 years. International Maritime Organization (IMO): MARPOL Annex I: Regulations for the prevention of pollution by oil. MARPOL Annex VI: Regulations for the prevention of air pollution from ships. ECA - Emission Control Areas (formerly know as SECA) Number of nations party to the IMO conventions: 136, representing 98% of the world's shipping tonnage. (1) IMO (2) Approximate figures. 12
13 Industry: Markets Aegean s Markets Size (mm of tons) 1 Singapore U.A.E (1) Regulations Single-hulls allowed to operate until their 25 th anniversary but no later than end-of Current owners/operators of double-hull vessels are eligible for waivers on certain port fees. Single-hulls allowed to operate until their 25 th anniversary but no later than end-of Gibraltar 4.0 Only double-hulls allowed to operate. 4 Greece 4.0 Only double-hulls allowed to operate. 5 Southern Caribbean 3.5 No new single-hulls allowed to enter market. 6 West Africa 3.0 Ghana allows single-hulls to operate subject to receiving approval. Moving towards adopting regulation. 7 Vancouver 1.0 Single-hulls allowed to operate until end-of U.K. 1.0 Only double-hulls allowed to operate. (2) 9 Northern Europe 0.6 Only double-hulls allowed to operate. 10 Jamaica 0.6 No single-hull restrictions are currently in-place. Moving towards adopting regulation. 11 Mexico 0.3 Single-hulls allowed to operate until end-of Montreal 0.3 Single-hulls allowed to operate until end-of Tangiers n/a Only double-hulls allowed to operate. TOTAL 65.3 (1) Bunkerworld and Company information (2) Niche market (non ARA region) 13
14 Industry: Supply Fundamentals Projected World Bunkering Vessel Fleet (1) IMO MARPOL Regulation 13H bans single-hull tankers between 600 and 5,000 dwt from carrying heavy-grade oil; regulations went into effect beginning # of Vessels s Single-hull Double-hull (1) Lloyds MIU 14
15 Industry: Demand Fundamentals The bunker market is estimated at approximately 200mm metric tons (in annual sales). Fuel Sales vs. Global Trade Marine Fuel Global Seaborne Trade Global Marine Fuel Volume (2) (3) Global Seaborne Trade Fuel Sales vs. Tanker Spot Rates (2) Marine Fuel VLCC Tanker Spot Rates Global Marine Fuel Volume VLCC Tanker Spot Rates (1) BeicipFranlab, 2003, with projections based on Global Insight s World Trade Service (2) Clarksons, Shipping Review Database, 2006, with projections based on Global Insight s World Trade Service 15
16 Industry: Low-Sulphur Fuel Oil Fundamentals 50,000 45,000 Increased distillate use 40,000 35,000 30,000 25,000 20,000 15,000 10,000 5,000 ECA limits drop to 1.00% Global limits drop to 3.50% ECA limits drop to 0.50% Extensive refinery upgrades Marine fuel cost increase Demand Supply 0 16
17 Industry: Low-Sulphur Regulation Timeline ECA Limits 1.50% ECA Limits 1.50% California Emissions Legislation Global Limits 4.50% Global Limits 4.50% ECA Limits 0.10% New ECAs ECA Limits 0.10% New ECAs Global Limits 3.50% Global Limits 0.50% 17
18 Performance/Financials 18
19 Performance: Growth Period-end Statistics months ending Sep Sales Volumes 2,367,289 3,487,269 3,631,486 trending to >5mm Delivery Fleet Markets (1) (1) Actual figure will be reported in 4q08 results. 19
20 (1) Financials: Selected Financials Year-on-Year Comparison 3q07 3q08 YoY % Sales Volumes (MT) 897,147 1,338, % Gross Spread per MT ($/MT) $24.80 $ % (2) Net Revenue $25,791 $50, % Operating Income $8,888 $15, % (3) Adjusted Net Income $7,848 $10, % Net Income $7,848 $9, % Quarter-on-Quarter Comparison 2q08 3q08 QoQ % Sales Volumes (MT) 1,232,438 1,338, % Gross Spread per MT ($/MT) $31.71 $ % (2) Net Revenue $44,867 $50, % Operating Income $12,434 $15, % (3) Adjusted Net Income $10,797 $10, % Net Income $9,887 $9, % (1) All amounts are in thousands of USD unless otherwise specified. (2) Net Revenues= Total Revenues Cost of Goods Sold (3) Adjusted Net Income excludes non-recurring items 20
21 Financials: Net Revenue Drivers 1,400,000 $35.0 1,200,000 Sales Volumes CAGR = 42.9% $33.0 $31.0 Sales Volumes (in metric tons) 1,000, , ,000 $29.0 $27.0 $25.0 $23.0 $21.0 $ Gross Sprea ead per Metric Ton 400,000 $19.0 $ ,000 4q06 1q07 2q07 3q07 4q07 1q08 2q08 3q08 $15.0 Volumes Gross Spread 21
22 Financials: Fixed Costs per Volume Sold (1) $/M MT 4q06 1q07 2q07 3q07 4q07 1q08 2q08 3q08 Bunker Vessel OPEX G&A Expenses Bunker Vessel OPEX ex fuel Storage Costs (1) Tracks certain fixed costs per metric tons sold. 22
23 Financials: Working Capital (1) Cash Conversion Cycle Days Outstan nding q06 1q07 2q07 3q07 4q07 1q08 2q08 3q08 DIO DRO DPO CCC (1) DIO= Days Inventory Outstanding, DRO= Days Receivable Outstanding, DPO= Days Payable Outstanding, CCC= Cash Conversion Cycle 23
24 Financials: Profitability (1,2) $60, % 45.0% $50, % Net Revenue (in thousands) $40,000 $30,000 $20,000 $10,000 Net Revenues CAGR = 53.9% 35.0% 30.0% 25.0% 20.0% 15.0% 10.0% EBITDA % Margin 5.0% $0 4q06 1q07 2q07 3q07 4q07 1q08 2q08 3q08 0.0% Net Revenues EBITDA Margin (1) Net Revenues is calculated as Gross Sales or Revenues less COGS. (2) EBITDA Margin is calculated as EBITDA (excluding any FX-related gains/losses) divided by Net Revenue. 24
25 Financials: Revenue Diversification Aegean s Sales Breakdown by Client Sector (1) Tankers Containerships Bulkers Car Carriers Cruise Ships Chemical Tankers Reefers LPG/LNG Other (1) Approximate percentages. 25
26 Financials: Revenue Quality 26
27 Financials: Balance Sheet Data (1) ASSETS LIABILITIES & EQUITY Cash and Cash Equivalents $30,110 Short-term Debt $158,335 Current Assets 447,905 Current Liabilities 402,699 Fixed Assets 325,330 Long-term Debt 139,093 Other Non-Current Assets 41,041 Total Liabilities 542,602 Total Assets 814,276 Stockholders Equity 271,674 (2) (1) As of September 30, 2008 (2) Short-term debt is primarily related to the funding of working capital which has a quick turnover. 27
28 Appendix 28
29 Appendix: Logistics Infrastructure DELIVERY FLEET Current On Order Projected in 2010 % Change Number of Vessels/Barges % Total Capacity (dwt) 164, , , % Avg. Size per Vessel/Barge (dwt) 5,137 5,275 5, % Avg. Year Built 1996 n/a 2002 n/a Avg. Age in Years 13.5 n/a % % of Fleet DH 87.5% 100.0% 92.3% +5.5% ROLL-ON/ROLL-OFF / SPECIALTY TANKERS Number of Vessels 1 1 Total Capacity (dwt) 2,454 2,400 % of Fleet DH 100.0% 100.0% Number of Vessels 1 Total Capacity (dwt) 546 Number of Facilities 5 Capacity of Floating Storage (dwt) 224,849 Capacity of Onshore Storage (m^3) 40,000 (1) SPECIAL PURPOSE VESSELS STORAGE FACILITIES (2) (1) Delivery Fleet includes both vessels and barges. (2) Special Purpose Vessels are small bunkering tankers (circa 1,000 dwt) which are utilized for in-port operations only and hence are not included in utilization calculations. 29
30 Appendix: Current Delivery Fleet (1) Vessel Name Market Hull / Type Year Built DWT Vessel Name Market Hull / Type Year Built DWT 1 Aegean Force Jamaica DH / Vessel , Aegean Flower Fujairah DH / Vessel ,523 2 Vera Jamaica SH / Vessel , Aegean Pride I Fujairah DH / Vessel ,538 3 Hope Jamaica DH / Vessel , Kithnos Fujairah DH / Vessel ,600 4 Aegean Tulip West Africa DH / Vessel , Patmos Fujairah DH / Vessel ,283 5 Aegean VII West Africa SH / Vessel , Serifos Singapore DH / Vessel ,664 6 Amorgos Gibraltar DH / Vessel , Naxos Singapore DH / Vessel ,600 7 Santorini Gibraltar DH / Vessel , Milos Singapore DH / Vessel ,626 8 Aegean XI Gibraltar DH / Vessel , Kimolos Singapore DH / Vessel ,641 9 Mykonos Gibraltar DH / Vessel , Paros Singapore DH / Vessel , Aegean X U.K. DH / Vessel , P.T. 25 Vancouver SH / Barge , Sara Northern Europe DH / Vessel , P.T. 36 Vancouver SH / Barge , Aegean Princess Northern Europe DH / Vessel , Syros Northern Europe DH / Vessel , Aegean Daisy Piraeus DH / Vessel , Aegean III Piraeus DH / Vessel , Aegean Rose Piraeus DH / Vessel , Aegean VIII Piraeus DH / Vessel , Aegean XII Piraeus DH / Vessel , Aegean Breeze I Piraeus DH / Vessel , Aegean Tiffany Piraeus DH / Vessel , Aegean Ace Piraeus DH / Vessel ,615 (1) Geographic deployment represents either current or planned. 30
31 Appendix: Newbuild Delivery Schedule (1,2,) Vessel Name Vessel Type Shipyard Size (dwt) Delivery 1 SN-223 Oceangoing Oil Tanker / Ro Ro Cargo Severnav, Romania 2,400 1q QHS 221 Bunkering Tanker Hyundai, China 5,500 1q QHS 207 Bunkering Tanker Hyundai, China 5,500 2q QHS 208 Bunkering Tanker Hyundai, China 5,500 2q QHS 209 Bunkering Tanker Hyundai, China 5,500 3q QHS 210 Bunkering Tanker Hyundai, China 5,500 3q QHS 215 Bunkering Tanker Hyundai, China 5,500 3q QHS 216 Bunkering Tanker Hyundai, China 5,500 3q QHS 217 Bunkering Tanker Hyundai, China 5,500 4q QHS 222 Bunkering Tanker Hyundai, China 5,500 4q QHS 223 Bunkering Tanker Hyundai, China 5,500 4q QHS 224 Bunkering Tanker Hyundai, China 5,500 4q DN Bunkering Tanker Fujian, China 4,600 4q DN Bunkering Tanker Fujian, China 4,600 4q QHS 225 Bunkering Tanker Hyundai, China 5,500 1q DN Bunkering Tanker Fujian, China 4,600 1q QHS 226 Bunkering Tanker Hyundai, China 5,500 1q DN Bunkering Tanker Fujian, China 4,600 1q DN Bunkering Tanker Fujian, China 4,600 1q QHS 227 Bunkering Tanker Hyundai, China 5,500 2q QHS 228 Bunkering Tanker Hyundai, China 5,500 2q 2010 (1) Delivery schedule as per most recent shipyards reports. (2) Aegean owns options to purchase 2+2 2,400dwt oceangoing specialized tankers / roro cargo from Severnav Shipyard- not included in the schedule above. 31
32 Contact Information 32
33 Contact Information Investor Relations address Aegean Marine Petroleum Network Inc. 299 Park Avenue, 2 nd Floor New York, NY U.S.A. phone website investor@ampni.com 33
Aegean Marine Petroleum Network Inc. Fourth Quarter 2008 Earnings Call Presentation February
 powering the world Aegean Marine Petroleum Network Inc. Fourth Quarter 2008 Earnings Call Presentation February 26 2009 Disclosure Today s presentation and discussion will contain forward-looking statements
Globus Maritime Limited Trading Update and Financial Highlights for the Three Months and Nine Months Ended September 30, 2007.
 Globus Maritime Limited Trading Update and Financial Highlights for the Three Months and Nine Months Ended September 30, 2007. Athens, Greece, November 15, 2007. Globus Maritime Limited (AIM: GLBS), a
OPERATING AND FINANCIAL HIGHLIGHTS. Subsequent Events
 Copa Holdings Reports Net Income of $103.8 million and EPS of $2.45 for the Third Quarter of 2017 Excluding special items, adjusted net income came in at $100.8 million, or EPS of $2.38 per share Panama
OPERATING AND FINANCIAL HIGHLIGHTS
 Copa Holdings Reports Net Income of US$32.0 Million and EPS of US$0.72 for the Second Quarter of 2012 Excluding special items, adjusted net income came in at $58.6 million, or EPS of $1.32 per share Panama
Copa Holdings Reports Net Income of $136.5 million and EPS of $3.22 for the First Quarter of 2018
 Copa Holdings Reports Net Income of $136.5 million and EPS of $3.22 for the First Quarter of 2018 May 9, 2018 PANAMA CITY, May 9, 2018 /PRNewswire/ -- Copa Holdings, S.A. (NYSE: CPA), today announced financial
Investor Update Issue Date: April 9, 2018
 Investor Update Issue Date: April 9, 2018 This investor update provides guidance and certain forward-looking statements about United Continental Holdings, Inc. (the Company or UAL ). The information in
OPERATING AND FINANCIAL HIGHLIGHTS. Subsequent Events
 Copa Holdings Reports Financial Results for the First Quarter of 2016 Excluding special items, adjusted net income came in at US$69.9 million, or EPS of US$1.66 per share Panama City, Panama --- May 5,
OPERATING AND FINANCIAL HIGHLIGHTS
 Copa Holdings Reports Financial Results for the Fourth Quarter of 2015 Excluding special items, adjusted net income came in at $31.7 million, or EPS of $0.73 per share Panama City, Panama --- February
Management Presentation. November 2011
 Management Presentation November 2011 Forward looking statements This presentation as well as oral statements made by officers or directors of Allegiant Travel Company, its advisors and affiliates (collectively
Greek Shipping : Greece s steaming force
 Greek Shipping : Greece s steaming force Dr. Nikolas P. Tsakos President & CEO 1 Tsakos Energy Navigation, Ltd A New York Stock Exchange Listed Company WORLD FLEET by the nationality of owner WORLD FLEET
Copa Holdings Reports Net Income of $49.9 million and EPS of $1.18 for the Second Quarter of 2018
 Copa Holdings Reports Net Income of $49.9 million and EPS of $1.18 for the Second Quarter of 2018 Panama City, Panama --- Aug 8, 2018. Copa Holdings, S.A. (NYSE: CPA), today announced financial results
Copa Holdings Reports Record Earnings of US$41.8 Million for 4Q06 and US$134.2 Million for Full Year 2006
 Copa Holdings Reports Record Earnings of US$41.8 Million for 4Q06 and US$134.2 Million for Full Year 2006 Panama City, Panama --- March 7, 2007. Copa Holdings, S.A. (NYSE: CPA), parent company of Copa
OPERATING AND FINANCIAL HIGHLIGHTS. Subsequent Events
 Copa Holdings Reports Net Income of US$113.1 Million and EPS of US$2.57 for the First Quarter of 2015 Excluding special items, adjusted net income came in at US$106.0 million, or EPS of US$2.41 per share
TANKER MARKET CAN A MIRACLE HAPPEN?
 TEN Ltd THE TANKER MARKET CAN A MIRACLE HAPPEN? Nikolas P. Tsakos President & CEO, TEN November 19 th, 2008 1 Tanker Freight Rates Remain Healthy Charterer discrimination against single hull tonnage on
OPERATING AND FINANCIAL HIGHLIGHTS SUBSEQUENT EVENTS
 Copa Holdings Reports Net Income of US$6.2 Million and EPS of US$0.14 for the Third Quarter of 2015 Excluding special items, adjusted net income came in at $37.4 million, or EPS of $0.85 per share Panama
Air China Limited Interim Results. August Under IFRS
 Air China Limited 21 Interim Results Under IFRS August 21 1 Agenda 21 Interim Results Overview Business Overview Financial Overview Outlook 2 2 2 21 Interim Results 3 21 Interim Results Overview 4 4 4
Air China Limited Annual Results. March Under IFRS
 Air China Limited 21 Annual Results Under IFRS March 211 Agenda Part 1 Highlights Part 2 Business Overview Part 3 Financial Overview Part 4 Outlook 2 Part 1 Highlights Steady Economic Growth; Asia Pacific
OPERATING AND FINANCIAL HIGHLIGHTS SUBSEQUENT EVENTS
 Copa Holdings Reports Financial Results for the Third Quarter of 2016 Excluding special items, adjusted net income came in at $55.3 million, or adjusted EPS of $1.30 per share Panama City, Panama --- November
Copa Holdings Reports Net Income of US$113.9 Million for the Fourth Quarter of 2013
 Copa Holdings Reports Net Income of US$113.9 Million for the Fourth Quarter of 2013 Panama City, Panama --- February 12, 2014. Copa Holdings, S.A. (NYSE: CPA), today announced financial results for the
Spirit Airlines Reports First Quarter 2017 Results
 Spirit Airlines Reports First Quarter 2017 Results MIRAMAR, Fla., April 28, 2017 - Spirit Airlines, Inc. (NASDAQ: SAVE) today reported first quarter 2017 financial results. GAAP net income for the first
SKYWEST, INC. ANNOUNCES THIRD QUARTER 2014 RESULTS
 NEWS RELEASE For Further Information Contact: Investor Relations Telephone: (435) 634-3203 Fax: (435) 634-3205 FOR IMMEDIATE RELEASE: October 29, 2014 SKYWEST, INC. ANNOUNCES THIRD QUARTER 2014 RESULTS
Golden Ocean Group Limited Q results March 1, 2007
 Golden Ocean Group Limited Q4 2006 results March 1, 2007 PROFIT & LOSS 2005 2006 (in thousands of $) 2006 2005 Oct-Dec Oct-Dec Jan - Dec Jan - Dec Operating Revenues 37 292 91 253 Time charter revenues
OPERATING AND FINANCIAL HIGHLIGHTS
 Copa Holdings Reports Financial Results for the Fourth Quarter of 2018 Excluding special items, adjusted net profit came in at $44.0 million, or Adjusted EPS of $1.04 Panama City, Panama --- February 13,
MGM Resorts International Reports Second Quarter Financial Results
 NEWS RELEASE MGM Resorts International Reports Second Quarter Financial Results 8/5/2014 Consolidated Adjusted EBITDA Increased 8%, Led By 10% Growth In Wholly Owned Domestic Resorts MGM China Declares
Investor Relations Update January 25, 2018
 General Overview Investor Relations Update Accounting Changes On January 1, 2018, the company adopted two new Accounting Standard Updates: (ASUs): ASU 2014-9: Revenue from Contracts with Customers (the
Tanker Market Outlook. 12th Mare Forum Ship Finance 2012 Foteini Kanellopoulou, Senior Analyst Amsterdam, 31 October 2012
 Tanker Market Outlook 12th Mare Forum Ship Finance 212 Foteini Kanellopoulou, Senior Analyst Amsterdam, 31 October 212 Tanker Market Outlook 12th Mare Forum Ship Finance 212 Disclaimer The material and
Management Presentation. September 2011
 Management Presentation September 2011 Forward looking statements This presentation as well as oral statements made by officers or directors of Allegiant Travel Company, its advisors and affiliates (collectively
SKYWEST, INC. ANNOUNCES THIRD QUARTER 2012 RESULTS
 NEWS RELEASE For Further Information Contact: Michael J. Kraupp Chief Financial Officer and Treasurer Telephone: (435) 634-3212 Fax: (435) 634-3205 FOR IMMEDIATE RELEASE: November 7, 2012 SKYWEST, INC.
Copa Holdings Reports Net Income of $57.7 million and EPS of $1.36 for the Third Quarter of 2018
 Copa Holdings Reports Net Income of $57.7 million and EPS of $1.36 for the Third Quarter of 2018 November 14, 2018 PANAMA CITY, Nov. 14, 2018 /PRNewswire/ -- Copa Holdings, S.A. (NYSE: CPA), today announced
CONTACT: Investor Relations Corporate Communications
 NEWS RELEASE CONTACT: Investor Relations Corporate Communications 435.634.3200 435.634.3553 Investor.relations@skywest.com corporate.communications@skywest.com SkyWest, Inc. Announces Fourth Quarter 2017
Management Presentation. March 2016
 Management Presentation March 2016 Forward looking statements This presentation as well as oral statements made by officers or directors of Allegiant Travel Company, its advisors and affiliates (collectively
Management Presentation. May 2013
 Management Presentation May 2013 Forward looking statements This presentation as well as oral statements made by officers or directors of Allegiant Travel Company, its advisors and affiliates (collectively
Presentation on Results for the 2nd Quarter FY Idemitsu Kosan Co.,Ltd. November 1, 2016
 Presentation on Results for the 2nd Quarter FY 2016 Idemitsu Kosan Co.,Ltd. November 1, 2016 Table of Contents 1. 2nd Quarter FY 2016 Financials (1) Overview (2) Segment Information 2. Reference Materials
1Q 2017 Earnings Call. April 18, 2017
 1Q 2017 Earnings Call April 18, 2017 Safe Harbor Statement Certain statements included in this presentation are forward-looking and thus reflect our current expectations and beliefs with respect to certain
CONTACT: Investor Relations Corporate Communications
 NEWS RELEASE CONTACT: Investor Relations Corporate Communications 435.634.3200 435.634.3553 Investor.relations@skywest.com corporate.communications@skywest.com SkyWest, Inc. Announces Second Quarter 2016
CONTACT: Investor Relations Corporate Communications
 NEWS RELEASE CONTACT: Investor Relations Corporate Communications 435.634.3200 435.634.3553 Investor.relations@skywest.com corporate.communications@skywest.com SkyWest, Inc. Announces Second Quarter 2017
2Q 2017 Earnings Call. July 19, 2017
 2Q 2017 Earnings Call July 19, 2017 Safe Harbor Statement Certain statements included in this presentation are forward-looking and thus reflect our current expectations and beliefs with respect to certain
Copa Holdings Reports Fourth Quarter and Full Year 2007 Results
 Copa Holdings Reports Fourth Quarter and Full Year 2007 Results Panama City, Panama --- February 21, 2008. Copa Holdings, S.A. (NYSE: CPA), parent company of Copa Airlines and Aero Republica, today announced
Management Presentation. November 2018
 Management Presentation November 2018 Forward looking statements This presentation as well as oral statements made by officers or directors of Allegiant Travel Company, its advisors and affiliates (collectively
WÄRTSILÄ CORPORATION
 WÄRTSILÄ CORPORATION INTERIM REPORT JANUARY-SEPTEMBER 21 OLE JOHANSSON, PRESIDENT & CEO 2 OCTOBER 21 1 Wärtsilä Q3/1 Highlights Order intake EUR 1,4 million (+38%) Net sales EUR 1,39 million (-11%) Operating
Gerry Laderman SVP Finance, Procurement and Treasurer
 Gerry Laderman SVP Finance, Procurement and Treasurer Safe Harbor Statement Certain statements included in this release are forward-looking and thus reflect our current expectations and beliefs with respect
Ship Scrapping - Market Pressures. IMSF Oslo Foteini Kanellopoulou, Senior Analyst 23 May 2012
 Ship Scrapping - Market Pressures IMSF Oslo Foteini Kanellopoulou, Senior Analyst 23 May 212 Disclaimer The material and the information contained herein (together, the "Information") are provided by H.
Earnings Report 1 st Quarter 2016 Grupo Viva Aerobus
 Earnings Report 1 st Quarter 2016 Grupo Viva Aerobus Grupo Viva Aerobus announces results for the first quarter of 2016 Mexico City, Mexico, April 29, 2016- Grupo Viva Aerobus S.A. de C.V. ( Grupo Viva
OPERATING AND FINANCIAL HIGHLIGHTS
 Copa Holdings Reports Net Income of US$18.6 Million and EPS of US$0.42 for the Second Quarter of 2010 Excluding special items, adjusted net income came in at $26.3 million, or $0.60 per share Panama City,
ASL Marine Holdings Ltd.
 ASL Marine Holdings Ltd. SHIPBUILDING SHIPREPAIR SHIPCHARTERING Pulse of Asia 2008 - Presentation 8 th July 2008 1 Presentation Outline Company Profile 9M FY2008 Financial Review Business Review - Shipbuilding
Volaris Reports Strong First Quarter 2015: 32% Adjusted EBITDAR Margin, 9% Operating Margin
 Volaris Reports Strong First Quarter 2015: 32% Adjusted EBITDAR Margin, 9% Operating Margin Mexico City, Mexico, April 22, 2015 Volaris* (NYSE: VLRS and BMV: VOLAR), the ultra-low-cost airline serving
Management Presentation. August 2012
 Management Presentation August 2012 Forward looking statements This presentation as well as oral statements made by officers or directors of Allegiant Travel Company, its advisors and affiliates (collectively
Copa Holdings Reports Net Income of US$51.9 Million for the Fourth Quarter of 2008 and US$152.2 Million for Full Year 2008
 Copa Holdings Reports Net Income of US$51.9 Million for the Fourth Quarter of 2008 and US$152.2 Million for Full Year 2008 Panama City, Panama --- February 19, 2009. Copa Holdings, S.A. (NYSE: CPA), parent
The World s Largest Buyer of Ships and Offshore Assets
 The World s Largest Buyer of Ships and Offshore Assets 9 th Annual Marine Money London Ship Finance Forum, 24 January 218 Evan F. Sproviero, Head of Projects, GMS 1 A. Recycling Prices and Residual Values
SkyWest, Inc. Announces First Quarter 2018 Profit
 NEWS RELEASE CONTACT: Investor Relations Corporate Communications 435.634.3200 435.634.3553 Investor.relations@skywest.com corporate.communications@skywest.com SkyWest, Inc. Announces First Quarter 2018
MIRAMAR, Fla., April 29, 2015 (GLOBE NEWSWIRE) -- Spirit Airlines, Inc. (Nasdaq:SAVE) today reported first quarter 2015 financial results.
 -- Spirit Airlines, Inc. (Nasdaq:SAVE) today reported first quarter 2015 financial results.") April 29, 2015 Spirit Airlines Announces First Quarter 2015 Results; Adjusted Net Income Increases 87.1 Percent to $70.7 Million and Pre-Tax Margin Increases 900 Basis Points to 22.7 Percent MIRAMAR, Fla.,
April 29, 2015 Spirit Airlines Announces First Quarter 2015 Results; Adjusted Net Income Increases 87.1 Percent to $70.7 Million and Pre-Tax Margin Increases 900 Basis Points to 22.7 Percent MIRAMAR, Fla.,
MARINE CIRCULAR MC-1/2013/1
 Singapore Operations Office: 10 Anson Road #25-16, International Plaza, Singapore 079903 Tel: (65) 6224 2345 Fax: (65) 6227 2345 Email: info@tvship.com Website: www.tvship.com 01/2019 MARINE CIRCULAR MC-1/2013/1
Air China Limited 2015 First Quarter Results
 Air China Limited 2015 First Quarter Results April 2015 Under PRC GAAP, unaudited Agenda Part 1 Part 2 Part 3 Results Highlights Business Performance Financial Review Part 1 Results Highlights Results
Presentation on Results for the 2nd Quarter FY Idemitsu Kosan Co.,Ltd. November 14, 2018
 Presentation on Results for the 2nd Quarter FY 2018 Idemitsu Kosan Co.,Ltd. November 14, 2018 Table of Contents 1. FY 2018 2nd Quarter Financials (1) Overview (2) Segment Information 2. Reference Materials
Copa Holdings Reports Earnings of US$30.3 Million and EPS of US$0.70 for 3Q08
 Copa Holdings Reports Earnings of US$30.3 Million and EPS of US$0.70 for 3Q08 Panama City, Panama --- November 13, 2008. Copa Holdings, S.A. (NYSE: CPA), parent company of Copa Airlines and Aero Republica,
Presentation on Results for the 3rd Quarter FY Idemitsu Kosan Co.,Ltd. February 14, 2019
 Presentation on Results for the 3rd Quarter FY 2018 Idemitsu Kosan Co.,Ltd. February 14, 2019 Table of Contents 1. FY 2018 3rd Quarter Results (1) Overview (2) Segment Information 2. Forecast for FY 2018
Thor Basics: An Introduction to the Company. 1
 Thor Basics: An Introduction to the Company www.thorindustries.com 1 FORWARD LOOKING STATEMENTS This presentation includes certain statements that are forward looking statements within the meaning of the
Air China Limited 2014 Annual Results Under IFRS
 Air China Limited 2014 Annual Results Under IFRS March 2015 Agenda Part 1 Results Highlights Part 2 Business Overview Part 3 Financial Overview Part 4 Outlook Part 1 Results Highlights Gradual Global Economic
DFDS A/S H Analyst meeting 30 August 2006
 DFDS A/S H1 2006 Analyst meeting 30 August 2006 DFDS A/S Contents The half-year in brief Strategy on track DFDS Seaways DFDS Tor Line Half-year accounts & profit forecast 2006 DFDS A/S H1 2006 in brief
PRESS RELEASE Financial Results. Rising passenger traffic at 12.5m Exceeding 1bn in consolidated revenue
 PRESS RELEASE 2016 Financial Results Rising passenger traffic at 12.5m Exceeding 1bn in consolidated revenue Kifissia, 23 March 2017 AEGEAN reports full year 2016 results with consolidated revenue at 1,020m,
Investor Presentation
 Investor Presentation Communication financière Publication semestrielle Octobre 2016 Company at a glance : the leading port operator in Morocco 36,3 millions of tons Traffic (2016) Mad 2 567 mn USD 254
Investor Relations Update October 25, 2018
 General Overview Investor Relations Update Revenue The company expects its fourth quarter total revenue per available seat mile (TRASM) to be up approximately 1.5 to 3.5 percent year-over-year. Fuel Based
WÄRTSILÄ CORPORATION RESULT PRESENTATION JANUARY Björn Rosengren, President & CEO. Wärtsilä
 WÄRTSILÄ CORPORATION RESULT PRESENTATION 2014 29 JANUARY 2015 Björn Rosengren, President & CEO Wärtsilä Highlights 2014 good performance in challenging markets Order intake EUR 5,084 million, +5% Net sales
American Airlines Group Inc.
 American Airlines Group Inc. Deutsche Bank Leveraged Finance Conference October 4, 2017 Tom Weir Vice President, Treasurer Cautionary Statement Regarding Forward-Looking Statements and Information This
Investor Update September 2017 PARTNER OF CHOICE EMPLOYER OF CHOICE INVESTMENT OF CHOICE
 Investor Update September 2017 PARTNER OF CHOICE EMPLOYER OF CHOICE INVESTMENT OF CHOICE 1 Forward Looking Statements In addition to historical information, this presentation contains forward-looking statements
Investor Presentation
 Investor Presentation Communication financière Publication semestrielle Octobre 2016 Company at a glance : the leading port operator in Morocco 36,1 millions of tons Traffic (2017) Mad 2 554 mn USD 278
PRESS RELEASE. First Half 2017 Financial Results Higher Load Factors and traffic lead to a significant rebound in second quarter profitability
 PRESS RELEASE First Half 2017 Financial Results Higher Load Factors and traffic lead to a significant rebound in second quarter profitability Kifissia, 12 September 2017 AEGEAN announces first half 2017
Presentation on Results for the 3rd Quarter FY Idemitsu Kosan Co.,Ltd. February 14, 2018
 Presentation on Results for the 3rd Quarter FY 2017 Idemitsu Kosan Co.,Ltd. February 14, 2018 Table of Contents 1. FY 2017 3rd Quarter Results (1) Overview (2) Segment Information 2. Forecast for FY2017
Corporate Presentation 5 March 2003
 Corporate Presentation 5 March 2003 Agenda Investment Highlights Business Overview Financial Highlights Competitive Strengths Business Strategies & Future Plans Growth Prospects Corporate Presentation
Joe Randell President and Chief Executive Officer Jolene Mahody Executive Vice President and Chief Financial Officer
 Joe Randell President and Chief Executive Officer Jolene Mahody Executive Vice President and Chief Financial Officer Nathalie Megann Vice President, Investor Relations and Corporate Affairs December, 2015
Wärtsilä Corporation. Interim Report January-September 2006 Ole Johansson, President & CEO. 31 October Wärtsilä
 Wärtsilä Corporation Interim Report January-September 26 Ole Johansson, President & CEO 31 October 26 Highlights Q3/26 Strong order intake continued (+25%) Net sales +26% Operating income +29% Strong cash
Spirit Airlines Reports Fourth Quarter and Full Year 2016 Results
 Spirit Airlines Reports Fourth Quarter and Full Year 2016 Results MIRAMAR, FL. (February 7, 2017) - Spirit Airlines, Inc. (NASDAQ: SAVE) today reported fourth quarter and full year 2016 financial results.
Final Results 31 December 2013
 Final Results 31 December 2013 Clarkson PLC 10 March 2014 www.clarksons.com Agenda Headline results Divisional performance Business Model & Strategy The market Outlook 10 March 2014 Final Results www.clarksons.com
Grupo Viva Aerobus announces results for the third quarter of 2016
 Earnings Earnings Report Report 3 rd rd Quarter Quarter 2016 2016 Grupo Grupo Viva Viva Aerobus Aerobus Grupo Viva Aerobus announces results for the third quarter of 2016 Mexico City, Mexico, October 27,
INTERIM REPORT JANUARY-JUNE 2012 BJÖRN ROSENGREN, PRESIDENT & CEO 18 JULY 2012
 INTERIM REPORT JANUARY-JUNE 212 BJÖRN ROSENGREN, PRESIDENT & CEO 18 JULY 212 Highlights Q2/212 Order intake EUR 1,198 million, +2% Net sales EUR 1,99 million, +6% Book-to-bill 1.9 (1.13) EBIT EUR 113 million,
Spirit Airlines Reports Second Quarter 2018 Results
 Spirit Airlines Reports Second Quarter 2018 Results MIRAMAR, Fla., July 25, 2018 - Spirit Airlines, Inc. (NYSE: SAVE) today reported second quarter 2018 financial results. GAAP net income for the second
Results 2Q17. August 9, 2017
 Results 2Q17 August 9, 2017 2Q17 Highlights Indicators 2Q17 Var. x 2Q16 ASK (BN) 10.4-3.0% Traffic (000) 7,261-1.3% RPK (BN) 8.1 +0.5% Load Factor 77.9% +2.7 p.p. Yield (R$ cents) 23.2 +4.8% Pax Revenue
Part 1 Performance Highlights. Part 2 Business Overview. Part 3 Financial Review
 August 216 1 Part 1 Performance Highlights Part 2 Business Overview Part 3 Financial Review Part 4 Outlook 2 Under IFRS 3 Part 1 Performance Highlights Performance Highlights - Key Operational Metrics
Presentation on Results for the 3rd Quarter FY Idemitsu Kosan Co.,Ltd. February 2, 2016
 Presentation on Results for the 3rd Quarter FY 2015 Idemitsu Kosan Co.,Ltd. February 2, 2016 Table of Contents 1. 3 rd Quarter FY 2015 Financials (1) Overview (2) Segment Information 2. Forecast for FY
Presentation on Results for the 1st Quarter FY Idemitsu Kosan Co.,Ltd. August 14, 2017
 Presentation on Results for the 1st Quarter FY 2017 Idemitsu Kosan Co.,Ltd. August 14, 2017 Table of Contents 1. FY 2017 1st Quarter Financials (1) Overview (2) Segment Information 2. Reference Materials
IUMI 2005 Amsterdam Facts & Figures Committee
 Report on Marine Insurance Premium 23 and 24 IUMI 25 Amsterdam Facts & Figures Committee Tore Forsmo, Managing Director Astrid Seltmann, Analyst The Central Union of Marine Underwriters, Oslo, Norway Thanks
MGM Resorts International Reports Strong First Quarter Financial And Operating Results
 NEWS RELEASE MGM Resorts International Reports Strong First Quarter Financial And Operating Results 5/5/2016 Increases Wholly Owned Domestic Resorts Net Revenue and Adjusted Property EBITDA by 3% and 24%
2012 RESULT PRESENTATION
 212 RESULT PRESENTATION BJÖRN ROSENGREN, PRESIDENT & CEO 25 JANUARY 213 Wärtsilä Net sales back to growth with stable profitability 212 development Order intake EUR 4,94 million, +9% Net sales EUR 4,725
2015 RESEARCH AND ANALYSIS: GREEK FLEET STATISTICS 2ND PART OF 2015 PETROFIN RESEARCH CONTENTS OF PETROFIN RESEARCH PART 2
 based on data as of September RESEARCH AND ANALYSIS: GREEK FLEET STATISTICS 2ND PART OF CONTENTS OF PART 2 RESULTS AT A GLANCE (P. 2) SECTION A: VITAL STATISTICS OF THE ENTIRE GREEK FLEET (P. 3) SECTION
WÄRTSILÄ CORPORATION
 WÄRTSILÄ CORPORATION 26 RESULT PRESENTATION OLE JOHANSSON, PRESIDENT & CEO 6 FEBRUARY 27 1 Wärtsilä Highlights 26 Order intake +32.4% Order book +52.8% Net sales +26.6% Operating income +29.2% Profitability
2018 Annual Meeting of Stockholders
 2018 Annual Meeting of Stockholders Playing the Long Game June 13, 2018 Doug Parker Chairman and Chief Executive Officer American Airlines Group Inc. Cautionary Statement Regarding Forward-Looking Statements
THIRD QUARTER AND NINE MONTHS OF 2014 KEY RESULTS
 THIRD QUARTER AND NINE MONTHS OF 2014 KEY RESULTS In 3Q14 INTERJET total revenues were $ 3,643.4 million, representing an increase of 9.9% on revenues generated in the 3Q13. Accumulated 9M14 INTERJET total
Spirit Airlines Reports First Quarter 2018 Results
 Spirit Airlines Reports First Quarter 2018 Results MIRAMAR, Fla., April 26, 2018 - Spirit Airlines, Inc. (NYSE: SAVE) today reported first quarter 2018 financial results. For the first quarter 2018, Spirit
Management Presentation. May 2012
 Management Presentation May 2012 Forward looking statements This presentation as well as oral statements made by officers or directors of Allegiant Travel Company, its advisors and affiliates (collectively
J.P. Morgan Aviation, Transportation and Industrials Conference
 J.P. Morgan Aviation, Transportation and Industrials Conference March 3, 08 Scott Kirby President Safe Harbor Statement Certain statements included in this presentation are forward-looking and thus reflect
Information meeting. Jean-Cyril Spinetta Chairman and CEO
 Information meeting Jean-Cyril Spinetta Chairman and CEO Forward-looking statements The information herein contains forward-looking statements about Air France-KLM and its business. These forward-looking
Cebu Air, Inc. 2Q2014 Results of Operation
 Cebu Air, Inc. 2Q2014 Results of Operation 1 Disclaimer This information provided in this presentation is provided only for your reference. Such information has not been independently verified and, as
I The shipping market contents ISL
 Comment - Charts and Tables concerning The Shipping Market World Merchant Fleet Tanker Market Bulk Carrier Market Tab. 1 Additions/Reductions by Ship Types 2014-2016 and up to June 2017... III Tab. 2 Size
UBS 14 th Global Emerging Markets Conference. New York, November 2016
 UBS 14 th Global Emerging Markets Conference New York, November 2016 This presentation may include forward-looking comments regarding the Company s business outlook and anticipated financial and operating
Wärtsilä Corporation. Interim Report January-March 2005 Ole Johansson, President & CEO. 4 May Wärtsilä
 Wärtsilä Corporation Interim Report January-March 2005 Ole Johansson, President & CEO 4 May 2005 Highlights of the first quarter Net sales up by 9.4% to EUR 570.7 million (521.7) Operating income improved
MGM MIRAGE Reports Record Second Quarter Revenue, Cash Flow and Net Income
 NEWS RELEASE MGM MIRAGE Reports Record Second Quarter Revenue, Cash Flow and Net Income 7/24/2001 PRNewswire LAS VEGAS MGM MIRAGE (NYSE: MGG) today reported earnings of 47 cents per diluted share for the
Fact Sheet for Q3 and January-September 2017 October 20, 2017
 Fact Sheet for Q3 and January-September 2017 October 20, 2017 Contents Daimler Group Stock Market Information 3 Earnings and Financial Situation 4-12 Information for Divisions Mercedes-Benz Cars 13-16
8 th City of London Biennial Meeting November 2016 International Maritime Organisation (IMO), London
, London") 8 th City of London Biennial Meeting 17-18 November 2016 International Maritime Organisation (IMO), London Drybulk Shipping in 21 st Century by Hakki Deval (MSc STF 2001) 0 China joins WTO in December
8 th City of London Biennial Meeting 17-18 November 2016 International Maritime Organisation (IMO), London Drybulk Shipping in 21 st Century by Hakki Deval (MSc STF 2001) 0 China joins WTO in December
Corporate presentation CIBC Whistler Institutional Investor Conference January 21, 2010
 Corporate presentation CIBC Whistler Institutional Investor Conference January 21, 2010 Forwardlooking statement Certain information in this presentation and statements made during this presentation, including
1Q 2018 Earnings Call. April 18, 2018
 1Q 2018 Earnings Call April 18, 2018 Safe Harbor Statement Certain statements included in this presentation are forward-looking and thus reflect our current expectations and beliefs with respect to certain