Aegean Marine Petroleum Network Inc. Fourth Quarter 2008 Earnings Call Presentation February
|
|
|
- Curtis Fox
- 5 years ago
- Views:
Transcription

1 powering the world Aegean Marine Petroleum Network Inc. Fourth Quarter 2008 Earnings Call Presentation February
2 Disclosure Today s presentation and discussion will contain forward-looking statements within the meaning of the Private Securities Litigation Reform Act of Words such as expects, anticipates, intends, estimates, or similar expressions are intended to identify these forward-looking statements. These statements are based on Aegean Marine Petroleum Network Inc. s current plans and expectations and involve risks and uncertainties that could cause future activities and results of operations to be materially different from those set forth in the forward-looking statements. Important factors that could cause actual results to differ include our future operating or financial results, our ability to manage growth, adverse conditions in the marine fuel supply industries, and increased levels of competition. For further information, please refer to Aegean Marine Petroleum Network Inc. s reports and filings with the Securities and Exchange Commission. 2


3 ...powering the world 3
4 Agenda Highlights Financial Overview Industry Strategy Q&A Appendix 4
5 Highlights 5
6 Highlights Increased sales volumes to 1,568,770 metric tons in Q and 5,200,256 metric tons for the full year. Expanded net revenues to $51.6 million in Q and $170.9 million for Generated gross spread on marine petroleum products of $47.7 million in Q and $161.0 million for the full year. Recorded operating income of $18.3 million in Q and $52.1 million for the full year. Reported adjusted net income, which excludes a $1.0 million tax expense, of $14.1 million, or $0.33 basic and diluted earnings per share for Q Net Income for the quarter was $13.1 million, or $0.31 basic and diluted earnings per share. Net Income for the full year was $39.9 million, or $0.94 basic and diluted earnings per share. Continued expanding global presence and infrastructure: Announced expansion into Trinidad and Tobago (Southern Caribbean) and Tangiers (Morocco), increasing our presence to 13 markets worldwide. Took delivery of seven double-hull bunkering tanker newbuildings in 2008 and year-to-date in Acquired four double-hull bunkering tankers and two bunkering barges in the secondary market in 2008 and year-to-date in Implemented a $25 million stock repurchase program. 6
7 Financial Overview 7
8 (1) Financial Overview: Selected Financials Year-on-Year Comparison 4q07 4q08 YoY % Sales Volumes (MT) 1,026,395 1,568, % (4) Gross Spread per MT ($/MT) $28.41 $30.21 / $ % / +14.3% (2) Net Revenue $32,634 $51, % Operating Income $8,816 $18, % (3) Adjusted Net Income $7,755 $14, % Net Income $6,255 $13, % Quarter-on-Quarter Comparison 3q08 4q08 QoQ % Sales Volumes (MT) 1,338,914 1,568, % Gross Spread per MT ($/MT) $32.75 $30.21 / $ % / -0.8% (2) Net Revenue $46,384 $51, % Operating Income $15,057 $18, % (3) Adjusted Net Income $10,521 $14, % Net Income $9,455 $13, % (4) (4) (4) (1) All amounts are in thousands of USD unless otherwise specified. (2) Net Revenues= Total Revenues - Cost of Goods Sold - Cargo Transportation Costs (3) Adjusted Net Income excludes non-recurring items (4) Gross spread per metric ton calculation pre FX translation adjustment. 8
9 Financial Overview: Net Revenue Drivers 1,750,000 $40.0 (in metric tons) Sales Volumes 1,500,000 1,250,000 1,000, , ,000 Sales Volumes CAGR = 47.3% $37.5 $35.0 $32.5 $30.0 $27.5 $25.0 $ Gross Spread per Metric Ton 250,000 $ q06 1q07 2q07 3q07 4q07 1q08 2q08 3q08 4q08 $20.0 Volumes Gross Spread (1) (1) Gross spread per metric ton calculation changed in the fourth quarter 2008 to reflect FX translation adjustment. 9
10 Financial Overview: Company-wide Utilization (1,2) 800 Volu ume (metric tons delivered d per vessel per day) q06 1q07 2q07 3q07 4q07 1q08 2q08 3q08 4q08 Gross Adjusted (1) Utilization is measured as volume (in metric tons) delivered per vessel per day. (2) Adjusted figure excludes non-operating (off-hire) days caused by both scheduled and unscheduled maintenance requirements; Aegean began monitoring this metric in 1q08. 10
11 (1,2) Financial Overview: Market-specific Utilization 1100 Volume (metric tons del elivered per vessel per day) Singapore U.A.E. Greece Northern Europe U.K. Gibraltar West Africa Jamaica Vancouver 4q06 1q07 2q07 3q07 4q07 1q08 2q08 3q08 4q08 (1) Utilization is measured as volume (in metric tons) delivered per vessel per day. (2) Figures are not adjusted for non-operating days. 11
12 Financial Overview: Volume Analysis $ per MT Sold 4q06 1q07 2q07 3q07 4q07 1q08 2q08 3q08 4q08 Bunker Vessel OPEX G&A Expenses Operating Income Bunker Vessel OPEX ex fuel Storage Costs 12
13 Financial Overview: Profitability (1,2) $60, % $50,000 Net Revenues CAGR = 45.8% 48.0% 46.0% Net Revenue (in thousands) $40,000 $30,000 $20,000 $10, % 42.0% 40.0% 38.0% 36.0% 34.0% EBITDA % Margin 32.0% $0 4q06 1q07 2q07 3q07 4q07 1q08 2q08 3q08 4q % Net Revenues EBITDA Margin (1) Net Revenues= Total Revenues - Cost of Goods Sold - Cargo Transportation Costs (2) EBITDA Margin is calculated as EBITDA (excluding any FX-related gains/losses) divided by Net Revenue. 13
14 Financial Overview: Working Capital (1) Cash Conversion Cycle Days Outstan nding q06 1q07 2q07 3q07 4q07 1q08 2q08 3q08 4q08 DIO DPO DRO CCC (1) DIO= Days Inventory Outstanding, DRO= Days Receivable Outstanding, DPO= Days Payable Outstanding, CCC= Cash Conversion Cycle 14
15 (1) Financial Overview: Balance Sheet Data ASSETS LIABILITIES and SE Cash and Cash Equivalents $46,927 Short-term Debt $99,352 Current Assets 251,387 Current Liabilities 202,022 Fixed Assets 349,380 Long-term Debt 154,269 Other Non-Current Assets 41,140 Other Non-Current Liabilities 613 TOTAL LIABILITIES $356,904 STOCKHOLDERS EQUITY $285,003 TOTAL ASSETS $641,907 TOTAL LIABILITIES & SE $641,907 (1) As of December 31,
16 Industry 16
17 Industry: Review Capital Access Status Industry Effect Aegean Limited Increased risk to the funding of operations (working capital) and capex. Renewed credit facility in January Ample liquidity to fund growth. Leading to charges. Sophisticated credit Credit (to customers) Higher risk control systems has mitigated bad-debt loss. Marine Fuel Prices Lower/ Volatile Reduction in working capital requirements. Harder to manage price movements. Experienced purchasing and sales teams successfully manage client demand and product sourcing. Single-hull Phase-out In-effect All E.U. ports are now double-hull. Fully compliant. 17
18 Industry: Supply Fundamentals Projected World Bunkering Vessel Fleet (1) IMO MARPOL Regulation 13H bans single-hull tankers between 600 and 5,000 dwt from carrying heavy-grade oil; regulations went into effect beginning # of Vessels s Single-hull Double-hull (1) Lloyds MIU 18
19 Industry: Regulations Aegean s Markets Size (mm of tons) 1 Singapore U.A.E Regulations Single-hulls allowed to operate until their 25 th anniversary. Current owners/operators of double-hull vessels are eligible for waivers on certain port fees. Single-hulls allowed to operate until their 25 th anniversary but no later than end-of Gibraltar 4.0 Only double-hulls allowed to operate. 4 Greece 4.0 Only double-hulls allowed to operate. 5 Trinidad & Tobago (Southern Caribbean) West Africa 3.0 (1) No new single-hulls allowed to enter market. Ghana allows single-hulls to operate subject to receiving approval. Moving towards adopting regulation. 7 Vancouver 1.0 Single-hulls allowed to operate until end-of U.K. 1.0 Only double-hulls allowed to operate. (2) 9 Northern Europe 0.6 Only double-hulls allowed to operate. 10 Jamaica 0.6 No single-hull restrictions are currently in-place. 11 Mexico 0.3 Single-hulls allowed to operate until end-of Montreal 0.3 Single-hulls allowed to operate until end-of Tangiers n/a Only double-hulls allowed to operate. Aegean s Markets 65.3 Global Market Size (1) Bunkerworld and Company information (2) Niche market (non ARA region) 19
20 Strategy 20


21 Strategy: New Markets Market Competitive Landscape Single-hull Regulation Key Strengths Expected Commencement Tangiers (Morocco) Low Only double-hulls allowed to operate Strategic location Planned regional hub Aegean, sole bunkering operator 2q09 21


22 Strategy: New Markets Market Size Competitive Landscape Single-hull Regulation Key Strengths Expected Commencement Trinidad & Tobago 3.5mm MT (Southern Caribbean) Medium Only double-hulls allowed to enter market 2q09 Strategic location Transshipment Hub Local supply agreement 22

")
 Montreal")

 Athens /")
")
 Tangiers")
")
")
")
 Markets")
23 Strategy: Global Reach Northern Europe (2007) Vancouver (2008) Montreal (2008) New York Gibraltar (1998) U.K. (2008) Athens / Greece (1995) Mexico (2008) Miami Jamaica (2005) Tangiers (2009e) U.A.E (2001) Trinidad & Tobago (2009e) West Africa (2008) Singapore (2006) Markets Headquarters Executive / Finance / Sales Business Development 23
24 Strategy: Delivery Fleet Growth (1) # of Ves ssels Current count is 32. (as of February 2009) CAGR= 34.1% e 2010e SH DH (1) Delivery fleet includes both vessels and barges. 24
25 Strategy: Diversification Aegean s Sales Breakdown by Client Sector (1) Tankers Containerships Bulkers Car Carriers Cruise Ships Chemical Tankers Reefers LPG/LNG Other (1) Approximate percentages. 25
26 Strategy: Credit 26
")


, and SK")
27 Strategy: Marine Lubricants Marine Lubricants Size of Global Market Market Dynamics Aegean s Entrance into Market 2007 (1) Sealub Alliance Network Oils used by vessels to reduce friction in engines and machines. 2mm metric tons Dominated by the majors Group formed by Gulf Oil Marine to market and distribute marine lubricants globally. Aegean joined Sealub in February Other members include PetroChina, Ipiranga (Brazil), and SK (South Korea). Presence in over 450 ports in 40 countries. (1) Aegean estimates 27
28 Appendix 28
29 Appendix: Logistics Infrastructure DELIVERY FLEET Current On Order Projected in 2010 % Change Number of Vessels/Barges % Total Capacity (dwt) 164, , , % Avg. Size per Vessel/Barge (dwt) 5,137 5,275 5, % Avg. Year Built 1996 n/a 2002 n/a Avg. Age in Years 13.5 n/a % % of Fleet DH 87.5% 100.0% 92.3% +5.5% ROLL-ON/ROLL-OFF / SPECIALTY TANKERS Number of Vessels 1 1 Total Capacity (dwt) 2,454 2,400 % of Fleet DH 100.0% 100.0% Number of Vessels 1 Total Capacity (dwt) 546 Number of Facilities 5 Capacity of Floating Storage (dwt) 224,849 Capacity of Onshore Storage (m^3) 40,000 (1) SPECIAL PURPOSE VESSELS STORAGE FACILITIES (2) (1) Delivery Fleet includes both vessels and barges. (2) Special Purpose Vessels are small bunkering tankers (circa 1,000 dwt) which are utilized for in-port operations only and hence are not included in utilization calculations. 29
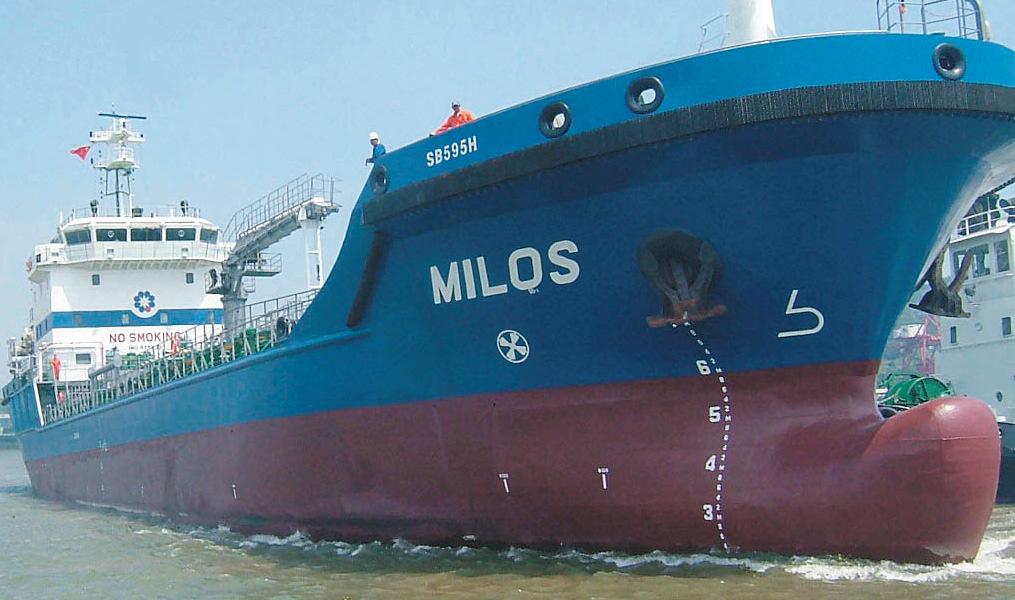
30 Appendix: Current Delivery Fleet (1) Vessel Name Market Hull / Type Year Built DWT Vessel Name Market Hull / Type Year Built DWT 1 Aegean Force Jamaica DH / Vessel , Aegean Flower Fujairah DH / Vessel ,523 2 Vera Jamaica SH / Vessel , Aegean Pride I Fujairah DH / Vessel ,538 3 Hope Jamaica DH / Vessel , Kithnos Fujairah DH / Vessel ,600 4 Aegean Tulip West Africa DH / Vessel , Patmos Fujairah DH / Vessel ,283 5 Aegean VII West Africa SH / Vessel , Serifos Singapore DH / Vessel ,664 6 Amorgos Gibraltar DH / Vessel , Naxos Singapore DH / Vessel ,600 7 Santorini Gibraltar DH / Vessel , Milos Singapore DH / Vessel ,626 8 Aegean XI Gibraltar DH / Vessel , Kimolos Singapore DH / Vessel ,641 9 Mykonos Gibraltar DH / Vessel , Paros Singapore DH / Vessel , Aegean X U.K. DH / Vessel , P.T. 25 Vancouver SH / Barge , Sara Northern Europe DH / Vessel , P.T. 36 Vancouver SH / Barge , Aegean Princess Northern Europe DH / Vessel , Syros Northern Europe DH / Vessel , Aegean Daisy Piraeus DH / Vessel , Aegean III Piraeus DH / Vessel , Aegean Rose Piraeus DH / Vessel , Aegean VIII Piraeus DH / Vessel , Aegean XII Piraeus DH / Vessel , Aegean Breeze I Piraeus DH / Vessel , Aegean Tiffany Piraeus DH / Vessel , Aegean Ace Piraeus DH / Vessel ,615 (1) Geographic deployment represents either current or planned. 30
31 Appendix: Newbuild Delivery Schedule (1,2,) Vessel Name Vessel Type Shipyard Size (dwt) Delivery 1 SN-223 Oceangoing Oil Tanker / Ro Ro Cargo Severnav, Romania 2,400 1q QHS 221 Bunkering Tanker Hyundai, China 5,500 1q QHS 207 Bunkering Tanker Hyundai, China 5,500 2q QHS 208 Bunkering Tanker Hyundai, China 5,500 2q QHS 209 Bunkering Tanker Hyundai, China 5,500 3q QHS 210 Bunkering Tanker Hyundai, China 5,500 3q QHS 215 Bunkering Tanker Hyundai, China 5,500 3q QHS 216 Bunkering Tanker Hyundai, China 5,500 3q QHS 217 Bunkering Tanker Hyundai, China 5,500 4q QHS 222 Bunkering Tanker Hyundai, China 5,500 4q QHS 223 Bunkering Tanker Hyundai, China 5,500 4q QHS 224 Bunkering Tanker Hyundai, China 5,500 4q DN Bunkering Tanker Fujian, China 4,600 4q DN Bunkering Tanker Fujian, China 4,600 4q QHS 225 Bunkering Tanker Hyundai, China 5,500 1q DN Bunkering Tanker Fujian, China 4,600 1q QHS 226 Bunkering Tanker Hyundai, China 5,500 1q DN Bunkering Tanker Fujian, China 4,600 1q DN Bunkering Tanker Fujian, China 4,600 1q QHS 227 Bunkering Tanker Hyundai, China 5,500 2q QHS 228 Bunkering Tanker Hyundai, China 5,500 2q 2010 (1) Delivery schedule as per most recent shipyards reports. (2) Aegean owns options to purchase 2+2 2,400dwt oceangoing specialized tankers / roro cargo from Severnav Shipyard- not included in the schedule above. 31
powering the world Aegean Marine Petroleum Network Inc. Investor Presentation January 2009
 powering the world Aegean Marine Petroleum Network Inc. Investor Presentation January 2009 Disclosure Today s presentation and discussion will contain forward-looking statements within the meaning of the
OPERATING AND FINANCIAL HIGHLIGHTS. Subsequent Events
 Copa Holdings Reports Financial Results for the First Quarter of 2016 Excluding special items, adjusted net income came in at US$69.9 million, or EPS of US$1.66 per share Panama City, Panama --- May 5,
OPERATING AND FINANCIAL HIGHLIGHTS SUBSEQUENT EVENTS
 Copa Holdings Reports Net Income of US$6.2 Million and EPS of US$0.14 for the Third Quarter of 2015 Excluding special items, adjusted net income came in at $37.4 million, or EPS of $0.85 per share Panama
OPERATING AND FINANCIAL HIGHLIGHTS
 Copa Holdings Reports Financial Results for the Fourth Quarter of 2015 Excluding special items, adjusted net income came in at $31.7 million, or EPS of $0.73 per share Panama City, Panama --- February
Globus Maritime Limited Trading Update and Financial Highlights for the Three Months and Nine Months Ended September 30, 2007.
 Globus Maritime Limited Trading Update and Financial Highlights for the Three Months and Nine Months Ended September 30, 2007. Athens, Greece, November 15, 2007. Globus Maritime Limited (AIM: GLBS), a
OPERATING AND FINANCIAL HIGHLIGHTS SUBSEQUENT EVENTS
 Copa Holdings Reports Financial Results for the Third Quarter of 2016 Excluding special items, adjusted net income came in at $55.3 million, or adjusted EPS of $1.30 per share Panama City, Panama --- November
OPERATING AND FINANCIAL HIGHLIGHTS
 Copa Holdings Reports Net Income of US$32.0 Million and EPS of US$0.72 for the Second Quarter of 2012 Excluding special items, adjusted net income came in at $58.6 million, or EPS of $1.32 per share Panama
Copa Holdings Reports Record Earnings of US$41.8 Million for 4Q06 and US$134.2 Million for Full Year 2006
 Copa Holdings Reports Record Earnings of US$41.8 Million for 4Q06 and US$134.2 Million for Full Year 2006 Panama City, Panama --- March 7, 2007. Copa Holdings, S.A. (NYSE: CPA), parent company of Copa
Copa Holdings Reports Net Income of $49.9 million and EPS of $1.18 for the Second Quarter of 2018
 Copa Holdings Reports Net Income of $49.9 million and EPS of $1.18 for the Second Quarter of 2018 Panama City, Panama --- Aug 8, 2018. Copa Holdings, S.A. (NYSE: CPA), today announced financial results
OPERATING AND FINANCIAL HIGHLIGHTS. Subsequent Events
 Copa Holdings Reports Net Income of US$113.1 Million and EPS of US$2.57 for the First Quarter of 2015 Excluding special items, adjusted net income came in at US$106.0 million, or EPS of US$2.41 per share
Investor Relations Update January 25, 2018
 General Overview Investor Relations Update Accounting Changes On January 1, 2018, the company adopted two new Accounting Standard Updates: (ASUs): ASU 2014-9: Revenue from Contracts with Customers (the
OPERATING AND FINANCIAL HIGHLIGHTS. Subsequent Events
 Copa Holdings Reports Net Income of $103.8 million and EPS of $2.45 for the Third Quarter of 2017 Excluding special items, adjusted net income came in at $100.8 million, or EPS of $2.38 per share Panama
SKYWEST, INC. ANNOUNCES THIRD QUARTER 2014 RESULTS
 NEWS RELEASE For Further Information Contact: Investor Relations Telephone: (435) 634-3203 Fax: (435) 634-3205 FOR IMMEDIATE RELEASE: October 29, 2014 SKYWEST, INC. ANNOUNCES THIRD QUARTER 2014 RESULTS
Investor Relations Update October 25, 2018
 General Overview Investor Relations Update Revenue The company expects its fourth quarter total revenue per available seat mile (TRASM) to be up approximately 1.5 to 3.5 percent year-over-year. Fuel Based
ASL Marine Holdings Ltd.
 ASL Marine Holdings Ltd. SHIPBUILDING SHIPREPAIR SHIPCHARTERING Pulse of Asia 2008 - Presentation 8 th July 2008 1 Presentation Outline Company Profile 9M FY2008 Financial Review Business Review - Shipbuilding
Investor Update Issue Date: April 9, 2018
 Investor Update Issue Date: April 9, 2018 This investor update provides guidance and certain forward-looking statements about United Continental Holdings, Inc. (the Company or UAL ). The information in
CONTACT: Investor Relations Corporate Communications
 NEWS RELEASE CONTACT: Investor Relations Corporate Communications 435.634.3200 435.634.3553 Investor.relations@skywest.com corporate.communications@skywest.com SkyWest, Inc. Announces Second Quarter 2017
Investor Update September 2017 PARTNER OF CHOICE EMPLOYER OF CHOICE INVESTMENT OF CHOICE
 Investor Update September 2017 PARTNER OF CHOICE EMPLOYER OF CHOICE INVESTMENT OF CHOICE 1 Forward Looking Statements In addition to historical information, this presentation contains forward-looking statements
CONTACT: Investor Relations Corporate Communications
 NEWS RELEASE CONTACT: Investor Relations Corporate Communications 435.634.3200 435.634.3553 Investor.relations@skywest.com corporate.communications@skywest.com SkyWest, Inc. Announces Fourth Quarter 2017
OPERATING AND FINANCIAL HIGHLIGHTS
 Copa Holdings Reports Financial Results for the Fourth Quarter of 2018 Excluding special items, adjusted net profit came in at $44.0 million, or Adjusted EPS of $1.04 Panama City, Panama --- February 13,
Copa Holdings Reports Fourth Quarter and Full Year 2007 Results
 Copa Holdings Reports Fourth Quarter and Full Year 2007 Results Panama City, Panama --- February 21, 2008. Copa Holdings, S.A. (NYSE: CPA), parent company of Copa Airlines and Aero Republica, today announced
Copa Holdings Reports Net Income of $136.5 million and EPS of $3.22 for the First Quarter of 2018
 Copa Holdings Reports Net Income of $136.5 million and EPS of $3.22 for the First Quarter of 2018 May 9, 2018 PANAMA CITY, May 9, 2018 /PRNewswire/ -- Copa Holdings, S.A. (NYSE: CPA), today announced financial
Copa Holdings Reports Net Income of US$113.9 Million for the Fourth Quarter of 2013
 Copa Holdings Reports Net Income of US$113.9 Million for the Fourth Quarter of 2013 Panama City, Panama --- February 12, 2014. Copa Holdings, S.A. (NYSE: CPA), today announced financial results for the
Management Presentation. March 2016
 Management Presentation March 2016 Forward looking statements This presentation as well as oral statements made by officers or directors of Allegiant Travel Company, its advisors and affiliates (collectively
Air China Limited Interim Results. August Under IFRS
 Air China Limited 21 Interim Results Under IFRS August 21 1 Agenda 21 Interim Results Overview Business Overview Financial Overview Outlook 2 2 2 21 Interim Results 3 21 Interim Results Overview 4 4 4
Golden Ocean Group Limited Q results March 1, 2007
 Golden Ocean Group Limited Q4 2006 results March 1, 2007 PROFIT & LOSS 2005 2006 (in thousands of $) 2006 2005 Oct-Dec Oct-Dec Jan - Dec Jan - Dec Operating Revenues 37 292 91 253 Time charter revenues
SkyWest, Inc. Announces First Quarter 2018 Profit
 NEWS RELEASE CONTACT: Investor Relations Corporate Communications 435.634.3200 435.634.3553 Investor.relations@skywest.com corporate.communications@skywest.com SkyWest, Inc. Announces First Quarter 2018
Copa Holdings Reports Net Income of $57.7 million and EPS of $1.36 for the Third Quarter of 2018
 Copa Holdings Reports Net Income of $57.7 million and EPS of $1.36 for the Third Quarter of 2018 November 14, 2018 PANAMA CITY, Nov. 14, 2018 /PRNewswire/ -- Copa Holdings, S.A. (NYSE: CPA), today announced
Volaris Reports Strong First Quarter 2015: 32% Adjusted EBITDAR Margin, 9% Operating Margin
 Volaris Reports Strong First Quarter 2015: 32% Adjusted EBITDAR Margin, 9% Operating Margin Mexico City, Mexico, April 22, 2015 Volaris* (NYSE: VLRS and BMV: VOLAR), the ultra-low-cost airline serving
Earnings Report 1 st Quarter 2016 Grupo Viva Aerobus
 Earnings Report 1 st Quarter 2016 Grupo Viva Aerobus Grupo Viva Aerobus announces results for the first quarter of 2016 Mexico City, Mexico, April 29, 2016- Grupo Viva Aerobus S.A. de C.V. ( Grupo Viva
1Q 2017 Earnings Call. April 18, 2017
 1Q 2017 Earnings Call April 18, 2017 Safe Harbor Statement Certain statements included in this presentation are forward-looking and thus reflect our current expectations and beliefs with respect to certain
American Airlines Group Inc.
 American Airlines Group Inc. Deutsche Bank Leveraged Finance Conference October 4, 2017 Tom Weir Vice President, Treasurer Cautionary Statement Regarding Forward-Looking Statements and Information This
2Q 2017 Earnings Call. July 19, 2017
 2Q 2017 Earnings Call July 19, 2017 Safe Harbor Statement Certain statements included in this presentation are forward-looking and thus reflect our current expectations and beliefs with respect to certain
Management Presentation. November 2018
 Management Presentation November 2018 Forward looking statements This presentation as well as oral statements made by officers or directors of Allegiant Travel Company, its advisors and affiliates (collectively
OPERATING AND FINANCIAL HIGHLIGHTS
 Copa Holdings Reports Net Income of US$18.6 Million and EPS of US$0.42 for the Second Quarter of 2010 Excluding special items, adjusted net income came in at $26.3 million, or $0.60 per share Panama City,
JP Morgan Aviation, Transportation and Industrials Conference MARCH 15, 2017
 JP Morgan Aviation, Transportation and Industrials Conference MARCH 15, 2017 1 1 SAFE HARBOR This presentation contains forward-looking statements within the meaning of the Private Securities Litigation
2018 Annual Meeting of Stockholders
 2018 Annual Meeting of Stockholders Playing the Long Game June 13, 2018 Doug Parker Chairman and Chief Executive Officer American Airlines Group Inc. Cautionary Statement Regarding Forward-Looking Statements
MIRAMAR, Fla., April 29, 2015 (GLOBE NEWSWIRE) -- Spirit Airlines, Inc. (Nasdaq:SAVE) today reported first quarter 2015 financial results.
 -- Spirit Airlines, Inc. (Nasdaq:SAVE) today reported first quarter 2015 financial results.") April 29, 2015 Spirit Airlines Announces First Quarter 2015 Results; Adjusted Net Income Increases 87.1 Percent to $70.7 Million and Pre-Tax Margin Increases 900 Basis Points to 22.7 Percent MIRAMAR, Fla.,
April 29, 2015 Spirit Airlines Announces First Quarter 2015 Results; Adjusted Net Income Increases 87.1 Percent to $70.7 Million and Pre-Tax Margin Increases 900 Basis Points to 22.7 Percent MIRAMAR, Fla.,
Presentation on Results for the 2nd Quarter FY Idemitsu Kosan Co.,Ltd. November 14, 2018
 Presentation on Results for the 2nd Quarter FY 2018 Idemitsu Kosan Co.,Ltd. November 14, 2018 Table of Contents 1. FY 2018 2nd Quarter Financials (1) Overview (2) Segment Information 2. Reference Materials
CONTACT: Investor Relations Corporate Communications
 NEWS RELEASE CONTACT: Investor Relations Corporate Communications 435.634.3200 435.634.3553 Investor.relations@skywest.com corporate.communications@skywest.com SkyWest, Inc. Announces Second Quarter 2016
SKYWEST, INC. ANNOUNCES THIRD QUARTER 2012 RESULTS
 NEWS RELEASE For Further Information Contact: Michael J. Kraupp Chief Financial Officer and Treasurer Telephone: (435) 634-3212 Fax: (435) 634-3205 FOR IMMEDIATE RELEASE: November 7, 2012 SKYWEST, INC.
PRESS RELEASE. First Half 2017 Financial Results Higher Load Factors and traffic lead to a significant rebound in second quarter profitability
 PRESS RELEASE First Half 2017 Financial Results Higher Load Factors and traffic lead to a significant rebound in second quarter profitability Kifissia, 12 September 2017 AEGEAN announces first half 2017
THIRD QUARTER AND NINE MONTHS OF 2014 KEY RESULTS
 THIRD QUARTER AND NINE MONTHS OF 2014 KEY RESULTS In 3Q14 INTERJET total revenues were $ 3,643.4 million, representing an increase of 9.9% on revenues generated in the 3Q13. Accumulated 9M14 INTERJET total
Gerry Laderman SVP Finance, Procurement and Treasurer
 Gerry Laderman SVP Finance, Procurement and Treasurer Safe Harbor Statement Certain statements included in this release are forward-looking and thus reflect our current expectations and beliefs with respect
Corporate Presentation National Bank Transportation and Logistics Conference March 24, 2010
 Corporate Presentation National Bank Transportation and Logistics Conference March 24, 2010 Forwardlooking statement Certain information in this presentation and statements made during this presentation,
PRESS RELEASE Financial Results. Rising passenger traffic at 12.5m Exceeding 1bn in consolidated revenue
 PRESS RELEASE 2016 Financial Results Rising passenger traffic at 12.5m Exceeding 1bn in consolidated revenue Kifissia, 23 March 2017 AEGEAN reports full year 2016 results with consolidated revenue at 1,020m,
E190 REPLACEMENT & FLEET UPDATE JULY 11, 2018
 1 E190 REPLACEMENT & FLEET UPDATE JULY 11, 2018 SAFE HARBOR This presentation contains forward-looking statements within the meaning of the Private Securities Litigation Reform Act of 1995, Section 27A
Copa Holdings Reports Earnings of US$30.3 Million and EPS of US$0.70 for 3Q08
 Copa Holdings Reports Earnings of US$30.3 Million and EPS of US$0.70 for 3Q08 Panama City, Panama --- November 13, 2008. Copa Holdings, S.A. (NYSE: CPA), parent company of Copa Airlines and Aero Republica,
Spirit Airlines Reports First Quarter 2017 Results
 Spirit Airlines Reports First Quarter 2017 Results MIRAMAR, Fla., April 28, 2017 - Spirit Airlines, Inc. (NASDAQ: SAVE) today reported first quarter 2017 financial results. GAAP net income for the first
Investor Update April 23, 2009
 JetBlue Airways Investor Relations (718) 709-2202 ir@jetblue.com Investor Update April 23, 2009 This investor update provides our investor guidance for the second quarter ending June 30, 2009 and full
INVESTOR PRESENTATION. May 2015
 INVESTOR PRESENTATION May 2015 Forward-looking Statements This presentation contains forward-looking statements within the meaning of the Private Securities Litigation Reform Act of 1995 that reflect the
Corporate presentation CIBC Whistler Institutional Investor Conference January 21, 2010
 Corporate presentation CIBC Whistler Institutional Investor Conference January 21, 2010 Forwardlooking statement Certain information in this presentation and statements made during this presentation, including
Investment Highlights
 Third Quarter 2014 Investment Highlights 1 Mexican airport portfolio positioned to take full advantage of global growth. 2 Diversified business model contributing to earnings resilience. 3 Well-defined
GAMING INVESTMENT FORUM AT G2E. September 26, 2016
 GAMING INVESTMENT FORUM AT G2E September 26, 2016 Dan D Arrigo EVP & Chief Financial Officer MGM Resorts International MGM RESORTS INTERNATIONAL Strong Domestic Operating Results Las Vegas Trends Maximizing
INVESTOR PRESENTATION. Imperial Capital Global Opportunities Conference September 2015
 INVESTOR PRESENTATION Imperial Capital Global Opportunities Conference September 2015 Forward-looking Statements This presentation contains forward-looking statements within the meaning of the Private
Tiger Airways Holdings Limited FY11 Results
 Tiger Airways Holdings Limited FY11 Results May 2011 Financial Year Ended 31 March 2011 Disclaimer The information contained in this presentation (the "Information") is provided by Tiger Airways Holdings
UBS 14 th Global Emerging Markets Conference. New York, November 2016
 UBS 14 th Global Emerging Markets Conference New York, November 2016 This presentation may include forward-looking comments regarding the Company s business outlook and anticipated financial and operating
ABX. Holdings, Inc. BB&T Transportation Conference. February 2008
 ABX Holdings, Inc. BB&T Transportation Conference February 2008 1 Safe Harbor Statement Except for historical information contained herein, the matters discussed in this presentation contain forward-looking
NORWEGIAN AIR SHUTTLE ASA QUARTERLY REPORT SECOND QUARTER 2006 [This document is a translation from the original Norwegian version]
![NORWEGIAN AIR SHUTTLE ASA QUARTERLY REPORT SECOND QUARTER 2006 [This document is a translation from the original Norwegian version]](/thumbs/74/71229964.jpg "NORWEGIAN AIR SHUTTLE ASA QUARTERLY REPORT SECOND QUARTER 2006 [This document is a translation from the original Norwegian version]") NORWEGIAN AIR SHUTTLE ASA QUARTERLY REPORT SECOND QUARTER 2006 SECOND QUARTER IN BRIEF had earnings before tax of MNOK 24.8 (20.6) in the second quarter. The operating revenue increased by 44 % this quarter,
NORWEGIAN AIR SHUTTLE ASA QUARTERLY REPORT SECOND QUARTER 2006 SECOND QUARTER IN BRIEF had earnings before tax of MNOK 24.8 (20.6) in the second quarter. The operating revenue increased by 44 % this quarter,
Presentation on Results for the 2nd Quarter FY Idemitsu Kosan Co.,Ltd. November 1, 2016
 Presentation on Results for the 2nd Quarter FY 2016 Idemitsu Kosan Co.,Ltd. November 1, 2016 Table of Contents 1. 2nd Quarter FY 2016 Financials (1) Overview (2) Segment Information 2. Reference Materials
WÄRTSILÄ CORPORATION
 WÄRTSILÄ CORPORATION 26 RESULT PRESENTATION OLE JOHANSSON, PRESIDENT & CEO 6 FEBRUARY 27 1 Wärtsilä Highlights 26 Order intake +32.4% Order book +52.8% Net sales +26.6% Operating income +29.2% Profitability
Management Presentation. May 2013
 Management Presentation May 2013 Forward looking statements This presentation as well as oral statements made by officers or directors of Allegiant Travel Company, its advisors and affiliates (collectively
Corporate Presentation 5 March 2003
 Corporate Presentation 5 March 2003 Agenda Investment Highlights Business Overview Financial Highlights Competitive Strengths Business Strategies & Future Plans Growth Prospects Corporate Presentation
Copa Holdings Reports Net Income of US$51.9 Million for the Fourth Quarter of 2008 and US$152.2 Million for Full Year 2008
 Copa Holdings Reports Net Income of US$51.9 Million for the Fourth Quarter of 2008 and US$152.2 Million for Full Year 2008 Panama City, Panama --- February 19, 2009. Copa Holdings, S.A. (NYSE: CPA), parent
MGM MIRAGE Reports Record Second Quarter Revenue, Cash Flow and Net Income
 NEWS RELEASE MGM MIRAGE Reports Record Second Quarter Revenue, Cash Flow and Net Income 7/24/2001 PRNewswire LAS VEGAS MGM MIRAGE (NYSE: MGG) today reported earnings of 47 cents per diluted share for the
Managing through disruption
 28 July 2016 Third quarter results for the three months ended 30 June 2016 Managing through disruption 3 months ended Like-for-like (ii) m (unless otherwise stated) Change 30 June 2016 30 June 2015 change
AIR CANADA REPORTS 2010 THIRD QUARTER RESULTS; Operating Income improved $259 million or 381 per cent from previous year s quarter
 AIR CANADA REPORTS 2010 THIRD QUARTER RESULTS; Operating Income improved $259 million or 381 per cent from previous year s quarter MONTRÉAL, November 4, 2010 Air Canada today reported operating income
Management Presentation. November 2011
 Management Presentation November 2011 Forward looking statements This presentation as well as oral statements made by officers or directors of Allegiant Travel Company, its advisors and affiliates (collectively
10TH ANNUAL WOLFE RESEARCH GLOBAL TRANSPORTATION CONFERENCE MAY 23, 2017
 1 10TH ANNUAL WOLFE RESEARCH GLOBAL TRANSPORTATION CONFERENCE MAY 23, 2017 SAFE HARBOR This presentation contains forward-looking statements within the meaning of the Private Securities Litigation Reform
Greek Shipping : Greece s steaming force
 Greek Shipping : Greece s steaming force Dr. Nikolas P. Tsakos President & CEO 1 Tsakos Energy Navigation, Ltd A New York Stock Exchange Listed Company WORLD FLEET by the nationality of owner WORLD FLEET
Wärtsilä Corporation. Interim Report January-September 2006 Ole Johansson, President & CEO. 31 October Wärtsilä
 Wärtsilä Corporation Interim Report January-September 26 Ole Johansson, President & CEO 31 October 26 Highlights Q3/26 Strong order intake continued (+25%) Net sales +26% Operating income +29% Strong cash
American Airlines Group Inc.
 American Airlines Group Inc. Bank of America Merrill Lynch 2018 Transportation Conference Derek Kerr Chief Financial Officer Cautionary Statement Regarding Forward-Looking Statements and Information This
Air China Limited Annual Results. March Under IFRS
 Air China Limited 21 Annual Results Under IFRS March 211 Agenda Part 1 Highlights Part 2 Business Overview Part 3 Financial Overview Part 4 Outlook 2 Part 1 Highlights Steady Economic Growth; Asia Pacific
Management Presentation. August 2012
 Management Presentation August 2012 Forward looking statements This presentation as well as oral statements made by officers or directors of Allegiant Travel Company, its advisors and affiliates (collectively
FIRST QUARTER RESULTS 2017
 FIRST QUARTER RESULTS 2017 KEY RESULTS In the 1Q17 Interjet total revenues added $4,421.5 million pesos that represented an increase of 14.8% over the income generated in the 1Q16. In the 1Q17, operating
Fact Sheet for Q3 and January-September 2017 October 20, 2017
 Fact Sheet for Q3 and January-September 2017 October 20, 2017 Contents Daimler Group Stock Market Information 3 Earnings and Financial Situation 4-12 Information for Divisions Mercedes-Benz Cars 13-16
Investor Presentation
 Investor Presentation Communication financière Publication semestrielle Octobre 2016 Company at a glance : the leading port operator in Morocco 36,3 millions of tons Traffic (2016) Mad 2 567 mn USD 254
Jazz Air Income Fund presented by Joseph Randell, President and Chief Executive Officer National Bank Financial Transportation & Logistics Conference
 Jazz Air Income Fund presented by Joseph Randell, President and Chief Executive Officer National Bank Financial Transportation & Logistics Conference March 2008 Forward Looking Statement CAUTION REGARDING
2012 RESULT PRESENTATION
 212 RESULT PRESENTATION BJÖRN ROSENGREN, PRESIDENT & CEO 25 JANUARY 213 Wärtsilä Net sales back to growth with stable profitability 212 development Order intake EUR 4,94 million, +9% Net sales EUR 4,725
Fourth Quarter 2015 Financial Results
 Fourth Quarter 2015 Financial Results AerCap Holdings N.V. February 23, 2016 Disclaimer Incl. Forward Looking Statements & Safe Harbor This presentation contains certain statements, estimates and forecasts
J.P. Morgan Aviation, Transportation and Industrials Conference
 J.P. Morgan Aviation, Transportation and Industrials Conference March 3, 08 Scott Kirby President Safe Harbor Statement Certain statements included in this presentation are forward-looking and thus reflect
DFDS A/S H Analyst meeting 30 August 2006
 DFDS A/S H1 2006 Analyst meeting 30 August 2006 DFDS A/S Contents The half-year in brief Strategy on track DFDS Seaways DFDS Tor Line Half-year accounts & profit forecast 2006 DFDS A/S H1 2006 in brief
Cebu Air, Inc. 2Q2014 Results of Operation
 Cebu Air, Inc. 2Q2014 Results of Operation 1 Disclaimer This information provided in this presentation is provided only for your reference. Such information has not been independently verified and, as
Adjusted net income of $115 million versus an adjusted net loss of $7 million in the second quarter of 2012, an improvement of $122 million
 Air Canada Reports Record Second Quarter 2013 Results Highest Adjusted Net Income, Operating Income and EBITDAR Results for Second Quarter in Air Canada s History Adjusted net income of $115 million versus
NORWEGIAN AIR SHUTTLE ASA QUARTERLY REPORT FIRST QUARTER 2004 [This document is a translation from the original Norwegian version]
![NORWEGIAN AIR SHUTTLE ASA QUARTERLY REPORT FIRST QUARTER 2004 [This document is a translation from the original Norwegian version]](/thumbs/87/95085804.jpg "NORWEGIAN AIR SHUTTLE ASA QUARTERLY REPORT FIRST QUARTER 2004 [This document is a translation from the original Norwegian version]") NORWEGIAN AIR SHUTTLE ASA QUARTERLY REPORT 2004 IN BRIEF At the start of 2003, Norwegian has become a pure low-fare airline. The Fokker F-50 operations have been terminated, and during the quarter the
NORWEGIAN AIR SHUTTLE ASA QUARTERLY REPORT 2004 IN BRIEF At the start of 2003, Norwegian has become a pure low-fare airline. The Fokker F-50 operations have been terminated, and during the quarter the
ABX HOLDINGS, INC. Shareholders Meeting. May 13, 2008
 Shareholders Meeting May 13, 2008 1 1 1 Safe Harbor Statement Except for historical information contained herein, the matters discussed in this presentation contain forward-looking statements that involve
44th Consecutive Profitable Quarter Fourth Quarter Fully Diluted Earnings per Share of $0.94 Full Year Fully Diluted Earnings per Share of $4.
 Allegiant Travel Company Fourth Quarter and Full Year 2013 Financial Results January 29, 2014 1:00 PM PT 44th Consecutive Profitable Quarter Fourth Quarter Fully Diluted Earnings per Share of $0.94 Full
Amadeus Jan-Jun 2018 Results
 2018 Amadeus IT Holding and its affiliates and subsidiaries Amadeus Jan-Jun 2018 Results July 27, 2018 Disclaimer This presentation may contain certain statements which are not purely historical facts,
HK GAAP RESULTS RELEASE 25 February 2008 STAR CRUISES GROUP ANNOUNCES FOURTH QUARTER AND FULL YEAR RESULTS FOR 2007
 HK GAAP RESULTS RELEASE 25 February 2008 FOR IMMEDIATE RELEASE INTERNATIONAL STAR CRUISES GROUP ANNOUNCES FOURTH QUARTER AND FULL YEAR RESULTS FOR 2007 Key points for the quarter in comparison with 4Q
HK GAAP RESULTS RELEASE 12 August 2008 STAR CRUISES GROUP ANNOUNCES FIRST HALF RESULTS FOR 2008
 HK GAAP RESULTS RELEASE 12 August 2008 FOR IMMEDIATE RELEASE INTERNATIONAL STAR CRUISES GROUP ANNOUNCES FIRST HALF RESULTS FOR 2008 The below commentary is prepared based on the comparison of the results
MARINE CIRCULAR MC-1/2013/1
 Singapore Operations Office: 10 Anson Road #25-16, International Plaza, Singapore 079903 Tel: (65) 6224 2345 Fax: (65) 6227 2345 Email: info@tvship.com Website: www.tvship.com 01/2019 MARINE CIRCULAR MC-1/2013/1
Forward-looking Statements
 March 23, 2011 Forward-looking Statements This presentation contains certain forward-looking statements with respect to the Corporation. These forward-looking statements, by their nature, necessarily involve
Spirit Airlines Reports First Quarter 2018 Results
 Spirit Airlines Reports First Quarter 2018 Results MIRAMAR, Fla., April 26, 2018 - Spirit Airlines, Inc. (NYSE: SAVE) today reported first quarter 2018 financial results. For the first quarter 2018, Spirit
Management Presentation. September 2011
 Management Presentation September 2011 Forward looking statements This presentation as well as oral statements made by officers or directors of Allegiant Travel Company, its advisors and affiliates (collectively
FIRST QUARTER 2017 RESULTS. 4 May 2017
 FIRST QUARTER 2017 RESULTS 4 May 2017 A resilient start of the year, traffic up 4.2% 20.9 million passengers carried, up 5.2%, traffic (RPK) up 4.2%, capacity (ASK) up 3.3% and load factor up 0.7pts Confirmation
01 Amadeus at a glance
 01 Amadeus at a glance 7 Amadeus Annual Report 2011 1.1 Company s origins and development Most people associate the birth of electronic commerce distribution with the arrival of the internet. In fact,
Presentasjon av Farstad Shipping ASA
 Rederiforbundet 01.03.16 Presentasjon av Farstad Shipping ASA Karl-Johan Bakken - CEO Torstein L. Stavseng - CFO Farstad Shipping ASA Looking ahead from 2015 Dressing the Company for the Future Strategically
1Q 2018 Earnings Call. April 18, 2018
 1Q 2018 Earnings Call April 18, 2018 Safe Harbor Statement Certain statements included in this presentation are forward-looking and thus reflect our current expectations and beliefs with respect to certain
Wärtsilä Corporation. Interim Report January-March 2005 Ole Johansson, President & CEO. 4 May Wärtsilä
 Wärtsilä Corporation Interim Report January-March 2005 Ole Johansson, President & CEO 4 May 2005 Highlights of the first quarter Net sales up by 9.4% to EUR 570.7 million (521.7) Operating income improved
Grupo Viva Aerobus announces results for the third quarter of 2016
 Earnings Earnings Report Report 3 rd rd Quarter Quarter 2016 2016 Grupo Grupo Viva Viva Aerobus Aerobus Grupo Viva Aerobus announces results for the third quarter of 2016 Mexico City, Mexico, October 27,