Investor Presentation
|
|
|
- Colin Hardy
- 5 years ago
- Views:
Transcription

1 Investor Presentation March, 2018
2 Disclaimer This material has been prepared exclusively for informational and promotional purposes. Its intention is to inform about the business strategy of Tatry mountain resorts, a.s., with its registered office at Demänovská Dolina 72, Liptovský Mikuláš , Identifications Number: , registered in the Commercial Registry of District Court of Žilina, Section: Sa, Insertion No. 62/L (hereinafter referred to as TMR ). TMR s shares are listed on the parallel market of the Bratislava Stock Exchange and on the main markets of the Prague Stock Exchange and the Warsaw Stock Exchange. The company s share capital consists of bearer shares booked on the bearer with a nominal value of 7 per share. TMR has been allocated ISIN SK Information contained in this material is based on historical data and may contain forecasts of future performance. Predictions are based on rational expectations supported by objective data. Predictions are not reliable indicators of future performance and they are not binding. TMR is not liable for any of the predictions contained in this material. Future figures of TMR can differ from predictions given in this presentation. This material is owned exclusively by TMR. Any distribution, duplication, publishing, copy or record of this information, or any part of it contained in this material is forbidden without prior approval oftmr. Any distribution of this presentation or any part of it beyond the territory of the Slovak Republic can be either restricted, or prohibited by law of the third state. 2

3 3 We are here to revolutionize tourism in Central Europe!


 and EBITDA (cum.")
4 TMR at a Glance Leading and the only Alpine style mountain tourism services provider in the CEE region Natural monopoly no mountains comparable to the Tatras in the region Increasing quality with infrastructure investments of EUR 300 million during the last 11 years Significant (double digit) increases in revenues (cum. 111%) and EBITDA (cum. 122%) in the last 5 years as a result of investments, acquisitions, and strong pro-customer orientation 4

5 TMR s Strategy Who We Are and What We Do 5


6 Our Potential Long History of Tourism in the Tatras Cultural and Natural Heritage 6


7 Challenges Mountain Resorts in


8 Who We Are Today 8


 Legendia -")


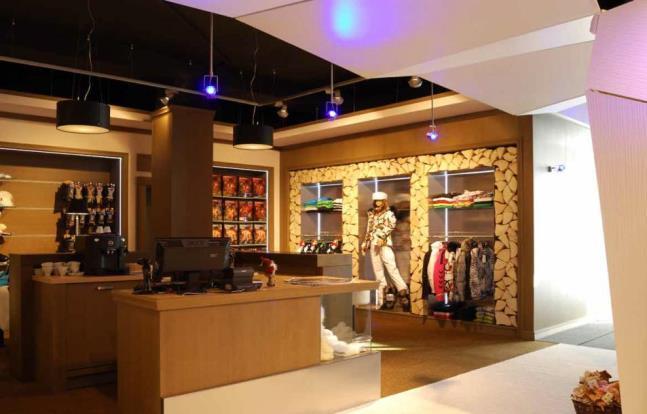
9 Business Model Overview Revenues by Segments* 6,1% 23% I. MOUNTAIN & LEISURE Segment (M&L) Mountain Resorts 4 resorts in the High and Low Tatras (SK), Poland (97%), and Czechia Leisure Parks Aquapark Tatralandia (SK) Legendia - Silesian Amusement Park (75%, PL) Dining over 40 dining facilities on and off the slopes and in the leisure parks Sports Stores & Services Tatry Motion, Szczyrk Motion Over 30 stores, ski schools, sports gear rentals 71% M&L Segment Breakdown 20% 18% II. HOTELS Segment 12 owned and/or managed hotels Over 800 rooms and 2,000 beds Luxurious wellness spa facilities Ongoing hotel upgrades, additions III. REAL ESTATE Segment 4 hotels leased to third parties Sale of recreational real estate Holiday Village Tatralandia, Chalets Jasná de Luxe Center, Hotel Pošta 9% 53% Mountain Resorts Leisure Parks Dining Sport Services & Stores 9 M&L Hotels Real Estate * FY 2016/17


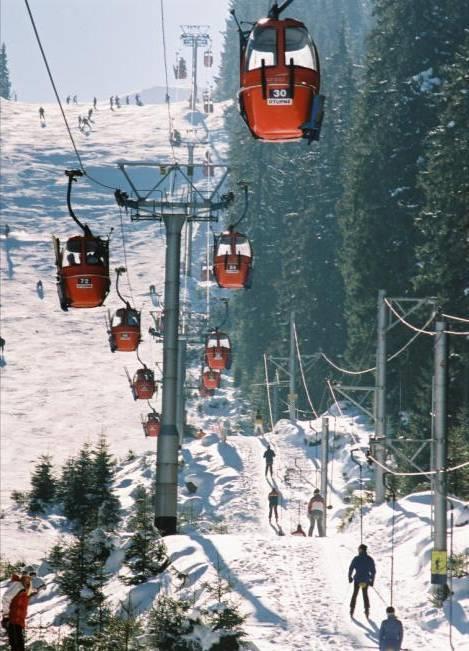
10 Mountain Resorts Vysoké Tatry (The High Tatras, SK) Tatranská Lomnica Starý Smokovec Štrbské Pleso 24 km of ski trails 20 cableways and lifts Max. transportation capacity of more than 21,385 persons/hour 20 km of ski trails with snowmaking Summit elevation: 2,625 m a.s.l. Base elevation: 805 m a.s.l. Vertical drop: 1,820 m 9 dining facilities Tatry Motion stores & services Jasná Nízke Tatry (The Low Tatras, SK) Chopok North Chopok South 50 km of ski trails 27 cableways and lifts Max. transportation capacity of 31,784 persons/hour 35.5 km of ski trails with snowmaking Summit elevation: 2,004 m a.s.l. Base elevation: 880 m a.s.l. Vertical drop:1,124 m 13 dining facilities Tatry Motion stores & services


11 Mountain Resorts Szczyrk mountain resort (Beskids, PL) Ještěd (CZ) 97% interest Leased for10+ years Completed investments of EUR 35m Planned investments of more than CZK 600m 23 km of ski trails 9.2 km of ski trails 13 cableways and lifts 3 cableways, 5 lifts Max. transportation capacity of 22,000 persons/hour Max. transportation capacity of 11,095 persons/ hour 15 km of ski trails with snowmaking 7.8 km of ski trails with snowmaking Summit elevation: 1,211 m a.s.l. Summit elevation: 944 m a.s.l. Base elevation: 620 m a.s.l. Base elevation: 541 m a.s.l. Vertical drop: 591 m Vertical drop: 403 m Szczyrk Motion stores & services
 and 300 other attractions Tropical Paradise, Wellness Paradise, Funpark Tatralandia, Hurricane Factory,")

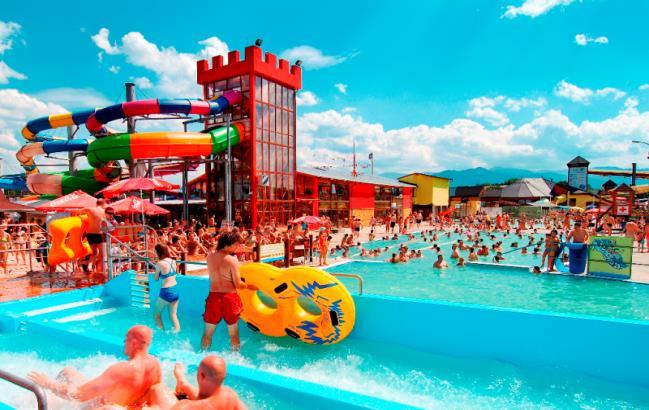
12 Leisure Parks Aquapark Tatralandia (Liptov, SK) 14 (10 year-around) swimming pools with thermal, sea, and clear water 21 steam, water and masage saunas, baths and procedures 26 toboggans and waterslides (6 year-round) and 300 other attractions Tropical Paradise, Wellness Paradise, Funpark Tatralandia, Hurricane Factory, Tatrapolis Legendia - Silesian Amusement Park/ Śląskie Wesołe Miasteczko (75%, PL) Location: Park Śląski (Silesian Park) at Chorzów, PL Completed investments of EUR 26m Area: 26 ha 50 attractions The largest and oldest park in Poland A 40m high roller coaster Lech Coaster Lodging HolidayVillage Tatralandia 7 dining facilities 12


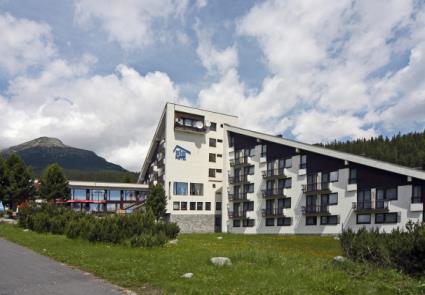
13 Hotels Hotels - The High Tatras Grandhotel****, Starý Smokovec Grandhotel Praha****, Tatranská Lomnica Hotel FIS***, Štrbské pleso Mountain hotel Hrebienok Hotel Kukučka**** (managed) Hotels The Low Tatras Wellness Hotel Grand Jasná**** Chalets Jasná De Luxe**** Tri Studničky Hotel**** Holiday Village Tatralandia Hotel Srdiečko** Hotel Rotunda Hotel Pošta 13


14 Real Estate Lease of hotels and lodging facilities to third parties Hotel Liptov Hotel Ski & Fun Záhradky Sale of recreational real estate Holiday Village Tatralandia Chalets Jasná de Luxe Center construction, sale, operation Kosodrevina Lodge Otupné Hotel Pošta construction, sale, operation 14

: Slovaks (massive marketing campaigns) Polish (massive marketing campaigns) Czech (still benefiting from the common past;")
15 Our Market Potential Natural monopoly position (no other similar places in the region to provide the Alpine resorts feel except for the Tatras) Long history of resorts in PL, CZ No competition within 1000 km east of TMR resorts 64 million people living in key target countries Long tradition of visitors from CEE Easy access by plane 7% TMR Mountain Resorts Visitors in SK During Winter 2016/17 3% 8% 14% 68% Slovakia Poland Czech Rep. Hungary Other 15 More affordable than Alpine resorts Target Groups (through): Slovaks (massive marketing campaigns) Polish (massive marketing campaigns) Czech (still benefiting from the common past; no language barrier) Russian-speaking (driving distance unlike Alpine resorts) New markets (Baltic & UK via new airline connections) Segmentation Affluent clientele Luxury and prestige of the hotels in the High Tatras Mainstream Jasná, Nízke Tatry tailored to the young, families, and sports enthusiasts
16 Thousands Great Potential in Regional Mountain Tourism Skiers by Country % % % % % % % % 0 Slovakia Poland Czech Republic Ukraine Russia Austria Switzerland Germany 0% No. of National Skiers Skiers as % of Population 16 Source: Vanat, Laurent International report on mountain tourism

17 The Tatras Client Target Area in SK, Neighbors, and East Ještěd 17

18 Our Strategy Based on 3 Pillars Increasing quality with investments Strategic acquisitions and expansion of operation in CEE Constant operations & services enhancement EUR 295 million over 11 years New modern cableways Renovating hotels Expanding resorts Capitalizing on completed investments Modernization of Szczyrk and Legendia 18 Aquapark Tatralandia 2011 Špindlerův Mlýn ski resort (9.5%, CZ) Korona Ziemi (7%, PL) Szczyrk ski resort, PL 2014 Legendia - Silesian Amusement Park (75%, PL) 2015 Planned acquisition of an alpine resort Enhancing customer experience through synergies Focus on affluent clientele Trendsetter in the region Quality management GOPASS loyalty program and e-shop Innovative technologies
19 thousands thousands Our Assets Grow through Capital Investments Total of EUR 300m invested into development of our resorts and hotels in the last 11 years 2013 ends Investment phase I The New Era of the Tatras EUR 190m invested into growth of the Tatra resorts The New Era of Szczyrk EUR 35m invested in phase I till the end of 2017, another EUR 30m planned The New Era of Legendia EUR 30m completed investments CZK 600m (EUR 24m) planned investments into the development of the Ještěd resort Fixed Assets CAPEX vs Revenues 2012/ / / / /17 Revenues Capex 19


20 EUR 300 million CAPEX in last 11 years Funitel Jasná Nízke Tatry Tropical Paradise Tatralandia seat Kosodrevina, Chopok, Jasná Nízke Tatry Tropical Paradise Tatralandia


21 EUR 300 million CAPEX in last 11 years Surf Wave, Aquapark Tatralandia Chalets Jasná de Luxe**** Rotunda, Jasná 15-seat gondola, Vysoké Tatry 21


22 Quality in Business and Marketing - CRM Customer Card Ski Pass Direct Marketing Sales Channel A customer card offering customized products: Accommodation - Ski Pass - Dining - Aquapark - Rental - Ski School A personalized online ski pass / aqua pass at more favorable rates without queuing at cash desks Registration takes just 2 minutes For purchase bonus points loyalty program A direct marketing tool An efficient sales channel 27% of all skier days sold in Jasná and VT in 2015/16 Mobile app GOPASS 22

23 Operational Overview What We Have Achieved and How 23

24 What Drives Our Revenues KPIs Revenue Growth 24
25 Occupancy (%), Price (EUR) Thousands Stable Growth in Annual KPIs, Increased Visit Rate 16/17 Also Thanks to Strong Winter Season Visit Rate in Mountains and Leisure* 2012/ / / / / Average Revenues per Visitor** 2012/ / / / /17 Mountain Resorts Leisure Parks Leisure Parks Mountain Resorts Dining Sports Services & Stores KPIs of Hotel Portfolio / / / / /17 Occupancy (%) ADR (EUR) 25 * Silesian Amusement Park was acquired on 01/05/2015 ** per given period fiscal year
26 thousands avg. price in resorts Jasná and Vysoké Tatry Extensive CAPEX Justify Increasing Ski Pass Prices Annual increase of ticket prices is justified with extensive CAPEX invested into development of TMR resorts and hotels Mountain Resorts 5-year cumulative growth: Operating revenues +94.7% Average ticket price +28.1% Mountain Resorts 5-year CAGR: Operating revenues* +14.3% Average ticket price +5.1% Pricing vs. Revenues of Mountain Resorts 2012/ / / / /17 Revenues 1-day Ticket Price in Main Season
 Gastein, 86 Livigno, 115 Ischgl, 238 45 40 35 30 25 20 Stubaier Gletcher, 62 PKL")

27 1-day Ticket Price ( ) Strategic Product Position, Closing in on Alpine Resorts 65 Market Positioning in Europe in Winter 2016/ Trails (km) Gastein, 86 Livigno, 115 Ischgl, Stubaier Gletcher, 62 PKL / Kasprowy Wierch, 16 Jasná - TMR, 50 Vysoké Tatry - TMR, 24 Špindleruv Mlýn, 25 Pec pod Sněžkou, 15 Białka Tatrzańska, 17 Szczyrk, 25 Val Gardena, ,000 20,000 40,000 60,000 80, , ,000 Capacity ('000 persons/hour) 27

28 Financial Overview How We Look Like in Numbers 28
29 thousands Growth Results Confirm Our Strategy Key Operating Results Plan 40% % 32,9% % % % % / / / / /17p 2016/17 Revenues EBITDA EBITDA Margin 10% 29
30 thousands thousands Operating Results by Segments Revenues EBITDA CAGR +16% CAGR +17% / / / / / / / / / /17 Mountain Resorts Dining Hotels Leisure Parks Sports Services & Stores Real Estate Mountain Resorts Dining Hotels Leisure Parks Sports Services & Stores Real Estate 30
 ratio 71.2% Bonds issued EUR 184.")

31 thousands Financial Position 31 Liquidity Cash & cash equivalents EUR 9.6m Assets Total assets EUR 438.0m Fixed assets EUR 333.7m Level of Debt Total debt EUR 279.3m Total debt-to-capital (D/C) ratio 71.2% Bonds issued EUR 184.8m used to finance share capital decrease Bank debt EUR 94.5m Equity Total equity EUR 113.1m Share capital EUR 47.0m Assets Breakdown as of 31/10/2017 Current Assets 19,4% Other Non- Current Assets 4,4% Financial Position Fixed Assets 76,2% Total Assets Fixed Assets Debt D/C 72% 71% 70% 69% 68% 67% 66%

32 Overall Financial and Market Performance TMR Stock Performance at BSSE Key Cons. Data in EUR FR 2016/ 17 FR 2015/ 16 FY 2014/ 15 FY 2013/ 14 FY 2012/ 13 Revenues 95.9m 81.2m 70.9m 56.3m 54.3m EBITDA 31.5m 25.1m 24.4m 18.4m 18.6m Net Profit 7.0m 2.7m m 6.6m EBITDA margin 32.9% 30.9% 34.4% 32.7% 34.2% EPS D/E ratio 246.9% 216.8% 215.3% 223.0% 210.0% TMR Market Overview at BSSE*: One-year max.: EUR One-year min.: EUR One-year return: 11.9% Dividend yield: N/A 32 * As of 31/10/2017

33 Outlook & Future Growth Where We Go from Here 33


34 Strategic Goals for Medium Term Investments in development of the Czech and Polish operations: Silesian Amusement Park EUR Szczyrkowski ošrodek narciarski EUR 30m in phase II Ještěd CZK600m Increasing quality with investments Acquisitions and expansion of operations in the region Operation/ acquisition of mountain resorts and leisure parks in Czechia and Austria Awakening of real estate market in the Tatra region Chalets Jasná de Luxe Holiday Village Tatralandia Jasná Center Growing potential in real estate projects Focus on quality improvement in our resorts Customer loyalty program GOPASS Client Relationship Management Add ancillary services Hotel upgrades Hotel capacity addition (Jasná)

35 Appendices Shareholder Structure Key Operating Results Consolidated Income Statement Financial Position 35


36 Shareholder Structure TMR is listed on 3 stock exchanges Bratislava, Prague, Warsaw 9,5% 8,8% 23,5% 9,9% 13,4% 15,4% 19,5% Retail investors <5% C.I. CAPITAL INDUSTRIES LIMITED FOREST HILL COMPANY, s.r.o Nikroc Investments Limited KEY DEE LIMITED TINSEL ENTERPISES LIMITED RMSM1 LIMITED * As of 31/10/2017
37 Key Annual Operating Results by Segments Key Operating Results Revenues EBITDA in ' / /16 Change yoy (%) 2016/ /16 Change yoy (%) Mountains & Leisure ,1% ,1% Mountain Resorts ,1% ,2% Leisure Parks ,5% ,5% Dining ,5% ,9% Sports Services & Stores ,2% ,3% Hotels ,8% ,4% Real Estate ,5% ,1% Total ,1% ,5% 37
38 Consolidated Income Statement Selected Consolidated Results (IFRS) For the Year Ended October 31 in ' / /16 Sales Other Operating Revenues Total Revenues Cost of Sales Personnel and Operating Costs Other Gain/ Loss EBITDA EBITDA Margin 32,9% 30,9% Depreciation & Amortization EBIT Interest Income Interest Expense Income from Financial Instruments, net Pre-tax Income Income Tax Net Profit Total Comprehensive Income EPS ( ) 1,099 0,456 38
39 Financial Position October 31 Financial Position in ' / /16 Total Assets Non-current Assets Fixed Assets Other Non-current Assets Current Assets Liquid Assets Equity Liabilities Non-current Liabilities Current Liabilities Total Debt
Investor Presentation
 Investor Presentation March, 2017 Disclaimer This material has been prepared exclusively for informational and promotional purposes. Its intention is to inform about the business strategy of Tatry mountain
Investor Presentation
 Investor Presentation July, 2017 Disclaimer This material has been prepared exclusively for informational and promotional purposes. Its intention is to inform about the business strategy of Tatry mountain
TMR posts an 18.1% revenue growth for 2016/17
 Tatry mountain resorts, a.s. TMR posts an 18.1% revenue growth for 2016/17 LIPTOVSKÝ MIKULÁŠ (28 February 2018) Tatry mountain resorts, a.s. (TMR) reported an 18.1% revenue growth with the total of EUR
Presentation of preliminary financial results of fiscal year 2010/2011
 Presentation of preliminary financial results of fiscal year 2010/2011 Period from November 1, 2010 to October 31, 2011 Published on January 24, 2012 Historically the most successful year 2010/2011 Consolidated
Annual General Meeting of TMR 28 April 2017 Grandhotel Praha**** Tatranská Lomnica
 Annual General Meeting of TMR 28 April 2017 Grandhotel Praha**** Tatranská Lomnica 1 Performance Overview for FY 2015/16 A record-high visitation in the summer A 14.5% revenue growth and a 2.9% EBITDA
TATRY MOUNTAIN RESORTS, A.S.
 TATRY MOUNTAIN RESORTS, A.S. NINE-MONTH AND THIRD-QUARTER 2013/14 INTERIM REPORT (PERIOD FROM 1-11-2013 TO 31-7-2014) PRELIMINARY STATEMENT ON RESULTS OF THE SECOND HALF OF FISCAL YEAR 2013/14 HIGHLIGHTS
BOHUŠ HLAVATÝ JOZEF HODEK. TMR General Meeting 27/04/2013, Holiday Village Tatralandia
 BOHUŠ HLAVATÝ JOZEF HODEK TMR General Meeting 27/04/2013, Holiday Village Tatralandia WHO WE ARE TODAY? 2 TOP Slovak mountain resorts year-around aquapark 12 hotels 2000 beds 40 restaurants; 2 ski schools,
Summary of Results for the First Three Quarters FY2015/3
 Summary of Results for the First Three Quarters FY2015/3 February 10, 2015 Tokyu Corporation (9005) http://www.tokyu.co.jp/ Contents Ⅰ.Executive Summary 2 Ⅱ.Conditions in Each Business 5 Ⅲ.Details of Financial
Summary of Results for the First Quarter of FY2015/3
 Summary of for the First Quarter of FY2015/3 August 8, 2014 Tokyu Corporation (9005) http://www.tokyu.co.jp/ Contents Ⅰ.Executive Summary 2 Ⅱ.Conditions in Each Business 4 Ⅲ.Details of Financial for the
TMR shareholders club 2014/2015
 TMR shareholders club 2014/2015 Any shareholder who has a minimum of 25 TMR shares purchased via the Stock Exchange in Bratislava, Prague or Warsaw as of 31/10/2014 is entitled to use benefits in accordance
Summary o f Results for the First Half of FY2018
 Summary o f Results for the First Half of FY2018 November 9, 2018 (9005) https://www.tokyu.co.jp/ Contents Ⅰ.Executive Summary 2 Ⅱ.Conditions in Each Business 6 Ⅲ.Details of Financial Results for the 13
ERW. 022/ ACC003/ th February Subject: Management's Discussion and Analysis period ending 31 st December 2012
 ERW. 022/ ACC003/56 26 th February 2013 Subject: Management's Discussion and Analysis period ending 31 st December 2012 Attention: The President, The Stock Exchange of Thailand Dear Sir, The Erawan Group
PRESS RELEASE Financial Results. Rising passenger traffic at 12.5m Exceeding 1bn in consolidated revenue
 PRESS RELEASE 2016 Financial Results Rising passenger traffic at 12.5m Exceeding 1bn in consolidated revenue Kifissia, 23 March 2017 AEGEAN reports full year 2016 results with consolidated revenue at 1,020m,
PRESS RELEASE. First Half 2017 Financial Results Higher Load Factors and traffic lead to a significant rebound in second quarter profitability
 PRESS RELEASE First Half 2017 Financial Results Higher Load Factors and traffic lead to a significant rebound in second quarter profitability Kifissia, 12 September 2017 AEGEAN announces first half 2017
IMPORTANT NOTES TO THE UNAUDITED CONSOLIDATED FINANCIAL STATEMENTS OF THE KRKA GROUP FOR 2006
 Pursuant to the Rules of the Ljubljana Stock Exchange and the Securities Market Act (ZTVP-1, Official Gazette of the Republic of Slovenia, no 56/99), Krka, d.d., Novo mesto, Šmarješka cesta 6, 8501 Novo
NORWAY SWEDEN FINLAND RUSSIA DENMARK NETHERLANDS GERMANY POLAND BELGIUM CZECH REPUBLIC AUSTRIA HUNGARY SWITZERLAND CHINA MEDITERRANEAN SEA
 THE GROUP AT A GLANCE N O RTH SEA IRELAND GROUP TOUR OPER ATOR UNITED KINGDOM Revenue* Gross margin %** Underlying EBIT** Underlying EBIT %** 11M >7;+& 57*** 2017 2016 7,122m 15.4% 250m 3.5% 6,646m 16.9%
Investor Presentation
 TUI Group Investor Presentation WestLB Deutschland Conference 2010 17 November 2010 TUI AG Investor Relations Seite 1 Future-related related statements This presentation contains a number of statements
ERW. 083/ ACC012/ th November Subject: Management's Discussion and Analysis period ending 30 th September 2012
 ERW. 083/ ACC012/55 12 th November 2012 Subject: Management's Discussion and Analysis period ending 30 th September 2012 Attention: The President, The Stock Exchange of Thailand Dear Sir, The Erawan Group
Copa Holdings Reports Record Earnings of US$41.8 Million for 4Q06 and US$134.2 Million for Full Year 2006
 Copa Holdings Reports Record Earnings of US$41.8 Million for 4Q06 and US$134.2 Million for Full Year 2006 Panama City, Panama --- March 7, 2007. Copa Holdings, S.A. (NYSE: CPA), parent company of Copa
1Q13 R sults esentation
 1Q13 Results Presentation 14 May 2013 Disclaimer The presentation is dated the day it is given. The delivery of this presentation shall not, under any circumstances, create any implication that there has
Investment Highlights
 Third Quarter 2014 Investment Highlights 1 Mexican airport portfolio positioned to take full advantage of global growth. 2 Diversified business model contributing to earnings resilience. 3 Well-defined
Preliminary Figures FY 2016
 February 14, 2017 Preliminary Figures FY 2016 Capital Markets Day 2017 Tom Blades (CEO) Disclaimer This presentation has been produced for support of oral information purposes only and contains forwardlooking
TUI GROUP INVESTOR PRESENTATION
 TUI GROUP INVESTOR PRESENTATION German Investment Conference UniCredit / Kepler Munich, 26-27 September 2012 Future-related statements This presentation contains a number of statements related to the future
Forward-Looking Statements Statements in this presentation that are not historical facts are "forward-looking" statements and "safe harbor
 2017 Annual Meeting of Shareholders Presentation May 2017 Forward-Looking Statements Statements in this presentation that are not historical facts are "forward-looking" statements and "safe harbor statements"
Q4 & FULL YEAR FY15 RESULTS UPDATE MAY 2015
 Q4 & FULL YEAR FY15 RESULTS UPDATE MAY 2015 DISCUSSION SUMMARY Q4 & FY15 RESULTS HIGHLIGHTS OUR PORTFOLIO UPDATE AMUSEMENT PARK, BANGALORE RESORT, BANGALORE AMUSEMENT PARK, KOCHI AMUSEMENT PARK, HYDERABAD
Analyst Presentation Schiphol Group 2006 Interim Financial Results
 Analyst Presentation Schiphol Group 2006 Interim Financial Results 24 August 2006 Interim Results Disclaimer This release may contain certain forward-looking statements with respect to the financial condition,
TUI Group Investor Presentation
 TUI Group Investor Presentation Commerzbank, German Investment Seminar New York, 11 12 January 2010 TUI AG Investor Relations Seite 1 Agenda I. Group overview II. Financials & Financing update III. Outlook
FIRST QUARTER
 FIRST QUARTER 2007 1 WELCOME TO REZIDOR one of the fastest growing hotel companies in the world 300 250 200 150 100 FAST TRACK GROWTH FRESH & DYNAMIC MULTI-BRAND PORTFOLIO BRAND SEGMENT HOTELS ROOMS Upscale
FOURTH QUARTER RESULTS 2017
 FOURTH QUARTER RESULTS 2017 KEY RESULTS In the 4Q17 Interjet total revenues added $5,824.8 million pesos that represented an increase of 10.8% over the revenue generated in the 4Q16. In the 4Q17, operating
FIRST QUARTER RESULTS 2017
 FIRST QUARTER RESULTS 2017 KEY RESULTS In the 1Q17 Interjet total revenues added $4,421.5 million pesos that represented an increase of 14.8% over the income generated in the 1Q16. In the 1Q17, operating
AGENDA. Group overview. Financial highlights. Operational highlights. Expansion plans
 1 AGENDA Group overview Financial highlights Operational highlights Expansion plans 2 3 CURRENT FOOTPRINT Kenya 12 stores 2 DCs Tanzania 2 stores Number of stores 31-Dec-16 31-Dec-17 Increase: Dec-16 to
Company Presentation Flughafen Wien AG
 Company Presentation Flughafen Wien AG March, 2007 1 2 Content 1. Highlights 2006 2. Financial Results 2006 and Investments 3. Results by Segment 4. Traffic Results 2006 5. Strategy 6. International Projects
HOPEWELL HOLDINGS LIMITED ANNOUNCES FY 2018/19 INTERIM RESULTS
 Press Release HOPEWELL HOLDINGS LIMITED ANNOUNCES FY 2018/19 INTERIM RESULTS Highlights 1H FY19 (1 April to 30 September 2018) First financial year after the change of financial year end date from 30 June
Finnair Group Interim Report 1 January 30 September 2008
 Finnair Group Interim Report 1 January 30 September 2008 1 31/10/2008 Presentation name / Author Airline industry at a historical turning point Expensive fuel price in the beginning of 2008 has dramatical
TUI GROUP Investor Presentation
 TUI GROUP Investor Presentation Friedrich Joussen (CEO) UniCredit / KeplerCheuvreux German Corporate Conference Frankfurt, 21-22 January 2014 Seite 1 Future-related statements This presentation contains
Investor update presentation. November 2016
 Investor update presentation November 2016 Content Update on Q3 2016 financial performance 3-8 Recap on ATG Evolution 9-10 Update on hospitality strategic business unit 11-14 Update on online travel and
Air China Limited 2014 Annual Results Under IFRS
 Air China Limited 2014 Annual Results Under IFRS March 2015 Agenda Part 1 Results Highlights Part 2 Business Overview Part 3 Financial Overview Part 4 Outlook Part 1 Results Highlights Gradual Global Economic
Crown Resorts Limited
 Crown Resorts Limited 2015 Full Year Results Presentation 13 August 2015 1 Crown Resorts Limited Results Overview Crown Resorts Limited (Crown) performance: Overall, the results for Crown s portfolio of
Flughafen Wien Group Maintains Upward Trend: Passenger Growth and Strong Earnings Improvement in the First Nine Months of 2016
 Flughafen Wien Group Maintains Upward Trend: Passenger Growth and Strong Earnings Improvement in the First Nine Months of 2016 REVENUE increase to 545.4 million (+10.2%), EBITDA rise to 306.5 million (+13.1%
Finnair Q Result
 Finnair Q1 2015 Result 7 May 2015 CEO Pekka Vauramo, Interim CFO Mika Stirkkinen 1 Turbulent market environment The weakness of the Finnish economy continued to be reflected in the demand in the first
2017 results: REVENUE up to million (+1.6%), NET PROFIT FOR THE PERIOD 1 shows significant increase to million (+12.
, NET PROFIT FOR THE PERIOD 1 shows significant increase to million (+12.") Business Results in 2017: Significant Rise in Profits of the Flughafen Wien Group Management Board Announces Substantial Upward Revision of Earnings Guidance and Traffic Figures for 2018 2017 results:
Business Results in 2017: Significant Rise in Profits of the Flughafen Wien Group Management Board Announces Substantial Upward Revision of Earnings Guidance and Traffic Figures for 2018 2017 results:
Flughafen Wien AG results in Q1 2015: Increased revenue and earnings despite passenger decline
 Flughafen Wien AG results in Q1 2015: Increased revenue and earnings despite passenger decline REVENUE up slightly to 140.7 million (+0.9%), EBITDA improved to 54.0 million (+1.4%) and EBIT rose to 21.9
THIRD QUARTER RESULTS 2017
 THIRD QUARTER RESULTS 2017 KEY RESULTS In the 3Q17 Interjet total revenues added $5,835.1 million pesos that represented an increase of 22.0% over the revenue generated in the 3Q16. In the 3Q17, operating
Fourth Quarter and Full Year 2009
 Investor and analyst meeting: Fourth Quarter and Full Year 29 25 th February 21 2 The views expressed here contain some information derived from publicly available sources that have not been independently
Lead pic. Report on the first quarter of 2018
 Lead pic. Report on the first quarter of 2018! Operational Highlights Purchase and sale of properties in Budapest - Acquisition of B52 Office - Sale of Ülloi land plot Early redemption of convertible bonds
GATWICK AIRPORT JOINS VINCI AIRPORTS December 2018
 GATWICK AIRPORT JOINS VINCI AIRPORTS December 2018 Asset presentation Gatwick is the 2 nd largest airport in the UK and the 8 th busiest in Europe with 46 mpax Key features 46 mpaxin FY18, in the wealthiest
Investment Highlights
 Second Quarter 2014 Investment Highlights 1 Mexican airport portfolio positioned to take full advantage of global growth. 2 Diversified business model contributing to earnings resilience. 3 Well-defined
Copa Holdings Reports Net Income of US$51.9 Million for the Fourth Quarter of 2008 and US$152.2 Million for Full Year 2008
 Copa Holdings Reports Net Income of US$51.9 Million for the Fourth Quarter of 2008 and US$152.2 Million for Full Year 2008 Panama City, Panama --- February 19, 2009. Copa Holdings, S.A. (NYSE: CPA), parent
NORWEGIAN AIR SHUTTLE ASA QUARTERLY REPORT SECOND QUARTER 2006 [This document is a translation from the original Norwegian version]
![NORWEGIAN AIR SHUTTLE ASA QUARTERLY REPORT SECOND QUARTER 2006 [This document is a translation from the original Norwegian version]](/thumbs/74/71229964.jpg "NORWEGIAN AIR SHUTTLE ASA QUARTERLY REPORT SECOND QUARTER 2006 [This document is a translation from the original Norwegian version]") NORWEGIAN AIR SHUTTLE ASA QUARTERLY REPORT SECOND QUARTER 2006 SECOND QUARTER IN BRIEF had earnings before tax of MNOK 24.8 (20.6) in the second quarter. The operating revenue increased by 44 % this quarter,
NORWEGIAN AIR SHUTTLE ASA QUARTERLY REPORT SECOND QUARTER 2006 SECOND QUARTER IN BRIEF had earnings before tax of MNOK 24.8 (20.6) in the second quarter. The operating revenue increased by 44 % this quarter,
Results 2Q17. August 9, 2017
 Results 2Q17 August 9, 2017 2Q17 Highlights Indicators 2Q17 Var. x 2Q16 ASK (BN) 10.4-3.0% Traffic (000) 7,261-1.3% RPK (BN) 8.1 +0.5% Load Factor 77.9% +2.7 p.p. Yield (R$ cents) 23.2 +4.8% Pax Revenue
Driving global growth
 Holiday Inn, Manhattan Financial District Driving global growth Paul Edgecliffe Johnson Group CFO IHG has a consistently executed, winning strategy for high quality growth Value creation: superior shareholder
Interim Report 6m 2014
 August 11, 2014 Interim Report 6m 2014 Investors and Analysts Conference Call on August 11, 2014 Joachim Müller, CFO Latest ad-hoc release (August 4, 2014) Reduction of forecast, primarily due to a further
Third Quarter 2015 Results
 Third Quarter 2015 Results Investment Highlights Positioned to take full advantage of global growth Diversified business model Well-defined strategy to capitalize on favorable industry dynamic Successful
FOURTH QUARTER AND FULL-YEAR RESULTS February 2008
 FOURTH QUARTER AND FULL-YEAR RESULTS 2 1 February 2 AGENDA CEO review Financial review Operating review of Mobile Concluding remarks Harri Koponen Lars Nilsson Harri Koponen Harri Koponen 2 29-2-1 Fourth
Flughafen Wien Group Continues on Success Path in the First Quarter of 2016
 Flughafen Wien Group Continues on Success Path in the First Quarter of 2016 Upward revaluation of stake in Malta Airport and good business development lead to strong increase in the net profit for the
China Lodging Group (HTHT.US) Q4 and full year 2017 Earnings Call March 13, 2018
 Q4 and full year 2017 Earnings Call March 13, 2018") China Lodging Group (HTHT.US) Q4 and full year 2017 Earnings Call March 13, 2018 Agenda Strategy Review Operational and Financial Review Q & A Appendix 1 Strong RevPAR Growth Driven by ADR + Occupancy
China Lodging Group (HTHT.US) Q4 and full year 2017 Earnings Call March 13, 2018 Agenda Strategy Review Operational and Financial Review Q & A Appendix 1 Strong RevPAR Growth Driven by ADR + Occupancy
Main Points in the Results for FY2015
 0 1 2 Main Points in the Results for FY2015 Operating profit increased to 75.4 billion yen, exceeding the goal of 75.0 billion yen for the final year of the medium-term management plan in the first year
OPERATING AND FINANCIAL HIGHLIGHTS. Subsequent Events
 Copa Holdings Reports Net Income of US$113.1 Million and EPS of US$2.57 for the First Quarter of 2015 Excluding special items, adjusted net income came in at US$106.0 million, or EPS of US$2.41 per share
TUI GROUP FACTBOOK. May 2015
 TUI GROUP FACTBOOK May 2015 Pro Forma Turnover 2012/13 & 2013/14 m FY 12/13 Q1 13/14 Q2 13/14 Q3 13/14 Q4 13/14 FY 13/14 Northern Region 6,037.2 1,047.6 922.0 1,660.0 2,571.2 6,200.8 Central Region 5,524.8
Interim Report 3m Bilfinger Berger SE, Mannheim May 10, 2012 Joachim Müller, CFO
 Interim Report 3m 2012 Bilfinger Berger SE, Mannheim May 10, 2012 Joachim Müller, CFO Bilfinger Berger SE Interim report 3m 2012 May 10, 2012 Page 1 3m 2012: Highlights Growth in output volume and orders
2012 Result. Mika Vehviläinen CEO
 2012 Result Mika Vehviläinen CEO 1 Agenda Market environment in Q4 Business performance and strategy execution Outlook Financials 2 Market Environment According to IATA, Global air travel continues to
OPERATING AND FINANCIAL HIGHLIGHTS. Subsequent Events
 Copa Holdings Reports Net Income of $103.8 million and EPS of $2.45 for the Third Quarter of 2017 Excluding special items, adjusted net income came in at $100.8 million, or EPS of $2.38 per share Panama
Copa Holdings Reports Net Income of US$113.9 Million for the Fourth Quarter of 2013
 Copa Holdings Reports Net Income of US$113.9 Million for the Fourth Quarter of 2013 Panama City, Panama --- February 12, 2014. Copa Holdings, S.A. (NYSE: CPA), today announced financial results for the
Results 1 st Quarter 2005
 Grupo Posadas, s, S.A. de C.V. & Subsidiaries April 28, 2005 Results 1 st Quarter 2005 Total revenues increase 13% in the quarter Higher demand in urban hotels Better results in coastal hotels 3 openings
MID-AGE AIRCRAFT 2017 LEASE HIGH YIELD MID-AGE AIRCRAFT LEASE AND TECHNICAL RISKS
 MID-AGE AIRCRAFT 2017 LEASE HIGH YIELD MID-AGE AIRCRAFT LEASE AND TECHNICAL RISKS TODAY S PRESENTER 2 TOMAS SIDLAUSKAS Vice President Sales & Member of the Management Board Joined the Group in 2013, is
OPERATING AND FINANCIAL HIGHLIGHTS
 Copa Holdings Reports Financial Results for the Fourth Quarter of 2015 Excluding special items, adjusted net income came in at $31.7 million, or EPS of $0.73 per share Panama City, Panama --- February
THIRD QUARTER RESULTS 2018
 THIRD QUARTER RESULTS 2018 KEY RESULTS In the 3Q18 Interjet total revenues added $ 6,244.8 million pesos that represented an increase of 7.0% over the revenue generated in the 3Q17. In the 3Q18, operating
Year ended December 31, 2012
 Consolidated Earnings Report - Supplementary Information Consolidated Results ( ) 1. Consolidated Financial Highlights 2. Major Sales Sales Volume Data 3. Condensed Consolidated Statements of Income Condensed
Q Fast growth continued, Comparable operating result at record high levels Pekka Vauramo
 2018 Fast growth continued, Comparable operating result at record high levels 17.7.2018 Pekka Vauramo 2 A good - Comparable operating result increased to new seasonal high Revenue Comparable operating
Interim Release Q3/9M 2017
 Overview by the Executive Board November 2, 207 In the first nine months of 207, the airports of the Fraport Group recorded strong passenger development. At approximately 48.9 million, passenger numbers
Quarterly Interim Management Statement. Three Months to June 30, 2015
 Quarterly Interim Management Statement Three Months to June 30, 2015 BUSINESS HIGHLIGHTS FOR Q1 Record Q1 profitability despite negative Easter effect Lower unit costs further increasing our cost advantage
Presentation to Investors as of 8 November 2018
 as of Table of contents The Philippine Economy 3 About Belle Corporation 4 Property 9 Gaming 11 Track Record 15 Financials 17 2 Million tourists Philippines : strong macroeconomic fundamentals Young workforce
Copa Holdings Reports Net Income of $49.9 million and EPS of $1.18 for the Second Quarter of 2018
 Copa Holdings Reports Net Income of $49.9 million and EPS of $1.18 for the Second Quarter of 2018 Panama City, Panama --- Aug 8, 2018. Copa Holdings, S.A. (NYSE: CPA), today announced financial results
ALAFCO Aviation Lease And Finance Co. KSCC
 Information MEMORANDUM ALAFCO Aviation Lease And Finance Co. KSCC Mr. Ahmad A. Alzabin Vice Chairman and Chief Executive Officer The 6th Forum for Listed Companies and Analysts Kuwait 20 May 2014 Core
Results for the First Nine Months of 2007
 Results for the First Nine Months of 2007 Flughafen Wien Group 22. August 2006 Mag. Herbert Kaufmann Vorstandssprecher Flughafen Wien AG December 2007 Facts & Activities 16.9 m passengers in 2006 Share
Air China Limited Annual Results. March Under IFRS
 Air China Limited 21 Annual Results Under IFRS March 211 Agenda Part 1 Highlights Part 2 Business Overview Part 3 Financial Overview Part 4 Outlook 2 Part 1 Highlights Steady Economic Growth; Asia Pacific
01 Amadeus at a glance
 01 Amadeus at a glance 7 Amadeus Annual Report 2011 1.1 Company s origins and development Most people associate the birth of electronic commerce distribution with the arrival of the internet. In fact,
Analyst and Investor Conference Call Q Ulrik Svensson, CFO and Member of the Executive Board
 Analyst and Investor Conference Call Q2 2017 Ulrik Svensson, CFO and Member of the Executive Board Frankfurt, 2 August 2017 Disclaimer The information herein is based on publicly available information.
Copa Holdings Reports Net Income of $57.7 million and EPS of $1.36 for the Third Quarter of 2018
 Copa Holdings Reports Net Income of $57.7 million and EPS of $1.36 for the Third Quarter of 2018 November 14, 2018 PANAMA CITY, Nov. 14, 2018 /PRNewswire/ -- Copa Holdings, S.A. (NYSE: CPA), today announced
Presentation to Investors as of 12 September 2018
 as of Table of contents The Philippine Economy 3 About Belle Corporation 4 Property 9 Gaming 11 Track Record 15 Financials 17 2 Million tourists Philippines : strong macroeconomic fundamentals Young workforce
UBS Latin American New Opportunities Conference. June 11 th -12 th, 2007
 UBS Latin American New Opportunities Conference June 11 th -12 th, 2007 Company Overview OMA operates a diversified portfolio of 13 airports distributed throughout Northern and Central Mexico and is diversified
Copa Holdings Reports Net Income of $136.5 million and EPS of $3.22 for the First Quarter of 2018
 Copa Holdings Reports Net Income of $136.5 million and EPS of $3.22 for the First Quarter of 2018 May 9, 2018 PANAMA CITY, May 9, 2018 /PRNewswire/ -- Copa Holdings, S.A. (NYSE: CPA), today announced financial
Finnair Group Interim Report 1 January 31 March 2008
 Finnair Group Interim Report 1 January 31 March 2008 1 29/04/2008 Presentation name / Author Outlook for the industry less positive Growth of demand declining due to uncertainty of global economy Growth
Quarterly Meeting# 4/2018
 Quarterly Meeting# 4/2018 3Q18 & 9M18 Performance & Outlook 14 November 2018 1 2016 ERAWAN. All rights reserved. The views expressed here contain some information derived from publicly available sources
Creating Happiness. Business Model. Business Mission
 Business Model Creating Happiness Oriental Land Co., Ltd. (OLC) was established with a strong aspiration to create a large-scale recreational facility, right here in Japan when Maihama was still a part
Analysts and Investors conference call. Q results. 15 May 2013
 Analysts and Investors conference call Q1 2013 results 15 May 2013 Management summary Key messages of Q1 2013 +6% +9% +3.3%p. Q1 2013 operational KPIs are in line with 109.7 116.2 6.5 7.1 82.3 85.6 expectations,
For personal use only
 HELLOWORLD TRAVEL LIMITED RESULTS ANNOUNCEMENT Highlights for the year ended 30 June 2018 Total Transaction Value (TTV) growth of 3.5% to $6.1 billion, underpinned by strong air ticket sales volume growth.
NORWEGIAN AIR SHUTTLE ASA QUARTERLY REPORT FIRST QUARTER 2004 [This document is a translation from the original Norwegian version]
![NORWEGIAN AIR SHUTTLE ASA QUARTERLY REPORT FIRST QUARTER 2004 [This document is a translation from the original Norwegian version]](/thumbs/87/95085804.jpg "NORWEGIAN AIR SHUTTLE ASA QUARTERLY REPORT FIRST QUARTER 2004 [This document is a translation from the original Norwegian version]") NORWEGIAN AIR SHUTTLE ASA QUARTERLY REPORT 2004 IN BRIEF At the start of 2003, Norwegian has become a pure low-fare airline. The Fokker F-50 operations have been terminated, and during the quarter the
NORWEGIAN AIR SHUTTLE ASA QUARTERLY REPORT 2004 IN BRIEF At the start of 2003, Norwegian has become a pure low-fare airline. The Fokker F-50 operations have been terminated, and during the quarter the
OPERATING AND FINANCIAL HIGHLIGHTS SUBSEQUENT EVENTS
 Copa Holdings Reports Financial Results for the Third Quarter of 2016 Excluding special items, adjusted net income came in at $55.3 million, or adjusted EPS of $1.30 per share Panama City, Panama --- November
Historical Statistics
 Historical Statistics FedEx Corporation Financial and Operating Statistics FY 2005 FY 2014 This report is a statistical supplement to FedEx s interim financial reports and is prepared quarterly. Additional
2018 full-year results
 2018 full-year results 01 Message from Chairman & CEO 02 FY 2018 Results 03 Business drivers 04 Outlook 02 FY 2018 financial results Key figures Revenue 2.85 Bn ROP 115 M Net debt 252 M Free cash flow
Crown Resorts Limited
 Crown Resorts Limited 2016 Half Year Results Presentation 25 February 2016 1 Crown Resorts Limited Results Overview Crown Resorts Limited (Crown) performance: The 2016 First Half results across Crown s
2005 Interim Results. September 7, 2005
 2005 Interim Results September 7, 2005 Outline First-Half 2005 Results Business activity at August 31, 2005 Update on the Real Estate and Expansion Strategies 2 First-half 2005 +22.8% Solid growth in interim
Gerry Laderman SVP Finance, Procurement and Treasurer
 Gerry Laderman SVP Finance, Procurement and Treasurer Safe Harbor Statement Certain statements included in this release are forward-looking and thus reflect our current expectations and beliefs with respect
Finnair Group Interim Report 1 January 30 June 2008
 Finnair Group Interim Report 1 January 30 June 2008 1 08/08/2008 Presentation name / Author Airline industry at a historical turning point Fuel price has a stranglehold on the business Average ticket prices
JAPAN AIRLINES Co., Ltd. Financial Results 1 st Quarter Mar/2017(FY2016) July 29, 2016
 July 29, 2016") JAPAN AIRLINES Co., Ltd. Financial Results Mar/2017(FY2016) July 29, 2016 Today s Topics P.1 P.2 P.13 From the first quarter of this fiscal year, figures for Revenue Passengers Carried, ASK, RPK and Load
JAPAN AIRLINES Co., Ltd. Financial Results Mar/2017(FY2016) July 29, 2016 Today s Topics P.1 P.2 P.13 From the first quarter of this fiscal year, figures for Revenue Passengers Carried, ASK, RPK and Load
China Lodging Group (HTHT.US) Q Earnings Call August 17, 2017
 Q Earnings Call August 17, 2017") China Lodging Group (HTHT.US) Q2 2017 Earnings Call August 17, 2017 Agenda Lodging Landscape in China Strategy Review Operational and Financial Review Q & A Appendix 1 Strong Demand: Domestic Travel Remains
China Lodging Group (HTHT.US) Q2 2017 Earnings Call August 17, 2017 Agenda Lodging Landscape in China Strategy Review Operational and Financial Review Q & A Appendix 1 Strong Demand: Domestic Travel Remains
H RESULTS BOLOGNA, SEPTEMBER 4 TH 2017
 H1 RESULTS BOLOGNA, SEPTEMBER 4 TH H1 GROUP 2 GROUP OVERVIEW STRONG GROWTH TRACK RECORD AND MOMENTUM STRATEGIC LOCATION AND WEALTHY CATCHMENT AREA H1 Among top 50 airports in Europe # 7 airport in Italy
SET Opportunity Day #3/2011
 SET Opportunity Day #3/2011 2Q11 & 1H11 Performance & Outlook 18 August 2011 The views expressed here contain some information derived from publicly available sources that have not been independently verified.
COACHMEN INDUSTRIES, INC. The Wall Street Analyst Forum June 1, 2005
 COACHMEN INDUSTRIES, INC. The Wall Street Analyst Forum June 1, 2005 SAFE HARBOR DISCLAIMER This release contains forward-looking statements within the meaning of the Private Securities Litigation Reform