Baltic Sea Sewage Port Reception Facilities
|
|
|
- August McGee
- 5 years ago
- Views:
Transcription

1 HELCOM Maritime HELCOM Overview 2018 Baltic Sea Sewage Port Reception Facilities Shipping helcom.fi Baltic Marine Environment Protection Commission 2018
2 Published by: HELCOM Baltic Marine Environment Protection Commission Katajanokanlaituri 6 B FI Helsinki Finland Editors: Markus Helavuori, Florent Nicolas, HELCOM Secretariat For bibliographic purposes this document should be cited as: HELCOM (2018), Baltic Sea Sewage Port Reception Facilities, HELCOM Overview pp. Credits: Cover picture Peter Heeling Map-marker icon: Alex Kwa, licensed as Creative Commons BY 3.0. Map background: OpenStreetMap Stamen.
3 Contents 1. A regional sewage Port Reception Facilities overview - with focus on cruise ships Cruise ships traffic in the Baltic Sea Ports specific information Saint Petersburg (Russia) Copenhagen (Denmark) Tallinn (Estonia) Helsinki (Finland) Stockholm (Sweden) Rostock (Germany) Kiel (Germany) Gothenburg (Sweden) Klaipeda (Lithuania) Riga (Latvia) Gdynia (Poland) Gdansk (Poland) Visby (Sweden) Rönne - Bornholm (Denmark) Mariehamn (Finland) Lübeck, including Travemünde (Germany) Malmö (Sweden) Wismar (Germany) Aarhus (Denmark) Saaremaa (Estonia) Sassnitz, including Mukran (Germany) Kaliningrad (Russia) Kalundborg (Denmark) Helsingborg (Sweden) Szczecin, including Świnoujście (Poland) Flensburg (Germany) Karlskrona (Sweden) Ventspils (Latvia) Stralsund (Germany) Kemi (Finland) Helsingör (Denmark) Luleå (Sweden) Fredericia (Denmark)
4 Trelleborg (Sweden) Liepaja (Latvia) Turku (Finland) Nynäshamn (Sweden) Kapellskär (Sweden) Annex I - Estimated maximum theoretical discharge need of cruise ships References
5 Baltic Sea Sewage Port Reception Facilities HELCOM overview A regional sewage Port Reception Facilities overview - with focus on cruise ships This report provides information on the status of sewage port reception facilities (PRF) and their use in the Baltic Sea area, with a focus on international cruise traffic. Cruise traffic has been growing during recent years and it is important to make Baltic Sea-wide information available on sewage PRF needs and availability in the Baltic Sea ports. This document has been compiled by the HELCOM Secretariat based on information received by port authorities, national Administrations and the cruise and port industries. HELCOM AIS data for the period 2006 to 2017 was also used to produce some figures available in the following port sheets. In 2017 and 2018, a request was sent to the national Administrations to provide new relevant and updated information regarding sewage PRF in their ports. The request also includes a call to update the available statistics such as the number of international passengers transiting per port, the number of port calls, the sewage discharged in each ports, etc. 5
6 Information from national Administrations and industry Information from the national Administrations has been provided via the national delegates of the HELCOM Maritime Working Group (HELCOM MARITIME), most recently following requests for updates in 2017 and Information from the industry has been collected with the generous help of HELCOM industry observers, particularly Cruise Lines International Association (CLIA), including a joint online survey for cruise ships during 2014, but also European Community Shipowners Association (ECSA), Baltic Ports Organisation (BPO) and European Sea Ports Organisation (ESPO). These industry actors have cooperated within the regional Cooperation Platform on Port Reception Facilities (PRF) in the Baltic Sea established in In May 2014, HELCOM and the Cruise Lines International Association (CLIA) launched a joint survey in the Baltic Sea region for summer The survey aimed to collect detailed data on sewage delivery needs and available facilities in the Baltic Sea ports. The survey was available for cruise ships calling Baltic Sea ports between May and October The questionnaire was sent to ships and also to ports, but only a few ports answered. Answers from a total of 667 port calls, by 29 different cruise ships in 22 ports of the region, were received. The results of the survey have been used in this document for showing the use of sewage PRFs in the passenger ports in the Baltic Sea during 2014, as well as to document related comments by cruise ships crew. Additional information sources for this publication have been an exchange of letters on sewage PRFs under the Nordic Council of Ministers (finalized in 2013), the Baltic Port List series published by the Turku University Centre for Maritime Studies, a 2013 compilation of statistics by the industry initiative Cruise Baltic ( as well as a compilation of ferry lines information from the worldwide ferry portal website AIS data AIS data from the regional HELCOM AIS network covering the whole Baltic Sea area was used in order to generate figures to describe the cruise ships traffic in the region. From the AIS data, it is possible to retrieve relevant information such as the number of calls per port, the time spent operating at sea and in ports, etc. For each port sheets in this report, the figures 3.1, 3.2 and 3.6 are displaying information from the AIS data analysis. For a few ports, the figures related to the number of port calls can be slightly different than the information received from the national Administrations. This is due to AIS data quality or inconsistencies in the update from the Administrations. 6

7 2. Cruise ships traffic in the Baltic Sea The IMO registered passenger ships are only a small fraction of all the IMO registered ships operating in the Baltic Sea. In 2015, only 6% of these ships were passenger ships. However, most passenger ships are operating on regular lines between ports and this results in a fairly large proportion of the overall traffic in the Baltic Sea. In 2015, 17% of the total distance sailed by the IMO registered ships was accomplished by passenger ships (HELCOM, 2018). The movements between the biggest ports of the Baltic Sea is visualized in figure 1 below and the traffic density is displayed in figure 2. Figure 1: Passenger ship movements between ports (arrival and departures) in 2015 (between the 50 biggest ports and a minimum of 500 trips between ports) (Source: HELCOM, 2018). 7


8 Figure. 2: Traffic intensity map of all passenger ships in the Baltic Sea region in 2015 The fleet of the passenger ships can be divided into smaller categories 8
9 There is a strong seasonal variation of the passenger ships activity in the Baltic Sea area. The number of ships operating on regular lines, such as the ferries, is decreasing every winter (cf. Figure 3). The cruise ships are mostly operating from April until October with an annual peak between June and August. Figure 3: number of cruise ships and ferries operating in the Baltic Sea (monthly values) based on the HELCOM AIS data. The ship type Ferries also includes RoPax as well as small passenger ships with a length less than 50 metres. 9
.")

10 Traffic and ports visited by cruise ships The traffic intensity and the ports called by cruise ships during 2016 are displayed in the map below (cf. Figure 4). The cruise ships are usually visiting the same ports every year, predominantly the major touristic cities in the Baltic Sea region. Figure. 4: Cruise ships traffic intensity and ports visits in
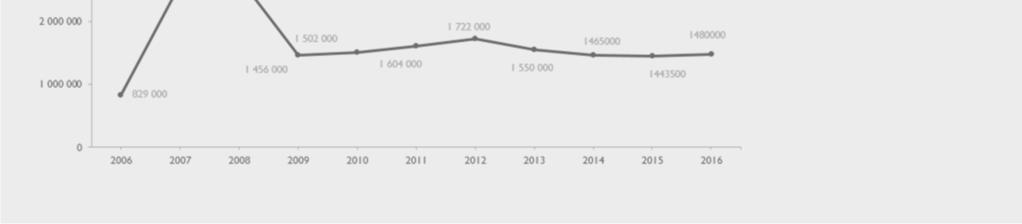
11 Cruising season in the Baltic Sea Every year, the cruising season in the Baltic Sea area stretches from the beginning of May to the end of August (cf. Figure 5 below). The rest of the time, the cruise ships are operating in other marine areas outside the Baltic Sea region. Most of the cruise ships operating in the Baltic Sea originate from outside the region. Figure. 5: Average number of voyages per month from 2006 to 2017, based on HELCOM AIS data. Duration of the stay in ports Between 2006 and 2017, the international cruise ships usually stop from 6 to 12 hours in the ports of the Baltic Sea (cf. Figure 6 below). Another minor peak is related to the stops with a duration between 32 and 36 hours in ports. These are mainly stops in the port of Saint Petersburg (87%) where the stops are usually longer than in other ports of the Baltic Sea region. Figure 6: Duration of cruise ship visits (port calls) in the ports of the Baltic Sea from 2006 to 2017 based on HELCOM AIS data. 11
12 Duration of the cruise ship voyages Between 2006 and 2017, half of the voyages of the cruise ships lasted between 8 to 18 hours (cf. Figure 7). Another cluster is related to the voyages with a duration between 30 to 40 hours at sea. The majority of these voyages (63%) are cruise ships traveling to Tallinn, Stockholm, Copenhagen and Rostock. Figure 7: Duration of the voyages by cruise ships in the Baltic Sea area, based on the HELCOM AIS data. Anchoring According to the HELCOM AIS data, cruise ships do not always enter certain small ports. Instead, the ships anchor outside the ports and have tender or shuttle boats to transfer passengers to the shore. Anchoring stops with a duration of a few hours or more are observed occasionally in the HELCOM AIS data. Barges are available in several ports to discharge sewage from such ships. 12
 http://www.cmport.")


13 3. Ports specific information This report provides detailed information on all ports of the Baltic Sea region that cruise ships are visiting. The information of each port is organized as follows: Port (Country) UN LOCODE: DKCPH Berth used by cruise ships according to AIS data during April - October 2014 General information about port. Berths used by cruise ships according to AIS data during April - October 2014 are indicated with a red marker. 1. Sewage Port Reception Facilities Lorem ipsum dolor sit amet, consectetur adipiscing elit. Maecenas quis posuere metus. Nullam eu erat eu nibh maximus consectetur et vitae neque. Suspendisse potenti. Nam imperdiet diam ac l Planned improvements Lorem ipsum dolor sit amet, consectetur adipiscing elit. Maecenas quis posuere metus. Nullam eu erat eu nibh maximus consectetur et vitae neque. Suspendisse potenti. Nam imperdiet diam ac Information on availability, planned, Additional information improvements and history of sewage PRF. The information has been received Lorem ipsum from dolor national sit amet, consectetur adipiscing elit. Maecenas quis posuere metus. Nullam eu erat eu nibh Administrations and ports. For some ports maximus consectetur et vitae neque. Suspendisse potenti. little information is available. Nam imperdiet diam ac l. Lorem ipsum dolor sit amet, consectetur adipiscing elit. Maecenas quis posuere metus. Nullam eu erat eu nibh maximus consectetur et vitae neque. Suspendisse potenti. Nam imperdiet diam ac l. Lorem ipsum dolor sit amet, consectetur adipiscing elit. Maecenas quis posuere metus. Nullam eu erat eu nibh. 13

, the publication Baltic Port List and the")


14 2. Passenger traffic trends in Copenhagen A compilation based on statistics from the Baltic Sea coastal countries national Administrations, regional ports organizations (BPO, ESPO), the publication Baltic Port List and the Nordic Council of Ministers. Cruise ships calls Cruise ships passengers A compilation of passenger traffic statistics for the port based on several sources: Baltic Sea coastal countries national Administrations, regional ports organizations (BPO, ESPO), the publication Baltic Port List and the Nordic Council of Ministers. International cruise and ferry passengers 14

")
15 3. Cruise ship visits in Copenhagen The figures 3.1 and 3.2 are generated from the HELCOM AIS data. The dataset covers the period from 2006 to Time at sea from previous port 3.2. Time spent at port per call Information based on the HELCOM AIS data. The figure 3.3 shows discharges reported by cruise industry. The black bar shows the number of ships that did not use the sewage PRF for sewage even if available. It is based on information from 29 CLIA-affiliated cruise ships, received by HELCOM Secretariat as a reply to a joint HELCOM CLIA survey. The dataset covers the whole cruising season (April to October 2014) Sewage discharges 3.4. Comments from cruise ships on port facilities (2014) Because of the presence of passengers, the use of road tankers can be a safety issue. There are unreasonable charges for the use of the facilities for sewage. Information based on an extraction from the 2014 AIS data made using a list of cruise ships observed to operate in the Baltic Sea (annex I) Maximum number of persons on board per call 3.6. Estimated theoretical max. discharge need 1 Maximum capacity of persons onboard including passengers and crew 1 Estimated total discharge capacity needs of cruise ship calls during summer 2014, assuming all wastewater generated after leaving last port of call will be discharged in the port. The presented figures are based the following calculation:. Multiplying this figure with a waste water production estimation in m3 sewage per person per day would give you the estimated total discharge need in m3h-1. More information is available in the Annex I. 15

16 Saint Petersburg (Russia) UN LOCODE: RULED Berth used by cruise ships according to AIS data during April - October Sewage Port Reception Facilities Public Limited Company Passenger Port of St. Petersburg «Marine Facade» has been carrying out regular servicing of passenger ships since The amount of sewage taken from cruise ships is presented in the table: Year Sewage from cruise ships, cub.m In the seaport "Big Port of St. Petersburg" sewage is carried out by LLC "Contour SPb", LLC "Ivolga", LLC "Ecological fleet". Accordingly to the national legislation there is no obligation to collect statistic databases. The quantity of sewage, which was taken by LLC "Ecological fleet" from passenger ships, is presented in the table: Year Sewage from cruise ships, tn , ,6 Planned improvements Additional information Saint Petersburg was listed as having adequate PRF for sewage in the 2010 HELCOM Roadmap for upgrading PRF for sewage in passenger ports of the Baltic Sea area. In 2009, the capacity of the sewage collection was up to 1,000 m 3 per day. The investment for port reception facilities was around 1 million USD. In 2010, when three new quays in Marine Façade were put into operation the capacity of sewage collection was 2,700 m 3 per day. During second stage of construction the planning of investments was around 2 million USD. In 2011, after the completion of terminal construction and putting into operation of two new quays, the capacity of sewage collection was 4,745 m 3 per day. 16
17 2. Passenger traffic trends in Saint Petersburg A compilation based on statistics from the Baltic Sea coastal countries national Administrations, regional ports organizations (BPO, ESPO), the publication Baltic Port List and the Nordic Council of Ministers. Cruise ships calls Cruise ships passengers International cruise and ferry passengers 17
18 3. Cruise ship visits in Saint Petersburg The figures 3.1 and 3.2 are generated from the HELCOM AIS data. The dataset covers the period from 2006 to Time at sea from previous port 3.2. Time spent at port per call Figure 3.3 shows discharges reported by cruise industry. The black bar shows the number of ships that did not use the sewage PRF for sewage even if available. It is based on information from 29 CLIA-affiliated cruise ships, received by HELCOM Secretariat as a reply to a joint HELCOM CLIA survey. The dataset covers the whole cruising season (April to October 2014) Sewage discharges 3.4. Comments from cruise ships on port facilities (2014) 3.5. Maximum number of persons on board per call Maximum capacity of persons onboard including passengers and crew 3.6. Estimated theoretical max. discharge need 1 1 Estimated total discharge capacity needs of cruise ship calls during summer 2014, assuming all wastewater generated after leaving last port of call will be discharged in the port. The presented figures are based the following calculation:. Multiplying this figure with a waste water production estimation in m 3 sewage per person per day would give you the estimated total discharge need in m 3 h -1. More information is available in the Annex I. 18

19 Copenhagen (Denmark) UN LOCODE: DKCPH Berth used by cruise ships according to AIS data during April - October Sewage Port Reception Facilities Direct discharge to sewer system is available on the new 1,1 km quay which has been operational from 2014 onwards with capacity m3 sewage per hour per berthing place. The system is equipped with the possibility of flushing with rain water to avoid clogging. Otherwise Copenhagen Port's reception facilities for sewage utilise the tankers of a haulage company. There is a possibility to utilise three tankers per delivery. After collection, the sewage is pumped via a pump station and sewer system to the municipal sewage treatment plant. Collection of sewage and grey water pursuant to the 'no special fee' system is made on condition that: The ship can deliver the sewage at the shipside at a pump capacity of 50 m3 per hour. A charge will be made for the collection of disproportionately large amounts (i.e. more than 130 liters per person for each 24-hour period since the last port of call), or for collection outside normal working hours, as specified in the list of charges. Tankers can obtain unhindered access to and from the place of collection without delay. The ship is fitted with a standard flange. Planned improvements Additional information Copenhagen was one of the eight ports listed as first priority ports in the 2010 HELCOM Roadmap for upgrading PRF for sewage in passenger ports of the Baltic Sea area. 19
20 2. Passenger traffic trends in Copenhagen A compilation based on statistics from the Baltic Sea coastal countries national Administrations, regional ports organizations (BPO, ESPO), the publication Baltic Port List and the Nordic Council of Ministers. Cruise ships calls Cruise ships passengers International cruise and ferry passengers 20

21 3. Cruise ship visits in Copenhagen The figures 3.1 and 3.2 are generated from the HELCOM AIS data. The dataset covers the period from 2006 to Time at sea from previous port 3.2. Time spent at port per call The figure 3.3 shows discharges reported by cruise industry. The black bar shows the number of ships that did not use the sewage PRF for sewage even if available. It is based on information from 29 CLIA-affiliated cruise ships, received by HELCOM Secretariat as a reply to a joint HELCOM CLIA survey. The dataset covers the whole cruising season (April to October 2014) Sewage discharges 3.4. Comments from cruise ships on port facilities (2014) Because of the presence of passengers, the use of road tankers can be a safety issue. There are unreasonable charges for the use of the facilities for sewage Maximum number of persons on board per call Maximum capacity of persons onboard including passengers and crew 3.6. Estimated theoretical max. discharge need 1 1 Estimated total discharge capacity needs of cruise ship calls during summer 2014, assuming all wastewater generated after leaving last port of call will be discharged in the port. The presented figures are based the following calculation:. Multiplying this figure with a waste water production estimation in m 3 sewage per person per day would give you the estimated total discharge need in m 3 h -1. More information is available in the Annex I. 21

22 Tallinn (Estonia) UN LOCODE: EETLL Berth used by cruise ships according to AIS data during April - October Sewage Port Reception Facilities Fixed reception points connected to public sewage system are available at Tallinn Old City Harbour quays number 1 and 3. (max total capacity 80m3/h), number 10, number and number (total max capacity 1200m3/h). In other quays there is no direct discharge to sewer system i.e. the quays are served by tank trucks (7-17m³) if requested. A standard waste fee is charged from every ship. Starting from 2017 cruise ships can offload unlimited amount of sewage. For passenger ships sewage volumes exceeding 7m 3 are still subject to extra payment. Planned improvements Port of Tallinn is planning to construct PRF connected to public sewage system at Old City Harbour quays no 5 and 7. Additional information Tallinn was one of the eight ports listed as first priority ports in the 2010 HELCOM Roadmap for upgrading PRF for sewage in passenger ports of the Baltic Sea area. Fixed reception points connected to public sewage system at Old City Harbour have been available for a longer time for quays no. 1 and 3. In 2014 the new cruise quay (quay no 26-27) with PRF for sewage was built. Construction works for PRF s for sewage at quays no 10, and were completed in
23 2. Passenger traffic trends in Tallinn A compilation based on statistics from the Baltic Sea coastal countries national Administrations, regional ports organizations (BPO, ESPO), the publication Baltic Port List and the Nordic Council of Ministers. Cruise ships calls Cruise ships passengers International cruise and ferry passengers 23
24 3. Cruise ship visits in Tallinn The figures 3.1 and 3.2 are generated from the HELCOM AIS data. The dataset covers the period from 2006 to Time at sea from previous port 3.2. Time spent at port per call The figure 3.3 shows discharges reported by cruise industry. The black bar shows the number of ships that did not use the sewage PRF for sewage even if available. It is based on information from 29 CLIA-affiliated cruise ships, received by HELCOM Secretariat as a reply to a joint HELCOM CLIA survey. The dataset covers the whole cruising season (April to October 2014) Sewage discharges 3.4. Comments from cruise ships on port facilities (2014) The transfer of 7m 3 is included in the port fee. After this amount, the use of the PRF for sewage is not free. The tank trucks have a small capacity (12m 3 ) Maximum number of persons on board per call Maximum capacity of persons onboard including passengers and crew 3.6. Estimated theoretical max. discharge need 1 1 Estimated total discharge capacity needs of cruise ship calls during summer 2014, assuming all wastewater generated after leaving last port of call will be discharged in the port. The presented figures are based the following calculation:. Multiplying this figure with a waste water production estimation in m 3 sewage per person per day would give you the estimated total discharge need in m 3 h -1. More information is available in the Annex I. 24

25 Helsinki (Finland) UN LOCODE: FIHEL Berth used by cruise ships according to AIS data during April - October Sewage Port Reception Facilities At all three ports grey and black water is discharged from the vessels directly to the city waste water system. The ship service person of the port connects the hose at the appointed time. The vessel must use its own pump for discharging and the vessel must have the possibilities to flush the hoses after discharging. This service is free. West Harbour: 11 berths incl. ice breakers. Discharge points are located every 40-60m. Sewer pipes have been renovated recently. Capacity of the PRF: 100 m 3 /h (possibility to double the capacity if two pipes are used simultaneously). South Harbour: 12 berths incl. ice breakers. Discharge points are located every 40-60m. Sewer pipes have been renovated recently. Capacity of the PRF: 100 m 3 /h (possibility to double the capacity if two pipes are used simultaneously). Vuosaari cargo port: 17 quays for roro ships and 1500m of container pier. Waste water discharge points are every 40-60m. A pre-treatment facility for waste water has also been installed in this port area. Planned improvements A new quay for cruise vessels is planned to be built in Hernesaari area (West harbour) with sewage port reception facilities. If the decision to build the new quay will be made, the new facilities would be available in Additional information The first fixed sewage pipelines in South Harbour quays were installed in 1990, and during the pipelines were assembled on all existing quays in South and West Harbours. During recent years, installations of PRF for sewage have been made when new quays have been built for cruise ships. The new Vuosaari cargo port was completed in the end of 2008 and it is equipped with sewage pipelines in all quays and piers. Helsinki was listed as having adequate PRF for sewage in the 2010 HELCOM Roadmap for upgrading PRF for sewage in passenger ports of the Baltic Sea area. 25
26 2. Passenger traffic trends in Helsinki A compilation based on statistics from the Baltic Sea coastal countries national Administrations, regional ports organisations (BPO, ESPO), the publication Baltic Port List and the Nordic Council of Ministers. Cruise ships calls Cruise ships passengers International cruise and ferry passengers 26

27 3. Cruise ship visits in Helsinki The figures 3.1 and 3.2 are generated from the HELCOM AIS data. The dataset covers the period from 2006 to Time at sea from previous port 3.2. Time spent at port per call The figure 3.3 shows discharges reported by cruise industry. The black bar shows the number of ships that did not use the sewage PRF for sewage even if available. It is based on information from 29 CLIA-affiliated cruise ships, received by HELCOM Secretariat as a reply to a joint HELCOM CLIA survey. The dataset covers the whole cruising season (April to October 2014) Sewage discharges 3.4. Comments from cruise ships on port facilities (2014) West Harbour: Due to the size of the hose provided to deliver sewage waters, the back pressure generated reduced the discharge flow rate Maximum number of persons on board per call Maximum capacity of persons onboard including passengers and crew 3.6. Estimated theoretical max. discharge need 1 1 Estimated total discharge capacity needs of cruise ship calls during summer 2014, assuming all wastewater generated after leaving last port of call will be discharged in the port. The presented figures are based the following calculation:. Multiplying this figure with a waste water production estimation in m 3 sewage per person per day would give you the estimated total discharge need in m 3 h -1. More information is available in the Annex I. 27

28 Stockholm (Sweden) UN LOCODE: SESTO Location of the port of Stockholm. The location of the berth is not available. 1. Sewage Port Reception Facilities Fixed reception points for black and grey water are available at all quays used by ferry and cruise ships. The capacity is 300 m 3 /h at all these quays and with an average distance of 60 meters from the ship to the fixed link. Where stationary reception facilities are not available for example when a cruise vessel anchors in the port area but not along the side of a quay the Port can provide tank trucks or a barge with a capacity of 550 m 3 to collect waste water if needed. The disposal of black- and greywater in port is included in the port fee. It is thus a general fee, based on the number of passengers, regardless of if the vessel offloads black- and grey water or not. Planned improvements Additional information The Port of Stockholm has a long history with sewage reception. The first PRFs for ropax was constructed Direct discharge to municipal sewage system available at all quays since All the ferries have exemptions from the delivery of sewage given by the Swedish Transport Agency. 28
29 2. Passenger traffic trends in Stockholm A compilation based on statistics from the Baltic Sea coastal countries national Administrations, regional ports organizations (BPO, ESPO), the publication Baltic Port List and the Nordic Council of Ministers. Cruise ships calls Cruise ships passengers International cruise and ferry passengers 29

30 3. Cruise ship visits in Stockholm The figures 3.1 and 3.2 are generated from the HELCOM AIS data. The dataset covers the period from 2006 to Time at sea from previous port 3.2. Time spent at port per call The figure 3.3 shows discharges reported by cruise industry. The black bar shows the number of ships that did not use the sewage PRF for sewage even if available. It is based on information from 29 CLIA-affiliated cruise ships, received by HELCOM Secretariat as a reply to a joint HELCOM CLIA survey. The dataset covers the whole cruising season (April to October 2014) Sewage discharges 3.4. Comments from cruise ships on port facilities (2014) The distance to PRF depends on which side and berth the ship berths.the distance to the PRF can generate back pressure due to the length of the hose which reduces the discharge flow rate. The discharge can take time because the pumping rate is too low. Comments from ports on cruise ship visits (2014) Vessels normally deliver with flow rates m 3 /h which during an average stay of 8 hours is enough. No need for stipulated 300 m 3 /h Maximum number of persons on board per call Maximum capacity of persons onboard including passengers and crew 3.6. Estimated theoretical max. discharge need 1 1 Estimated total discharge capacity needs of cruise ship calls during summer 2014, assuming all wastewater generated after leaving last port of call will be discharged in the port. The presented figures are based the following calculation:. Multiplying this figure with a waste water production estimation in m 3 sewage per person per day would give you the estimated total discharge need in m 3 h -1. More information is available in the Annex I. 30
.")
31 Rostock (Germany) UN LOCODE: DERSK Berth used by cruise ships according to AIS data during April - October Sewage Port Reception Facilities The cruise port of Rostock-Warnemünde is equipped with a direct connection of the berths to the municipal sewer system (150m3/h as a sum for all berths). Tank trucks are available in the cargo port. Up to 300m³ of sewage is included in the no-special-fee system. Sewage volumes exceeding 300m³ are charged with 3EUR/m³. Sewage from cruise ships (incl. grey water) is accepted only within the defined and published sewage quality parameters. The sewage quality is monitored during the sewage transfer process. In case of a divergency from the published sewage quality the transfer process will be interrupted. Planned improvements An extension of the sewer system took place in early However, no option is available to raise the max. flow rate into the municipal sewer system above 150m³/h by now. As a midterm solution intermediate storage tanks at the terminal may rise the overall volumes which can be accepted. Additional information In 2012 a fixed link to the municipal sewer system became operative at the cruise berths in Warnemünde. The municipal treatment plant accepts sewage with a maximum intake rate of 144m³/h. The acceptance of sewage disposal in Rostock developed as follow: m³ during 71 out of 181 calls m³ during 111 out of 196 calls m³ during 88 out of 182 calls 2015: m : m 3 Rostock is one of the eight ports listed as first priority ports in the 2010 HELCOM Roadmap for upgrading PRF for sewage in passenger ports of the Baltic Sea area. 31
32 2. Passenger traffic trends in Rostock A compilation based on statistics from the Baltic Sea coastal countries national Administrations, regional ports organizations (BPO, ESPO), the publication Baltic Port List and the Nordic Council of Ministers. Cruise ships calls Cruise ships passengers International cruise and ferry passengers 32

33 3. Cruise ship visits in Rostock The figures 3.1 and 3.2 are generated from the HELCOM AIS data. The dataset covers the period from 2006 to Time at sea from previous port 3.2. Time spent at port per call The figure 3.3 shows discharges reported by cruise industry. The black bar shows the number of ships that did not use the sewage PRF for sewage even if available. It is based on information from 29 CLIA-affiliated cruise ships, received by HELCOM Secretariat as a reply to a joint HELCOM CLIA survey. The dataset covers the whole cruising season (April to October 2014) Sewage discharges 3.4. Comments from cruise ships on port facilities (2014) A ship can only discharge 300m 3 for free per port of call Maximum number of persons on board per call Maximum capacity of persons onboard including passengers and crew 3.6. Estimated theoretical max. discharge need 1 1 Estimated total discharge capacity needs of cruise ship calls during summer 2014, assuming all wastewater generated after leaving last port of call will be discharged in the port. The presented figures are based the following calculation:. Multiplying this figure with a waste water production estimation in m 3 sewage per person per day would give you the estimated total discharge need in m 3 h -1. More information is available in the Annex I. 33

34 Kiel (Germany) UN LOCODE: DEKEL Berth used by cruise ships according to AIS data during April - October Sewage Port Reception Facilities Port of Kiel has reception facilities on every cruise/ferry berth. The main cruise terminal Ostseekai is directly connected to the municipal waste water treatment plant and has a capacity of up to 300 m 3 /h or up to 150 m³/h if two ships simultaneously connect to the terminal's facilities. Ship s tonnage is used as a basis for ships included volumes of sewage (no-special-fee). 300 m³ per call for ships up to 60,000 GT, 500 m³ per call for ships from 60,001 GT. Planned improvements Additional information All passenger terminals in the city centre have been equipped with a direct connection to the municipal waste water system during the last years. Larger volumes are subject to extra payment. The seaport has separate suction devices and takes only a transit function. According to practical experience the disposal of the sewage capacity is currently unproblematic in the Port of Kiel. 34
35 2. Passenger traffic trends in Kiel A compilation based on statistics from the Baltic Sea coastal countries national Administrations, regional ports organizations (BPO, ESPO), the publication Baltic Port List and the Nordic Council of Ministers. Cruise ships calls Cruise ships passengers International cruise and ferry passengers 35

36 3. Cruise ship visits in Kiel The figures 3.1 and 3.2 are generated from the HELCOM AIS data. The dataset covers the period from 2006 to Time at sea from previous port 3.2. Time spent at port per call The figure 3.3 shows discharges reported by cruise industry. The black bar shows the number of ships that did not use the sewage PRF for sewage even if available. It is based on information from 29 CLIA-affiliated cruise ships, received by HELCOM Secretariat as a reply to a joint HELCOM CLIA survey. The dataset covers the whole cruising season (April to October 2014) Sewage discharges 3.4. Comments from cruise ships on port facilities (2014) 3.5. Maximum number of persons on board per call Maximum capacity of persons onboard including passengers and crew 3.6. Estimated theoretical max. discharge need 1 1 Estimated total discharge capacity needs of cruise ship calls during summer 2014, assuming all wastewater generated after leaving last port of call will be discharged in the port. The presented figures are based the following calculation:. Multiplying this figure with a waste water production estimation in m 3 sewage per person per day would give you the estimated total discharge need in m 3 h -1. More information is available in the Annex I. 36
.")
37 Gothenburg (Sweden) UN LOCODE: SEGOT Berth used by cruise ships according to AIS data during April - October Sewage Port Reception Facilities Cruise ship berths are available at Arendal Cruise Terminal and at Frihamnen Cruise Terminal (Frihamnen ceases from 2018). Frihamnen will be replaced by America Cruise Terminal in In all locations direct connection to the municipal waste-water treatment plant is available with capacity of m 3 /h. Barge is available with a maximum capacity of 450 m 3. Ferry traffic has their own piers from where they have arranged their sewage discharge. The use of PRF for discharging sewage is included in the port fee. Planned improvements New connection at America Cruise Terminal and at Arendal Cruise Terminal from april Direct connections to the municipal waste-water treatment plant with a capacity of 100 m3/h. Additional information Direct connection from 2009 in Frihamnen, and direct connection from Arendal from Tank trucks. 37
38 2. Passenger traffic trends in Gothenburg A compilation based on statistics from the Baltic Sea coastal countries national Administrations, regional ports organizations (BPO, ESPO), the publication Baltic Port List and the Nordic Council of Ministers. Cruise ships calls Cruise ships passengers International cruise and ferry passengers 38

39 3. Cruise ship visits in Gothenburg The figures 3.1 and 3.2 are generated from the HELCOM AIS data. The dataset covers the period from 2006 to Time at sea from previous port 3.2. Time spent at port per call The figure 3.3 shows discharges reported by cruise industry. The black bar shows the number of ships that did not use the sewage PRF for sewage even if available. It is based on information from 29 CLIA-affiliated cruise ships, received by HELCOM Secretariat as a reply to a joint HELCOM CLIA survey. The dataset covers the whole cruising season (April to October 2014) Sewage discharges 3.4. Comments from cruise ships on port facilities (2014) 3.5. Maximum number of persons on board per call Maximum capacity of persons onboard including passengers and crew 3.6. Estimated theoretical max. discharge need 1 1 Estimated total discharge capacity needs of cruise ship calls during summer 2014, assuming all wastewater generated after leaving last port of call will be discharged in the port. The presented figures are based the following calculation:. Multiplying this figure with a waste water production estimation in m 3 sewage per person per day would give you the estimated total discharge need in m 3 h -1. More information is available in the Annex I. 39

40 Klaipeda (Lithuania) UN LOCODE: LTKJL Berth used by cruise ships according to AIS data during April - October Sewage Port Reception Facilities Port Administration has contract with operator which collects sewages from ships by trucks and barges. No special fee for the use of the facilities. Sewage discharge is included in the sanitary dues. Planned improvements According to a study results on a waste reception facilities, the current waste reception facilities are sufficient to ensure arriving ship waste reception needs. Currently sewage reception facilities at the Cruise Ship Terminal and the Fishing Marina are being designed. According to the project, sewage will be directly discharged to the municipal sewage system. Additional information Klaipeda was listed as having adequate PRF for sewage in the 2010 HELCOM Roadmap for upgrading PRF for sewage in passenger ports of the Baltic Sea area. 40
41 2. Passenger traffic trends in Klaipeda A compilation based on statistics from the Baltic Sea coastal countries national Administrations, regional ports organizations (BPO, ESPO), the publication Baltic Port List and the Nordic Council of Ministers. Cruise ships calls Cruise ships passengers International cruise and ferry passengers 41

42 3. Cruise ship visits in Klaipeda The figures 3.1 and 3.2 are generated from the HELCOM AIS data. The dataset covers the period from 2006 to Time at sea from previous port 3.2. Time spent at port per call The figure 3.3 shows discharges reported by cruise industry. The black bar shows the number of ships that did not use the sewage PRF for sewage even if available. It is based on information from 29 CLIA-affiliated cruise ships, received by HELCOM Secretariat as a reply to a joint HELCOM CLIA survey. The dataset covers the whole cruising season (April to October 2014) Sewage discharges 3.4. Comments from cruise ships on port facilities (2014) 3.5. Maximum number of persons on board per call Maximum capacity of persons onboard including passengers and crew 3.6. Estimated theoretical max. discharge need 1 1 Estimated total discharge capacity needs of cruise ship calls during summer 2014, assuming all wastewater generated after leaving last port of call will be discharged in the port. The presented figures are based the following calculation:. Multiplying this figure with a waste water production estimation in m 3 sewage per person per day would give you the estimated total discharge need in m 3 h -1. More information is available in the Annex I. 42

43 Riga (Latvia) UN LOCODE: LVRIX Berth used by cruise ships according to AIS data during April - October Sewage Port Reception Facilities The quays are served by mobile reception facilities 3 tank trucks with capacity 30m³ each and 1 barge with max capacity 450 m 3. No direct discharge to municipal sewage system available. Sanitary fee charged from each ship includes delivery of sewage from passenger ships up to 200 m 3 per call. Sewage volumes exceeding 200 m 3 is charged at fixed rates per m 3. Planned improvements Additional information Riga is one of the eight ports listed as first priority ports in the 2010 HELCOM Roadmap for upgrading PRF for sewage in passenger ports of the Baltic Sea area. 43
44 2. Passenger traffic trends in Riga A compilation based on statistics from the Baltic Sea coastal countries national Administrations, regional ports organizations (BPO, ESPO), the publication Baltic Port List and the Nordic Council of Ministers. Cruise ships calls Cruise ships passengers International passengers 44

. 3.3. Sewage discharges 3.4. Comments from cruise ships on port facilities (2014) 3.5.")
45 3. Cruise ship visits in Riga The figures 3.1 and 3.2 are generated from the HELCOM AIS data. The dataset covers the period from 2006 to Time at sea from previous port 3.2. Time spent at port per call The figure 3.3 shows discharges reported by cruise industry. The black bar shows the number of ships that did not use the sewage PRF for sewage even if available. It is based on information from 29 CLIA-affiliated cruise ships, received by HELCOM Secretariat as a reply to a joint HELCOM CLIA survey. The dataset covers the whole cruising season (April to October 2014) Sewage discharges 3.4. Comments from cruise ships on port facilities (2014) 3.5. Maximum number of persons on board per call Maximum capacity of persons onboard including passengers and crew 3.6. Estimated theoretical max. discharge need 1 1 Estimated total discharge capacity needs of cruise ship calls during summer 2014, assuming all wastewater generated after leaving last port of call will be discharged in the port. The presented figures are based the following calculation:. Multiplying this figure with a waste water production estimation in m 3 sewage per person per day would give you the estimated total discharge need in m 3 h -1. More information is available in the Annex I. 45
, 2 portable tanks 11 and 12 m 3.")
46 Gdynia (Poland) UN LOCODE: PLGDY Port area used by cruise ships according to the national Administration 1. Sewage Port Reception Facilities Tank trucks are used for cruise ships. 3 tank trucks (5 m 3, 7m 3, 10m 3 ), 2 portable tanks 11 and 12 m 3. Two fixed PRFs for receiving sewage form ferry Stena Vision (Stena Line):: Swedish and Danish quays 2-4 have a maximum capacity of 20 m 3 /h. Bulgarian and Closing quays have a maximum capacity of 35 m 3 /h. The Romanian quay has a maximum capacity of 40 m 3 /h. One third of all delivered amount of sewage from ferries and cruise ships are received without additional fee. In connection with tonnage fee, the following limits of ship-generated waste to be collected without additional fees have been set for sewage delivery: ( odarka_odpadami/215_strona%20internetowa_nowe%20stawki %20i%20limity_en.pdf) Planned improvements 1. French Quay - for cruises - to be finished by 1 st June The maximum capacity will be 200 m 3 /h. 2. Polish Quay - for the new ferry terminal - to be finished by 1st January 2020 (maximum capacity of 105 m 3 /h). Upgrading works on other quays will be done gradually, according to Port of Gdynia implementation schedule. Additional information A preparatory study Conception of sewage collecting in the Port of Gdynia was completed in Gdynia is one of the eight ports listed as first priority ports in the 2010 HELCOM Roadmap for upgrading PRF for sewage in passenger ports of the Baltic Sea area. 46
47 2. Passenger traffic trends in Gdynia A compilation based on statistics from the Baltic Sea coastal countries national Administrations, regional ports organizations (BPO, ESPO), the publication Baltic Port List and the Nordic Council of Ministers. Cruise ships calls Cruise ships passengers International passengers 47

. 3.")
48 3. Cruise ship visits in Gdynia The figures 3.1 and 3.2 are generated from the HELCOM AIS data. The dataset covers the period from 2006 to Time at sea from previous port 3.2. Time spent at port per call The figure 3.3 shows discharges reported by cruise industry. The black bar shows the number of ships that did not use the sewage PRF for sewage even if available. It is based on information from 29 CLIA-affiliated cruise ships, received by HELCOM Secretariat as a reply to a joint HELCOM CLIA survey. The dataset covers the whole cruising season (April to October 2014) Sewage discharges Total sewage discharges from passenger ships in m3: ; ; , ; ; Comments from cruise ships on port facilities (2014) 3.5. Maximum number of persons on board per call Maximum capacity of persons onboard including passengers and crew 3.6. Estimated theoretical max. discharge need 1 1 Estimated total discharge capacity needs of cruise ship calls during summer 2014, assuming all wastewater generated after leaving last port of call will be discharged in the port. The presented figures are based the following calculation:. Multiplying this figure with a waste water production estimation in m 3 sewage per person per day would give you the estimated total discharge need in m 3 h -1. More information is available in the Annex I. 48

49 Gdansk (Poland) UN LOCODE: PLGDN Berth used by cruise ships according to AIS data during April - October Sewage Port Reception Facilities Reception of sewage from passenger ships is conducted by 3 tank trucks of capacities 15 m 3 /h each, which are adequate for current needs. Passenger ships entering Port of Gdansk are allowed to discharge 1/3 of sewage in accordance with the tonnage tariff. The rest of the sewage is charged at the fixed rates that can be found on the port s website: Planned improvements There are currently three quays: Nabrzeże Ziółkowskiego and Nabrzeże Westerplatte, and Północne that are being adjusted to receive sewage from passenger ship s via fixed connection. The works include construction of fixed PRF for direct discharge of sewage into port s wastewater collecting system. In the case of Pólnocne and Westerplatte quays, the sewage will end up at the and port s mechanical-biological sewage treatment plant, whereas it is planned that all sewage will be discharged directly to municipal sewage system (currently only sewage from Ziólkowskiego quay ends up at municipal sewage system). Planned infrastructure at N. Ziółkowskiego Quay: 2 fixed PRF directly connected to port s sewage system, and a reservoir. Planned capacity of PRF at each point 30 m3/h. The construction works will commence in Planned infrastructure at N. Westerplatte Pier: 5 fixed PRF directly connected to mechanical-biological sewage treatment plant.. Planned capacity of PRF at each point: 50 m3/h. The construction works will be finished in September New quay - Północne will also be constructed with the planned capacity of PRF for sewage: 50 m3/h. Initially, PRF will also be connected to port s mechanical-biological sewage treatment plant. The construction works will commence in Additional information 49
50 2. Passenger traffic trends in Gdansk A compilation based on statistics from the Baltic Sea coastal countries national Administrations, regional ports organizations (BPO, ESPO), the publication Baltic Port List and the Nordic Council of Ministers. Cruise ships calls Cruise ships passengers International cruise and ferry passengers 50

51 3. Cruise ship visits in Gdansk The figures 3.1 and 3.2 are generated from the HELCOM AIS data. The dataset covers the period from 2006 to Time at sea from previous port 3.2. Time spent at port per call The figure 3.3 shows discharges reported by cruise industry. The black bar shows the number of ships that did not use the sewage PRF for sewage even if available. It is based on information from 29 CLIA-affiliated cruise ships, received by HELCOM Secretariat as a reply to a joint HELCOM CLIA survey. The dataset covers the whole cruising season (April to October 2014) Sewage discharges 3.4. Comments from cruise ships on port facilities (2014) 3.5. Maximum number of persons on board per call Maximum capacity of persons onboard including passengers and crew 3.6. Estimated theoretical max. discharge need 1 1 Estimated total discharge capacity needs of cruise ship calls during summer 2014, assuming all wastewater generated after leaving last port of call will be discharged in the port. The presented figures are based the following calculation:. Multiplying this figure with a waste water production estimation in m 3 sewage per person per day would give you the estimated total discharge need in m 3 h -1. More information is available in the Annex I. 51
, PRF facilities connected to the municipal sewage system are available with a capacity of ca 16-20 m 3 per hour.")
52 Visby (Sweden) UN LOCODE: SEVBY Berth used by cruise ships according to AIS data during April - October Sewage Port Reception Facilities At al the main berths (4, 5, 6, 7), PRF facilities connected to the municipal sewage system are available with a capacity of ca m 3 per hour. General waste fee of 0,40 SEK/GT, included in the vessel fee. There is no statistics on all international passengers but regular ferry traffic to Oskarshamn and Nynäshamn carries around passengers/ year (they use berth 5 and 6, the cruise ships 4 and 7). Planned improvements Additional information Visby was listed as having adequate PRF for sewage in the 2010 HELCOM Roadmap for upgrading PRF for sewage in passenger ports of the Baltic Sea area. 52
53 2. Passenger traffic trends in Visby A compilation based on statistics from the Baltic Sea coastal countries national Administrations, regional ports organizations (BPO, ESPO), the publication Baltic Port List and the Nordic Council of Ministers. Cruise ships calls Cruise ships passengers International cruise and ferry passengers 53
54 3. Cruise ship visits in Visby The figures 3.1 and 3.2 are generated from the HELCOM AIS data. The dataset covers the period from 2006 to Time at sea from previous port 3.2. Time spent at port per call The figure 3.3 shows discharges reported by cruise industry. The black bar shows the number of ships that did not use the sewage PRF for sewage even if available. It is based on information from 29 CLIA-affiliated cruise ships, received by HELCOM Secretariat as a reply to a joint HELCOM CLIA survey. The dataset covers the whole cruising season (April to October 2014) Sewage discharges 3.4. Comments from cruise ships on port facilities (2014) Several ships were at anchor when visiting Visby. None of them discharged sewage to the port Maximum number of persons on board per call Maximum capacity of persons onboard including passengers and crew 3.6. Estimated theoretical max. discharge need 1 1 Estimated total discharge capacity needs of cruise ship calls during summer 2014, assuming all wastewater generated after leaving last port of call will be discharged in the port. The presented figures are based the following calculation:. Multiplying this figure with a waste water production estimation in m 3 sewage per person per day would give you the estimated total discharge need in m 3 h -1. More information is available in the Annex I. 54

55 Rönne - Bornholm (Denmark) UN LOCODE: DKRNN Berth used by cruise ships according to AIS data during April - October Sewage Port Reception Facilities Planned improvements Additional information 2. Passenger traffic trends in Rönne Bornholm A compilation based on statistics from the Baltic Sea coastal countries national Administrations, regional ports organizations (BPO, ESPO), the publication Baltic Port List and the Nordic Council of Ministers. Cruise ships calls Cruise ships passengers International passengers

. 3.3. Sewage discharges 3.4. Comments from cruise ships on port facilities (2014) 3.5.")

56 3. Cruise ship visits in Rönne - Bornholm The figures 3.1 and 3.2 are generated from the HELCOM AIS data. The dataset covers the period from 2006 to Time at sea from previous port 3.2. Time spent at port per call The figure 3.3 shows discharges reported by cruise industry. The black bar shows the number of ships that did not use the sewage PRF for sewage even if available. It is based on information from 29 CLIA-affiliated cruise ships, received by HELCOM Secretariat as a reply to a joint HELCOM CLIA survey. The dataset covers the whole cruising season (April to October 2014) Sewage discharges 3.4. Comments from cruise ships on port facilities (2014) 3.5. Maximum number of persons on board per call Maximum capacity of persons onboard including passengers and crew 3.6. Estimated theoretical max. discharge need 1 1 Estimated total discharge capacity needs of cruise ship calls during summer 2014, assuming all wastewater generated after leaving last port of call will be discharged in the port. The presented figures are based the following calculation:. Multiplying this figure with a waste water production estimation in m 3 sewage per person per day would give you the estimated total discharge need in m 3 h -1. More information is available in the Annex I. 56

57 Mariehamn (Finland) UN LOCODE: FIMHQ Berth used by cruise ships according to AIS data during April - October Sewage Port Reception Facilities Sewage PRF facilities available and adequate with a pumping capacity of 30m 3 /h. The use of the facilities is free. Planned improvements Not in the near future. Additional information 57
58 2. Passenger traffic trends in Mariehamn A compilation based on statistics from the Baltic Sea coastal countries national Administrations, regional ports organizations (BPO, ESPO), the publication Baltic Port List and the Nordic Council of Ministers. Cruise ships calls Cruise ships passengers International cruise and ferry passengers 58

. 3.")
 Comments from ports on cruise ship visits (2018) From 2015 the discharge of sewage has increased. At 2017 15 of 19 cruise vessels used the PRF.")
59 3. Cruise ship visits in Mariehamn The figures 3.1 and 3.2 are generated from the HELCOM AIS data. The dataset covers the period from 2006 to Time at sea from previous port 3.2. Time spent at port per call The figure 3.3 shows discharges reported by cruise industry. The black bar shows the number of ships that did not use the sewage PRF for sewage even if available. It is based on information from 29 CLIA-affiliated cruise ships, received by HELCOM Secretariat as a reply to a joint HELCOM CLIA survey. The dataset covers the whole cruising season (April to October 2014) Sewage discharges Cruise ships have so far not used Mariehamn sewage PRF facilities even if available according to port information reported to Nordic Council (Nordiska Rådet) in Comments from cruise ships on port facilities (2014) Comments from ports on cruise ship visits (2018) From 2015 the discharge of sewage has increased. At of 19 cruise vessels used the PRF. Most of the ships have short voyages before entering Mariehamn. Last port is often Stockholm or Helsinki Maximum number of persons on board per call Maximum capacity of persons onboard including passengers and crew 3.6. Estimated theoretical max. discharge need 1 1 Estimated total discharge capacity needs of cruise ship calls during summer 2014, assuming all wastewater generated after leaving last port of call will be discharged in the port. The presented figures are based the following calculation:. Multiplying this figure with a waste water production estimation in m 3 sewage per person per day would give you the estimated total discharge need in m 3 h -1. More information is available in the Annex I. 59
 and discharged at the central sewage treatment plant.")
60 Lübeck, including Travemünde (Germany) UN LOCODE: DELBC Berth used by cruise ships according to AIS data during April - October Sewage Port Reception Facilities At the port of Lübeck sewage can be collected by tank trucks or barges (private operators) and discharged at the central sewage treatment plant. No direct discharge to sewer system. The no-special-fee contains a part of 0,001 /GT for waste water (black water). On presentation of a receipt for disposal of waste water, this fee is paid back by the Port Operator. Planned improvements A direct discharge-connection to the public sewer system is planned to be installed at the Ostpreussenkai in 2018 and be ready for operation in It will allow a flow rate of ~36 m³/h and a total amount of 400 m³ per port call. Additional information After operational experience at Ostpreußenkai new evaluation for Skandinavienkai in discussion. 60
61 2. Passenger traffic trends in Lübeck (incl. Travemünde) A compilation based on statistics from the Baltic Sea coastal countries national Administrations, regional ports organizations (BPO, ESPO), the publication Baltic Port List and the Nordic Council of Ministers. Cruise ships calls Cruise ships passengers International cruise and ferry passengers 61

62 3. Cruise ship visits in Lübeck (including Travemünde) The figures 3.1 and 3.2 are generated from the HELCOM AIS data. The dataset covers the period from 2006 to Time at sea from previous port 3.2. Time spent at port per call The figure 3.3 shows discharges reported by cruise industry. The black bar shows the number of ships that did not use the sewage PRF for sewage even if available. It is based on information from 29 CLIA-affiliated cruise ships, received by HELCOM Secretariat as a reply to a joint HELCOM CLIA survey. The dataset covers the whole cruising season (April to October 2014) Sewage discharges The Lübeck port has not yet disposed of contaminated water from cruise ships by Comments from cruise ships on port facilities (2014) Comments from ports on cruise ship visits (2014) There is enough capacity, but little demand Maximum number of persons on board per call Maximum capacity of persons onboard including passengers and crew 3.6. Estimated theoretical max. discharge need 1 1 Estimated total discharge capacity needs of cruise ship calls during summer 2014, assuming all wastewater generated after leaving last port of call will be discharged in the port. The presented figures are based the following calculation:. Multiplying this figure with a waste water production estimation in m 3 sewage per person per day would give you the estimated total discharge need in m 3 h -1. More information is available in the Annex I. 62

63 Malmö (Sweden) UN LOCODE: SEMMA Berth used by cruise ships according to AIS data during April - October Sewage Port Reception Facilities Tank trucks are available. No special fee for discharging sewage to the facilities. Planned improvements Additional information 63
64 2. Passenger traffic trends in Malmö A compilation based on statistics from the Baltic Sea coastal countries national Administrations, regional ports organizations (BPO, ESPO), the publication Baltic Port List and the Nordic Council of Ministers. Cruise ships calls Cruise ships passengers International cruise and ferry passengers 64
65 3. Cruise ship visits in Malmö The figures 3.1 and 3.2 are generated from the HELCOM AIS data. The dataset covers the period from 2006 to Time at sea from previous port 3.2. Time spent at port per call The figure 3.3 shows discharges reported by cruise industry. The black bar shows the number of ships that did not use the sewage PRF for sewage even if available. It is based on information from 29 CLIA-affiliated cruise ships, received by HELCOM Secretariat as a reply to a joint HELCOM CLIA survey. The dataset covers the whole cruising season (April to October 2014) Sewage discharges 3.4. Comments from cruise ships on port facilities (2014) 3.5. Maximum number of persons on board per call Maximum capacity of persons onboard including passengers and crew 3.6. Estimated theoretical max. discharge need 1 1 Estimated total discharge capacity needs of cruise ship calls during summer 2014, assuming all wastewater generated after leaving last port of call will be discharged in the port. The presented figures are based the following calculation:. Multiplying this figure with a waste water production estimation in m 3 sewage per person per day would give you the estimated total discharge need in m 3 h -1. More information is available in the Annex I. 65

66 Wismar (Germany) UN LOCODE: DEWIS Berth used by cruise ships according to AIS data during April - October Sewage Port Reception Facilities At the port of Wismar sewage can be collected by tank and discharged at the central sewage treatment plant. For the moment no direct discharge to sewer system.. Planned improvements At the port of Wismar sewage can be collected by tank and discharged at the central sewage treatment plant. For the moment no direct discharge to sewer system. Additional information 66
67 2. Passenger traffic trends in Wismar A compilation based on statistics from the Baltic Sea coastal countries national Administrations, regional ports organizations (BPO, ESPO), the publication Baltic Port List and the Nordic Council of Ministers. Cruise ships calls Cruise ships passengers: International cruise and ferry passengers: 67

68 3. Cruise ship visits in Wismar The figures 3.1 and 3.2 are generated from the HELCOM AIS data. The dataset covers the period from 2006 to Time at sea from previous port 3.2. Time spent at port per call The figure 3.3 shows discharges reported by cruise industry. The black bar shows the number of ships that did not use the sewage PRF for sewage even if available. It is based on information from 29 CLIA-affiliated cruise ships, received by HELCOM Secretariat as a reply to a joint HELCOM CLIA survey. The dataset covers the whole cruising season (April to October 2014) Sewage discharges 3.4. Comments from cruise ships on port facilities (2014) 3.5. Maximum number of persons on board per call Maximum capacity of persons onboard including passengers and crew 3.6. Estimated theoretical max. discharge need 1 1 Estimated total discharge capacity needs of cruise ship calls during summer 2014, assuming all wastewater generated after leaving last port of call will be discharged in the port. The presented figures are based the following calculation:. Multiplying this figure with a waste water production estimation in m 3 sewage per person per day would give you the estimated total discharge need in m 3 h -1. More information is available in the Annex I. 68

69 Aarhus (Denmark) UN LOCODE: DKAAR Berth used by cruise ships according to AIS data during April - October Sewage Port Reception Facilities Planned improvements Additional information 2. Passenger traffic trends in Aarhus A compilation based on statistics from the Baltic Sea coastal countries national Administrations, regional ports organizations (BPO, ESPO), the publication Baltic Port List and the Nordic Council of Ministers. Cruise ships calls Cruise ships passengers International cruise and ferry passengers 69

70 3. Cruise ship visits in Aarhus The figures 3.1 and 3.2 are generated from the HELCOM AIS data. The dataset covers the period from 2006 to Time at sea from previous port 3.2. Time spent at port per call The figure 3.3 shows discharges reported by cruise industry. The black bar shows the number of ships that did not use the sewage PRF for sewage even if available. It is based on information from 29 CLIA-affiliated cruise ships, received by HELCOM Secretariat as a reply to a joint HELCOM CLIA survey. The dataset covers the whole cruising season (April to October 2014) Sewage discharges 3.4. Comments from cruise ships on port facilities (2014) 3.5. Maximum number of persons on board per call Maximum capacity of persons onboard including passengers and crew 3.6. Estimated theoretical max. discharge need 1 1 Estimated total discharge capacity needs of cruise ship calls during summer 2014, assuming all wastewater generated after leaving last port of call will be discharged in the port. The presented figures are based the following calculation:. Multiplying this figure with a waste water production estimation in m 3 sewage per person per day would give you the estimated total discharge need in m 3 h -1. More information is available in the Annex I. 70
.")
71 Saaremaa (Estonia) UN LOCODE: EESMA Berth used by cruise ships according to AIS data during April - October 2014 A port on the North side of Saaremaa island (Küdema Bay). Operated by the Tallinn port authority. 1. Sewage Port Reception Facilities The only possible solution is to receive sewage by truck (up to 18m3 per day), because there is no municipal sewage network available in the area. Saaremaa Harbour is in remote location (north-western coast of the island) and wastewater treatment plant is located approx. 45 km away from the port. Waste fee charged on every ship. Sewage exceeding 7m 3 is subject to extra payment. Planned improvements Additional information 71
72 2. Passenger traffic trends in Saaremaa A compilation based on statistics from the Baltic Sea coastal countries national Administrations, regional ports organizations (BPO, ESPO), the publication Baltic Port List and the Nordic Council of Ministers. Cruise ships calls Cruise ships passengers International cruise and ferry passengers 72

73 3. Cruise ship visits in Saaremaa The figures 3.1 and 3.2 are generated from the HELCOM AIS data. The dataset covers the period from 2006 to Time at sea from previous port 3.2. Time spent at port per call The figure 3.3 shows discharges reported by cruise industry. The black bar shows the number of ships that did not use the sewage PRF for sewage even if available. It is based on information from 29 CLIA-affiliated cruise ships, received by HELCOM Secretariat as a reply to a joint HELCOM CLIA survey. The dataset covers the whole cruising season (April to October 2014) Sewage discharges 3.4. Comments from cruise ships on port facilities (2014) When the tank truck was not available, the ship had the authorization to off-load the sewage on the next day during the port of call in Tallinn with no extra cost. No ship delivered sewage to the port of Saaremaa Maximum number of persons on board per call Maximum capacity of persons onboard including passengers and crew 3.6. Estimated theoretical max. discharge need 1 1 Estimated total discharge capacity needs of cruise ship calls during summer 2014, assuming all wastewater generated after leaving last port of call will be discharged in the port. The presented figures are based the following calculation:. Multiplying this figure with a waste water production estimation in m 3 sewage per person per day would give you the estimated total discharge need in m 3 h -1. More information is available in the Annex I. 73

74 Sassnitz, including Mukran (Germany) UN LOCODE: DESAS Berth used by cruise ships according to AIS data during April - October Sewage Port Reception Facilities Im 2017 and 2018, no sewage from cruise ships has been / will be discharged in Mukran. Planned improvements Sewage discharge and disposal facilities for future calls are currently being built. Additional information 2. Passenger traffic trends in Sassnitz A compilation based on statistics from the Baltic Sea coastal countries national Administrations, regional ports organizations (BPO, ESPO), the publication Baltic Port List and the Nordic Council of Ministers. Cruise ships calls Cruise ships passengers International cruise and ferry passengers

. 3.3. Sewage discharges 3.4. Comments from cruise ships on port facilities (2014) 3.5.")
75 3. Cruise ship visits in Sassnitz, including Mukran The figures 3.1 and 3.2 are generated from the HELCOM AIS data. The dataset covers the period from 2006 to Time at sea from previous port 3.2. Time spent at port per call The figure 3.3 shows discharges reported by cruise industry. The black bar shows the number of ships that did not use the sewage PRF for sewage even if available. It is based on information from 29 CLIA-affiliated cruise ships, received by HELCOM Secretariat as a reply to a joint HELCOM CLIA survey. The dataset covers the whole cruising season (April to October 2014) Sewage discharges 3.4. Comments from cruise ships on port facilities (2014) 3.5. Maximum number of persons on board per call Maximum capacity of persons onboard including passengers and crew 3.6. Estimated theoretical max. discharge need 1 1 Estimated total discharge capacity needs of cruise ship calls during summer 2014, assuming all wastewater generated after leaving last port of call will be discharged in the port. The presented figures are based the following calculation:. Multiplying this figure with a waste water production estimation in m 3 sewage per person per day would give you the estimated total discharge need in m 3 h -1. More information is available in the Annex I. 75
 regularly collect sewage from vessels, which can be ordered to remove sewage: Polex- Eko LLC,")
76 Kaliningrad (Russia) UN LOCODE: RUKGD Berth used by cruise ships according to AIS data during April - October Sewage Port Reception Facilities In the Seaport of Kaliningrad, two organizations (licensed operators) regularly collect sewage from vessels, which can be ordered to remove sewage: Polex- Eko LLC, Kaliningrad Sea Fishing Port - Kaliningrad Branch of FSUE Natsrybresurs. The above organizations used special vessels for collection sewage. Then, the sewage is transfered to truck and transported to municipal sewage treatment plant of Kaliningrad. Points of direct connection to municipal sewerage in the territory of the Seaport of Kaliningrad are absent. There is the similar scheme of sewage water delivery to PRF in the Kaliningrad Sea Fishing Port. Planned improvements The development associated with the expansion and modernization of PRF for the collection of sewage from ships entering the seaport of Kaliningrad is not planned. Additional information Based on the information provided by economic entities that collect ship waste, the discharge of sewage from passenger and cruise ships calling at the seaport of Kaliningrad in the period from 2006 to 2017 did not carried out. Stationary reception facilities for collection and accumulation of sewage from ships in the territory of the seaport of Kaliningrad are absent. 2. Passenger traffic trends in Kaliningrad A compilation based on statistics from the Baltic Sea coastal countries national Administrations, regional ports organizations (BPO, ESPO), the publication Baltic Port List and the Nordic Council of Ministers. 76
77 2. Passenger traffic trends in Kaliningrad A compilation based on statistics from the Baltic Sea coastal countries national Administrations, regional ports organizations (BPO, ESPO), the publication Baltic Port List and the Nordic Council of Ministers. Cruise ships calls Cruise ships passengers International cruise and ferry passengers 77

78 3. Cruise ship visits in Kaliningrad The figures 3.1 and 3.2 are generated from the HELCOM AIS data. The dataset covers the period from 2006 to Time at sea from previous port 3.2. Time spent at port per call The figure 3.3 shows discharges reported by cruise industry. The black bar shows the number of ships that did not use the sewage PRF for sewage even if available. It is based on information from 29 CLIA-affiliated cruise ships, received by HELCOM Secretariat as a reply to a joint HELCOM CLIA survey. The dataset covers the whole cruising season (April to October 2014) Sewage discharges 3.4. Comments from cruise ships on port facilities (2014) 3.5. Maximum number of persons on board per call Maximum capacity of persons onboard including passengers and crew 3.6. Estimated theoretical max. discharge need 1 1 Estimated total discharge capacity needs of cruise ship calls during summer 2014, assuming all wastewater generated after leaving last port of call will be discharged in the port. The presented figures are based the following calculation:. Multiplying this figure with a waste water production estimation in m 3 sewage per person per day would give you the estimated total discharge need in m 3 h -1. More information is available in the Annex I. 78

79 Kalundborg (Denmark) UN LOCODE: DKKAL Berth used by cruise ships according to AIS data during April - October Sewage Port Reception Facilities Planned improvements Additional information 2. Passenger traffic trends in Kalundborg A compilation based on statistics from the Baltic Sea coastal countries national Administrations, regional ports organizations (BPO, ESPO), the publication Baltic Port List and the Nordic Council of Ministers. Cruise ships calls Cruise ships passengers International cruise and ferry passengers 79

80 3. Cruise ship visits in Kalundborg The figures 3.1 and 3.2 are generated from the HELCOM AIS data. The dataset covers the period from 2006 to Time at sea from previous port 3.2. Time spent at port per call The figure 3.3 shows discharges reported by cruise industry. The black bar shows the number of ships that did not use the sewage PRF for sewage even if available. It is based on information from 29 CLIA-affiliated cruise ships, received by HELCOM Secretariat as a reply to a joint HELCOM CLIA survey. The dataset covers the whole cruising season (April to October 2014) Sewage discharges 3.4. Comments from cruise ships on port facilities (2014) 3.5. Maximum number of persons on board per call Maximum capacity of persons onboard including passengers and crew 3.6. Estimated theoretical max. discharge need 1 1 Estimated total discharge capacity needs of cruise ship calls during summer 2014, assuming all wastewater generated after leaving last port of call will be discharged in the port. The presented figures are based the following calculation:. Multiplying this figure with a waste water production estimation in m 3 sewage per person per day would give you the estimated total discharge need in m 3 h -1. More information is available in the Annex I. 80

81 Helsingborg (Sweden) UN LOCODE: SEHEL Berth used by cruise ships according to AIS data during April - October Sewage Port Reception Facilities Tank trucks are available for cruise ships, 30 m3/h. Ferry companies arrange for their PRF for sewage at their own pier, which is a direct connection to municipal waste-water treatment plant. The discharge of sewage to the port is included. Mostly ferry traffic. A few cruise ships per year, some of them anchor outside the port due to they are too large to enter the port. Planned improvements No change in 2018 Additional information No change in
82 2. Passenger traffic trends in Helsingborg A compilation based on statistics from the Baltic Sea coastal countries national Administrations, regional ports organizations (BPO, ESPO), the publication Baltic Port List and the Nordic Council of Ministers. Cruise ships calls Cruise ships passengers International cruise and ferry passengers 82

. 3.3. Sewage discharges Cruise ships are normally not discharging sewage, due to only a couple of hours in port. 3.4. Comments from cruise ships on port facilities (2014) 3.")
83 3. Cruise ship visits in Helsingborg The figures 3.1 and 3.2 are generated from the HELCOM AIS data. The dataset covers the period from 2006 to Time at sea from previous port 3.2. Time spent at port per call The figure 3.3 shows discharges reported by cruise industry. The black bar shows the number of ships that did not use the sewage PRF for sewage even if available. It is based on information from 29 CLIA-affiliated cruise ships, received by HELCOM Secretariat as a reply to a joint HELCOM CLIA survey. The dataset covers the whole cruising season (April to October 2014) Sewage discharges Cruise ships are normally not discharging sewage, due to only a couple of hours in port Comments from cruise ships on port facilities (2014) 3.5. Maximum number of persons on board per call Maximum capacity of persons onboard including passengers and crew 3.6. Estimated theoretical max. discharge need 1 1 Estimated total discharge capacity needs of cruise ship calls during summer 2014, assuming all wastewater generated after leaving last port of call will be discharged in the port. The presented figures are based the following calculation:. Multiplying this figure with a waste water production estimation in m 3 sewage per person per day would give you the estimated total discharge need in m 3 h -1. More information is available in the Annex I. 83

84 Szczecin, including Świnoujście (Poland) UN LOCODE: PLSZZ Berth used by cruise ships according to AIS data during April - October Sewage Port Reception Facilities Reception of sewage from cruise ships or ferries is currently carried by the tank trucks which transport sewage to municipal WWTP (1 truck of capacity 30m 3, 1 barge of capacity 30 m 3 ). More trucks or a barge with larger capacity can also be arranged by the port if needed. There was no cruise ships discharging sewage at the port in Planned improvements The construction works for the fixed PRF for sewage at the Ferry Terminal in Świnoujście are planned to commence in September 2019 and will be completed in June Until then the reception of sewage from ferries in Port of Świnoujście will be ensured by the specialized barge and/or tank trucks adjusted to the ships demands. Additional information 84
85 1. Passenger traffic trends in Szczecin, including Świnoujście A compilation based on statistics from the Baltic Sea coastal countries national Administrations, regional ports organizations (BPO, ESPO), the publication Baltic Port List and the Nordic Council of Ministers. Cruise ships calls Cruise ships passengers International cruise and ferry passengers 85

")
 Comments from ports on cruise ship visits (2017) In 2017 there were 5 cruise ships calls in Port of Szczecin.")
86 3. Cruise ship visits in Szczecin, including Świnoujście The figures 3.1 and 3.2 are generated from the HELCOM AIS data. The dataset covers the period from 2006 to Time at sea from previous port 3.2. Time spent at port per call The figure 3.3 shows discharges reported by cruise industry. The black bar shows the number of ships that did not use the sewage PRF for sewage even if available. It is based on information from 29 CLIA-affiliated cruise ships, received by HELCOM Secretariat as a reply to a joint HELCOM CLIA survey. The dataset covers the whole cruising season (April to October 2014) Sewage discharges In 2017 fixed route ferry lines have delivered 76,6 m3 sewage at the port of Świnoujście 3.4. Comments from cruise ships on port facilities (2014) Comments from ports on cruise ship visits (2017) In 2017 there were 5 cruise ships calls in Port of Szczecin. The cruise ships have not delivered any sewage at the ports. Port of Świnoujście operates 12 fixed route ferry lines Maximum number of persons on board per call Maximum capacity of persons onboard including passengers and crew 3.6. Estimated theoretical max. discharge need 1 1 Estimated total discharge capacity needs of cruise ship calls during summer 2014, assuming all wastewater generated after leaving last port of call will be discharged in the port. The presented figures are based the following calculation:. Multiplying this figure with a waste water production estimation in m 3 sewage per person per day would give you the estimated total discharge need in m 3 h -1. More information is available in the Annex I. 86
, the publication")
87 Flensburg (Germany) UN LOCODE: DEFL Berth used by cruise ships according to AIS data during April - October Sewage Port Reception Facilities Planned improvements Additional information 2. Passenger traffic trends in Flensburg A compilation based on statistics from the Baltic Sea coastal countries national Administrations, regional ports organizations (BPO, ESPO), the publication Baltic Port List and the Nordic Council of Ministers. Cruise ships calls Cruise ships passengers International passengers 87

88 3. Cruise ship visits in Flensburg The figures 3.1 and 3.2 are generated from the HELCOM AIS data. The dataset covers the period from 2006 to Time at sea from previous port 3.2. Time spent at port per call The figure 3.3 shows discharges reported by cruise industry. The black bar shows the number of ships that did not use the sewage PRF for sewage even if available. It is based on information from 29 CLIA-affiliated cruise ships, received by HELCOM Secretariat as a reply to a joint HELCOM CLIA survey. The dataset covers the whole cruising season (April to October 2014) Sewage discharges 3.4. Comments from cruise ships on port facilities (2014) 3.5. Maximum number of persons on board per call Maximum capacity of persons onboard including passengers and crew 3.6. Estimated theoretical max. discharge need 1 1 Estimated total discharge capacity needs of cruise ship calls during summer 2014, assuming all wastewater generated after leaving last port of call will be discharged in the port. The presented figures are based the following calculation:. Multiplying this figure with a waste water production estimation in m 3 sewage per person per day would give you the estimated total discharge need in m 3 h -1. More information is available in the Annex I. 88

89 Karlskrona (Sweden) UN LOCODE: SEKAA Berth used by cruise ships according to AIS data during April - October Sewage Port Reception Facilities Planned improvements Additional information 89
90 2. Passenger traffic trends in Karlskrona A compilation based on statistics from the Baltic Sea coastal countries national Administrations, regional ports organizations (BPO, ESPO), the publication Baltic Port List and the Nordic Council of Ministers. Cruise ships calls Cruise ships passengers International cruise and ferry passengers 90

. 3.3. Sewage discharges 3.4. Comments from cruise ships on port facilities (2014) 3.5.")
91 3. Cruise ship visits in Karlskrona The figures 3.1 and 3.2 are generated from the HELCOM AIS data. The dataset covers the period from 2006 to Time at sea from previous port 3.2. Time spent at port per call The figure 3.3 shows discharges reported by cruise industry. The black bar shows the number of ships that did not use the sewage PRF for sewage even if available. It is based on information from 29 CLIA-affiliated cruise ships, received by HELCOM Secretariat as a reply to a joint HELCOM CLIA survey. The dataset covers the whole cruising season (April to October 2014) Sewage discharges 3.4. Comments from cruise ships on port facilities (2014) 3.5. Maximum number of persons on board per call Maximum capacity of persons onboard including passengers and crew 3.6. Estimated theoretical max. discharge need 1 1 Estimated total discharge capacity needs of cruise ship calls during summer 2014, assuming all wastewater generated after leaving last port of call will be discharged in the port. The presented figures are based the following calculation:. Multiplying this figure with a waste water production estimation in m 3 sewage per person per day would give you the estimated total discharge need in m 3 h -1. More information is available in the Annex I. 91

92 Ventspils (Latvia) UN LOCODE: LVVNT Berth used by cruise ships according to AIS data during April - October Sewage Port Reception Facilities One barge with a maximum discharge rate of 70 m 3 /h, maximum quantity of sewage that can be delivered by a ship 86 m 3. No direct sewage discharge connection available. Sewage from ships is delivered and treated in Ventspils municipal-ity wastewater treatment plant. Sewage discharge time at port per call is 2 hours. The time spent at port per call: 4h and 12h. Planned improvements Additional information Tank trucks are used. One tank 30m 3. Barge are also used. One tank 86m3. Capacity 20m3/h. From trucks and barges sewage are discharged to municipal treatment facilities. 92
93 2. Passenger traffic trends in Ventspils A compilation based on statistics from the Baltic Sea coastal countries national Administrations, regional ports organizations (BPO, ESPO), the publication Baltic Port List and the Nordic Council of Ministers. Cruise ships calls Cruise ships passengers International cruise and ferry passengers 93
94 3. Cruise ship visits in Ventspils The figures 3.1 and 3.2 are generated from the HELCOM AIS data. The dataset covers the period from 2006 to Time at sea from previous port 3.2. Time spent at port per call The figure 3.3 shows discharges reported by cruise industry. The black bar shows the number of ships that did not use the sewage PRF for sewage even if available. It is based on information from 29 CLIA-affiliated cruise ships, received by HELCOM Secretariat as a reply to a joint HELCOM CLIA survey. The dataset covers the whole cruising season (April to October 2014) Sewage discharges 3.4. Comments from cruise ships on port facilities (2014) 3.5. Maximum number of persons on board per call Maximum capacity of persons onboard including passengers and crew 3.6. Estimated theoretical max. discharge need 1 1 Estimated total discharge capacity needs of cruise ship calls during summer 2014, assuming all wastewater generated after leaving last port of call will be discharged in the port. The presented figures are based the following calculation:. Multiplying this figure with a waste water production estimation in m 3 sewage per person per day would give you the estimated total discharge need in m 3 h -1. More information is available in the Annex I. 94

95 Stralsund (Germany) UN LOCODE: DESTL Berth used by cruise ships according to AIS data during April - October Sewage Port Reception Facilities Sewage disposal at the moment by mobile facilities operated by the regional sewage plant of the municipality. Due to the access to Germany s inland waterway system the Port of Stralsund is the most frequented port on the German Baltic Coast regarding river cruise vessels coming from the metropolitan regions Berlin and Hamburg. Stralsund is the turn-around-port for river cruise lines every year from April to October which offer cruises also through the coastal waters of the Baltic around the island of Rügen. Deep-sea cruisers call at Stralsund occasionally, the total figures for passengers comprise the numbers of these calls. Planned improvements It is planned to build a stationary facility on one special berth at the North Port (1) (see picture above) Additional information Plans for the conversion and the renewal of the ports infrastructure which is used for the cruise business are in progress and are intended to contain fixed links/facilities for the sewage discharge. 95
96 2. Passenger traffic trends in Stralsund A compilation based on statistics from the Baltic Sea coastal countries national Administrations, regional ports organizations (BPO, ESPO), the publication Baltic Port List and the Nordic Council of Ministers. Cruise ships calls Cruise ships passengers International cruise and ferry passengers 96
97 3. Cruise ship visits in Stralsund The figures 3.1 and 3.2 are generated from the HELCOM AIS data. The dataset covers the period from 2006 to Time at sea from previous port 3.2. Time spent at port per call The figure 3.3 shows discharges reported by cruise industry. The black bar shows the number of ships that did not use the sewage PRF for sewage even if available. It is based on information from 29 CLIA-affiliated cruise ships, received by HELCOM Secretariat as a reply to a joint HELCOM CLIA survey. The dataset covers the whole cruising season (April to October 2014) Sewage discharges 3.4. Comments from cruise ships on port facilities (2014) 3.5. Maximum number of persons on board per call Maximum capacity of persons onboard including passengers and crew Time at sea from previous port Estimated theoretical max. discharge need 1 Estimated theoretical maximum discharge need I 20,2 Time spent at port during the call 10 Maximum number of persons onboard 372 Only 1 call was reported during the joint HELCOM- CLIA survey. 1 Estimated total discharge capacity needs of cruise ship calls during summer 2014, assuming all wastewater generated after leaving last port of call will be discharged in the port. The presented figures are based the following calculation:. Multiplying this figure with a waste water production estimation in m 3 sewage per person per day would give you the estimated total discharge need in m 3 h -1. More information is available in the Annex I. 97

98 Kemi (Finland) UN LOCODE: FIKEM Berth used by cruise ships according to AIS data during April - October Sewage Port Reception Facilities Planned improvements Additional information 98
99 2. Passenger traffic trends in Kemi A compilation based on statistics from the Baltic Sea coastal countries national Administrations, regional ports organizations (BPO, ESPO), the publication Baltic Port List and the Nordic Council of Ministers. Cruise ships calls Cruise ships passengers International cruise and ferry passengers 99

100 3. Cruise ship visits in Kemi The figures 3.1 and 3.2 are generated from the HELCOM AIS data. The dataset covers the period from 2006 to Time at sea from previous port 3.2. Time spent at port per call The figure 3.3 shows discharges reported by cruise industry. The black bar shows the number of ships that did not use the sewage PRF for sewage even if available. It is based on information from 29 CLIA-affiliated cruise ships, received by HELCOM Secretariat as a reply to a joint HELCOM CLIA survey. The dataset covers the whole cruising season (April to October 2014) Sewage discharges 3.4. Comments from cruise ships on port facilities (2014) 3.5. Maximum number of persons on board per call Maximum capacity of persons onboard including passengers and crew Time at sea from previous port Estimated theoretical max. discharge need 1 Estimated theoretical maximum discharge need I 24,3 Time spent at port during the call 11 Maximum number of persons onboard 916 Only 1 call was reported during the joint HELCOM- CLIA survey. 1 Estimated total discharge capacity needs of cruise ship calls during summer 2014, assuming all wastewater generated after leaving last port of call will be discharged in the port. The presented figures are based the following calculation:. Multiplying this figure with a waste water production estimation in m 3 sewage per person per day would give you the estimated total discharge need in m 3 h -1. More information is available in the Annex I. 100

101 Helsingör (Denmark) UN LOCODE: DKHLS Berth used by cruise ships according to AIS data during April - October Sewage Port Reception Facilities Planned improvements Additional information Helsingör is one of the eight ports listed as first priority ports in the 2010 HELCOM Roadmap for upgrading PRF for sewage in passenger ports of the Baltic Sea area.. 2. Passenger traffic trends in Helsingör A compilation based on statistics from the Baltic Sea coastal countries national Administrations, regional ports organizations (BPO, ESPO), the publication Baltic Port List and the Nordic Council of Ministers. Cruise ships calls Cruise ships passengers International passengers
102 3. Cruise ship visits in Helsingör The figures 3.1 and 3.2 are generated from the HELCOM AIS data. The dataset covers the period from 2006 to Time at sea from previous port 3.2. Time spent at port per call The figure 3.3 shows discharges reported by cruise industry. The black bar shows the number of ships that did not use the sewage PRF for sewage even if available. It is based on information from 29 CLIA-affiliated cruise ships, received by HELCOM Secretariat as a reply to a joint HELCOM CLIA survey. The dataset covers the whole cruising season (April to October 2014) Sewage discharges 3.4. Comments from cruise ships on port facilities (2014) 3.5. Maximum number of persons on board per call Maximum capacity of persons onboard including passengers and crew Time at sea from previous port Estimated theoretical max. discharge need 1 Estimated theoretical maximum discharge need I 130,5 Time spent at port during the call 7 Maximum number of persons onboard 510 Only 1 call was reported during the joint HELCOM- CLIA survey. 1 Estimated total discharge capacity needs of cruise ship calls during summer 2014, assuming all wastewater generated after leaving last port of call will be discharged in the port. The presented figures are based the following calculation:. Multiplying this figure with a waste water production estimation in m 3 sewage per person per day would give you the estimated total discharge need in m 3 h -1. More information is available in the Annex I. 102
, the publication Baltic")
103 Luleå (Sweden) UN LOCODE: SELLA Berth used by cruise ships according to AIS data during April - October Sewage Port Reception Facilities Planned improvements Additional information 2. Passenger traffic trends in Luleå A compilation based on statistics from the Baltic Sea coastal countries national Administrations, regional ports organizations (BPO, ESPO), the publication Baltic Port List and the Nordic Council of Ministers. Cruise ships calls Cruise ships passengers International passengers 103

104 3. Cruise ship visits in Luleå The figures 3.1 and 3.2 are generated from the HELCOM AIS data. The dataset covers the period from 2006 to Time at sea from previous port 3.2. Time spent at port per call The figure 3.3 shows discharges reported by cruise industry. The black bar shows the number of ships that did not use the sewage PRF for sewage even if available. It is based on information from 29 CLIA-affiliated cruise ships, received by HELCOM Secretariat as a reply to a joint HELCOM CLIA survey. The dataset covers the whole cruising season (April to October 2014) Sewage discharges 3.4. Comments from cruise ships on port facilities (2014) 3.5. Maximum number of persons on board per call Maximum capacity of persons onboard including passengers and crew Time at sea from previous port Estimated theoretical max. discharge need 1 Estimated theoretical maximum discharge need I 76,3 Time spent at port during the call 12 Maximum number of persons onboard 916 Only 1 call was reported during the joint HELCOM- CLIA survey. 1 Estimated total discharge capacity needs of cruise ship calls during summer 2014, assuming all wastewater generated after leaving last port of call will be discharged in the port. The presented figures are based the following calculation:. Multiplying this figure with a waste water production estimation in m 3 sewage per person per day would give you the estimated total discharge need in m 3 h -1. More information is available in the Annex I. 104
, the publication")
105 Fredericia (Denmark) UN LOCODE: DKFRC Berth used by cruise ships according to AIS data during April - October Sewage Port Reception Facilities Planned improvements Additional information 2. Passenger traffic trends in Fredericia A compilation based on statistics from the Baltic Sea coastal countries national Administrations, regional ports organizations (BPO, ESPO), the publication Baltic Port List and the Nordic Council of Ministers. Cruise ships calls Cruise ships passengers International passengers 105
106 3. Cruise ship visits in Fredericia The figures 3.1 and 3.2 are generated from the HELCOM AIS data. The dataset covers the period from 2006 to Time at sea from previous port 3.2. Time spent at port per call The figure 3.3 shows discharges reported by cruise industry. The black bar shows the number of ships that did not use the sewage PRF for sewage even if available. It is based on information from 29 CLIA-affiliated cruise ships, received by HELCOM Secretariat as a reply to a joint HELCOM CLIA survey. The dataset covers the whole cruising season (April to October 2014) Sewage discharges 3.4. Comments from cruise ships on port facilities (2014) 3.5. Maximum number of persons on board per call Maximum capacity of persons onboard including passengers and crew Time at sea from previous port Estimated theoretical max. discharge need 1 Estimated theoretical maximum discharge need I 116,5 Time spent at port during the call 10 Maximum number of persons onboard 2796 Only 1 call was reported during the joint HELCOM- CLIA survey. 1 Estimated total discharge capacity needs of cruise ship calls during summer 2014, assuming all wastewater generated after leaving last port of call will be discharged in the port. The presented figures are based the following calculation:. Multiplying this figure with a waste water production estimation in m 3 sewage per person per day would give you the estimated total discharge need in m 3 h -1. More information is available in the Annex I. 106
107 Trelleborg (Sweden) UN LOCODE: SETRG 1. Sewage Port Reception Facilities Fixed reception facilities for waste water are available at all RoRo/RoPax berths (calls as per timetable) in the port of Trelleborg. At other quays (few and occasional calls), where there are no fixed reception points or in case the fixed reception facility can t be used tank trucks can be provided. The fees for disposal of black- and greywater are agreed on in the overall terminal-/harbour agreements with each shipping line. Direct discharge to municipal sewage system has been available at berths 8 and 9 since 2009 and all Roro berths in Trelleborg since Planned improvements All new RoRo berths which are planned to be constructed the next years will have PRF s Additional information No information available 107
108 2. Passenger traffic trends in Trelleborg A compilation based on statistics from the Baltic Sea coastal countries national Administrations, regional ports organizations (BPO, ESPO), the publication Baltic Port List and the Nordic Council of Ministers. International passengers 108
109 3. Cruise ship visits in Trelleborg The figures 3.1 and 3.2 are generated from the HELCOM AIS data. The dataset covers the period from 2006 to Time at sea from previous port 3.2. Time spent at port per call The figure 3.3 shows discharges reported by cruise industry. The black bar shows the number of ships that did not use the sewage PRF for sewage even if available. It is based on information from 29 CLIA-affiliated cruise ships, received by HELCOM Secretariat as a reply to a joint HELCOM CLIA survey. The dataset covers the whole cruising season (April to October 2014) Sewage discharges 3.4. Comments from cruise ships on port facilities (2014) 3.5. Maximum number of persons on board per call Maximum capacity of persons onboard including passengers and crew 3.6. Estimated theoretical max. discharge need 1 1 Estimated total discharge capacity needs of cruise ship calls during summer 2014, assuming all wastewater generated after leaving last port of call will be discharged in the port. The presented figures are based the following calculation:. Multiplying this figure with a waste water production estimation in m 3 sewage per person per day would give you the estimated total discharge need in m 3 h -1. More information is available in the Annex I. 109
110 Liepaja (Latvia) UN LOCODE: LVLPX 1. Sewage Port Reception Facilities The quays are served by mobile reception facilities 3 tank trucks with capacity 30m³ each and 1 barge with max capacity 250 m 3. No direct discharge to municipal sewage system available. Sanitary fee charged from each ship includes delivery of sewage from passenger ships. 105 m 3 from ferries were discharged at port in Planned improvements No plans for year of Additional information 110
111 2. Passenger traffic trends in Liepaja Cruise ships calls Cruise ships passengers 4 International passengers 111
112 3. Cruise ship visits in Liepaja The figures 3.1 and 3.2 are generated from the HELCOM AIS data. The dataset covers the period from 2006 to Time at sea from previous port 3.2. Time spent at port per call The figure 3.3 shows discharges reported by cruise industry. The black bar shows the number of ships that did not use the sewage PRF for sewage even if available. It is based on information from 29 CLIA-affiliated cruise ships, received by HELCOM Secretariat as a reply to a joint HELCOM CLIA survey. The dataset covers the whole cruising season (April to October 2014) Sewage discharges 3.4. Comments from cruise ships on port facilities (2014) 3.5. Maximum number of persons on board per call Maximum capacity of persons onboard including passengers and crew 3.6. Estimated theoretical max. discharge need 1 1 Estimated total discharge capacity needs of cruise ship calls during summer 2014, assuming all wastewater generated after leaving last port of call will be discharged in the port. The presented figures are based the following calculation:. Multiplying this figure with a waste water production estimation in m 3 sewage per person per day would give you the estimated total discharge need in m 3 h -1. More information is available in the Annex I. 112

113 Turku (Finland) UN LOCODE: FITKU Port area used by cruise ships according to the national Administration 1. Sewage Port Reception Facilities Grey and black water can be discharged from the vessels directly to the fixed waste water reception facilities in Passenger Harbour, Linnanaukko and West Harbour areas. The vessel must use its own pump for discharging. Fixed reception points are connected to municipal sewer system. Passenger Harbour: Discharge points for fixed route ferry lines are located at berth number V1 (used by Viking Line) and berth number S2 (used by Tallink Silja). Capacity is approx. 200 m3/h. Linnanaukko: Discharge point is located at berth number 23. Planning capacity of the PRF is approx. 83 m3/h. PRF can be used by both cruise and cargo ships. West Harbour: Discharge points are located at berth number 35 and 38. Planning capacity of the PRF is approx. 83 m3/h. PRF can be used by both cruise and cargo ships. Where fixed waste water reception facilities are not available, the Port can provide tank trucks with a capacity of 24 m3/h to collect waste water if needed. The disposal of sewage in port is included to the waste disposal charges (no-special-fee). Exceptions to cruise ships available. 113
114 2. Passenger traffic trends in Turku A compilation based on statistics from the Baltic Sea coastal countries national Administrations, regional ports organizations (BPO, ESPO), the publication Baltic Port List and the Nordic Council of Ministers. Cruise ships calls Cruise ships passengers International cruise and ferry passengers 114

115 3. Cruise ship visits in Turku The figures 3.1 and 3.2 are generated from the HELCOM AIS data. The dataset covers the period from 2006 to Time at sea from previous port 3.2. Time spent at port per call The figure 3.3 shows discharges reported by cruise industry. The black bar shows the number of ships that did not use the sewage PRF for sewage even if available. It is based on information from 29 CLIA-affiliated cruise ships, received by HELCOM Secretariat as a reply to a joint HELCOM CLIA survey. The dataset covers the whole cruising season (April to October 2014) Sewage discharges 3.4. Comments from cruise ships on port facilities (2014) 3.5. Maximum number of persons on board per call Maximum capacity of persons onboard including passengers and crew 3.6. Estimated theoretical max. discharge need 1 1 Estimated total discharge capacity needs of cruise ship calls during summer 2014, assuming all wastewater generated after leaving last port of call will be discharged in the port. The presented figures are based the follwing calculation:. Multiplying this figure with a waste water production estimation in m 3 sewage per person per day would give you the estimated total discharge need in m 3 h -1. More information is available in the Annex I. 115
116 Nynäshamn (Sweden) UN LOCODE: SENYN (map to be added) 1. Sewage Port Reception Facilities In the Port of Nynäshamn there are no fixed links. The treatment plant owned by the municipality of Nynäshamn does not accept the sewage because of lack of capacity and the content of the sewage. The Port can provide tank trucks or a barge with a capacity of 550 m3 to collect waste water if needed. The cruise vessels have for many years anchored outside the port area. From 2016 the Port can offer the cruise vessels to anchor in the port area using a pier known as a Seawalk, a retractable, manoeuvrable floating pier. The pier is prepared for pipes for sewage. The disposal of black- and greywater in port is included in the port fee. It is thus a general fee, based on the number of passengers, regardless of if the vessel offloads black- and grey water or not. All the ferries have exemptions from the delivery of sewage given by the Swedish Transport Agency. Planned improvements The Port investigates different options for receiving sewage and is also discussing with the municipality. Additional information 116
117 2. Passenger traffic trends in Nynäshamn A compilation based on statistics from the Baltic Sea coastal countries national Administrations, regional ports organizations (BPO, ESPO), the publication Baltic Port List and the Nordic Council of Ministers. Cruise ships calls (anchoring) Cruise ships passengers International passengers 117

118 3. Cruise ship visits in Nynäshamn The figures 3.1 and 3.2 are generated from the HELCOM AIS data. The dataset covers the period from 2006 to Time at sea from previous port 3.2. Time spent at port per call The figure 3.3 shows discharges reported by cruise industry. The black bar shows the number of ships that did not use the sewage PRF for sewage even if available. It is based on information from 29 CLIA-affiliated cruise ships, received by HELCOM Secretariat as a reply to a joint HELCOM CLIA survey. The dataset covers the whole cruising season (April to October 2014) Sewage discharges 3.4. Comments from cruise ships on port facilities (2014) 3.5. Maximum number of persons on board per call Maximum capacity of persons onboard including passengers and crew 3.6. Estimated theoretical max. discharge need 1 1 Estimated total discharge capacity needs of cruise ship calls during summer 2014, assuming all wastewater generated after leaving last port of call will be discharged in the port. The presented figures are based the following calculation:. Multiplying this figure with a waste water production estimation in m 3 sewage per person per day would give you the estimated total discharge need in m 3 h -1. More information is available in the Annex I. 118
Baltic Marine Environment Protection Commission
 Baltic Marine Environment Protection Commission Maritime Working Group St. Petersburg, Russia, 10-12 October 2017 MARITIME 17-2017 Document title 2017 HELCOM Overview on Port Reception Facilities (PRF)
HELCOM Ministerial Declaration on the implementation of the HELCOM Baltic Sea Action Plan
 HELCOM Ministerial Declaration on the implementation of the HELCOM Baltic Sea Action Plan 20 May 2010, Moscow The document Roadmap for upgrading the availability of port reception facilities for sewage
Helcom Maritime October CLIA Europe Baltic Exercise on Sewage. CLIA Europe 10 October 2017
 Helcom Maritime 17 10 October 2017 CLIA Europe Baltic Exercise on Sewage CLIA Europe 10 October 2017 The Baltic as a key market 3rd market by destination in the world 2.1% growth last year 353 MLN spending
Best Practice Guidance for the handling of waste water in ports
 Development and Assessment Institute in Waste Water Technology at RWTH Aachen University Best Practice Guidance for the handling of waste water in ports 18th Meeting of the HELCOM Maritime Working Group
Baltic Marine Environment Protection Commission
 Baltic Marine Environment Protection Commission Cooperation Platform on Special Area According to MARPOL Annex IV (CP PRF) Hamburg, Germany, 13 September 2017 CP PRF 7-2017 Document 1 CLIA Europe Baltic
SHIP-GENERATED WASTE MANAGEMENT
 SHIP-GENERATED WASTE MANAGEMENT Ellen Kaasik, Head of Quality and Environmental Management Department, Port of Tallinn at the Workshop Green Cruise Port Innovative Waste Management and Reception Facilities
PORT OF HELSINKI ALL OF FINLAND WITHIN YOUR REACH
 PORT OF HELSINKI ALL OF FINLAND WITHIN YOUR REACH PORT OF THE ENTIRE FINLAND One of the strengths of the Port of Helsinki is its excellent location at the heart of Finnish production, population and consumption.
New PRF in Kiel- Experience from TUI Cruises 7th HELCOM Cooperation Platform on Port Reception Facilities (PRF) in the Baltic Sea
 in the Baltic Sea") New PRF in Kiel- Experience from TUI Cruises 7th HELCOM Cooperation Platform on Port Reception Facilities (PRF) in the Baltic Sea Lucienne Damm, Senior Environmental Manager, TUI Cruises Hamburg, 13 th
New PRF in Kiel- Experience from TUI Cruises 7th HELCOM Cooperation Platform on Port Reception Facilities (PRF) in the Baltic Sea Lucienne Damm, Senior Environmental Manager, TUI Cruises Hamburg, 13 th
Baltic Port Market. BPO Conference Riga, RECIENT FACTS & FIGURES. dr Maciej Matczak
 Baltic Port Market RECIENT FACTS & FIGURES BPO Conference Riga, 3-4.09.2015 Schedule TOTAL CARGO TURNOVER Trends of the last decade 2005-2014 First half of 2015 preliminary results MAIN TYPES OF CARGO
Report on shipping accidents in the Baltic Sea area during 2010
 HELSINKI COMMISSION Baltic Marine Environment Protection Commission Report on shipping accidents in the Baltic Sea area during 2010 Photo by Maritime office in Gdynia Table of contents 1 Introduction...
APPLICATION OF THE NO-SPECIAL-FEE SYSTEM IN THE BALTIC SEA AREA
 CONVENTION ON THE PROTECTION OF THE MARINE ENVIRONMENT OF THE BALTIC SEA AREA HELSINKI COMMISSION - Baltic Marine HELCOM 19/98 Environment Protection Commission 15/1 Annex 19 19th Meeting Helsinki, 23-27
Report on shipping accidents in the Baltic Sea area during Introduction
 HELSINKI COMMISSION Baltic Marine Environment Protection Commission Report on shipping accidents in the Baltic Sea area during 2009 Introduction Reports on shipping accidents in the Baltic Sea area have
The MAGALOG Project LNG-fueled shipping in the Baltic Sea
 The MAGALOG Project LNG-fueled shipping in the Baltic Sea The project is supported by: 1 MAGALOG WP4.1 Study of ship and transport volumes in the Baltic Sea, the North Sea and on Inland waterways in Europe
AIS ship movements analysis for CBSS, Riga, 19 Sept 2012 Torbjörn Rydbergh, M.Sc., Nav. Arch. Managing Director & Owner
 Torbjörn Rydbergh, M.Sc., Nav. Arch. Managing Director & Owner www.marinebenchmark.com Subjects for presentation Company background Movements analysis AIS Cruise ships in Baltic Sea Balitic Sea 2012 Q1&Q2
HELCOM-VASAB Maritime Spatial Planning Working Group Eleventh Meeting Riga, Latvia, 30 September-1 October 2015
 HELCOM-VASAB Maritime Spatial Planning Working Group Eleventh Meeting, 30 September-1 October 2015 Document title Upcoming meetings within HELCOM Code 7-2-Rev.1 Category INF Agenda Item 7 - Future work
BRISK Sub-regional risk of spill of oil and hazardous substances in the Baltic Sea
 BRISK Sub-regional risk of spill of oil and hazardous substances in the Baltic Sea Part-financed by the European Union Photo: Nikolay Vlasov / HELCOM Maritime traffic in the Baltic The Baltic Sea today
Green Cruise Port from the Cruise Network point of view
 Green Cruise Port from the Cruise Network point of view Claus Bødker, Director Cruise Baltic at the Best Practice Tour Copenhagen Oslo, September 26 th -28 th 2017 Copenhagen / Denmark, September 27th
Harbour Reception Survey
 Harbour Reception Survey Survey on Harbour Reception Facilities at selected Baltic Sea fishing harbours Marek Press Keep the Estonian Sea Tidy Association Objective; The Aim of the Activity The aim of
Port of Tallinn Estonia s Biggest Maritime Gateway
 Port of Tallinn Estonia s Biggest Maritime Gateway Margus Vihman Chief Commercial Officer/ Member of the Management Board Organization The company in a nutshell State-owned limited liability company Port
IMO PROMOTION OF IMPLEMENTATION AND ENFORCEMENT OF MARPOL AND RELATED INSTRUMENTS. Comments on the proposal by WWF
 INTERNATIONAL MARITIME ORGANIZATION E IMO MARINE ENVIRONMENT PROTECTION COMMITTEE 59th session Agenda item 14 MEPC 59/14/1 19 May 2009 Original: ENGLISH PROMOTION OF IMPLEMENTATION AND ENFORCEMENT OF MARPOL
Current BAF ROUTES DATE MARPOL/ ISPS
 ANEK LINES ANCONA-IGOUMENITSA 155.00 / UNIT 01/01/2019 ANCONA-PATRAS 155.00 / UNIT 01/01/2019 BARI-IGOUMENITSA 85.00 / UNIT 01/01/2019 BARI-PATRAS 85.00 / UNIT 01/01/2019 BRITTANY FERRIES PORTSMOUTH-CAEN
Baltic Marine Environment Protection Commission
 Baltic Marine Environment Protection Commission Group of Experts on Safety of Navigation Copenhagen, Denmark, 7 September 218 SAFE NAV 9-218 Document title Draft Annual HELCOM report on shipping accidents
Best practices for attracting cruise tourists
 Best practices for attracting cruise tourists Ingrid Berezin ORGANIZATION COMPANY IN A NUTSHELL State-owned limited liability company Port of Tallinn is a landlord port We provide infrastructure land,
Overview of tourism trends in Tallinn. First quarter report in 2018
 Overview of tourism trends in Tallinn First quarter report in 2018 Visits of foreign residents to Tallinn, January - March 2018 Residents of foreign countries made 780 338 visits to Tallinn, which means
SHIP ACCIDENTS IN THE BALTIC SEA AREA
 COMPILATION ON SHIP ACCIDENTS IN THE BALTIC SEA AREA 1989-1999 FINAL REPORT PREPARED BY THE MINISTRY OF ENVIRONMENT PROTECTION AND REGIONAL DEVELOPMENT OF THE REPUBLIC OF LATVIA MARINE ENVIRONMENT BOARD
for maritime environment protection
 INTERNATIONAL MARITIME STATISTICS FORUM (IMSF) ANNUAL MEETING 2012 Oslo 21 23 May 2012 SIGNIFICANCE OF PORT RECEPTION FACILITIES ( MARPOL Convention, Annex 4) for maritime environment protection Urszula
TARIFF OF HARBOUR DUES
 PORT OF GDYNIA AUTHORITY S.A. JOINT-STOCK COMPANY TARIFF OF HARBOUR DUES Valid from 1 July 2007 The Tariff established by the Port of Gdynia Authority, S.A. under Resolution no. 168/II/2004 of 18 August
THE TARIFF OF PORT FEES AND CHARGES SZCZECIN AND ŚWINOUJŚCIE SEAPORTS AUTHORITY
 THE TARIFF OF PORT FEES AND CHARGES SZCZECIN AND ŚWINOUJŚCIE SEAPORTS AUTHORITY CONTENTS 1. APPLICATION... 3 2. COLLECTION.... 3 3. COLLECTION OF WASTE FROM SHIPS... 4 4. SERVICES PROVIDED BY PORT RESCUE
Femern Belt Fixed Link
 Femern Belt Fixed Link Impact on Baltic turntable function of Lübeck 5th BeltLogistics Workshop Felix Klingbiel, Vice Head of Marketing & Sales Lübecker Hafen-Gesellschaft mbh Femern Belt, 29 January 2015
Baltic Sea Hydrographic Commission, Bathymetric Database and the MONALISA project. - with co-financing from EU TEN-T SJÖFARTSVERKET
 SJÖFARTSVERKET Baltic Sea Hydrographic Commission, Presentation vid dialogmöte Kommunikationer för tillväxt Centerpartiet Östergötland, 25 oktober 2011 Magnus Sundström Bathymetric Database and the MONALISA
HARBOUR DUES. The Port of Helsingborg
 HARBOUR DUES The Port of Helsingborg Valid 1 January -- 31 December, 2018 1 Contents 1 Ships dues 2 Environmental discounts 3 Waste and environmental charge 4 Pumping charge 5 Harbour dues 6 Advance notification
Introduction to BPO and Green InfraPort Project. Bogdan Ołdakowski, Secretary General, Baltic Ports Organization
 Introduction to BPO and Green InfraPort Project Bogdan Ołdakowski, Secretary General, Baltic Ports Organization BPO who we are? BPO Baltic Ports Organization established October 10, 1991 Copenhagen nearly
UK - IRELAND - FRANCE - HOLLAND - NORWAY - DENMARK - GERMANY - LATVIA - SWEDEN - POLAND COACH & GROUP TRAVEL INTERNATIONAL FERRY GUIDE
 UK - IRELAND - FRANCE - HOLLAND - NORWAY - DENMARK - GERMANY - LATVIA - SWEDEN - POLAND COACH & GROUP TRAVEL INTERNATIONAL FERRY GUIDE WELCOME TO EUROPE S LARGEST FERRY ROUTE NETWORK With our choice of
PORT CHARGES AND FEES
 PORT CHARGES AND FEES Valid from 29.03.2018 CONTENTS 1 GENERAL PROVISIONS 3 2 TERMS 4 3 PORT CHARGES AND FEES 5 3.1 General provisions 5 3.2 Tonnage charge 6 3.3 Waste fee 7 3.4 Mooring charge 8 3.5 Passenger
Port dues strategies and incentives for cruise line companies for using green port features Jakub Piotrowicz, Maritime Institute in Gdańsk
 Port dues strategies and incentives for cruise line companies for using green Jakub Piotrowicz, Maritime Institute in Gdańsk at the Green Cruise Port Workshop Measurement of regional economic effects caused
St. Mary s Harbour. Port Waste Management Plan
 DUCHY of CORNWALL St. Mary s Harbour Port Waste Management Plan Harbour Master: 01720 422768 hm@stmarys-harbour.co.uk The Harbour Office The Quay, St. Mary s, Isles of Scilly, TR21 0HU. - 1 - CONTENTS.
FEES OF THE PORT OF PÄRNU
 FEES OF THE PORT OF PÄRNU Valid from 8 May 2015 TABLE OF CONTENTS 1. GENERAL PROVISIONS... 3 2. PORT FEES... 4 2.1 Channel fee... 4 2.2 Visiting fee... 5 2.3 Mooring fee... 5 2.4 Passenger fee... 6 2.5
Baltic Marine Environment Protection Commission
 Baltic Marine Environment Protection Commission Group of Experts on Safety of Navigation Copenhagen, Denmark, 3 December 2014 SAFE NAV 5-2014 Document title Revision of HELCOM Recommendation 25/7 Safety
CONTENTS CARGO CHARGES. Effective from January 1, 2017 GENERAL TERMS
 PRICE LIST 2017 CONTENTS CARGO CHARGES Effective from January 1, 2017 Page GENERAL TERMS General terms and conditions of the price list 2 Cargo charges 3 Vessel charges 6 Passenger charges 10 Vessel waste
STUDY ON KLAIPEDA CITY ACCESSIBILITY FOR PASSENGERS OF CRUISE SHIPS
 STUDY ON KLAIPEDA CITY ACCESSIBILITY FOR PASSENGERS OF CRUISE SHIPS Passenger Behaviour and Smart Traffic Links with the City and the Near Hinterland of cruise ports by including additionally IT-based
FSUE ROSMORPORT CONSTRUCTION OF THE INTERNATIONAL MARINE TERMINAL WITH YACHT MARINA IN THE CITY OF PIONERSKY, KALININGRAD REGION
 FSUE ROSMORPORT CONSTRUCTION OF THE INTERNATIONAL MARINE TERMINAL WITH YACHT MARINA IN THE CITY OF PIONERSKY, KALININGRAD REGION Situated in the Northern part of the Kaliningrad peninsula, in the middle
 16 March 2004 HELCOM RECOMMENDATION 25/7 on the SAFETY OF WINTER NAVIGATION IN THE BALTIC SEA AREA having regard to Article 13, Paragraph b) of the Helsinki Convention was adopted on 2 March 2004 in Helsinki
Environmental Performance Evaluation of Ro-Ro Passenger Ferry Transportation
 Environmental Performance Evaluation of Ro-Ro Passenger Ferry Transportation Authors: Hans Otto Holmegaard Kristensen (hohk@mek.dtu.dk) The Technical University of Denmark Constantin Hagemeister. Nordic
Ship-generated Waste Management Plan of the Freeport of Riga
 The Freeport of Riga Authority Confirmed By The Freeport of Riga Board Resolution No. 68 of June 28, 2017 Ship-generated Waste Management Plan of the Freeport of Riga APPROVED State Environment Service
the Port of Gothenburg
 THE PORT OF SCANDINAVIA 57 42 N 11 56 E Port Tariff for the Port of Gothenburg Effective from 1 January 2018 and valid until further notice. VERSION 1, 2018 TABLE OF CONTENTS 1. Summary of detailed terms
GREEN CRUISE PORT (GCP) Sustainable Development of Cruise Port Locations
 Sustainable Development of Cruise Port Locations") GREEN CRUISE PORT (GCP) Sustainable Development of Cruise Port Locations Hans-Ulrich Wolff, GCP Communication Manager April 19th, 2018 Piraeus / Greece GCP Overview (1/3) Basic Information EU Interreg
GREEN CRUISE PORT (GCP) Sustainable Development of Cruise Port Locations Hans-Ulrich Wolff, GCP Communication Manager April 19th, 2018 Piraeus / Greece GCP Overview (1/3) Basic Information EU Interreg
HELSINKI COMMISSION HELCOM TRANSIT ROUTE EWG 13/2008 Expert Working Group on Transit Routeing 13th Meeting Helsinki, Finland, 7-8 October 2008
 HELSINKI COMMISSION HELCOM TRANSIT ROUTE EWG 13/2008 Expert Working Group on Transit Routeing 13th Meeting Helsinki, Finland, 7-8 October 2008 Agenda Item 2 Overview of the current situation/follow up
Measuring economic effects of cruise tourism - Port of Tallinn perspective
 Measuring economic effects of cruise tourism - Port of Tallinn perspective Sirle Arro, Port of Tallinn at the Workshop Measurement of regional economic effects caused by cruise tourism, Gdansk Gdansk /
Baltic Marine Environment Protection Commission
 Baltic Marine Environment Protection Commission Revised HELCOM RECOMMENDATION 25/7 Adopted 2 March 2004 having regard to Article 13, Paragraph b) of the Helsinki Convention Revised 4 March 2015 and 10
Tourism Cooperation in the Baltic Sea Region
 Tourism Cooperation in the Baltic Sea Region Iceland Norway Finnland Russian Federation Sweden Estonia Latvia Denmark Lithuania Belarus Germany Poland Betina Meliss University of Greifswald Institute of
60 26 N E. Bergen Oslo Stockholm. Helsinki Tallinn. St. Petersburg. Gothenburg Riga. Copenhagen. Klaipèda. Gdansk.
 60 26 N 22 13 E Bergen Oslo Stockholm Helsinki Tallinn St. Petersburg Gothenburg Riga Copenhagen Klaipèda Rostock Hamburg Gdansk ANCHOR AT THE PORT OF GOOD SERVICES The Port of Turku is Finland s gateway
Role of Aviation Sector in Latvia Development of Riga International Airport
 Role of Aviation Sector in Latvia Development of Riga International Airport Riga International Airport Built in 1974 1% owned by the Republic of Latvia Operated by SJSC RIGA International Airport Occupies
Short introduction to the INTERFACE PLUS project
 The Project is part-financed by the European Union (ERDF) INTERFACE PLUS Port & Ferry Operator Workshop 24 March 2011 Darłowo, Poland Short introduction to the INTERFACE PLUS project Jens Masuch Phone:
A. TARIFF SCHEDULE OF PORT SERVICES
 TARIFF SCHEDULE OF PORT SERVICES AND CHARGES OF DUBROVNIK PORT AUTHORITY Contents: A. TARIFF SCHEDULE OF PORT SERVICES I II III IV V GENERAL PROVISIONS QUAYAGE DEMURRAGE QUAYAGE boats - yachts ANCHORAGE
MARITIME DIRECTORATE OF RAVENNA. DECREE no. 13/2014
 MARITIME DIRECTORATE OF RAVENNA DECREE no. 13/2014 The Maritime Director of Emilia Romagna, HAVING REGARD TO his Decree no. 44/2014 dated 31 March 2014, regarding pilotage rates in the Port of Ravenna
NORD STREAM 2 STUDY ON COMMERCIAL SHIPS PASSING THE LAY BARGE IN THE FINNISH EEZ
 Intended for Nord Stream 2 AG Date October, 2016 Document number W-PE-EIA-POF-REP-805-060400EN-01 NORD STREAM 2 STUDY ON COMMERCIAL SHIPS PASSING THE LAY BARGE IN THE FINNISH EEZ NORD STREAM 2 Study on
New opportunities for cargo logistics in Baltic region
 New opportunities for cargo logistics in Baltic region Māra TapiĦa Director of the Land Transport department Ministry of Transport of the Republic of Latvia Latvia as a natural bridge in EuroAsia traffic
APRIL / Main Media Partner: Media partners: NEWS. The Øksne Hall Copenhagen
 APRIL 10-11 / 2019 Main Media Partner: Media partners: NEWS The Øksne Hall Copenhagen www.shipping-summit.com Networking for Maritime Professionals According to Danish Shipping, the Danish fleet is growing
Baltic Sea MIRG Project
 Baltic Sea MIRG Project 1 BALTIC SEA MIRG PROJECT (2014-2016) Baltic Sea Maritime Incident Response Group (Baltic Sea MIRG) project The project will create joint MIRG coordination models and standard operating
Case examples: CEF -fundings for Innovations
 Case examples: CEF -fundings for Innovations ILKKA RYTKÖLÄ Wärtsilä 1 / 31 Wärtsilä 23 November 2016 Ilkka Rytkölä Doc.ID: Revision: Status: Contents 1. Baltic SO 2 lution 2. Methanol; The Marine Fuel
HUTCHISON PORTS STOCKHOLM
 HUTCHISON PORTS STOCKHOLM A NEW CONTAINER TERMINAL OPENING 2020 2 THE ONLY DEEP-WATER FACILITY ON THE EAST COAST OF SWEDEN 3 SCHEDULED PHASE 1 TO OPEN THE FIRST PHASE IN MAY 2020. 4 ON PHASE 1 COMPLETION:
MARITIME DIRECTORATE OF RAVENNA. DECREE no. 21/2016
 MARITIME DIRECTORATE OF RAVENNA DECREE no. 21/2016 The Maritime Director of Emilia Romagna, HAVING REGARD TO his Decree no. 13/2014 dated 30 December 2014, regarding pilotage rates in the Port of Ravenna
PORT CHARGES For the use of PORT OF BERGEN's infrastructure and services (SHORT VERSION FOR CRUISE SHIPS, PLEASURE CRAFTS/YACTHS)
") PORT CHARGES 2015 (SHORT VERSION FOR CRUISE SHIPS, PLEASURE CRAFTS/YACTHS) For the use of PORT OF BERGEN's infrastructure and services Ale prices are exclusive of VAT. 1 CONTENT Prices for the use of Port
PORT CHARGES 2015 (SHORT VERSION FOR CRUISE SHIPS, PLEASURE CRAFTS/YACTHS) For the use of PORT OF BERGEN's infrastructure and services Ale prices are exclusive of VAT. 1 CONTENT Prices for the use of Port
The PIANC RIS guidelines Edition 4, 2018 Cas Willems (Chairman PIANC WG 125) Smart Atlantis on behalf of Rijkswaterstaat
 Smart Atlantis on behalf of Rijkswaterstaat") The PIANC RIS guidelines Edition 4, 2018 Cas Willems (Chairman PIANC WG 125) Smart Atlantis on behalf of Rijkswaterstaat Jeffrey van Gils (Member of the PIANC WG125) Rijkswaterstaat content Historical
The PIANC RIS guidelines Edition 4, 2018 Cas Willems (Chairman PIANC WG 125) Smart Atlantis on behalf of Rijkswaterstaat Jeffrey van Gils (Member of the PIANC WG125) Rijkswaterstaat content Historical
VINTERSJÖFARTSFORSKNING
 STYRELSEN FÖR VINTERSJÖFARTSFORSKNING WINTER NAVIGATION RESEARCH BOARD Research Report No 84 Leena Vedenpää OBSERV OBSERVATIONS OF SHIP ICE PERFORMANCE IN THE BALTIC Winter 2012 Finnish Transport Safety
COACH & GROUP TRAVEL EUROPEAN FERRY GUIDE PRICE LIST 2019
 COACH & GROUP TRAVEL EUROPEAN FERRY GUIDE PRICE LIST 2019 WELCOME TO EUROPE S LARGEST FERRY ROUTE NETWORK NORWAY Oslo Nynäshamn Frederikshavn Grenaa DENMARK SWEDEN Gothenburg Varberg Karlskrona Trelleborg
FINEST LINK WP2 Appendix 2. Passenger volume estimation
 FINEST LINK WP2 Appendix 2. Passenger volume estimation Content Objectives and approach 3 9 Present situation 10 14 Preliminary train operating concept and land use projections 15 17 Trip type analysis
CONTENTS CARGO CHARGES. Effective from January 1, 2018 GENERAL TERMS
 PRICE LIST 2018 CONTENTS CARGO CHARGES Effective from January 1, 2018 Page GENERAL TERMS General terms and conditions of the price list 2 Cargo charges 3 Vessel charges 6 Passenger charges 10 Vessel waste
THE M/S MEGASTAR BUNKERING EXPERIENCE. Tallinn
 THE M/S MEGASTAR BUNKERING EXPERIENCE Tallinn 16.05.2018 CONTENTS 1. Eesti Gaas in brief. 2. Bunkering of M/S Megastar. 3. Lessons learned. 4. First year bunkering results 5. Conclusion. 6. Development
Economical Impact on. Container Transport Market. Erik Ringmaa, Chief Commercial Officer Port of Tallinn
 Economical Impact on Container Transport Market Erik Ringmaa, Chief Commercial Officer Port of Tallinn 2008 1 Background Since the beginning of 2000's container logistic companies have enjoyed rapid growth
Sweden. Swedish Visitors in Finland Statistical Trends and Profile
 Sweden M A R K E T R E V I E W 2 0 1 5 Swedish Visitors in Finland Statistical Trends and Profile 26.10.2016 STATISTICS ON SWEDISH TOURISM IN FINLAND STATISTICAL TRENDS 3 Registered overnights 4 Number
Cruise Liners. Prices and terms Port of Stockholm and Nynäshamn. Version
 Cruise Liners Prices and terms 2019 Port of Stockholm and Nynäshamn Version 201901 CONTENTS GENERAL INFORMATION CONTACT 3 TERMS AND CONDITIONS 3-4 INVOICING PRINCIPLES 5 CRUISE LINERS HARBOUR DUES 6-7
National Report of Finland
 National Report of Finland [15 August 2012] Executive Summary This Report gives an overview of the main activities of the Finnish Hydrographic Office (FHO) since the previous BSHC 16 th Conference. The
ROSMORPORT perspectives on Clean Shipping in the Baltic Sea
 ROSMORPORT perspectives on Clean Shipping in the Baltic Sea ILIA SIDLO Kaliningrad branch of FSUE ROSMORPORT CLEANSHIP Project Final Conference in Trelleborg 2-3 September 2013 Key topics Reduce of air
Incentive Discounts Programme for Traffic Development at Sofia Airport 2018
 1. General Terms: Incentive Discounts Programme for Traffic Development at Sofia Airport 2018 1.1. This Programme containing Incentive discounts on the airport charges aims at promoting the sustainable
Baltic Marine Environment Protection Commission
 Baltic Marine Environment Protection Commission Response Working Group Riga, Latvia, 8-10 November 2016 RESPONSE 22-2016 Document title Report on Mini CEPCO 2016 Code 9.1-1 Category INF Agenda Item 9.1
Port State Control Commencement of the New Inspection Regime on 1 st January 2011
 Marine Notice No. 02 of 2011 This Marine Notice supersedes Marine Notice No. 13 of 2010 FOR THE ATTENTION OF ALL OWNERS, OPERATORS, MASTERS, AGENTS, PILOTS AND PORT AUTHORITIES Port State Control Commencement
An overview of Tallinn tourism trends
 An overview of Tallinn tourism trends August 2015 The data is collected from Statistics Estonia, Tallinn Airport and Port of Tallinn. In August 2015, 179,338 stayed overnight in Tallinn s accommodation
Construction of the cruise terminal in Pionersky
 Construction of the cruise terminal in Pionersky Nikolay Mamenko, Head of commercial department, Kaliningrad Authority of Rosmorport at the Workshop Maritime and Landside Traffic Challenges of Cruise Terminals,
Leibniz Institute for Baltic Sea Research Warnemünde
 INSTITUT FÜR OSTSEEFORSCHUNG WARNEMÜNDE an der Universität Rostock BALTIC SEA RESEARCH INSTITUTE Leibniz Institute for Baltic Sea Research Warnemünde C r u i s e R e p o r t r/v "Elisabeth Mann Borgese"
Ship accidents of last 30 years at maritime ferry Baltic Sea operating area
 Bogalecka Magda Maritime University, Gdynia, Poland Journal of Polish Safety and Reliability Association Summer Safety and Reliability Seminars, Volume 8, Number 4, 2017 Jakusik Ewa Institute of Meteorology
Valencia, 17 th December 2015
 Valencia, 17 th December 2015 SUBJECT CHARGES FOR THE SPECIAL USE OF PORT FACILITIES AND FOR NAVIGATIONAL AIDS THE PORT AUTHORITY OF VALENCIA, VALID FROM 1 ST JANUARY 2016. The following memorandum sets
EMERGENCY TOWING CAPABILITIES IN LITHUANIA. Igor Kuzmenko Lietuvos maritime academy
 EMERGENCY TOWING CAPABILITIES IN LITHUANIA Igor Kuzmenko Lietuvos maritime academy Introductory words It is axiomatic that lifesaving takes precedence over salvage but saving the ship may also be the best
GENERAL TARIFF PROVISIONS :
 GENERAL TARIFF PROVISIONS : a) Overtime working hours are considered from 22.00 hrs to 06.00 hrs of the next day, and from 22.00 hrs on Friday to 06.00 on Monday as well as during holidays. b) Service
Baltic 21 Lighthouse Project AGORA 2.0. Heritage Tourism for Increased BSR Identity
 Baltic 21 Lighthouse Project Part-financed by the European Union (European Regional Development Fund and European Neighbourhood and Partnership Instrument) AGORA 2.0 Heritage Tourism for Increased BSR
Marpol Port facilities The case and regulation of Spain
 Marpol Port facilities The case and regulation of Spain SD committee and 1st EcoPorts workshop on waste reception facilities, Piraeus 27-28 March 2014 Carlos Botana Lagarón Head of Environmental Policies
Viking Homelands At-A-Glance
 At-A-Glance This is a one-of-a-kind itinerary where guests will have a chance to explore the entire Scandinavia and Baltic regions. Personally designed by Viking Cruises Chairman Torstein Hagen, is unique
Smart Specialisation and Blue Growth in the Baltic Sea Region
 Smart Specialisation and Blue Growth in the Baltic Sea Region Dr. Steffen Lüsse, Project Lead Ministry of Economic Affairs, Employment, Transport and Technology Schleswig-Holstein www.smartblueregions.eu
Polish Ports in 2017 February 2018
 Polish Ports in 2017 February 2018 Summary and future outlook Summary: Polish port sector with another record-breaking result of cargo handling. Annual cargo turnover amounted 87.3 million tones, what
180.8 million passengers, nearly 17.7 million cars and 3.3 million cargo units. Every year 6.4 million passengers travel on Viking Line s vessels.
 1959 2012 180.8 million passengers, nearly 17.7 million cars and 3.3 million cargo units. Every year 6.4 million passengers travel on Viking Line s vessels. The Viking Line fleet The Viking Line fleet
LNG the future fuel in ferry and cruise ship ports?!
 LNG the future fuel in ferry and cruise ship ports?! Andrej Vatterrott Hafen- Entwicklungsgesellschaft Rostock mbh 2 1. The Port of Rostock in a nutshell 2. LNG as fuel 3 Port of Rostock: High-capacity
Port of Helsinki the Main Port for the Finnish Foreign Trade
 Port of Helsinki Port of Helsinki the Main Port for the Finnish Foreign Trade 2014 Total traffic 10.8 million tonnes Unitized cargo 10.0 million tonnes Market share 25 % (amount) Market share 40 % (value)
INVITATION TO OUR CLEAN BALTIC SEA SHIPPING MIDTERM CONFERENCE. in Riga on September
 INVITATION TO OUR CLEAN BALTIC SEA SHIPPING MIDTERM CONFERENCE in Riga on September 19-20 2012 Venue: Freeport of Riga Authority premises, 12 Kalpaka blvd, Riga This open conference encourages the involvement
MINISTRY OF INFRASTRUCTURES AND TRANSPORT HARBOUR MASTER S OFFICE OF RAVENNA ORDER NO. 97/2017
 MINISTRY OF INFRASTRUCTURES AND TRANSPORT HARBOUR MASTER S OFFICE OF RAVENNA ORDER NO. 97/2017 The Head of the Maritime Compartment and Harbour Master of the Port of Ravenna: the Regulation for the towing
INDEX NAVIGATION SUPPORT RATE (T0) 3 VESSEL RATE (T1) 4 1. ZONE I: SHORT STAY BERTHING 4 2. ZONE I: PROLONGED STAY BERTHING 5
 3 VESSEL RATE (T1) 4 1. ZONE I: SHORT STAY BERTHING 4 2. ZONE I: PROLONGED STAY BERTHING 5") Port s & fees 2016 Summary of s applicable by the Port of Algeciras Bay Authority at facilities for purposes, for maritime signalling and fees for electricity and water supply, occupation of surface area,
Port s & fees 2016 Summary of s applicable by the Port of Algeciras Bay Authority at facilities for purposes, for maritime signalling and fees for electricity and water supply, occupation of surface area,
Discover a proven way! PORT of KLAIPEDA. Klaipeda Port Extensive Business Opportunities Artūras Drungilas. Marketing and Corporate Affairs Director
 Discover a proven way! PORT of KLAIPEDA Klaipeda Port Extensive Business Opportunities Artūras Drungilas Marketing and Corporate Affairs Director Klaipeda Port Advantages of Klaipėda Port Convenient geographical
Unitised Goods Transport via Danish Ports 2004
 A project within the Interreg IIIB North Sea Programme Unitised Goods Transport via Danish Ports 2004 Annex 1.2.7 to the Final Report May 2007 Department of Development and Planning PREFACE This paper
Helsinki February 1986 HELCOM RECOMMENDATION 7/9 *)
") CONVENTION ON THE PROTECTION OF THE MARINE ENVIRONMENT OF THE BALTIC SEA AREA BALTIC MARINE ENVIRONMENT PROTECTION HELCOM 7/14 COMMISSION - HELSINKI COMMISSION - Annex 14 Seventh Meeting Helsinki 11-14
CONVENTION ON THE PROTECTION OF THE MARINE ENVIRONMENT OF THE BALTIC SEA AREA BALTIC MARINE ENVIRONMENT PROTECTION HELCOM 7/14 COMMISSION - HELSINKI COMMISSION - Annex 14 Seventh Meeting Helsinki 11-14
Port of Kalundborg. Reception and Handling of Waste Vestre Havneplads 7 DK Kalundborg Denmark
 Port of Kalundborg Reception and Handling of Waste 2015-2018 The Harbour's Address: Kalundborg Havn Vestre Havneplads 7 DK - 4400 Kalundborg Denmark Tel.: +45 59 53 40 00 Fax.: +45 59 53 40 03 E-mail:
Norway MARKET REVIEW Norwegian Visitors in Finland Statistical Trends and Profile
 Norway MARKET REVIEW 2015 Norwegian Visitors in Finland Statistical Trends and Profile 24.11.2016 STATISTICS ON NORWEGIAN TOURISM IN FINLAND STATISTICAL TRENDS 3 Registered overnights 4 Number of visitors