Endangered Marine Species
|
|
|
- Lee Lucas
- 6 years ago
- Views:
Transcription
1 Endangered Marine Species Managing Right Whale Ship Strikes Hauke L. Kite-Powell WHOI Marine Policy Center November 2002
2 Outline Background: ESA and MMPA Northern Right Whale problem Cost of proposed management measures Effectiveness of proposed management measures
3 Legislative Basis: Endangered Species Act of 1973 endangered = in imminent danger of extinction throughout all of a significant portion of its range threatened = likely to become endangered in the foreseeable future NMFS most marine species Fish and Wildlife Service all other plants and animals
4 Legislative Basis: Marine Mammal Protection Act of 1973 Moratorium on taking of marine mammals by US citizens, and on importing/exporting take = to harass, hunt, capture, or kill, or attempt to harass Exception: Indian/Eskimo/Aleut subsistence hunting 1994 reauthorization: new focus on commercial fishing
5 ESA Process Stock assessments Recovery plans/management plans
6 Listed Species: Finfish Endangered: Atlantic salmon Shortnose sturgeon Threatened: Chinook salmon Coho salmon Chum salmon Gulf sturgeon Sockeye salmon Steelhead Smalltooth sawfish: proposed for listing
7 Listed Species: Marine Mammals Endangered: Blue whale Bowhead whale Fin whale Hawaiian monk seal Humpback whale Northern right whale Sei whale Sperm whale Threatened: Guadalupe fur seal Steller sea lion
8 Listed Species: Marine Turtles Endangered: Green sea turtle Hawksbill Kemp s ridley Leatherback Olive ridley Threatened: Green sea turtle Loggerhead Olive ridley
9 Listed Species: Other Marine Johnson s sea grass White abalone International: Chinese River dolphin Gray whale (western north Pacific) Gulf of California harbor porpoise Indus River dolphin Mediterranean monk seal Ringed seal Southern right whale Totoaba
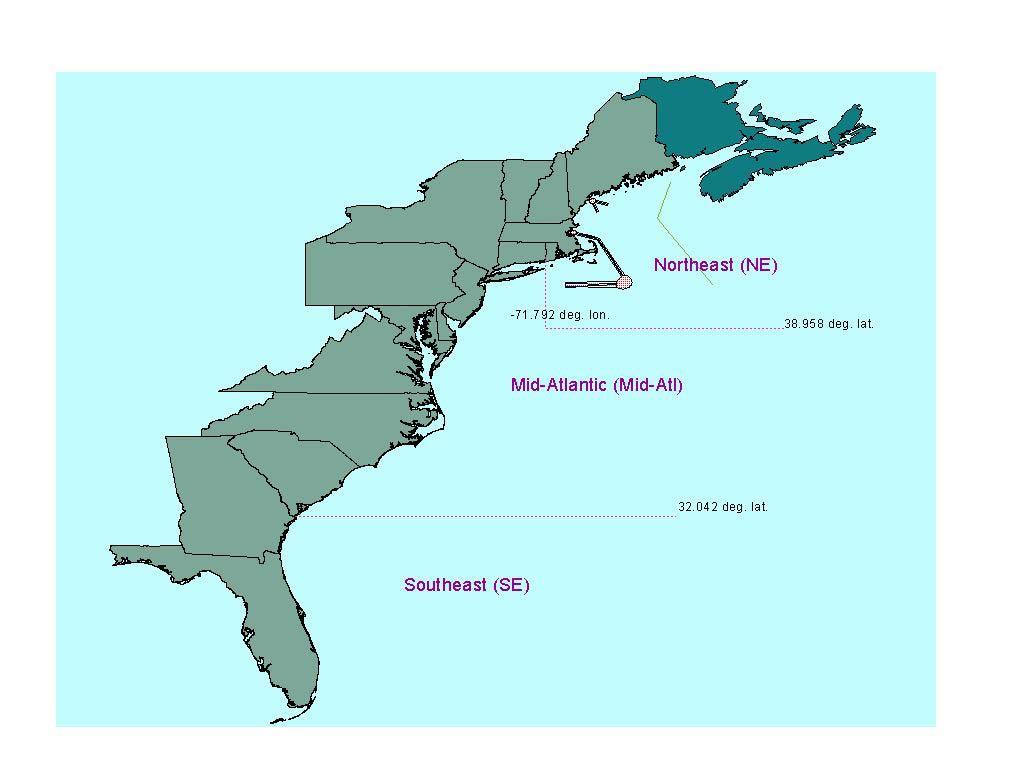
10 Northern Right Whale Ship Strike Problem Population around 300 Seasonal migrations along US east coast Losses due to entanglement (fishing gear) and ship strikes Management measures: area closures (rerouting) and/or speed restrictions Cost? Effectiveness?

11 1999 Coastal Transits (domestic cargo) Boston NY/NJ Philadelphia Baltimore Hampton Roads Wilmington NC Jacksonville petro petro, raw, food, manufac petro coal, manufac coal petro, chem chem, food, manufac
12 1999 Seaward Transits NY/NJ Philadelphia Baltimore Hampton Roads Charleston Savannah Jacksonville Port Everglades Miami (foreign cargo) petro, raw, food manufac petro, manufac coal, raw, manufac, food coal, petro, manufac petro, chem, manufac, food raw, chem, food, manufac petro, raw, manufac, food petro, manufac food, manufac
13 Cost/Effect Categories operating cost due to increased transit time considered explicitly dockside and operating costs from missed tide window due to unanticipated delays ( port costs) considered explicitly long-term shifts in ship call schedules and port utilization not considered
14 Boston Port Calls port calls 2000 (Massport) inbound transits 1999 (ACoE) port calls used for analysis Dry bulk Car carrier Container Cruise Tanker (product) LNG Dry barge Tank barge Navy
15 Transits Used for Analysis inbound outbound CCCanal GSC GoMaine CCCanal GSC GoMaine Dry bulk Car carrier Container Cruise* Tanker LNG Dry barge Tank barge *April - October
16 Schedule Constraints container: tide more than 1 hour delay causes 12 hour loss results in $20,000 longshore penalty cruise: schedule more than 3 hour delay: $100,000 penalty tankers: tide, daylight more than 1 hour delay causes 24 hour loss LNG: tide more than 1 hour delay causes 12/24 hour loss
17 Vessel Type Assumptions Dry bulk (handymax) Car carrier Container (3,000 TEU) Cruise Tanker (product) LNG Dry barge Tank barge normal operating speed (knots) daily charter + OPEX cost ($/24 hours) 12,000 24,000 40,000 50,000 18,000 65,000 12,000 12,000
18 Boston Routes Traffic Management Regime approaches from Gulf of Maine and Cape Cod Canal dynamic speed restriction over 30 nm 90 day window base case: 10 kts, 20 nm, 30 days Great South Channel approach 30 nm static speed restriction across Mass Bay, 30 days dynamic speed restriction over 30 nm in GSC, 90 days
19 Boston Routes Traffic Response Alternatives (GSC) 1. high risk strategy no schedule adjustment, take chance on delay penalties for port delays on all affected transits 2. low risk strategy schedule for maximum delay on each transit no unexpected (port) delays
20 Model Results maximum additional transit time: Gulf of Maine, Cape Cod Canal: about 45 minutes for bulker carriers about 90 minutes for container & cruise ships Great South Channel: about 90 minutes for bulk carriers 3 to 3.5 hours for faster ships
21 Boston North Approach (Gulf of Maine) (base case: 30/20) total cost, $k/year X X X X X X X X speed restriction (max. knots)
22 Great South Channel Static Segment (base case: 30/30) total cost, $k/year speed restriction (max. knots)
23 Great South Channel Dynamic Segment (base case: 30/20) total cost, $k/year X X X X X X X X speed restriction (max. knots)
24 Model Results: Boston Traffic Annual Cost (base case, $1,000) northern approach (Gulf of Maine) southern approach (Cape Cod Canal) Great South Channel approach Race Point (static) GSC (dynamic) dry bulk total tanker container LNG car carrier/roro cruise dry barge tank barge total
25 GSC: High and Low Risk Strategies 1600 annual delay costs ($1000s) high risk low risk days/year of speed restriction (30 nm)
26 Port Calls (estimated, from 1999 Army Corps of Engineers data) Portland NY/NJ * Phila Baltim Hamp Roads Wilm DE Dry bulk 910 1,900 1,100 2, Car carrier/roro 1,500 Container 5, , Cruise Tanker 350 2,630 1, LNG Dry barge ,200 1,700 4,000 1,000 Tank barge 120 1,000 5,000 1, Navy *NY/NJ Port Authority data, 2001 (2010 forecast)
27 Port Calls (estimated, from 1999 Army Corps of Engineers data) Charles* Savan Bruns Fern Beach Jax Port Canav Dry bulk 160 2, Car carrier/roro 70 Container 1, Cruise ,900 Tanker LNG 100 Dry barge Tank barge , Navy *South Carolina Port Authority data, 2000
28 Portland Boston NY/NJ Philadelphia Baltimore Hampton Roads Wilmington Charleston Savannah Brunswick Fernandina Jacksonville Port Canaveral tank barge dry barge cruise car carrier/roro LNG container tanker dry bulk estimated annual cost, $m
29 Average Cost per Affected Vessel 4,000 3,500 3,000 2,500 2,000 1,500 1, Portland Boston NY/NJ Philadelphia Baltimore Hampton Roads Wilmington Charleston Savannah Brunswick Fernandina Jacksonville Port Canaveral cost, $/affected ship call
30 Port Canaveral Average Cost per Vessel Boston NY/NJ Philadelphia Baltimore Hampton Roads Wilmington Charleston Savannah Brunswick Fernandina Jacksonville Portland cost, $/ship call
31 Summary: Cost Estimates overall cost to Boston shipping estimated $ ,000/year total east coast: about $10 million/year Boston: about $500/ship call, or $3,000 per affected ship call GSC (2/3) and northern approach (1/3) container and cruise ships
32 Effectiveness: Background Consortium data on sightings and effort minute squares, by month QC by Bob Kenney SPUE = sightings/km survey trackline density = SPUE/average survey track width don t know track width (W t ) but: can make reasonable estimate given total population size
33
34 RW Population, NE: January
35 RW Population, NE: February
36 RW Population, NE: March
37 RW Population, NE: April
38 RW Population, NE: May
39 RW Population, NE: June
40 RW Population, NE: July
41 RW Population, NE: August
42 RW Population, NE: September
43 RW Population, NE: October
44 RW Population, NE: November

45 RW Population, NE: December
46 Estimated Population with W t =1.5 km MONTH Pop. Estimate* NE Mid-Atl SE Total Jan Feb Mar Apr May Jun Jul Aug Sep Oct Nov Dec * W t =1.5 km = 282 when Wt = 2km = 294 when Wt = 3km
47 Average Estimated Density by month and region MONTH Density (whales/1000km2) NE Mid-Atl SE Total Jan Feb Mar Apr May Jun Jul Aug* Sep** Oct Nov Dec *Trackline width assumed to be 2km **Trackline width assumed to be 3km
48 Estimating Encounters for a given route: length of track through each square effective width and number of vessels Great South Channel: approx. 7 encounters/year April June includes submerged encounters no allowance for avoidance
49 Comparing Management Measures routing: comparison of estimated encounters moderated by evasive action (surveys/ships) and whale behavior(?) speed no effect on estimated encounter rates may allow more effective evasive action
January 2018 Air Traffic Activity Summary
 January 2018 Air Traffic Activity Summary Jan-2018 Jan-2017 CY-2018 CY-2017 Passengers 528,947 505,421 4.7% 528,947 505,421 4.7% Passengers 537,332 515,787 4.2% 537,332 515,787 4.2% Passengers 1,066,279
LOUIS ARMSTRONG NEW ORLEANS INTERNATIONAL AIRPORT For the Period Ending September 30, Enplaned Passengers by Airline
 Domestic Scheduled Enplaned Passengers by Airline Alaska Airlines 7,070 4,331 63.2% 59,552 42,265 40.9% 1.2% 1.0% Virgin America 0 803-100.0% 12,231 803 1423.2% 0.3% 0.0% Allegiant Air 1,333 2,063-35.4%
State of the Waterway 2017
 State of the Waterway 2017 Steven W. Nerheim Director VTS Houston/Galveston Lone Star Harbor Safety Committee 2 FEBRUARY 2018 U.S. Port Rankings 2015 1 South Louisiana, LA, Port of 259.1-3.07% 15 Texas
Golden Ocean Group Limited Q results March 1, 2007
 Golden Ocean Group Limited Q4 2006 results March 1, 2007 PROFIT & LOSS 2005 2006 (in thousands of $) 2006 2005 Oct-Dec Oct-Dec Jan - Dec Jan - Dec Operating Revenues 37 292 91 253 Time charter revenues
DTTAS Quarterly Aviation Statistics Snapshot Quarter Report
 Contents DTTAS Quarterly Aviation Statistics Snapshot Quarter 4 2015 Report 1.1 Dublin Airport Key Statistics... 1 1.2 Cork Airport Key Statistics... 3 1.3 Shannon Airport Key Statistics... 5 1.4 Total
DTTAS Quarterly Aviation Statistics Snapshot Quarter Report
 Contents DTTAS Quarterly Aviation Statistics Snapshot Quarter 3 2018 Report 1.1 Dublin Airport Key Statistics... 1 1.2 Cork Airport Key Statistics... 3 1.3 Shannon Airport Key Statistics... 5 1.4 Total
DTTAS Quarterly Aviation Statistics Snapshot Quarter Report
 Contents DTTAS Quarterly Aviation Statistics Snapshot Quarter 1 2018 Report 1.1 Dublin Airport Key Statistics... 1 1.2 Cork Airport Key Statistics... 3 1.3 Shannon Airport Key Statistics... 5 1.4 Total
With the completion of this project, we would like to follow-up on the projections as well as highlight a few other items:
 TO: FROM: Mayor and Council Interim City Manager Rebecca Underhill, Director of Finance DATE: February 28, 2014 SUBJECT: Water Meter Project Analysis On March 28, 2012, Acting City Manager Mike Loftin
air traffic statistics
 December 213 air traffic statistics Prepared by the Office of Finance Department of Internal Controls, Compliance and Financial Strategy Commercial Total Dom Int'l Passengers % Change Air Traffic Summary
LOUIS ARMSTRONG NEW ORLEANS INTERNATIONAL AIRPORT For the Period Ending August 31, Enplaned Passengers by Airline
 Enplaned Passengers by Airline Domestic Scheduled Alaska Airlines 3,797 4,077-6.9% 36,538 35,188 3.8% 1.0% 1.0% Allegiant Air 5,698 743 666.9% 41,738 14,843 181.2% 1.1% 0.4% American Airlines (US Air)
June Air Traffic Statistics. Prepared by the Office of Corporate Risk and Strategy
 June 214 Air Traffic Statistics Prepared by the Office of Corporate Risk and Strategy Air Traffic Statistics Table of Contents Summary Air Traffic Summary... 1 SH&E Air Traffic Schedule Activity... 3 Passenger
U.S. Army Corps of Engineers Wilmington District
 U.S. Army Corps of Engineers Wilmington District 2012 East Coast - WEDA October 9-11, 2012 Ongoing & Upcoming Contracts US Army Corps of Engineers Wilmington District Ongoing Contracts Project Quantity
TRANSATLANTIC NORTH EUROPE NETWORK
 TRANSATLANTIC NORTH EUROPE NETWORK May, 2017 TRANSATLANTIC NORTH EUROPE OVERVIEW NEUATL1 NEUATL2 NEUATL3 ANTWERP BREMERHAVEN ANTWERP ROTTERDAM FELIXSTOWE FELIXSTOWE BREMERHAVEN ANTWERP ROTTERDAM LE HAVRE
I T N E T R E N R A N T A I T ON O AL A L A R A R R I R VA V L A S L S A N A D N D D E D PA
 INTERNATIONAL ARRIVALS AND DEPARTURES July 2015 Government of Tonga SD18M-36 Statistical Bulletin Month of Change from Change from July 2015 Number previous month previous year All Arrivals 8,252-28.0
1 of 5 9/19/2014 3:24 PM
 1 POC: Liz Caporelli LAST UPDATED: 2008/01/21 09:36 EST Marine Operations Woods Hole Oceanographic Institution 38 Water St Mail Stop-37 Tel: 508-289-2277 Fax: 508-457-2185 Email: ecaporelli@whoi.edu R/V
The Corps of Engineers Dredges on the West Coast
 The Corps of Engineers Dredges on the West Coast Presented To California Marine Affairs and Navigation Conference Sheryl Carrubba Operations Manager, Channels & Harbors Portland District November 8, 2011
September Air Traffic Statistics. Prepared by the Office of Marketing & Consumer Strategy
 September 2018 Air Traffic Statistics Prepared by the Office of Marketing & Consumer Strategy This report includes only data submitted by airlines as of the date of publication: November 14, 2017. Reports
May Air Traffic Statistics. Prepared by the Office of Corporate Risk and Strategy
 May 214 Air Traffic Statistics Prepared by the Office of Corporate Risk and Strategy Commercial Total Int'l Dom Air Traffic Summary May 214 Passenger Activity (in Millions) Current Month Year-to-Date Last
JULY 20-27, 2008 SHORE LEAVE SURVEY
 THE SEAMEN S CHURCH INSTITUTE OF NEW YORK AND NEW JERSEY 241 WATER STREET NEW YORK, NEW YORK 10038 212/349-9090 FAX: 212/349-8342 Website: www.seamenschurch.org JULY 20-27, 2008 SHORE LEAVE SURVEY The
July air traffic statistics. Prepared by the Office of Corporate Risk and Strategy
 July 214 air traffic statistics Prepared by the Office of Corporate Risk and Strategy Air Traffic Statistics Table of Contents Summary Air Traffic Summary... 1 SH&E Air Traffic Schedule Activity... 3 Passenger
ITINERARIES
 ALASKA SAN FRANCISCO DEPARTURES 8-Day Alaska Norwegian Sun May 8, 2016 14-Day Ultimate Alaska Norwegian Sun May 15, 2017 SEATTLE DEPARTURES 7-Day Alaska Glacier Bay Norwegian Pearl May 15 Sep 18, 2016
INTERIM REPORT JANUARY-JUNE 2012 BJÖRN ROSENGREN, PRESIDENT & CEO 18 JULY 2012
 INTERIM REPORT JANUARY-JUNE 212 BJÖRN ROSENGREN, PRESIDENT & CEO 18 JULY 212 Highlights Q2/212 Order intake EUR 1,198 million, +2% Net sales EUR 1,99 million, +6% Book-to-bill 1.9 (1.13) EBIT EUR 113 million,
October 2013 Passenger and Cargo Traffic Statistics Reno-Tahoe International Airport
 October 2013 Passenger and Cargo Traffic Statistics Reno-Tahoe International Airport December 4, 2013 U.S. DOMESTIC INDUSTRY OVERVIEW FOR OCTOBER 2013 All RNO Carriers Systemwide year over year comparison
Latest market insights and marketing plans from VisitBritain/VisitEngland. Anke Monestel, VisitEngland 8 th February 2018
 Latest market insights and marketing plans from VisitBritain/VisitEngland Anke Monestel, VisitEngland 8 th February 2018 1 Inbound tourism trends 2 Friday, February 9, 2018 2003 2004 2005 2006 2007 2008
air traffic statistics
 September 213 air traffic statistics Prepared by the Office of Finance Department of Internal Controls, Compliance and Financial Strategy Commercial Total Int'l Dom Passengers % Change Air Traffic Summary
WÄRTSILÄ CORPORATION
 WÄRTSILÄ CORPORATION UBS PAN EUROPEAN SMALL & MIDCAP CONFERENCE RAIMO LIND, EVP & CFO 19 MAY 211 1 Wärtsilä Q1/11 Highlights Net sales EUR 1,83 million, +18% Order intake EUR 979 million, +11% Operating
DEPARTMENT OF THE NAVY USS ELROD (FFG 55) FLEET POST OFFICE MIAMI SO9
 FLEET POST OFFICE MIAMI SO9") DEPARTMENT OF THE NAVY USS ELROD (FFG 55) FLEET POST OFFICE MIAMI 94091-1 SO9 5750 FFG55/01 :db Ser 111 23 March 1990 From: Commanding Officer, USS ELROD (FFG 55) To : Commanding Officer, Naval Historical
DEPARTMENT OF THE NAVY USS ELROD (FFG 55) FLEET POST OFFICE MIAMI 94091-1 SO9 5750 FFG55/01 :db Ser 111 23 March 1990 From: Commanding Officer, USS ELROD (FFG 55) To : Commanding Officer, Naval Historical
Passenger and Cargo Statistics Report
 Passenger and Cargo Statistics Report Reno-Tahoe International Airport October 2018 U.S. DOMESTIC INDUSTRY OVERVIEW FOR OCTOBER 2018 Systemwide RNO Carriers Domestic Flights year over year comparison Average
CONTROLLING DEPTHS and GUIDELINES
 updated November 4, 2014 CONTROLLING DEPTHS and GUIDELINES May 05 Alliance East (UGG) 12.6m 212m May 05 Alliance West (UGG) 9.8m 212m 1987 Allied Shipyard 2.7m Dec 09 BC Sugar Refinery 8.5m 130m Oct 02
AIR CARGO RECOVERY DRIVERS AND ROADBLOCKS Airports Council International North America Calgary
 AIR CARGO RECOVERY DRIVERS AND ROADBLOCKS Airports Council International North America Calgary DAN MUSCATELLO Landrum & Brown September 9, 0 Metric Tons (in millions) GLOBAL AIR CARGO VOLUMES Global air
AirportInfo. ACI-NA 2011 Traffic Report
 AirportInfo ACI-NA 2011 Traffic Report July 2012 2011 ACI World Airport Traffic Summary North America 2011 % Change 2010 Worldwide 2011 % Change 2010 Total Passengers 1.5B Up 1.8% 5.1B Up 5.2% Total International
November 2013 Passenger and Cargo Traffic Statistics Reno-Tahoe International Airport
 November 2013 Passenger and Cargo Traffic Statistics Reno-Tahoe International Airport December 26, 2013 U.S. DOMESTIC INDUSTRY OVERVIEW FOR NOVEMBER 2013 All RNO Carriers Domestic Systemwide year over
MAXIMIZING INVESTMENT AND UTILIZATION
 MAXIMIZING INVESTMENT AND UTILIZATION November 2013 Luis Ajamil Bermello, Ajamil & Partners Two perspectives How to increase use of the facility OPTIMIZATION How to improve the capacity of the facility
Table of Contents PAGE
 FEBRUARY 2018 EL PASO INTERNATIONAL AIRPORT MONTHLY ACTIVITY REPORT February 2018 Table of Contents PAGE AIRPORT ACTIVITY OVERVIEW 1 NONSTOP DESTINATION ANALYSIS 2 MAP OF NONSTOP DESTINATIONS 3 FLIGHT
Oct-17 Nov-17. Sep-17. Travel is expected to grow over the coming 6 months; at a slightly faster rate
 Analysis provided by TRAVEL TRENDS INDEX SEPTEMBER 2018 CTI reading of.8 in September 2018 indicates that travel to or within the U.S. grew 1.6% in September 2018 compared to September 2017. LTI predicts
December 2013 Passenger and Cargo Traffic Statistics Reno-Tahoe International Airport
 December 2013 Passenger and Cargo Traffic Statistics Reno-Tahoe International Airport January 24, 2014 U.S. DOMESTIC INDUSTRY OVERVIEW FOR DECEMBER 2013 All RNO Carriers Domestic Systemwide year over year
ACEC/MW and ACEC/MD. Maryland Port Administration. Steve Johnson. June 6, 2017
 ACEC/MW and ACEC/MD Maryland Port Administration Steve Johnson June 6, 2017 1 The Port of Baltimore is a complex mix of Private and Public terminals.handling diverse bulk & general cargoes. Baltimore Forest
49 May-17. Jun-17. Travel is expected to grow over the coming 6 months; at a slower rate
 Analysis provided by TRAVEL TRENDS INDEX MAY 2018 CTI reading of 51.7 in May 2018 shows that travel to or within the U.S. grew 3.4% in May 2018 compared to May 2017. LTI predicts moderating travel growth
August air traffic statistics. Prepared by the Office of Corporate Risk and Strategy
 August 214 air traffic statistics Prepared by the Office of Corporate Risk and Strategy Metropolitan Washington Airports Authority Air Traffic Statistics Table of Contents Summary Air Traffic Summary...
Delivering the Goods: Ports in the South
 Delivering the Goods: Ports in the South Sujit M. CanagaRetna The Council of State Governments Southern Legislative Conference (SLC) Atlanta, Georgia Presentation to the Southern Economic Development Council
Coast to coast. STR Coastal Town Review Coastal Towns Market Review Report_JE.indd 3
 Coast to coast. STR Coastal Town Review 16 Coastal Towns Market Review Report_JE.indd 3 4//17 8:31:38 AM Table of Contents Introduction...3 United Kingdom...4 Blackpool...6 Bournemouth...8 Brighton...
STATISTICAL BULLETIN ON MONTHLY MIGRATION STATISTICS DECEMBER 2016 SERIES NO. SDT: 39-M 55. Government of Tonga
 SERIES NO. SDT: 39-M 55 Government of Tonga STATISTICAL BULLETIN ON MONTHLY MIGRATION STATISTICS DECEMBER 2016 Statistics Department P.O. Box 149, Nuku alofa, Kingdom of Tonga Website: www.spc.int/prism/tonga/
SYSTEM BRIEF DAILY SUMMARY
 SYSTEM BRIEF SUMMARY * ANNUAL (PEAK HOURS 7:00 AM TO 10:00 PM MON-SAT) MaxTemp NEL (MWH) Hr Ending Hr Ending LOAD ENERGY (MWH) INCREMENTAL COST DAY DATE Civic TOTAL MAXIMUM @Max MINIMUM @Min FACTOR ON
September Air Traffic Statistics. Prepared by the Office of Corporate Risk and Strategy
 September 214 Air Traffic Statistics Prepared by the Office of Corporate Risk and Strategy Air Traffic Summary September 214 Commercial Total Dom Int'l Passengers % Change Passenger Activity (in Millions)
Virginian Atlantic (Ecoregion 8)
") Virginian Atlantic (Ecoregion 8) Background The Virginian Atlantic Ecoregion extends from the south side of Cape Cod to Cape Hatteras in North Carolina. The waters of the ecoregion are a mix of cold and
Virginian Atlantic (Ecoregion 8) Background The Virginian Atlantic Ecoregion extends from the south side of Cape Cod to Cape Hatteras in North Carolina. The waters of the ecoregion are a mix of cold and
Passenger and Cargo Statistics Report
 Passenger and Cargo Statistics Report RenoTahoe International Airport September 2018 U.S. DOMESTIC INDUSTRY OVERVIEW FOR SEPTEMBER 2018 Systemwide RNO Carriers Domestic Flights year over year comparison
air traffic statistics
 October 213 air traffic statistics Prepared by the Office of Finance Department of Internal Controls, Compliance and Financial Strategy Metropolitan Washington Airports Authority Air Traffic Statistics
U.S. DOMESTIC INDUSTRY OVERVIEW FOR MARCH
 Inter-Office Memo Reno-Tahoe Airport Authority Date: April 30, 2009 To: Statistics Recipients From: Krys T. Bart, A.A.E., President/CEO Subject: RENO-TAHOE INTERNATIONAL AIRPORT PASSENGER STATISTICS U.S.
January Air Traffic Statistics. Prepared by the Office of Marketing & Consumer Strategy
 January 218 Air Traffic Statistics Prepared by the Office of Marketing & Consumer Strategy This report includes only data submitted by airlines as of the date of publication: March 21, 218. Reports are
Rapid Maritime Response
 Rapid Maritime Response presented to 13 th MACHC Katie Ries Coast Survey is set up for rapid maritime response Navigation managers coordinate activities and assets with Coast Guard, port officials,
Table of Contents PAGE
 DECEMBER 2018 EL PASO INTERNATIONAL AIRPORT MONTHLY ACTIVITY REPORT December 2018 Table of Contents PAGE AIRPORT ACTIVITY OVERVIEW 1 NONSTOP DESTINATION ANALYSIS 2 MAP OF NONSTOP DESTINATIONS 3 FLIGHT
February Air Traffic Statistics. Prepared by the Office of Corporate Risk and Strategy
 February 215 Air Traffic Statistics Prepared by the Office of Corporate Risk and Strategy Commercial Total Dom Int'l Passengers % Change Air Traffic Summary February 215 Passenger Activity (in Millions)
March 2014 Passenger and Cargo Traffic Statistics Reno-Tahoe International Airport
 March 2014 Passenger and Cargo Traffic Statistics Reno-Tahoe International Airport April 25, 2014 U.S. DOMESTIC INDUSTRY OVERVIEW FOR MARCH 2014 All RNO Carriers Domestic Systemwide year over year comparison
TENTATIVE SCHEDULE
 TENTATIVE SCHEDULE 20-2015 Facility Dredge Depth (- ft MLLW) 20 Spring Early Summer 20/2012 2012/2013 HWRP/ HWRP/ HWRP/ SFDODS SF- MWP Upland SFDODS SF- MWP upland SFDODS SF- MWP upland SFDODS SF- 2013/2014
2012 RESULT PRESENTATION
 212 RESULT PRESENTATION BJÖRN ROSENGREN, PRESIDENT & CEO 25 JANUARY 213 Wärtsilä Net sales back to growth with stable profitability 212 development Order intake EUR 4,94 million, +9% Net sales EUR 4,725
Oct-17 Nov-17. Travel is expected to grow over the coming 6 months; at a slower rate
 Analysis provided by TRAVEL TRENDS INDEX OCTOBER 2018 CTI reading of 51.6 in October 2018 indicates that travel to or within the U.S. grew 3.2% in October 2018 compared to October 2017. LTI predicts travel
Table of Contents PAGE
 NOVEMBER 2018 EL PASO INTERNATIONAL AIRPORT MONTHLY ACTIVITY REPORT November 2018 Table of Contents PAGE AIRPORT ACTIVITY OVERVIEW 1 NONSTOP DESTINATION ANALYSIS 2 MAP OF NONSTOP DESTINATIONS 3 FLIGHT
Table of Contents PAGE
 OCTOBER 2018 EL PASO INTERNATIONAL AIRPORT MONTHLY ACTIVITY REPORT October 2018 Table of Contents PAGE AIRPORT ACTIVITY OVERVIEW 1 NONSTOP DESTINATION ANALYSIS 2 MAP OF NONSTOP DESTINATIONS 3 FLIGHT SCHEDULE
air traffic statistics
 July 23 air traffic statistics Prepared by the Office of Finance Department of Internal Controls, Compliance and Financial Strategy Air Traffic Summary July 23 Below is a summary of the July 23 Air Traffic
August 2014 Passenger and Cargo Traffic Statistics Reno-Tahoe International Airport
 August 2014 Passenger and Cargo Traffic Statistics Reno-Tahoe International Airport October 8, 2014 U.S. DOMESTIC INDUSTRY OVERVIEW FOR AUGUST 2014 All RNO Carriers Domestic Systemwide year over year comparison
Panama Canal Expansion Antecedents
 Panama Canal Expansion Antecedents May 1879: Baron Godin de Lepinay Canal Lock proposal at the International Congress for Study of an Interoceanic Canal ignored. January 1906: Report of the Consulting
The Panama Canal Expansion: Myths and Realities for the North American Economy
 2015 Center for Transportation Studies Research Conference, University of Minnesota The Panama Canal Expansion: Myths and Realities for the North American Economy Jean-Paul Rodrigue Professor, Dept. of
Table of Contents PAGE
 April 2015 EL PASO INTERNATIONAL AIRPORT MONTHLY ACTIVITY REPORT April 2015 Table of Contents PAGE AIRPORT ACTIVITY OVERVIEW 1 NONSTOP DESTINATION ANALYSIS 2 MAP OF NONSTOP DESTINATIONS 3 FLIGHT SCHEDULE
September 2013 Passenger and Cargo Traffic Statistics Reno-Tahoe International Airport
 September 2013 Passenger and Cargo Traffic Statistics Reno-Tahoe International Airport October 31, 2013 U.S. DOMESTIC INDUSTRY OVERVIEW FOR SEPTEMBER 2013 All RNO Carriers Systemwide year over year comparison
Performance monitoring report 2017/18
 Performance monitoring report /18 Gatwick Airport Limited 1. Introduction Date of issue: 20 July 2018 This report provides an update on performance at Gatwick in the financial year /18, ending 31 March
Guidance for operators of recreation craft
 Wir machen Schifffahrt möglich. Guidance for operators of recreation craft Kiel Canal Guidance for operators of recreation craft 3 Dear recreation craft operators, You want to navigate the Kiel Canal with
August Air Traffic Statistics. Prepared by the Office of Corporate Risk and Strategy
 August 215 Air Traffic Statistics Prepared by the Office of Corporate Risk and Strategy Metropolitan Washington Airports Authority Air Traffic Statistics Table of Contents Summary Air Traffic Summary...
air traffic statistics
 June 23 air traffic statistics Prepared by the Office of Finance Department of Internal Controls, Compliance and Financial Strategy Metropolitan Washington Airports Authority Air Traffic Statistics Table
Norfolk District North Atlantic Division
 Norfolk District North Atlantic Division Eastern Chapter of WEDA Fall Conference October 9, 2012 Stephen J. Powell, P.E. (757) 201-7788 US Army Corps of Engineers 5-Year Dredging Schedule (By dredge type)
30 November Randall G. Hintz Chief, Operations Support Branch Operations Division. US Army Corps of Engineers BUILDING STRONG
 30 November 2011 Randall G. Hintz Chief, Operations Support Branch Operations Division US Army Corps of Engineers Overview MAINTENANCE PROJECTS Deep Draft Channels Shallow Draft Channels Coastal Inlets
Managing And Understand The Impact Of Of The Air Air Traffic System: United Airline s Perspective
 Managing And Understand The Impact Of Of The Air Air Traffic System: United Airline s Perspective NEXTOR NEXTOR Moving Moving Metrics: Metrics: A Performance-Oriented View View of of the the Aviation Aviation
DEPARTMENT OF THE NAVY USS MARYLAND (SSBN 738) FPO AA Ser NAV/ Mar 94 From: Commanding Officer, USS MARYLAND (SSBN 738) (GOLD) To
 FPO AA Ser NAV/ Mar 94 From: Commanding Officer, USS MARYLAND (SSBN 738) (GOLD) To") DEPARTMENT OF THE NAVY USS MARYLAND (SSBN 738) FPO AA -2-2129 5757 Ser NAV/112 25 Mar 94 From: Commanding Officer, USS MARYLAND (SSBN 738) (GOLD) To : Director of Naval History (OP-09BH), Washington Navy
DEPARTMENT OF THE NAVY USS MARYLAND (SSBN 738) FPO AA -2-2129 5757 Ser NAV/112 25 Mar 94 From: Commanding Officer, USS MARYLAND (SSBN 738) (GOLD) To : Director of Naval History (OP-09BH), Washington Navy
Jan-18. Dec-17. Travel is expected to grow over the coming 6 months; at a slower rate
 Analysis provided by TRAVEL TRENDS INDEX DECEMBER 2018 CTI reading of 51.8 in December 2018 indicates that travel to or within the U.S. grew 3.6% in December 2018 compared to December 2017. LTI predicts
SAN LUIS OBISPO COUNTY REGIONAL AIRPORT ANNUAL AIRLINE PASSENGER SUMMARY SUMMARY BY YEAR AND MONTH 4/11/2018
 ANNUAL AIRLINE PASSENGER SUMMARY SUMMARY BY YEAR AND MONTH 4/11/ JAN FEB MAR IL E Y T 35,023 36,435 38,282 38,390 37,848 35,589 38,325 37,433 32,324 31,169 32,771 33,627 30,978 24,586 23,382 2017 24,586
SAN FRANCISCO INTERNATIONAL AIRPORT
 SAN FRANCISCO INTERNATIONAL AIRPORT COMPARATIVE TRAFFIC REPORT December 2004 Fiscal Year-To-Date Dec 2004 Dec 2003 % Change 2004 2003 % Change Flight Operations - Total * Air Carrier Air Taxi Civil Military
December 2012 Passenger and Cargo Traffic Statistics Reno-Tahoe International Airport
 December 2012 Passenger and Cargo Traffic Statistics Reno-Tahoe International Airport January 29, 2013 U.S. DOMESTIC INDUSTRY OVERVIEW FOR DECEMBER 2012 All RNO Carriers Systemwide year over year comparison
Passenger and Cargo Statistics Report
 Passenger and Cargo Statistics Report RenoTahoe International Airport September 2015 U.S. DOMESTIC INDUSTRY OVERVIEW FOR SEPTEMBER 2015 All RNO Carriers Domestic Systemwide year over year comparison Average
February Air Traffic Statistics. Prepared by the Office of Marketing & Consumer Strategy
 February 218 Air Traffic Statistics Prepared by the Office of Marketing & Consumer Strategy 1 This report includes only data submitted by airlines as of the date of publication: April 18, 218. Reports
Panama Canal Outlook. Jorge L. Quijano Administrator/CEO Panama Canal Authority
 Panama Canal Outlook Jorge L. Quijano Administrator/CEO Panama Canal Authority Japan November 21, 2014 Yesterday PANAMA AT A GLANCE GDP growth rate last 10 years 7.5% GDP (P) 2013 (billion of dollars)
Passenger and Cargo Statistics Report
 Passenger and Cargo Statistics Report RenoTahoe International Airport August 2015 U.S. DOMESTIC INDUSTRY OVERVIEW FOR AUGUST 2015 All RNO Carriers Domestic Systemwide year over year comparison Average
The Panama Canal Update: Some Implications for Western Hemisphere Trade
 The Panama Canal Update: Some Implications for Western Hemisphere Trade April 18, 2011 Today s Objectives Provide a brief synopsis of the potential effects of the expanded Panama Canal on Hemispheric trade
CONTAINER PORT CAPACITY STUDY
 CONTAINER PORT CAPACITY STUDY The Group, Inc. Prepared for: CDM/IWR December 2, 2010 The Group, Inc. 288 Rheem Blvd. Moraga, CA 94556 Phone 925.631.0742 Fax 925.631.7936 Contents I. SUMMARY 1 II. BACKGROUND
October Air Traffic Statistics. Prepared by the Office of Corporate Risk and Strategy
 October 214 Air Traffic Statistics Prepared by the Office of Corporate Risk and Strategy Metropolitan Washington Airports Authority Air Traffic Statistics Table of Contents Summary Air Traffic Summary...
VTRA INTRODUCING COUNTING LINES and VTOSS 2010 AIS 2010 Comparison
 VTRA INTRODUCING COUNTING LINES and VTOSS 21 AIS 21 Comparison Presentation by: J. Rene van Dorp GWU Personnel: Dr. J. Rene van Dorp VCU Personnel: Dr. Jason R. W. Merrick FEBRUARY 6, 213 BY COURTESY OF
Keflavik International Airport Passenger forecast 2018
 Keflavik International Airport Passenger forecast 2018 2 Keflavik International Airport Passenger forecast Keflavik International Airport 2018 3 Passenger Forecast 2018 Forecast 2018 6,409,312 3,971,969
MOBILE DISTRICT 2018 DREDGING PROGRAM
 MOBILE DISTRICT 2018 DREDGING PROGRAM SOUTH ATLANTIC DIVISION U.S. ARMY CORPS OF ENGINEERS Trusted Partners Delivering Value Today for a Better Tomorrow US Army Corps of Engineers BUILDING STRONG MOBILE
Measures & Projections October 31, GoToBermuda.com
 Measures & Projections October 31, 2015 GoToBermuda.com October Total Vacation Visitor Arrivals Vacation Arrivals Oct-14 Oct-15 2015 Air Vacation 9,203 10,344 1,141 12.40 126,842 127,044 202 0.16 Cruise
August Air Traffic Statistics. Prepared by the Office of Marketing & Consumer Strategy
 August 218 Air Traffic Statistics Prepared by the Office of Marketing & Consumer Strategy This report includes only data submitted by airlines as of the date of publication: October 17, 218. Reports are
December Air Traffic Statistics. Prepared by the Office of Marketing & Consumer Strategy
 December 217 Air Traffic Statistics Prepared by the Office of Marketing & Consumer Strategy 1 This report includes only data submitted by airlines as of the date of publication: February 2, 217. Reports
AFTA Travel Trends. June 2017
 AFTA Travel Trends June 2017 AFTA Travel Trends Report 2017 Inbound and Outbound overview Introduction This snapshot provides an overview of the balance of trade between Inbound and Outbound Travel for
Post tsunami Recovery of Port and Harbor areas in Japan from the 2011 Great East Japan Earthquake Tsunami
 Date : 18 Nov., 2015 Venue : Furama Ballroom 1 SESSION 1 : A Decade of Partnerships in Sustainable Development of the Seas of East Asia: Synergies and Achievements WORKSHOP 1.1 : Managing Risks in Climate
ECONOMIC CONSEQUENCES OF PIRACY AND ARMED ROBBERY ON SHIPPING
 EUROPEAN COMMISSION SEMINAR PIRACY AND ARMED ROBBERY AGAINST SHIPPING BRUSSELS 21st JANUARY 2009 ECONOMIC CONSEQUENCES OF PIRACY AND ARMED ROBBERY ON SHIPPING Presentation by G. De Monie MSc. Senior Director
Expanding Capacity of the Panama Canal
 Expanding Capacity of the Panama Canal TRB 2006 Summer Conference La Jolla, California July 9-11, 2006 Rodolfo Sabonge Director, Corporate Planning and Marketing We are all part of the Global Transportation
October 2018 October 2017 Change
 AIR TRAFFIC REPORT SUMMARY: OCTOBER PASSENGERS October October Change Domestic Passengers 1,969,141 1,861,225 5.8% International Passengers 89,328 74,157 20.5% Total Passengers 2,058,469 1,935,382 6.4%
SJC North and South Flow
 SJC North and South Flow Pre and Post OAPM Date: January 2018 Phases of Flight ATCC ARTCC ATCC 2 AviationTerms VFR- Visual Flight Rules. Pilots must maneuver to avoid clouds and are responsible for their
ATM Network Performance Report
 ATM Network Performance Report 2018. Page 1 of 16 Table of contents Summary... 3 Network Wide Performance... 4 Airborne delay... 4 Sydney... 6 Airborne delay... 6 Notable events... 6 Melbourne... 9 Airborne
Passenger and Cargo Statistics Report
 Passenger and Cargo Statistics Report RenoTahoe International Airport September 2017 U.S. DOMESTIC INDUSTRY OVERVIEW FOR SEPTEMBER 2017 Systemwide RNO Carriers Domestic Flights year over year comparison
Questions and Answers
 Home The Region Questions & Answers Documents Maps & Imagery Reserve Council Public Comment Search This Site About This Site Questions and Answers 1. Why is the President making this announcement? 2. What
Norfolk District North Atlantic Division
 Norfolk District North Atlantic Division Eastern Chapter of WEDA Fall Conference October 26, 2016 Stephen J. Powell, P.E. (757) 201-7788 US Army Corps of Engineers Norfolk District FY-17 Dredging Program
January 2014 Passenger and Cargo Traffic Statistics Reno-Tahoe International Airport
 January 2014 Passenger and Cargo Traffic Statistics Reno-Tahoe International Airport March 12, 2014 U.S. DOMESTIC INDUSTRY OVERVIEW FOR DECEMBER 2013 All RNO Carriers Domestic Systemwide year over year