34 TH ANNUAL GENERAL MEETING
|
|
|
- Margery Casey
- 6 years ago
- Views:
Transcription

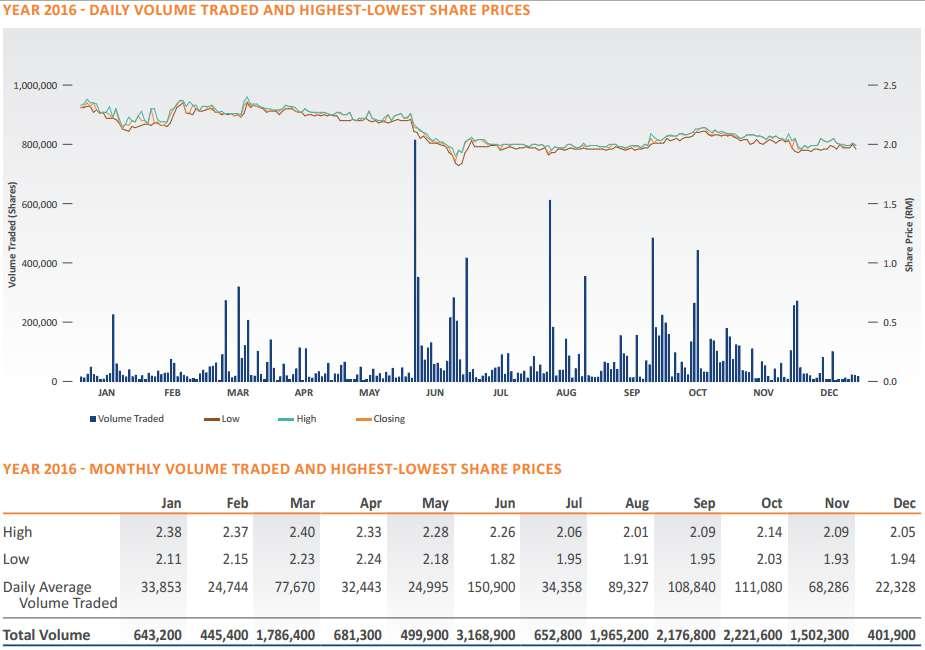
1 SURIA CAPITAL HOLDINGS BERHAD 34 TH ANNUAL GENERAL MEETING 22 ND MAY 2017 WISMA SABAHPORTS, SAPANGAR

2 CONTENTS CORPORATE INTRODUCTION YEAR 2016 FINANCIAL HIGHLIGHTS Group s Performance Segmental Performance Performance of Port Operations PORT EXPANSION PROJECTS DIVERSIFICATION Jesselton Quay Project One Jesselton Waterfront Project Proposed International Cruise Terminal
3 CORPORATE INTRODUCTION
4 Our Vision To be a leading investment corporation in ports and portrelated businesses in Malaysia.
5 Our Mission To enhance the long term value of the Group by: Creating sustainable returns to our shareholders Achieving excellence in all our business undertakings Embracing best practices in our business processes Enriching the lives of our employees whilst always caring for the environment and community within which we operate.
6 Suria Corporate Milestones 1983 Property 1996 Financial 2001 Investment Holding 2004 Port Operations Diversified (Property) Property Development Company Taman Perusahaan Berat S/B TPB Holdings S/B TPB Holdings Berhad 1 Dec Dec 1995 Acquisition of SBB and SDB Listed on Main Board, Bursa Suria Capital Holdings Berhad Disposal of SDB to State Gov. Disposal of SBB to Alliance Bank Suria under PN10 status Acquisition of port operations (Privatisation Exercise) Set-up of other subsidiaries: SP Satria SPSL SBSB SCES JV with SBC for Jesselton Quay project on 21 st May 2013 JV with AQRS for 1 Jesselton Waterfront project on 16 th March


7 Corporate Structure Suria Group of Companies 100% Sabah Ports Sdn. Bhd. Suria Capital Holdings Berhad Investment Holding and Property Development 100% 100% 100% 100% S.P. Satria Logistics Sdn. Bhd. S.P. Satria Sdn. Bhd. SCHB Engineering Services Sdn. Bhd. Suria Bumiria Sdn. Bhd. (dormant) Port Operations, Equipment Supply & Maintenance, Bunkering & Logistics Services Contract & Engineering, Ferry Terminal Operation

8 Shareholding Structure Authorized Share Capital = RM800 million Issued = 288,183,992 Ordinary Shares at RM 1.00 each
9 TOP 10 SHAREHOLDERS OF SURIA No SHAREHOLDER S NAME HOLDINGS % 1 WARISAN HARTA SABAH SDN BHD 130,827, LEMBAGA TABUNG HAJI 26,800, YAYASAN SABAH 10,571, CARTABAN NOMINEES (TEMPATAN) SDN. BHD. ICAPITAL.BIZ BERHAD 9,244, CITIGROUP NOMINEES (ASING) SDN. BHD. 4,991, CHIEF MINISTER, STATE OF SABAH 4,800, AMANAHRAYA TRUSTEES BERHAD 3,297, KUMPULAN WANG PERSARAAN 3,201, SIAW TECK HWA 2,000, PUBLIC NOMINEES (TEMPATAN) SDN. BHD. 1,773, TOTAL 197,507, As at
10 State Government of Sabah as Major Shareholder HOLDINGS % WARISAN HARTA SABAH SDN BHD 130,827, YAYASAN SABAH 10,571, CHIEF MINISTER, STATE OF SABAH 4,800, SABAH STATE GOVERNMENT (direct and indirect shareholding) 146,198,


11 DIVIDEND PAYOUT POLICY Year 2006 Year % of net profit 35% of net profit
12 Dividend Payout History Financial Year Rate (sen) Tax Rate Final 26% Special 0% % Tax Exempt Tax Exempt Tax Exempt Tax Exempt Tax Exempt Tax Exempt Tax Exempt 2016 (Proposed) 7.00 Tax Exempt
13
14 GROUP S PERFORMANCE
15 Group s Performance (Income Statement) Year 2016 vs Year 2015 Audited Audited Inc/(Dec) RM'000 RM'000 RM'000 % Revenue 258, ,652 (238,140) (48) Cost of sales (158,714) (302,613) (143,899) (48) Gross profit 99, ,039 (94,241) (49) Gross profit margin 39% 39% Other items of income Interest income 2,385 3,563 (1,178) (33) Other income 31,351 29,481 1,870 6 Other items of expense Administrative expenses (27,216) (38,009) (10,793) (28) Finance costs (5,896) (7,640) (1,744) (23) Other expenses (16,889) (33,186) (16,297) (49) Profit before tax 83, ,248 (64,715) (44) Income tax expense (16,870) (22,531) (5,661) (25) Profit net of tax 66, ,717 (59,054) (47) Profit margin 26% 25% Profit net of tax attributable to: Owners of the Company 66, ,434 Non-controlling interests - (717) 66, ,717 Basic earnings per share (sen) PBT Margin 32% 30% 15
16 Group s Performance (Income Statement) Year 2016 vs Year 2015 (COMPARISON WITHOUT PROPERTY DEVELOPMENT SEGMENT) Unaudited Unaudited Inc/(Dec) RM'000 RM'000 RM'000 % Revenue 258, ,652 (238,140) (48) Less: Property development income - (229,226) (A) 258, ,426 (8,914) (3) Cost of sales (158,714) (302,613) (143,899) (48) Less: Land cost (16.25 acres) - 120,885 (B) (158,714) (181,728) (23,014) (13) Gross profit (C) = (A - B) 99,798 85,698 14, Gross profit margin 39% 32% Other items of income Interest income 2,385 3,563 (1,178) (33) Other income 31,351 29,481 1,870 6 Less: Unwinding of discount of TR (17,320) (12,893) (D) 16,416 20,151 (3,735) (19) Other items of expense Administrative expenses (27,216) (38,009) (10,793) (28) Finance costs (5,896) (7,640) (1,744) (23) Other expenses (16,889) (33,186) (16,297) (49) (E) (50,001) (78,835) (28,834) (37) Profit before tax (C+D-E) 66,213 27,014 39, Income tax expense (16,870) (22,531) (5,661) (25) Add: Deferred tax (property development) (3,703) (1,852) RPGT 7,411 25,838 Profit net of tax 53,051 28,469 24, Profit margin 21% 11% 16
17 SUMMARY YTD YTD RM'000 RM'000 Revenue 258, ,652 Profit for the year 66, ,717 Add back: Interest 5,896 7,640 Taxation 16,870 22,531 Depreciation 2,459 2,469 Amortisation 37,385 38,341 62,610 70,981 EBITDA 129, ,698 17

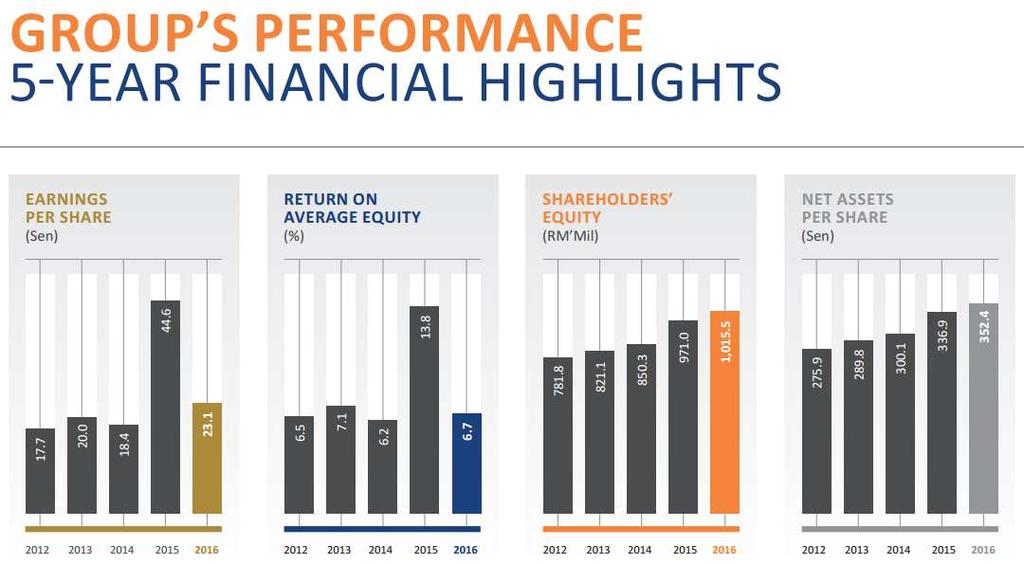
18 Past 5-Year Financial Highlights (Group)
19
20 SEGMENTAL PERFORMANCE
21 Segmental Performance of the Group Year 2016 vs Year months 12 months Inc/(Dec) RM'000 % RM'000 % RM'000 % Property development - 0% 229,226 46% (229,226) (100) Port operations 248,822 96% 226,491 46% 22, Logistics & Bunkering 4,787 2% 36,180 7% (31,393) (87) Contract and engineering and ferry terminal operations 4,903 2% 4,755 1% , % 496, % (238,140) (48) 21
![Group s Revenue by Segments for Year 2016 (RM 000) [CATEGORY NAME] [VALUE],](/docs-images/78/78390947/images/22-1.jpg "[PERCENTAGE] [CATEGORY NAME] [VALUE], [PERCENTAGE] [CATEGORY NAME] [VALUE],")
22 Group s Revenue by Segments for Year 2016 (RM 000) [CATEGORY NAME] [VALUE], [PERCENTAGE] [CATEGORY NAME] [VALUE], [PERCENTAGE] [CATEGORY NAME] [VALUE], [PERCENTAGE]

23 Performance by the Group (Revenue by Segments) Year 2016 vs Year months 12 months Inc/(Dec) RM'000 % RM'000 % RM'000 % Property development - 0% 229,226 46% (229,226) (100) Port operations 248,822 96% 226,491 46% 22, Logistics & Bunkering 4,787 2% 36,180 7% (31,393) (87) Contract and engineering and ferry terminal operations 4,903 2% 4,755 1% , % 496, % (238,140) (48) Logistics & Bunkering, 4,787, 2% Contract engineering and ferry terminal operations, 4,903, 2% Property development, -, 0% Logistics & Bunkering, 36,180, 7% Contract engineering and ferry terminal operations, 4,755, 1% Port operations, 248,822, 96% Port operations, 226,491, 46% Property development, 229,226, 46%
, 0% Repair &")

24 Major Port Expenses Year 2016 Total expenses = RM206,703,000 Year 2015 Total expenses = RM215,869,000 Others, 28,767, 14% Construction cost, 30,981, 15% Impairment loss, 2,500, 1% Fuel & Oil, 3,140, 2% [CATEGORY NAME], 20,305, [PERCENTAGE] Port Lease, 11,252, 5% RM 000 Stevedorage/ Contract labour, 8,642, 4% Staff Expenses, 49,256, 24% Professional fees / Consultancy, (35), 0% Repair & Maintenance, 17,720, 9% Depreciation & Amortisation, 37,229, 18% Construction cost, 9,289, Impairment 4% loss, 11,727, 6% Fuel & Oil, 3,530, 2% Taxation, 16,621, 8% Port Lease, 14,805, 7% Stevedorage / Contract labour, 9,665, 5% Others, 14,287, 7% Depreciation & Amortisatio n, 38,408, 18% RM 000 Repair & Maintenanc e, 21,104, 10% Staff Expenses, 59,282, 29% Professional fees / Consultancy, 7,863, 4%

25 P O R T S U N D E R S P S B Kudat Port Mowtas Oil Jetty Karamunting Oil Jetty Sapangar Bay Oil Terminal Sandakan Port Sapangar Bay Container Port Lahad Datu Port Lahad Datu Oil Jetty Kota Kinabalu Port Tanjung Batu Oil Jetty Tawau Port Kunak Port

 Total Tonnage (MT'000) - At")
 -9% - At Anchor 17,840 11,009 6,831 62%")
26 Port Operations (Cargo Throughput) Year 2016 vs Year 2015 YTD YTD Inc/ (Dec) Total Tonnage (MT'000) - At Wharf (excluding containers) 10,859 11,948 (1089) -9% - At Anchor 17,840 11,009 6,831 62% 28,699 22,957 5,742 25% Total TEUs 357, ,185 (5,799) -2%
27 MT( 000) Throughput at Wharf (by Major Commodity) Bulk Oil/Other Liquid Palm Oil Fertilizers PKE General Cargo Current YE 2016 Prior YE 2015
28 MT( 000) Throughput at Anchor (by Major Commodity) Bulk Oil Palm Oil Fertilizer PKE Wood products Current YE 2016 Current YE 2015 General Cargo
 General Cargo, 6,683,541.")

29 INWARD (IMPORT) Major Commodities Handled at Wharf/Anchor in 2016 Bulk Oil, 2,049,903.52, 17% Fertilizer, 1,550,735.06, 13% INWARD (IMPORT) General Cargo, 6,683,541.62, 56% Vehicles, 768,752.64, 7% Liquid Chemical, 57,541.00, 1% PKE, , 0% Palm Oil, 724,940.15, 6% General Cargo Palm Oil PKE Bulk Oil Fertilizer Vehicles Liquid Chemical

 PKE, 639,029.")
30 OUTWARD (EXPORT) Major Commodities Handled at Wharf/Anchor in 2016 Rubber, 27,508.34, 0% Palm Oil, 6,368,102.88, Liquid Chemical, 24,614.00, 0% Wood Product, 2,262,027.73, 11% Cocoa, 1,291.20, 29% 0% Bulk Oil, 8,017.94, 0% Copra, 120, 0% OUTWARD (EXPORT) PKE, 639,029.21, 3% General Cargo PKE Copra Wood Product Rubber Liquid Chemical Palm Oil Bulk Oil Cocoa General Cargo, 12,361,003.36, 57%
31 MT ( 000) 300 Containers Handled (TEUs) Sandakan Tawau Lahad Datu SBCP Current YE 2016 Prior YE 2015

32 Revenue Composition by Commodity Year 2016 vs Year 2015 RM' ,000 80,000 60,000 40,000 20,000 - Bulk Oil Palm Oil Wood Fertilizer PKE General Contain RORO Passeng Contract Products cargo ers er revenue Current YTD 29,149 41,656 3,320 11,469 6,133 28,335 93,061 4, ,981 Prior YTD 17,489 47,361 3,458 10,594 6,284 32,112 94,302 4, ,289
33 Year 2016 vs Year 2015 Current YTD Dec-16 Prior YTD Dec-15 Revenue PBT PBT Revenue PBT PBT Variance Current vs Prior Port margin margin Revenue PBT RM'000 RM'000 % RM'000 RM'000 % RM'000 % RM'000 % SBCP 73,139 11,188 15% 66,842 3,271 5% 6,297 9% 7, % Sandakan 54,967 17,873 33% 54,393 18,079 33% 574 1% (206) -1% Tawau 36,145 10,359 29% 34,289 9,008 26% 1,856 5% 1,351 15% KK 31,767 15,300 48% 20,917 6,821 33% 10,850 52% 8, % Lahad Datu 25,043 11,423 46% 25,054 9,850 39% (11) 0% 1,573 16% SBOT 14,639 8,070 55% 11,434 (6,719) -59% 3,205 28% 14, % Kunak 12,772 4,756 37% 12,975 4,523 35% (203) -2% 233 5% Kudat 312 (623) -199% 431 (477) -111% (119) -28% (146) 31% Headquarters Total: 248,784 78,345 31% 226,334 44,357 20% 22,450 10% 33,988 77%
34 RM'000 Individual Port Performance (Revenue) 80,000 70,000 60,000 50,000 40,000 30,000 20,000 10,000 - SC SK TW KK LD SB KN KD Current YE Dec-16 Prior YE Dec-15
35 RM'000 Individual Port Performance (Profit Before Tax) 20,000 15,000 10,000 5,000 - (5,000) SC SK TW KK LD SB KN KD (10,000) Current YE Dec-16 Prior YE Dec-15
36 PERFORMANCE OF PORT OPERATIONS
37 Cargo Throughput (Million Tonnes & TEUs) Year * Wharf ** Anchor Total Containers (TEUs) , , , , , , , , , , , , , , , , , , , ,386 * Wharf: cargo handled at wharves using port facilities ** Anchor: cargo handled at private jetties / mid-stream
38 HISTORICAL TREND FROM ,000 Total Cargo Throughput Wharf + Anchor ( 000 Tonnes) 35,000 30,000 25,000 20,000 15,000 10,000 5,000 0

39 % OF YEARLY INCREASE/DECREASE % of Yearly increase/decrease
40 PORT EXPANSION PROJECTS


41 Major Projects 1 2 Sapangar Bay Container Terminal Expansion ( ) Sapangar Bay Conventional Cargo Terminal (36 months) 3 4 Sapangar Bay Oil Terminal Jetty Extension (24 months) Sandakan Port Wharf Extension (24 months)
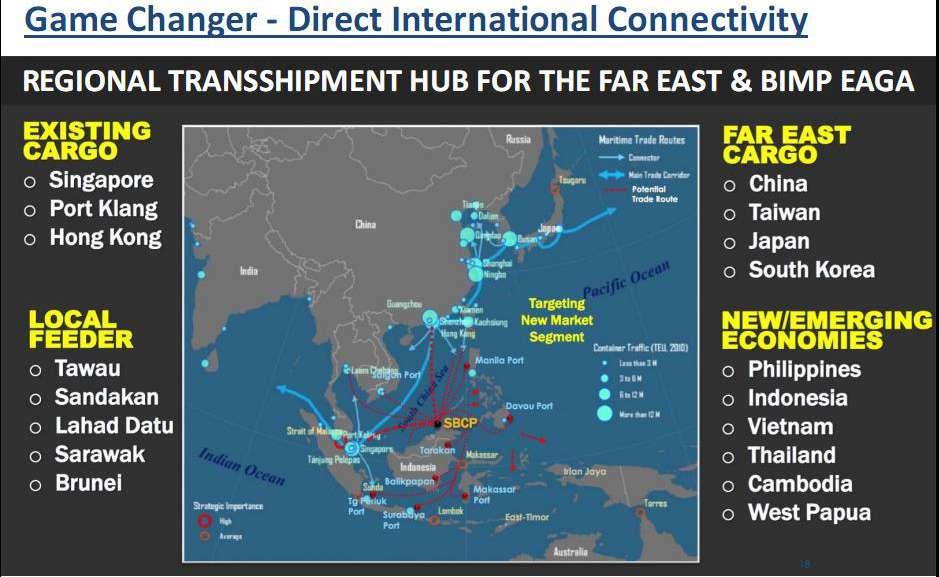
42 Sapangar Bay Container Port as a Transshipment Hub of the East Game Changer & Catalyst for the Economic Development in the State of Sabah

43 Main East-West Route and Several Transhipment Hubs 主要東西方路和幾個轉運樞紐 West East Hong Kong Sapangar Bay Container Port The strategic location of SBCP with minimum diversion from the main route
44

45 RM1.027 Billion Federal Funding for Transshipment Hub Development at Sapangar Port Source: The New Sabah Times 16 th February 2016
46 TRANSSHIPMENT HUB DEVELOPMENT Initiative under 11MP and the National Blue Ocean Strategy - Ministry of Urban Wellbeing, Housing and Local Government as lead agency overseeing the implementation of project Project through Sabah Development Corridor with Sabah Economic Development and Investment Authority (SEDIA) as implementing agency; SPSB as port operator To leverage on the port s strategic location along the main shipping route of the East Asian sea trade and being at the centre of the BIMP-EAGA region Handling capacity to be increased from current 500,000 TEUs to 1.25 million TEUs Free zone area to be established to complement expansion Expected to enhance the State s economic competitiveness in the long-run by addressing the issue of trade imbalance, lower cost of doing business and cost of living in Sabah

47 SBCP EXPANSION PROPOSED LAYOUT BERTHS 15 METERS DRAFT 60K DWT DISPLACEMENT MILLION TEUS THROUGHPUT 21 ha 13 ha 17.6 acres
48
49 KEY FINDINGS OF BUSINESS STUDY BY BMT ASIA PACIFIC


 is intra-asia E ID the largest market; target")
50 Gateway to BIMP-EAGA Cost of shipping a 20 container from Jakarta to 560k Sabah in-between the world export gateway and least developed region with huge potential Currently using national gateway with extremely high logistics cost Total market size 1.9 mil TEU, among which 1.4 mil TEU (77%) is intra-asia E ID the largest market; target niche market in S PH; cooperate with Bintulu for E MY


51 Supply Driven Strategy A Virtuous Cycle Build adequate port capability and capacity. Consolidate both direct and transhipment cargo for MLO to call directly. Logistic costs reduced due to direct calls. Economic development stimulated by the reduction in logistic costs. Direct Cargo Capacity Improvement Hinterland Expansion via Transhipment Transhipment Cargo Hinterland cargo further boosted for the port. to create a Virtuous Cycle! Industrial Development & Consumption Logistics Cost Saving Supply Driven Approach

52 Master Layout Plan Requirements of Land and Quay Length 2020/2021

53 Master Layout Plan Overall Development Principle SBCCT Phase 1B and SBCP Phase 1 to be developed in the Northeast Corner by The Southwest Wing area should be provided for the development of Phase 2 of SBCP by 2033.

54 Overall Layout Plan with Surrounding Facilities

55 Major Ports in BIMP EAGA

56 PROPOSED DEVELOPMENT OF SAPANGAR BAY CONVENTIONAL CARGO TERMINAL

57 PROPOSED DEVELOPMENT OF SAPANGAR BAY CONVENTIONAL CARGO TERMINAL
58 DIVERSIFICATION - Property Development - International Cruise Terminal Development
 Titled Land Leased Land Exhibit A Kota Kinabalu Convention City Sabah International Convention Centre")
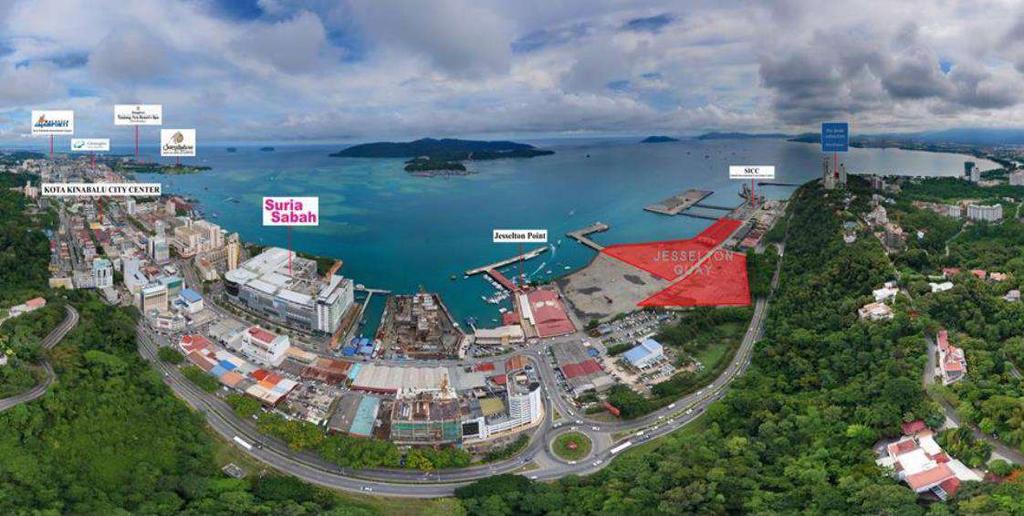
59 Approximately acres of land within Kota Kinabalu Port alienated - edged in red as Exhibit (A) Titled Land Leased Land Exhibit A Kota Kinabalu Convention City Sabah International Convention Centre Commercial Land = Previous container space and yard which was left vacant after operation was moved to the newly built RM400 million container port facility at Sapangar Bay in 2007.
60 Property Development Jesselton Quay (16.25 acres) One Jesselton Waterfront (7 acres)

61 KK Port City Centre 2KM KK International Airport 7-8 KM

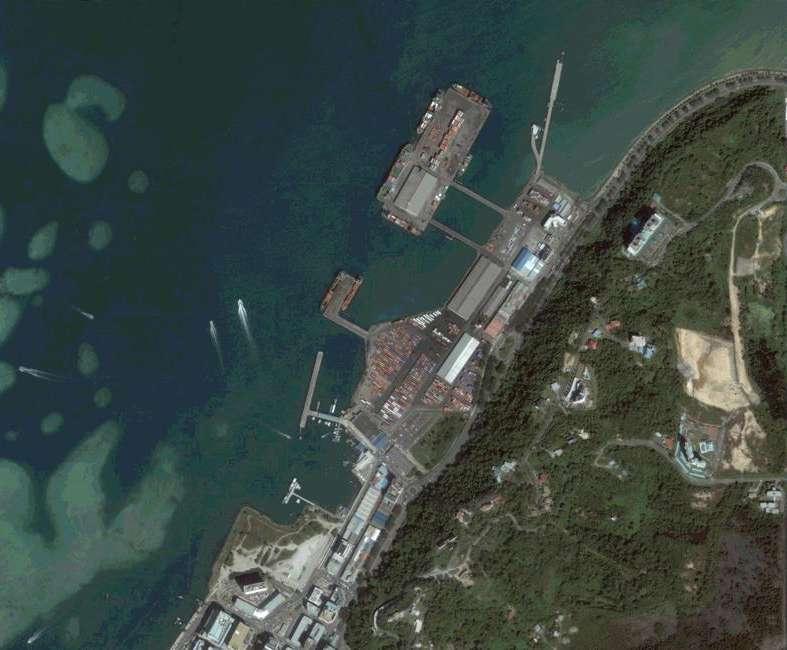
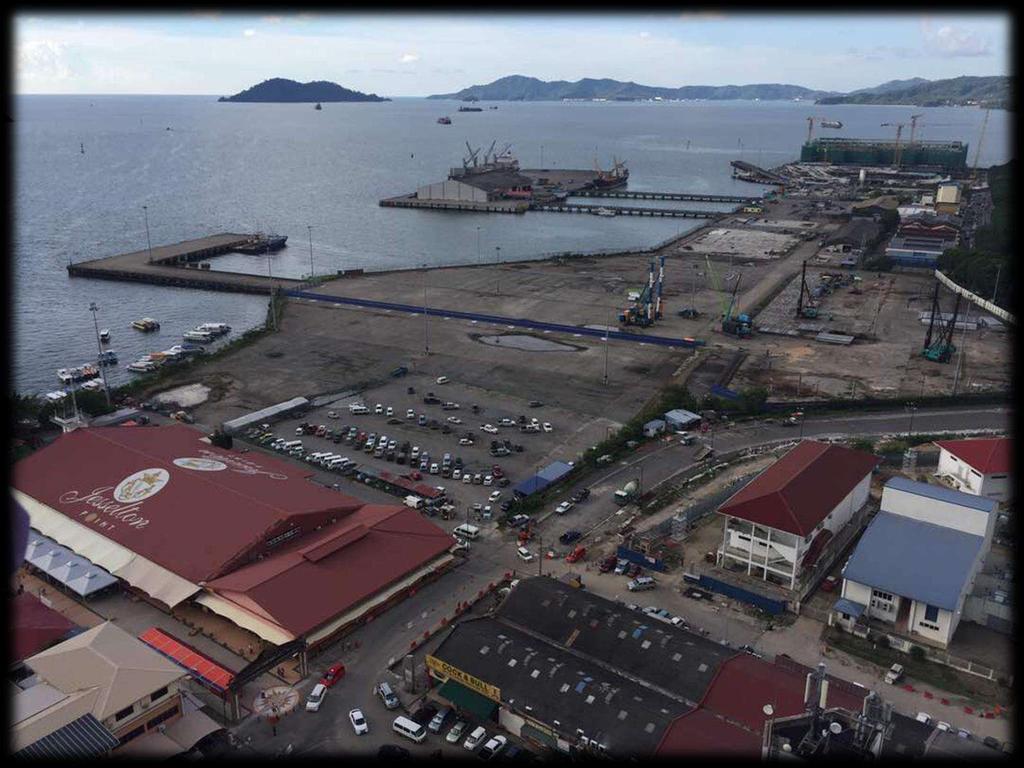
62 KK PORT AERIAL VIEW

63 KK PORT AERIAL VIEW KOTA KINABALUJW
64 One Jesselton Waterfront Project (7 acres) Kota Kinabalu Convention City Jesselton Quay Project (16.25 acres) Sabah International Convention Centre
65

66 Development land size: acres Minimum NSV: RM1.8 billion Suria s entitlement: 18% of the minimum NSV Development period: 8-10 years
67

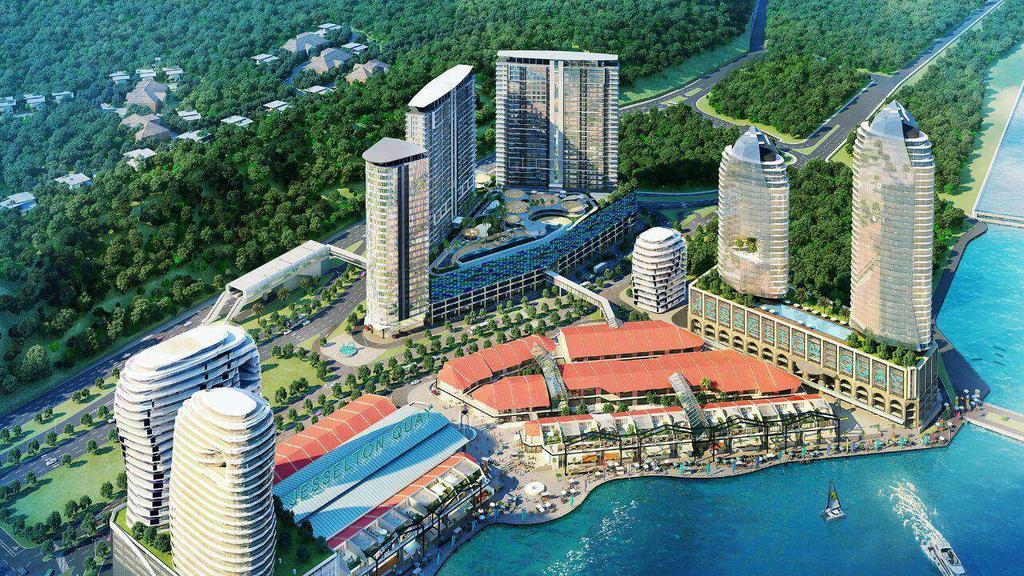
68 Towards a better CBD
 out of Shanghai.")
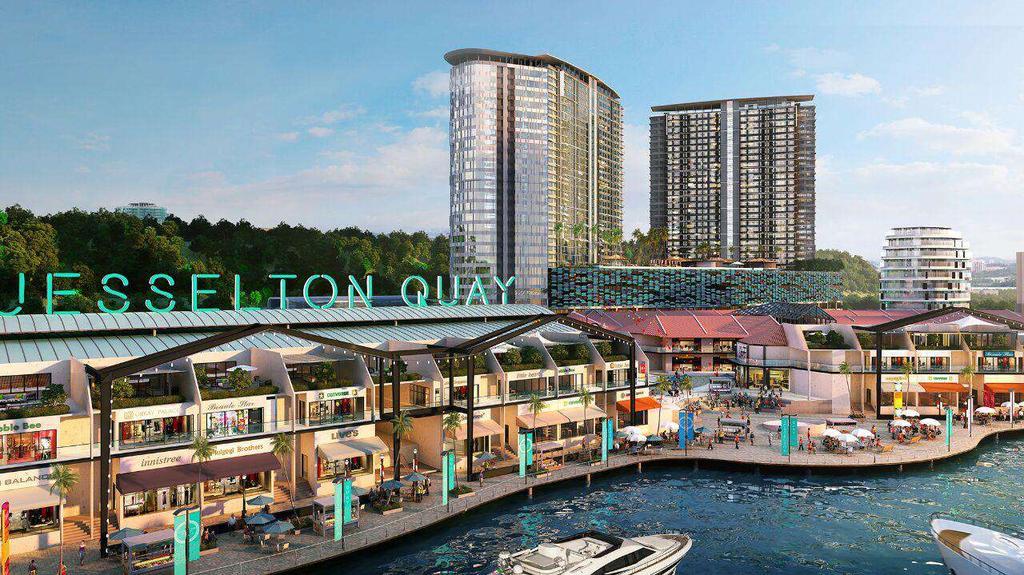
69 Jesselton Quay Masterplan Concept The best scheme was done by a Japanese design firm (Matani Studio) out of Shanghai.

70 The Shanghai experience of a Japanese Architect gave rise to a unique composition of modern towers juxtaposed against classic Borneo retail street fronts.

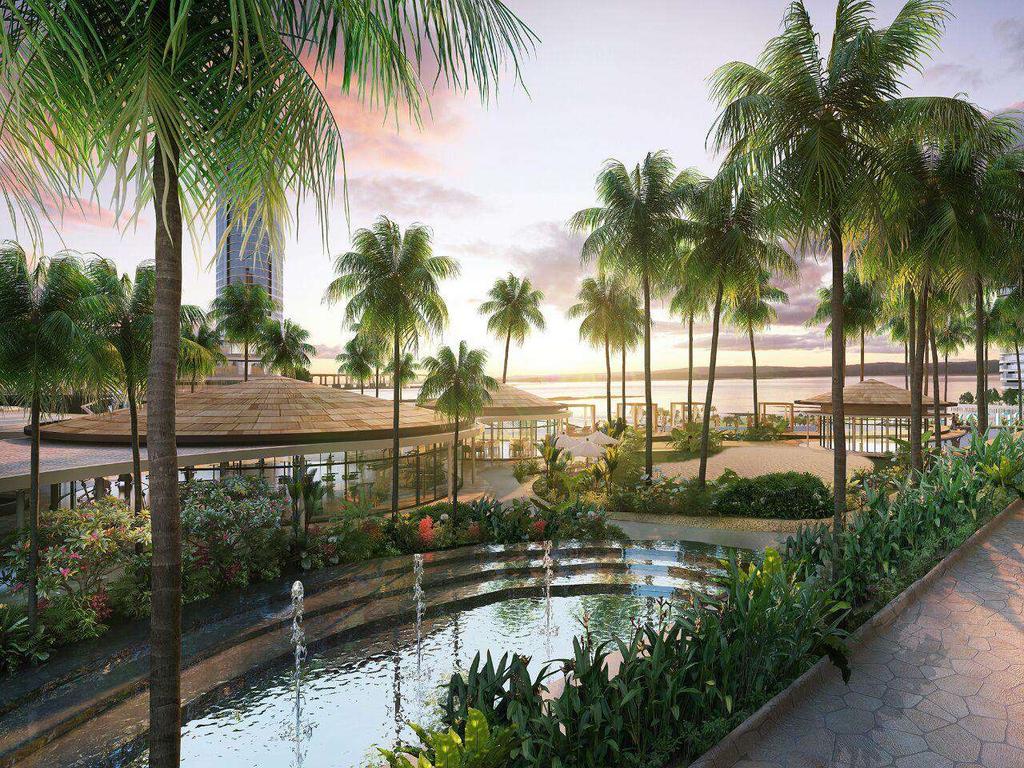
71 Like all famous port cities of the world, Jesselton Quay is about giving back to the people of KK, their original waterfront, refreshed brimming with life and activity.

72 Welcome to Jesselton Quay Master plan connects and extends Gaya Street via series of new open pedestrian walks.
73

74 Planned together with the new upcoming International Cruise Terminal, Sabah International Convention Centre & Jesselton Ferry Terminal, we can expect one of the most exciting regeneration stories of our times.
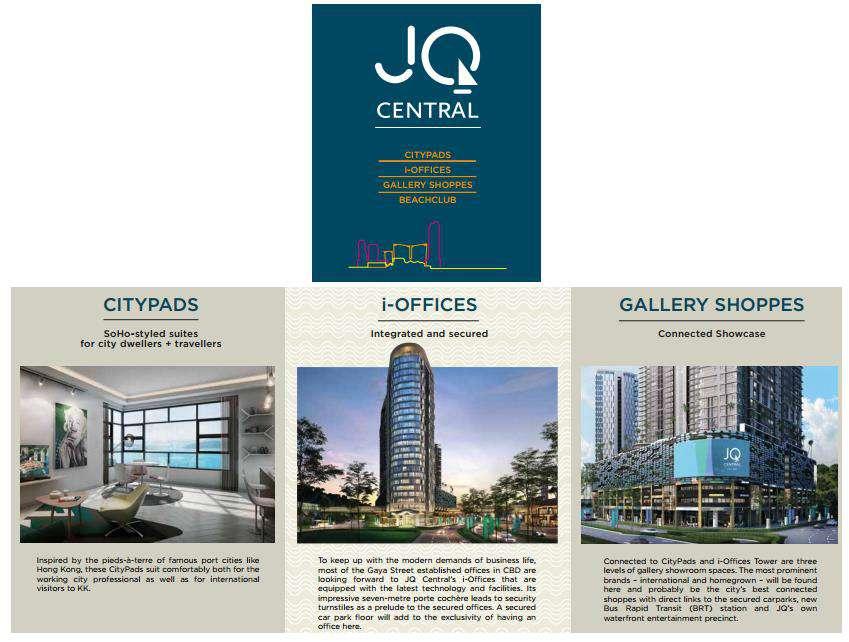
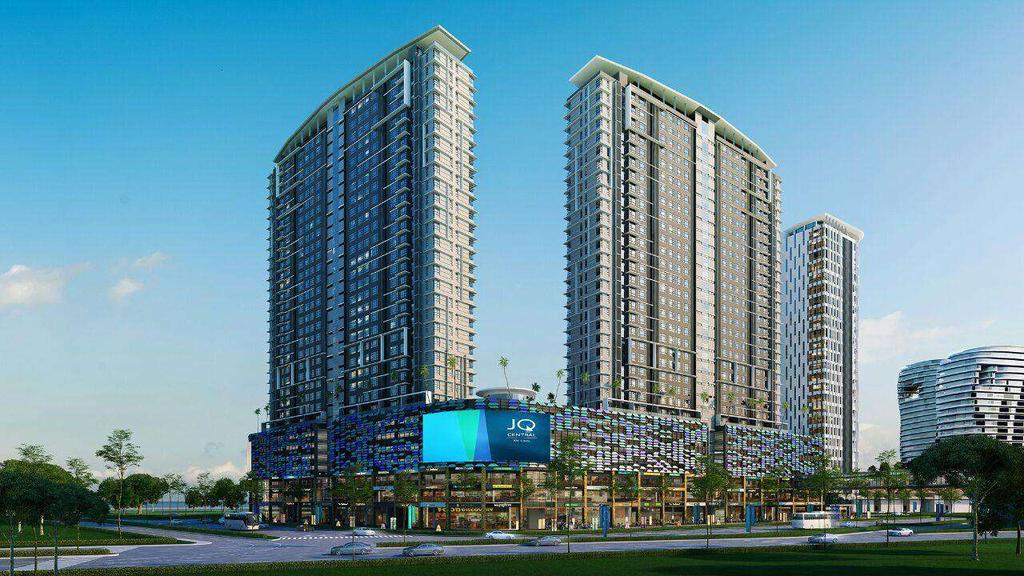
75 Status Update Development plan approved in March 2015 Sub-divided title obtained on 25 th April 2016 Iconic JQ Central to be the first phase of JQ development 77
76
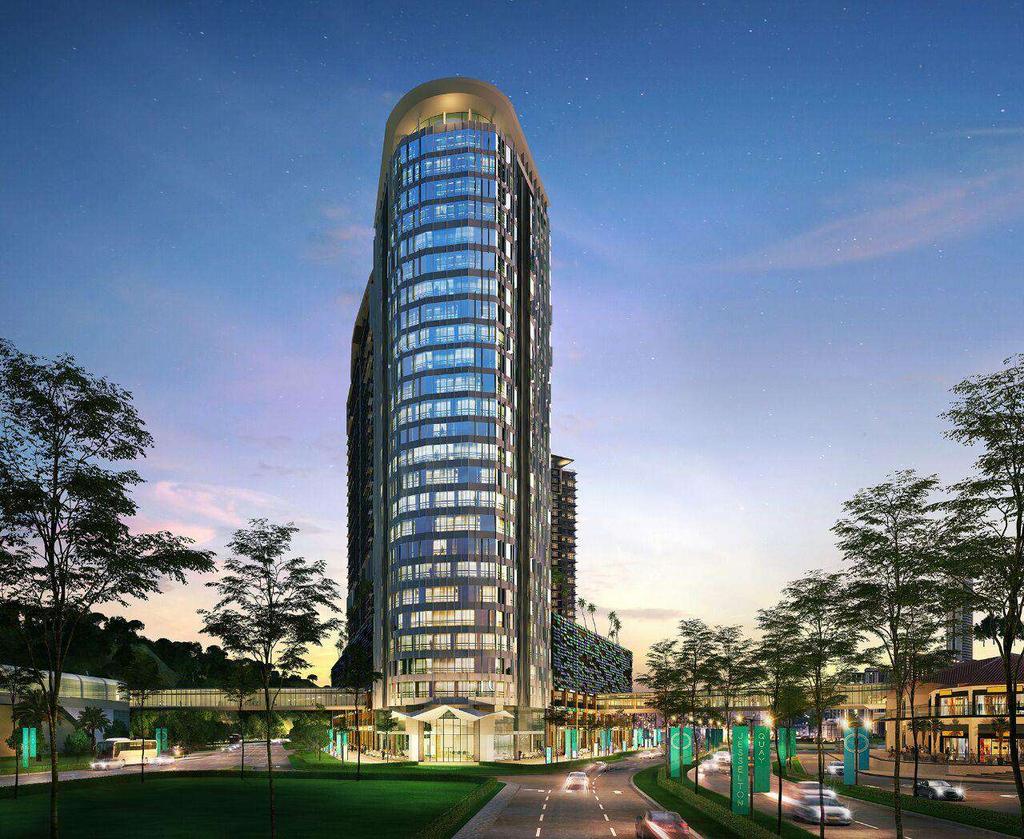
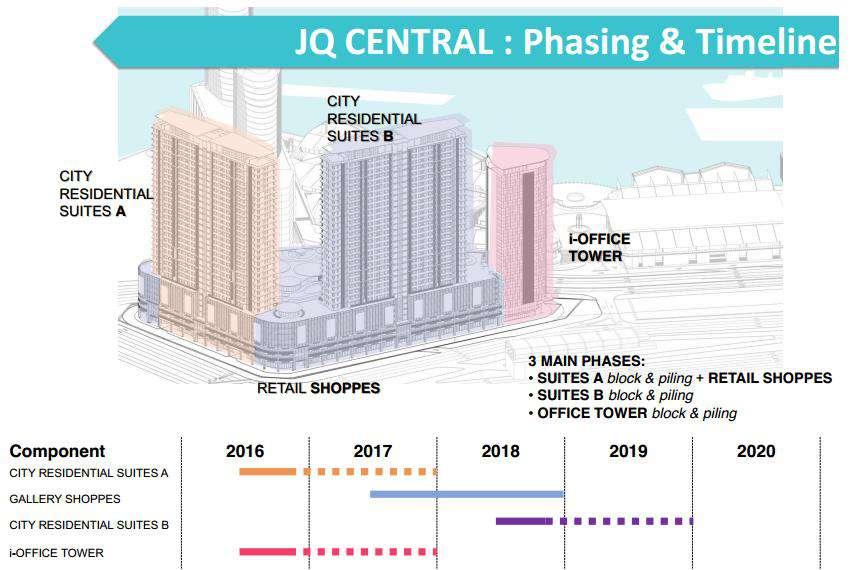
77 JQ Central JQ Central commenced construction in December 2016 Components of JQ Central: A 25-storey next generation office tower Two 25-storey commercial suites towers 37 showroom galleries 2-acre tropical-themed commercial recreation club, dubbed BeachClub
78
79
80
81


82
83

84 Preview of JQ Central CityPads 26 th October 2016 Source: Daily Express 5 th Nov 2016
85

86 OVERALL PROJECT TIMING


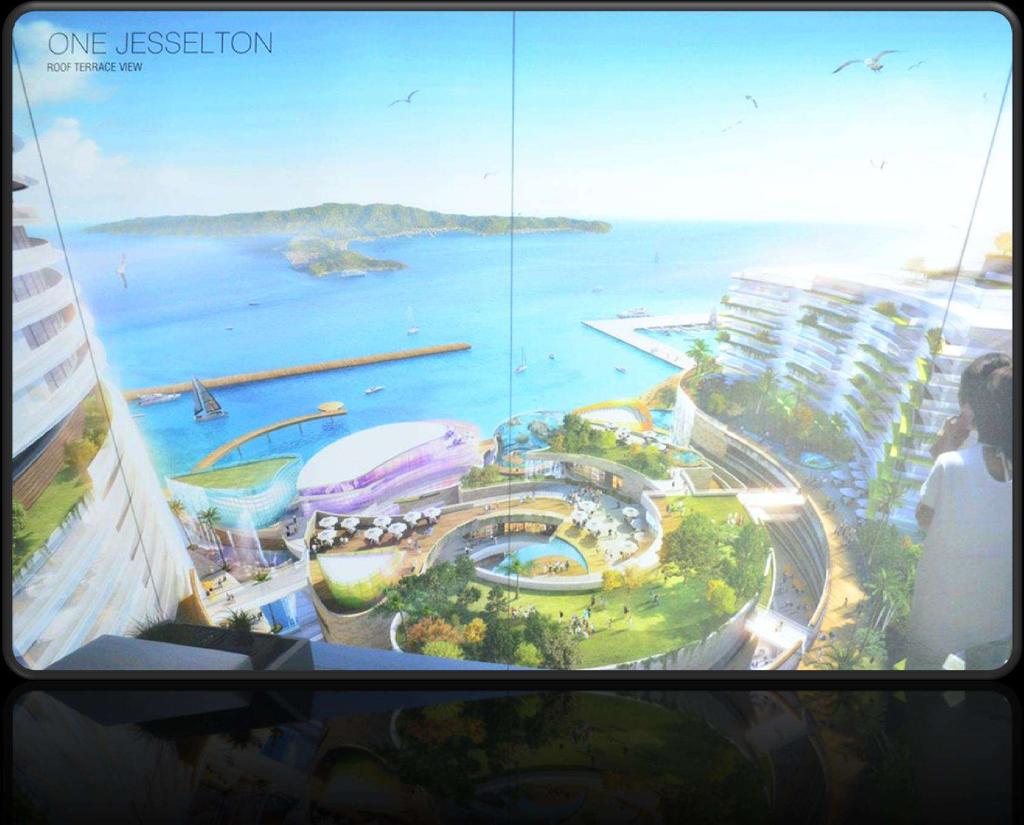
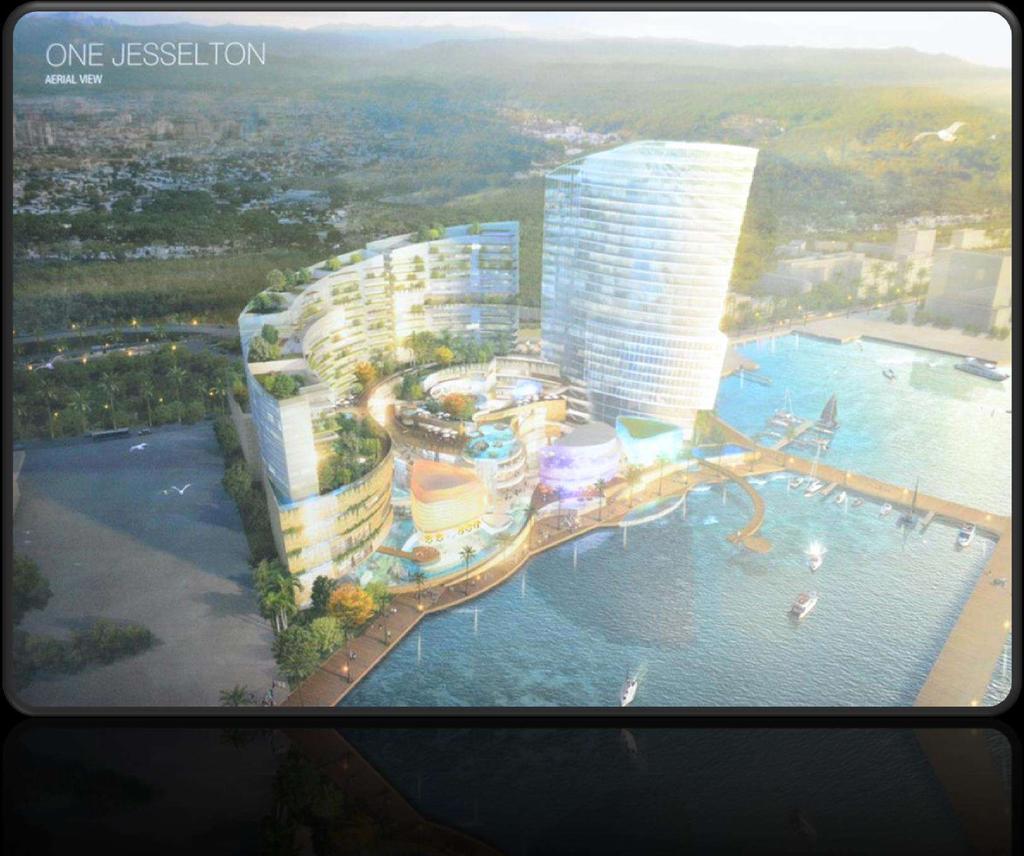
87 ONE JESSELTON WATERFRONT

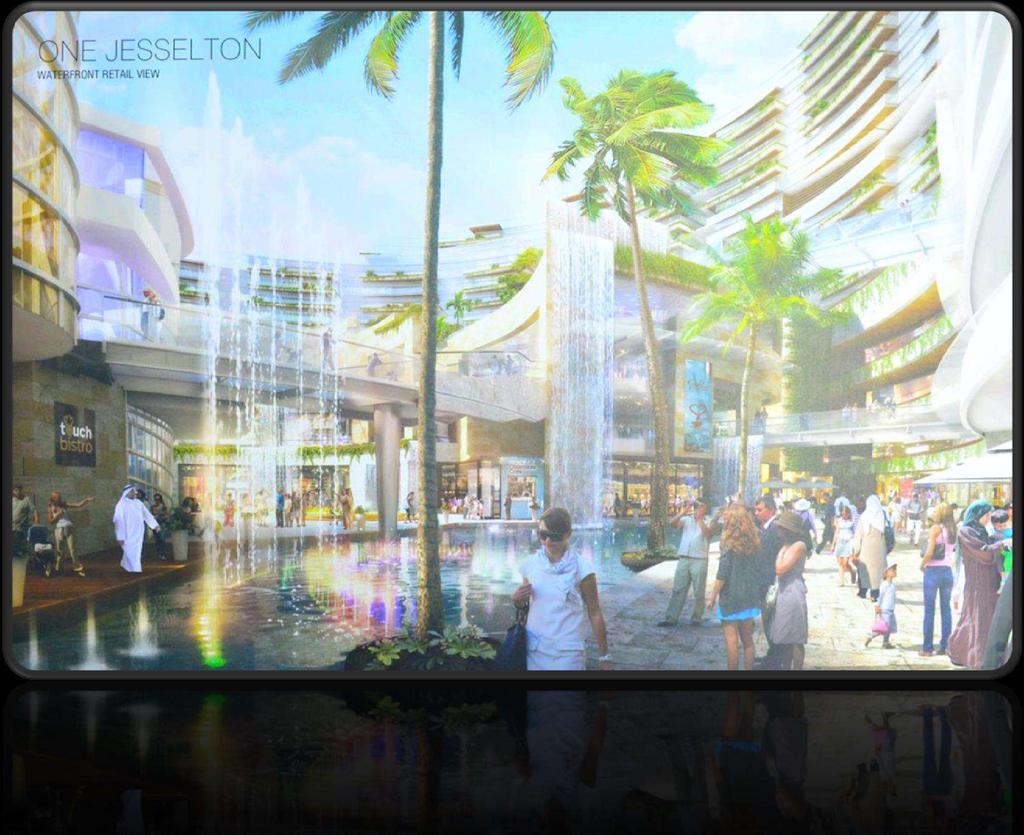
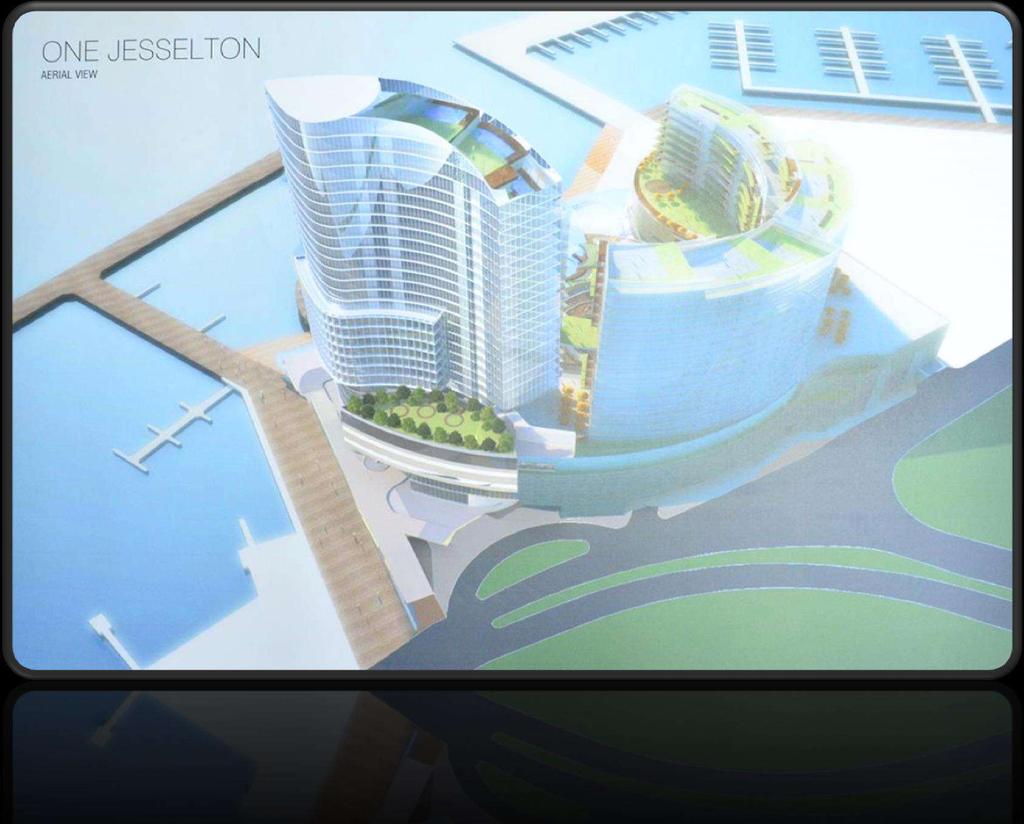
88 Development of the Remaining 7 acres of Commercial Land at KK Port 7 acres
89 Details of the Project Development land size: 7 acres Jesselton Point Ferry Terminal to be re-developed alongside Minimum NSV: RM 1.1 billion Suria s entitlement: 18% of the minimum NSV Suria s entitlement in-kind and in cash: Suria Corporate Office RM52,010,750 Retail Mall RM114,394,050 Cash RM31.6 million


90 Expected Completion Period Completion within 3 years Completion within 6 years Suria Corporate Office Retail Mall Service Suites Services Apartments Completion within 5 years Residential Units Retails Units/Shopping Mall Office Towers Car Park


91 ONE JESSELTON WATERFRONT KOTA KINABALU, SABAH DESIGN ARCHITECT ARCHITECT

92 Cruise Jetty Condominium Serviced Suites Cruise Jetty BoardWalk Mall Serviced / Hotel Suites Suria Corporate Office & Retail Ferry Ticketing Local Ferry Jetty

93 Cruise Jetty BoardWalk Condominium Serviced / Hotel Suites Local Ferry Jetty Suria Corporate Office & Retail Serviced Suites
94
95
96
97
98 Status Update Sub-divided title obtained on 25 th April 2016 Submission of building plans by 4 th quarter of the year Construction expected to commence in 2018
99 INTERNATIONAL CRUISE TERMINAL

100 CRUISE INDUSTRY 6 TH EPP UNDER TOURISM NKEA OF NATIONAL ETP A Straits Riviera Cruise Playground is to be developed and shall comprise 6 worldclass terminals KK Port identified as a dedicated international cruise terminal and homeport, alongside Penang and Port Klang Discussion as a member of the Malaysian Cruise Council is ongoing
101 11 th Malaysia Plan ( ) The proposed international cruise terminal together with the Jesselton Quay are the projects identified under the strategic initiative of 11 th Malaysia Plan The said strategic initiative, namely Cities As Growth Poles, is under Thrust 1 of the 11 th Malaysia Plan which is termed as Re-Engineering Economic Growth
102 INTERIM Cruise Terminal

103 Port Name Kota Kinabalu Port Port Location Kota Kinabalu, Sabah, Malaysia GPS Coordinates ,


104 To support tourism industry in Sabah a) We accommodate existing cruise vessels from all over the world as port of call b) To ensure safety, priority berthing arrangement for all cruise vessels

105 Queen Victoria: Running mate to Queen Mary 2 and Queen Elizabeth; operated by Cunard Line; entered into service in 2007 and has a capacity of ~ 2,014 passengers

106 Queen Elizabeth Queen Elizabeth: second largest ship constructed by Lunard Line; entered into service in 2010 and has a capacity of ~ 2,092 passengers

107 Sapphire Princess Sapphire Princess: one of the world s largest cruise ships owned by Princess Cruises; entered into service in 2004 and has a capacity of ~ 2,670 passengers

108 Dawn Princess Dawn Princess: A sister cruise to Sun Princess and Sea Princess; operated by Princess Cruises; entered into service in 1997 and has a capacity of ~ 1,990 passengers
109 Home-Porting by Star Cruises Maiden call on 6 th November 2013 First season (Nov 2013 Mar 2014) Muara-Bintulu and high-sea cruises Second season (Nov 2014 Feb 2015): Pahlawan, Philippines and high-sea cruises 111

110 Superstar Aquarius (SSQ) Ship Particulars Gross Tonnage 51,309 GRT Length m/754.07ft Width 28.5m/93.5ft Passenger Capacity 1, (crew)
111 SURIA S PROPOSED LAND ACQUISITION FOR INTERNATIONAL CRUISE TERMINAL AND RELATED REALTY DEVELOPMENT
112 Status Update Suria to acquire 28.9 acres of KK Port land from the Sabah State Government Preliminary master plan for the proposed international cruise terminal and related realty is already in place Pending issuance of Offer Letter for the 28.9 acres KK Port land Corporate exercise involving Rights Issue to be undertaken to raise fund for the proposed acquisition
113 Proposed Development Model Model to consist of two development segments: 1. International Cruise Terminal (ICT) 2. Cruise-Related Realty Positioning of KK Port as a home port and regular port of call for regional and international cruise liners Existing berth to be extended with deeper draught to accommodate larger cruise ships Creation of a tourist hub as an integral part of the ICT; Attractions for both locals and foreigners Development to comprise retail and commercial outlets supplementing the ICT
114 Proposed Development Model Development model: Low-density to preserve the water features and minimize environmental impact as large area of 28.9 acres consists of water body Low-rise to not obstruct the views of surrounding developments Despite size of land being relatively big, GDV derivable is capped at RM 2.5 billion as a result (Gross Floor Area approx million sq. ft.)
115 Proposed Development Model To complement nearby concurrent developments at KK Port land to make the entire waterfront area an integrated tourist hub Sabah International Convention Centre Kota Kinabalu Convention City Jesselton Quay One Jesselton Waterfront Development to be planned in a manner that links the terminal and commercial real estate development
116 A New Regional City Focus An international cruise terminal integrated with commercial development - A destination by itself City focus development to be attractive, accessible, vibrant and financially viable Promotion of tourism via development of attractions for both local and international tourists/patrons seeking leisure, recreational and cultural experiences Enhancement of the State s economic development Creation of employment Increased spending and expenditure Promotion of cruise-flight option
117 THANK YOU
GREEN PORT INITIATIVES
 GREEN PORT INITIATIVES ACHIEVING GREEN PORT STATUS Replacement of highmast lighting with energy-saving LEDs Electrification of cargo handling equipment (RTGs) Renewable energy generation (solar) Scheduled
Redevelopment of Old Port Area - New Opportunities for Port Sustainability Sabah s Experience
 2017 GREEN PORT AND PORT SAFETY FORUM Redevelopment of Old Port Area - New Opportunities for Port Sustainability Sabah s Experience by NG KIAT MIN GROUP MANAGING DIRECTOR SURIA CAPITAL HOLDINGS BERHAD
Redevelopment of Old Port Area - New Opportunities for Port Sustainability Sabah s Experience
 2017 GREEN PORT AND PORT SAFETY FORUM Redevelopment of Old Port Area - New Opportunities for Port Sustainability Sabah s Experience by NG KIAT MIN GROUP MANAGING DIRECTOR SURIA CAPITAL HOLDINGS BERHAD
Corporate Presentation
 No. 58019-U Corporate Presentation CLSA IF2017 Hong Kong September 2017 1 OVERVIEW 2 3 4 FINANCIAL HIGHLIGHTS DOMESTIC OPERATIONS RESORTS WORLD GENTING GENTING INTEGRATED TOURISM PLAN OVERSEAS OPERATIONS
2004 Successfully completed first overseas project - the construction of the Tada-Nellore Highway in India which is BOT Concession Project
 Building Values 1 Contents The Company Financial Results 3 rd Quarter 2014 Financial Results FYE 31 Dec 2013 Engineering & Construction Property Development Investment & Management Growth Strategy 2014-2016
Tada-Nellore Highway in India which is BOT Concession Project
 Building Values 1 Contents The Company Financial Results 1 st Quarter 2015 Financial Results FYE 31 Dec 2014 Engineering & Construction Property Development Investment & Management Growth Strategy 2015-2016
The Company Financial Results 4 th Quarter 2014 Financial Results FYE 31 Dec 2014 Engineering & Construction Property Development Investment &
 Building Values 1 Contents The Company Financial Results 4 th Quarter 2014 Financial Results FYE 31 Dec 2014 Engineering & Construction Property Development Investment & Management Growth Strategy 2014-2016
HATTEN LAND LIMITED. Shaping the Future, Melaka and Beyond. Corporate Presentation 12 October 2017
 HATTEN LAND LIMITED Shaping the Future, Melaka and Beyond Corporate Presentation 12 October 2017 Disclaimer Information in this presentation may contain forward-looking statements that reflect the current
2004 Successfully completed first overseas project - the construction of the Tada-Nellore Highway in India which is BOT Concession Project
 Building Values 1 Contents The Company Financial Results 4 th Quarter 2013 Financial Results FYE 31 Dec 2012 Engineering & Construction Property Development Investment & Management Growth Strategy 2013-2016
Sales increased and income will be on a recovery track in the second half of the fiscal year.
 Sales increased and income will be on a recovery track in the second half of the fiscal year. Contents I. Results for the First Half of Fiscal Year Ending March 2019 Profit decreased mainly due to temporary
HATTEN LAND LIMITED. Shaping the Future, Melaka and Beyond. FY2017 Results. Corporate Presentation 17 August 2017
 HATTEN LAND LIMITED Shaping the Future, Melaka and Beyond FY2017 Results Corporate Presentation 17 August 2017 Disclaimer Information in this presentation may contain forward-looking statements that reflect
2007/08 Full Year Results Investor Briefing
 2007/08 Full Year Results Investor Briefing Highlights of Result Profit before tax up 46% to $1,408 million Up 36% on the reported result Margin improvement $3 billion of Sustainable Future Benefits achieved
PRESS ANNOUNCEMENT JULY 28, 1999 For Immediate Release STAR CRUISES REPORTS RECORD SECOND QUARTER EARNINGS
 PRESS ANNOUNCEMENT JULY 28, 1999 For Immediate Release STAR CRUISES REPORTS RECORD SECOND QUARTER EARNINGS STAR CRUISES PLC announced record net income of US$20.7 million (US 3.3 cents earnings per share)
COSCO CORPORATION. (SINGAPORE) LTD FY2003 Full Year Results. Presentation
 LTD FY2003 Full Year Results. Presentation") COSCO CORPORATION (SINGAPORE) LTD FY2003 Full Year Results Presentation 11 February 2004 1 Outline of Presentation 1. Background & Corporate Restructuring Exercise 2. Operations Review 3. Financial Review
COSCO CORPORATION (SINGAPORE) LTD FY2003 Full Year Results Presentation 11 February 2004 1 Outline of Presentation 1. Background & Corporate Restructuring Exercise 2. Operations Review 3. Financial Review
Sunway berhad. Q Results Briefing Pack. 26 February 2016
 Sunway berhad Q4 2015 Results Briefing Pack 26 February 2016 1 Full Year Profitability Maintained Despite SunCon Dilution 1) Full Year Performance PATMI is maintained at RM732.4 million in 2015 (2014:
HK GAAP RESULTS RELEASE 12 August 2008 STAR CRUISES GROUP ANNOUNCES FIRST HALF RESULTS FOR 2008
 HK GAAP RESULTS RELEASE 12 August 2008 FOR IMMEDIATE RELEASE INTERNATIONAL STAR CRUISES GROUP ANNOUNCES FIRST HALF RESULTS FOR 2008 The below commentary is prepared based on the comparison of the results
S$ million 2Q2012 2Q2011 Change 1H2012 1H2011 Change Revenue % % Gross Profit % % Gross Profit Margin
 Roxy-Pacific Holdings Limited NEWS RELEASE ROXY-PACIFIC ACHIEVES 8% INCREASE IN NET PROFIT TO S$17.7 MILLION IN 2Q2012 - Revenue rises 13% to S$52.7 million - 18% surge in revenue from Property Development
Summary of Results for the First Three Quarters FY2015/3
 Summary of Results for the First Three Quarters FY2015/3 February 10, 2015 Tokyu Corporation (9005) http://www.tokyu.co.jp/ Contents Ⅰ.Executive Summary 2 Ⅱ.Conditions in Each Business 5 Ⅲ.Details of Financial
Thank you for participating in the financial results for fiscal 2014.
 Thank you for participating in the financial results for fiscal 2014. ANA HOLDINGS strongly believes that safety is the most important principle of our air transportation business. The expansion of slots
RESULTS RELEASE 20 August GENTING HONG KONG GROUP ANNOUNCES FIRST HALF RESULTS FOR 2015 Highlights
 RESULTS RELEASE 20 August 2015 FOR IMMEDIATE RELEASE INTERNATIONAL GENTING HONG KONG GROUP ANNOUNCES FIRST HALF RESULTS FOR 2015 Highlights The commentary below is prepared based on a comparison of the
Half-yearly Report 2013
 Half-yearly Report 2013 Financial result unchanged PORT OF ROTTERDAM THROUGHPUT DECREASED SLIGHTLY Throughput in the port of Rotterdam in the first half of the year decreased by 0.9% compared to the first
Corporate Presentation CIMB 11th Annual Malaysia Corporate Day
 No. 58019-U Corporate Presentation CIMB 11th Annual Malaysia Corporate Day 4 January 2019 1 1 2 3 4 5 6 GROUP OVERVIEW KEY PROPERTIES FINANCIAL HIGHLIGHTS MALAYSIA OPERATIONS OVERSEAS OPERATIONS UNITED
2004 Successfully completed first overseas project - the construction of the Tada-Nellore Highway in India which is BOT Concession Project
 Building Values Contents The Company Financial Results 3 rd Quarter 2013 Financial Results FYE 31 Dec 2012 Corporate Exercises Engineering & Construction Property Development Investment & Management Growth
SUNWAY REIT S FY2016 FINANCIAL PERFORMANCE BOOSTED BY RETAIL AND HOTEL ASSETS
 MEDIA RELEASE 11 August 2016 FINANCIAL RESULTS ANNOUNCEMENT SUNWAY REIT S FY2016 FINANCIAL PERFORMANCE BOOSTED BY RETAIL AND HOTEL ASSETS Key Highlights: o Revenue and net property income rose by 11.8%
Q2 FY2016 RESULTS & BRIEFING 28 JUNE 2016
 Q2 FY2016 RESULTS & BRIEFING 28 JUNE 2016 PROFIT AND LOSS STATEMENT AS AT APRIL 2016 RM 000 1 ST QUARTER ENDED 2 ND QUARTER ENDED PERIOD ENDED 31 JAN 2016 30 APR 2016 30 APR 2016 Revenue 463,511 614,602
Business Opportunities in Malaysia. World Trade Expo 29th October 2018
 Business Opportunities in Malaysia World Trade Expo 29th October 2018 1 Malaysia : Quick Facts Highways: North-South Expressway- 772KM East-Coast Expressway- 225KM Pan Borneo Highway- expected in 2022
Cathay Pacific Airways Annual Results 10 March Cathay Pacific Airways Interim Results 6 August 2008
 Cathay Pacific Airways 2009 Annual Results 10 March 2010 Cathay Pacific Airways 2008 Interim Results 6 August 2008 Annual Result 2009 2008 (restated) Group Profit/(Loss) HK$4,694m (HK$8,696m) Group Turnover
Role of Malaysian Ports & Chinese Ports in realizing Maritime Silk Road initiative
 Role of Malaysian Ports & Chinese Ports in realizing Maritime Silk Road initiative Presented by: Dato Sri Che Khalib Mohamad Noh Group Managing Director, MMC Corporation Bhd MMC PORTS: YOUR STRATEGIC MALAYSIAN
Global Mega-trends Urbanisation a key driver of growth. Steve McCann Group CEO and Managing Director Lend Lease
 Global Mega-trends Urbanisation a key driver of growth Steve McCann Group CEO and Managing Director Lend Lease 2 We operate in four regions across 12 countries LONDON Operating since 1991 NEW YORK Operating
HK GAAP RESULTS RELEASE 18 November 2005
 HK GAAP RESULTS RELEASE 18 November 2005 FOR IMMEDIATE RELEASE INTERNATIONAL STAR CRUISES GROUP ANNOUNCES THIRD QUARTER AND FIRST NINE MONTHS RESULTS FOR 2005 Key points for the quarter in comparison with
BUSINESS STRATEGIES ANNUAL GENERAL MEETING 20 APRIL 2018
 BUSINESS STRATEGIES ANNUAL GENERAL MEETING 20 APRIL 2018 Welcome! to our first AGM at our new headquarters at GSH Plaza 2 2 Agenda Financial Highlights Property Launch: Coral Bay Acquisition of Land in
Aspen Achieves Record Net Profit of RM85.4 Million in FY2017
 PRESS RELEASE - FOR IMMEDIATE RELEASE Aspen Achieves Record Net Profit of RM85.4 Million in FY2017 4Q FY2017 Net Profit of RM42.0 Million Almost Matches 9M FY2017 Net Profit of RM43.4 Million Strong revenue
HK GAAP RESULTS RELEASE 25 February 2008 STAR CRUISES GROUP ANNOUNCES FOURTH QUARTER AND FULL YEAR RESULTS FOR 2007
 HK GAAP RESULTS RELEASE 25 February 2008 FOR IMMEDIATE RELEASE INTERNATIONAL STAR CRUISES GROUP ANNOUNCES FOURTH QUARTER AND FULL YEAR RESULTS FOR 2007 Key points for the quarter in comparison with 4Q
management s discussion and analysis of financial condition and results of operations
 management s discussion and analysis of financial condition and results of operations The following discussion is based on, and should be read in conjunction with, the financial statements and the notes
CROWN ANNOUNCES 2018 HALF YEAR RESULTS
 ASX / MEDIA RELEASE FOR IMMEDIATE RELEASE 22 February 2018 CROWN ANNOUNCES 2018 HALF YEAR RESULTS MELBOURNE: Crown Resorts Limited (ASX: CWN) ( Crown ) today announced its results for the half year ended
ABX. Holdings, Inc. BB&T Transportation Conference. February 2008
 ABX Holdings, Inc. BB&T Transportation Conference February 2008 1 Safe Harbor Statement Except for historical information contained herein, the matters discussed in this presentation contain forward-looking
For personal use only
 ASX / MEDIA RELEASE FOR IMMEDIATE RELEASE 25 February 2016 CROWN ANNOUNCES 2016 HALF YEAR RESULTS MELBOURNE: Crown Resorts Limited (ASX: CWN) today announced its results for the half year ended 31 December
FIRST QUARTER OPERATING PROFIT IMPROVES TO $274 MILLION
 1 August 2006 Page 1 of 4 No. 03/06 1 August 2006 FIRST QUARTER OPERATING PROFIT IMPROVES TO $274 MILLION HIGHLIGHTS OF THE GROUP S PERFORMANCE 1st Quarter 2006-07 Year-on-Year % Change Operating revenue
Air China Limited Annual Results. March Under IFRS
 Air China Limited 21 Annual Results Under IFRS March 211 Agenda Part 1 Highlights Part 2 Business Overview Part 3 Financial Overview Part 4 Outlook 2 Part 1 Highlights Steady Economic Growth; Asia Pacific
Malaysia Airports Holdings Berhad CORPORATE PRESENTATION
 Malaysia Airports Holdings Berhad CORPORATE PRESENTATION 1 2 Table of Contents MAHB A Leap Forward Airport Revenue Transformation klia2 The Game Changer klia2 Destination Curious Integrated Complex KLIA
Corporate Presentation
 No. 58019-U Corporate Presentation January 2018 1 1 OVERVIEW 2 3 4 FINANCIAL HIGHLIGHTS DOMESTIC OPERATIONS RESORTS WORLD GENTING GENTING INTEGRATED TOURISM PLAN OVERSEAS OPERATIONS UNITED KINGDOM UNITED
For personal use only
 HELLOWORLD TRAVEL LIMITED RESULTS ANNOUNCEMENT Highlights for the year ended 30 June 2018 Total Transaction Value (TTV) growth of 3.5% to $6.1 billion, underpinned by strong air ticket sales volume growth.
TRANSFORMING MALAYSIAN PORTS FROM NATIONAL GATEWAYS TO INTERNATIONAL HUBS PORT & MARITIME TRANSPORTATION SEMINAR KOBE, JAPAN 18 OCTOBER 2006
 TRANSFORMING MALAYSIAN PORTS FROM NATIONAL GATEWAYS TO INTERNATIONAL HUBS PORT & MARITIME TRANSPORTATION SEMINAR KOBE, JAPAN 18 OCTOBER 2006 SCOPE BRIEF OVERVIEW OF MALAYSIAN PORTS GOVERNMENT S S PORT
2006 INTERIM ANNOUNCEMENT
 (Stock Code: 78) 2006 INTERIM ANNOUNCEMENT FINANCIAL HIGHLIGHTS Six months ended 30th June, 2006 (Unaudited) Six months ended 30th June, 2005 % Change (Unaudited) HK$ M HK$ M Revenue 608.3 542.4 +12.1%
2008 INTERIM ANNOUNCEMENT
 (Stock Code: 78) 2008 INTERIM ANNOUNCEMENT FINANCIAL HIGHLIGHTS Six months ended 30th June, 2008 (Unaudited) Six months ended 30th June, 2007 (Unaudited) HK$ M HK$ M Revenue 750.8 622.0 Operating profit
Corporate Presentation
 No. 58019-U Corporate Presentation BofAML ASEAN Stars Conference 2014 March 2014 1 Agenda Introduction Financial Highlights Overseas Operations United Kingdom United States and Bahamas Malaysian Operations
Air China Limited Interim Results. August Under IFRS
 Air China Limited 21 Interim Results Under IFRS August 21 1 Agenda 21 Interim Results Overview Business Overview Financial Overview Outlook 2 2 2 21 Interim Results 3 21 Interim Results Overview 4 4 4
LOCATED AT THE GATEWAY OF THE TROPICAL PROVINCE, RIDING ON THE GROWTH MOMENTUM OF THE COUNTRY, WE ARE ON THE RIGHT TRACK OF TAKING OFF.
 LOCATED AT THE GATEWAY OF THE TROPICAL PROVINCE, RIDING ON THE GROWTH MOMENTUM OF THE COUNTRY, WE ARE ON THE RIGHT TRACK OF TAKING OFF. MANAGEMENT DISCUSSION INDUSTRY REVIEW Civil Aviation Industry in
Globus Maritime Limited Trading Update and Financial Highlights for the Three Months and Nine Months Ended September 30, 2007.
 Globus Maritime Limited Trading Update and Financial Highlights for the Three Months and Nine Months Ended September 30, 2007. Athens, Greece, November 15, 2007. Globus Maritime Limited (AIM: GLBS), a
Crown Resorts Limited
 Crown Resorts Limited 2016 Half Year Results Presentation 25 February 2016 1 Crown Resorts Limited Results Overview Crown Resorts Limited (Crown) performance: The 2016 First Half results across Crown s
YTL Hospitality REIT A leading Asia Pacific hospitality REIT. First Quarter 2015 Financial Results
 YTL Hospitality REIT A leading Asia Pacific hospitality REIT First Quarter 2015 Financial Results 20 November 2014 Key Highlights 1Q FY2015 Results Revenue is marginally lower at RM102.3 million as compared
Corporate Presentation
 No. 58019-U Corporate Presentation CIMB 7th Annual Malaysia Corporate Day 6 January 2015 1 Agenda Overview Financial Highlights Malaysia Operations Resorts World Genting RW Bimini Overseas Operations Genting
YTL Hospitality REIT A leading Asia Pacific hospitality REIT Second Quarter 2015 Financial Results. 12 February 2015
 YTL Hospitality REIT A leading Asia Pacific hospitality REIT Second Quarter 2015 Financial Results 12 February 2015 Key Highlights 2Q FY2015 Results Revenue is marginally lower at RM113.2 million as compared
Corporate Presentation
 Corporate Presentation ASEAN Conference 2011 Singapore gp September 2011 1 Our Vision: To be the leading Leisure, Hospitality & Entertainment t t Corporation in the world 2 Agenda Introduction Financial
Walvis Bay and its role as a logistics hub for the SADC region. Christian Faure Executive: Marketing and Strategic Business Development
 Walvis Bay and its role as a logistics hub for the SADC region Christian Faure Executive: Marketing and Strategic Business Development CONTENTS 1. Namport and market environment 2. Walvis Bay town dynamics
Indiabulls Real Estate Limited (CIN : L45101DL2006PLC148314)
") Indiabulls Real Estate Limited (CIN : L45101DL2006PLC148314) Earnings Update Audited Financial Results FY 2013-14 April 23, 2014 Safe Harbor Statement This document contains certain forward looking statements
Indiabulls Real Estate Limited (CIN : L45101DL2006PLC148314) Earnings Update Audited Financial Results FY 2013-14 April 23, 2014 Safe Harbor Statement This document contains certain forward looking statements
Summary of Results for the First Quarter of FY2015/3
 Summary of for the First Quarter of FY2015/3 August 8, 2014 Tokyu Corporation (9005) http://www.tokyu.co.jp/ Contents Ⅰ.Executive Summary 2 Ⅱ.Conditions in Each Business 4 Ⅲ.Details of Financial for the
Heathrow (SP) Limited
 Limited") Draft v2.0 10 Feb Heathrow (SP) Limited Results for year ended 31 December 2013 24 February 2014 Strong operational and financial performance in 2013 Passenger satisfaction at record high and over 72 million
Draft v2.0 10 Feb Heathrow (SP) Limited Results for year ended 31 December 2013 24 February 2014 Strong operational and financial performance in 2013 Passenger satisfaction at record high and over 72 million
CROWN ANNOUNCES 2015 HALF YEAR RESULTS
 ASX / MEDIA RELEASE FOR IMMEDIATE RELEASE 19 February 2015 CROWN ANNOUNCES 2015 HALF YEAR RESULTS MELBOURNE: Crown Resorts Limited (ASX: CWN) today announced its results for the half year ended 31 December
ANA Holdings Financial Results for FY2013
 ANA HOLDINGS NEWS ANA Holdings Financial Results for FY2013 TOKYO April 30, 2014 - ANA Holdings (hereafter ANA HD ) today reports its consolidated financial for fiscal year 2013 (April, 2013 March, 2014).
Changi Airport Group releases FY2011/12 Annual Report
 Media Release Changi Airport Group releases FY2011/12 Annual Report SINGAPORE, 14 September 2012 Changi Airport Group (CAG) today released its annual report for the financial year ended 31 March 2012 (FY11/12).
Melco International Development Limited (Incorporated in Hong Kong with limited liability) Website : (Stock Code : 200)
 Website : (Stock Code : 200)") Hong Kong Exchanges and Clearing Limited and The Stock Exchange of Hong Kong Limited take no responsibility for the contents of this announcement, make no representation as to its accuracy or completeness
Hong Kong Exchanges and Clearing Limited and The Stock Exchange of Hong Kong Limited take no responsibility for the contents of this announcement, make no representation as to its accuracy or completeness
Summary o f Results for the First Half of FY2018
 Summary o f Results for the First Half of FY2018 November 9, 2018 (9005) https://www.tokyu.co.jp/ Contents Ⅰ.Executive Summary 2 Ⅱ.Conditions in Each Business 6 Ⅲ.Details of Financial Results for the 13
Helloworld Travel Limited results announcement Half year ended 31 December 2017
 Helloworld Travel Limited results announcement Half year ended 31 December 2017 HIGHLIGHTS FOR THE HALF YEAR ENDED 31 DECEMBER 2017 Total Transaction Value (TTV) growth of 2.7% to $2.968 billion. Earnings
Leaving the Competition Behind. Second Quarter (Apr-Jun) 2009 Results
 2009 Results") Leaving the Competition Behind Second Quarter (Apr-Jun) 2009 Results 12 Aug 2009 1 Disclaimer Information contained in our presentation is intended solely for your reference. Such information is subject
Leaving the Competition Behind Second Quarter (Apr-Jun) 2009 Results 12 Aug 2009 1 Disclaimer Information contained in our presentation is intended solely for your reference. Such information is subject
Golden Ocean Group Limited Q results March 1, 2007
 Golden Ocean Group Limited Q4 2006 results March 1, 2007 PROFIT & LOSS 2005 2006 (in thousands of $) 2006 2005 Oct-Dec Oct-Dec Jan - Dec Jan - Dec Operating Revenues 37 292 91 253 Time charter revenues
ANA Holdings Financial Results for the Third Quarter of FY2013
 ANA HOLDINGS NEWS ANA Holdings Financial Results for the Third Quarter of FY2013 TOKYO January 31, 2014 - ANA Holdings (hereafter ANA HD ) today reports its consolidated financial for the third quarter
TABLE OF CONTENTS 9M10
 MALAYSIA AIRPORTS HOLDINGS BERHAD ANALYST BRIEFING FINANCIAL RESULTS FOR 9 MONTHS ENDED 30 th SEP 2010 29 October 2010 1 TABLE OF CONTENTS 9M10 Review Group Financial Review Airport Operations Review Commercial
Cathay Pacific Airways Interim Results 04 August Cathay Pacific Airways Interim Results 6 August 2008
 Cathay Pacific Airways 2010 Interim Results 04 August 2010 Cathay Pacific Airways 2008 Interim Results 6 August 2008 Interim Result 1H 2010 1H 2009 Group Profit/(Loss) HK$6,840m HK$812m Group Turnover
38 TH Annual General Meeting 13 December 2017 CORPORATE PRESENTATION
 38 TH Annual General Meeting 13 December 2017 CORPORATE PRESENTATION Outline 1. Corporate Profile 2. Corporate Segment 3. Financial Highlights (5 years trend) Numbers of Glance Sales Trend Revenue Trend
SUNWAY CONSTRUCTION GROUP BERHAD SEEKS LISTING ON BURSA MALAYSIA. ANALYST PACK 19 September 14
 SUNWAY CONSTRUCTION GROUP BERHAD SEEKS LISTING ON BURSA MALAYSIA ANALYST PACK 19 September 14 Sunway Construction Group Berhad ( SCG ) 2013 Revenue: RM 1.8 bil 2013 PATMI: Approx. RM 75 mil (without property
Main Points in the Results for FY2015
 0 1 2 Main Points in the Results for FY2015 Operating profit increased to 75.4 billion yen, exceeding the goal of 75.0 billion yen for the final year of the medium-term management plan in the first year
The Wharf (Holdings) Limited. Interim Results. 15 August 2007
 Limited. Interim Results. 15 August 2007") The Wharf (Holdings) Limited Interim Results 15 August 2007 Key Recaps for Interim 2007 Properties continued to be the growth driver: turnover: HK$5,031M, +74; profit: HK$3,191M, +68 Core properties Harbour
The Wharf (Holdings) Limited Interim Results 15 August 2007 Key Recaps for Interim 2007 Properties continued to be the growth driver: turnover: HK$5,031M, +74; profit: HK$3,191M, +68 Core properties Harbour
Financial Results 3 rd Quarter MAR/2016 (FY2015)
") Financial Results MAR/2016 (FY2015) January 29 th, 2016 CONTENTS P.1 P.2 P.3 P.4~ Overview of FY MAR/16 Results Operating Revenue Operating Profit 1,030 1,020 1,010 +1.0Bn 1,022.3 1,023.4 (+0.1%) 180 160
Financial Results MAR/2016 (FY2015) January 29 th, 2016 CONTENTS P.1 P.2 P.3 P.4~ Overview of FY MAR/16 Results Operating Revenue Operating Profit 1,030 1,020 1,010 +1.0Bn 1,022.3 1,023.4 (+0.1%) 180 160
ANA HOLDINGS Financial Results for the Year ended March 31, 2016
 ANA HOLDINGS NEWS ANA HOLDINGS Financial Results for the Year ended March 31, 2016 TOKYO, April 28, 2016 ANA HOLDINGS (hereafter ANA HD ) today reports its consolidated financial results for fiscal year
For personal use only
 SEALINK TRAVEL GROUP ANNOUNCES STRONG FULL YEAR RESULT Highlights 141% increase in underlying NPAT from $9.6 million to $23.1 million (before expenses related to acquisitions) Record result aided by acquisition
OPERATING AND FINANCIAL HIGHLIGHTS
 Copa Holdings Reports Financial Results for the Fourth Quarter of 2018 Excluding special items, adjusted net profit came in at $44.0 million, or Adjusted EPS of $1.04 Panama City, Panama --- February 13,
Executive Directors Review
 Financial Summary Turnover for the year ended 31 December 2011 amounted to HK$571.4 million ( 47.6 million) (2010: HK$706.8 million ( 58.7 million)). The turnover was principally attributable to the recognition
JAPAN AIRLINES Co., Ltd. Financial Results 1 st Quarter Mar/2017(FY2016) July 29, 2016
 July 29, 2016") JAPAN AIRLINES Co., Ltd. Financial Results Mar/2017(FY2016) July 29, 2016 Today s Topics P.1 P.2 P.13 From the first quarter of this fiscal year, figures for Revenue Passengers Carried, ASK, RPK and Load
JAPAN AIRLINES Co., Ltd. Financial Results Mar/2017(FY2016) July 29, 2016 Today s Topics P.1 P.2 P.13 From the first quarter of this fiscal year, figures for Revenue Passengers Carried, ASK, RPK and Load
Cathay Pacific Airways 2010 Annual Results 9 March 2011
 Cathay Pacific Airways 2010 Annual Results 9 March 2011 1 Annual Result 2010 2009 Change Group Profit/(Loss) HK$14,048m HK$4,694m +199.3% Group Turnover HK$89,524m HK$66,978m +33.7% Profit Margin 15.7%
CROWN ANNOUNCES 2019 HALF YEAR RESULTS
 ASX / MEDIA RELEASE FOR IMMEDIATE RELEASE 20 February 2019 CROWN ANNOUNCES 2019 HALF YEAR RESULTS MELBOURNE: Crown Resorts Limited (ASX: CWN) ( Crown ) today announced its results for the half year ended
Minor International Public Company Limited
 Minor International Public Company Limited Management Discussion & Analysis MINT s financial performance as of 30th June 2008 Summary of Key Financial Performance 2Q08 Performance Minor International Public
Melco International Development Limited (Incorporated in Hong Kong with limited liability) Website : (Stock Code : 200)
 Website : (Stock Code : 200)") Hong Kong Exchanges and Clearing Limited and The Stock Exchange of Hong Kong Limited take no responsibility for the contents of this announcement, make no representation as to its accuracy or completeness
Hong Kong Exchanges and Clearing Limited and The Stock Exchange of Hong Kong Limited take no responsibility for the contents of this announcement, make no representation as to its accuracy or completeness
JET AIRWAYS (I) LTD. Presentation on Financial Results Q4 FY08
 LTD. Presentation on Financial Results Q4 FY08") JET AIRWAYS (I) LTD Presentation on Financial Results Q4 FY08 June 24, 2008 1 1 1 Agenda Domestic operating environment Jet Airways performance highlights JetLite performance highlights Consolidated Jet
JET AIRWAYS (I) LTD Presentation on Financial Results Q4 FY08 June 24, 2008 1 1 1 Agenda Domestic operating environment Jet Airways performance highlights JetLite performance highlights Consolidated Jet
Interim Results Presentation to Investors
 Interim Results Presentation to Investors SIR IAN PROSSER CHAIRMAN BASS PLC Highlights 3 Turnover + 11.2% Operating profit * + 21.2% Earnings per share * + 13.6% Dividend per share + 3.1% * Adjusted for
 1 2 23 24 15 16 7 8 9 Ancillary Revenue target per pax RM55 10 Online 365 11 212 13 14 14 Quarter Ended: 31 March RM'000 Revenue 2,068,227 Operating expenses: - Staff costs (286,663) - Depreciation
OPERATING AND FINANCIAL HIGHLIGHTS. Subsequent Events
 Copa Holdings Reports Net Income of $103.8 million and EPS of $2.45 for the Third Quarter of 2017 Excluding special items, adjusted net income came in at $100.8 million, or EPS of $2.38 per share Panama
PRESS RELEASE November 18, 2002 STAR CRUISES GROUP ANNOUNCES IMPROVED EARNINGS FOR THIRD QUARTER AND FIRST NINE MONTHS OF 2002
 PRESS RELEASE November 18, 2002 FOR IMMEDIATE RELEASE INTERNATIONAL STAR CRUISES GROUP ANNOUNCES IMPROVED EARNINGS FOR THIRD QUARTER AND FIRST NINE MONTHS OF 2002 Key points for the quarter and in comparison
Q1 Fiscal 2018 Statistics
 Q1 Fiscal 2018 Statistics FedEx Corporation Financial and Operating Statistics First Quarter Fiscal 2018 September 19, 2017 This report is a statistical supplement to FedEx s interim financial reports
Copa Holdings Reports Record Earnings of US$41.8 Million for 4Q06 and US$134.2 Million for Full Year 2006
 Copa Holdings Reports Record Earnings of US$41.8 Million for 4Q06 and US$134.2 Million for Full Year 2006 Panama City, Panama --- March 7, 2007. Copa Holdings, S.A. (NYSE: CPA), parent company of Copa
Singapore Airlines Group Analyst/Media Briefing HALF YEAR FY RESULTS. 13 November 2013 THE PARENT AIRLINE 1H FY2013/14 RESULTS
 Singapore Airlines Group Analyst/Media Briefing HALF YEAR FY2013-14 14 RESULTS 13 November 2013 THE PARENT AIRLINE 1H FY2013/14 RESULTS THE PARENT AIRLINE COMPANY RESULTS 2Q & 1H FY13/14 2Q/13 $million
Shun Tak Announces Interim Results for Year 2017
 For Immediate Release SHUN TAK HOLDINGS LIMITED (Incorporated in Hong Kong with limited liability) (Stock code: 242) website: http://www.shuntakgroup.com Shun Tak Announces Interim Results for Year 2017
LNG the future fuel in ferry and cruise ship ports?!
 LNG the future fuel in ferry and cruise ship ports?! Andrej Vatterrott Hafen- Entwicklungsgesellschaft Rostock mbh 2 1. The Port of Rostock in a nutshell 2. LNG as fuel 3 Port of Rostock: High-capacity
STRONG OPERATING RESULTS LIFT NET PROFIT 7.3% TO $932 MILLION
 STRONG OPERATING RESULTS LIFT NET PROFIT 7.3% TO $932 MILLION GROUP FINANCIAL PERFORMANCE First Half 2007-08 The Group achieved an operating profit of $982 million for the first half of financial year
ABX HOLDINGS, INC. Shareholders Meeting. May 13, 2008
 Shareholders Meeting May 13, 2008 1 1 1 Safe Harbor Statement Except for historical information contained herein, the matters discussed in this presentation contain forward-looking statements that involve
Panama Canal Stakeholder Working Group Meeting
 Panama Canal Stakeholder Working Group Meeting POHA, Bayport Container Terminal, Houston, Texas August 27, 2012 TOTAL ECONOMIC IMPACT 9,749 Texas jobs are in some way related to the Port Of the 9,749
OPERATING AND FINANCIAL HIGHLIGHTS
 Copa Holdings Reports Financial Results for the Fourth Quarter of 2015 Excluding special items, adjusted net income came in at $31.7 million, or EPS of $0.73 per share Panama City, Panama --- February
Corporate Presentation
 Corporate Presentation CLSA IF2010 - HK September 2010 Agenda Introduction Financial Highlights Looking Ahead International Expansion Q&A Overview Asia s leading leisure & hospitality company Market
2017 Half-Yearly Results
 2017 Half-Yearly Results Presentation 4th August 2017 Agenda Speakers: Robert Wong, Chief Executive & Simon Dixon, Chief Financial Officer 1. 2017 Half-Yearly Highlights 2. Investment Properties 3. Development
Forward-Looking Statements Statements in this presentation that are not historical facts are "forward-looking" statements and "safe harbor
 2017 Annual Meeting of Shareholders Presentation May 2017 Forward-Looking Statements Statements in this presentation that are not historical facts are "forward-looking" statements and "safe harbor statements"