Barbadians. imagine all the people. Barbadians in Boston
|
|
|
- Nancy Webb
- 5 years ago
- Views:
Transcription


1 Barbadians imagine all the people Barbadians in Boston imagine all the people is a series of publications produced by the Boston Redevelopment Authority for the Mayor s Office of Immigrant Advancement. The series provides a comprehensive profile of Boston s diverse immigrant communities and their numerous contributions to the city s social, cultural and economic landscape. It is part of an ongoing effort to celebrate immigrants and gain insight into how they shape our city. Photo: Petr Kratochvi CITY OF BOSTON Martin J. Walsh Mayor 2016 Cambridge Carnival Photo

2 Barbados is an island nation in the Caribbean that gained its political independence from England in The island was originally visited by the Spanish and Portuguese but not colonized until 1627 by the British. As with other Caribbean islands, sugar plantations were developed on the island, and these formed the island s base industry. Today, Barbados economy has developed tourism and light industry to make it comparable to Trinidad and Tobago in economic development. Barbados had a population of 290,000 in 2015, but experienced a negative net migration rate. 1 The United States, the United Kingdom, and Canada are the leading destinations of Barbadian migration. 2 Massachusetts has the third largest share (10 percent) of the 46,799 3 foreign-born Barbadians living in the United States in States with the largest concentrations of Barbadians also include New York (54 percent), Florida (12 percent), and New Jersey (6 percent). Share of Foreign-Born Barbadian Population by State U.S. Census Bureau, 2014 American Community Survey, PUMS, BRA Research Division Analysis 2

 allows for the detailed socio-economic analysis of specific populations.")
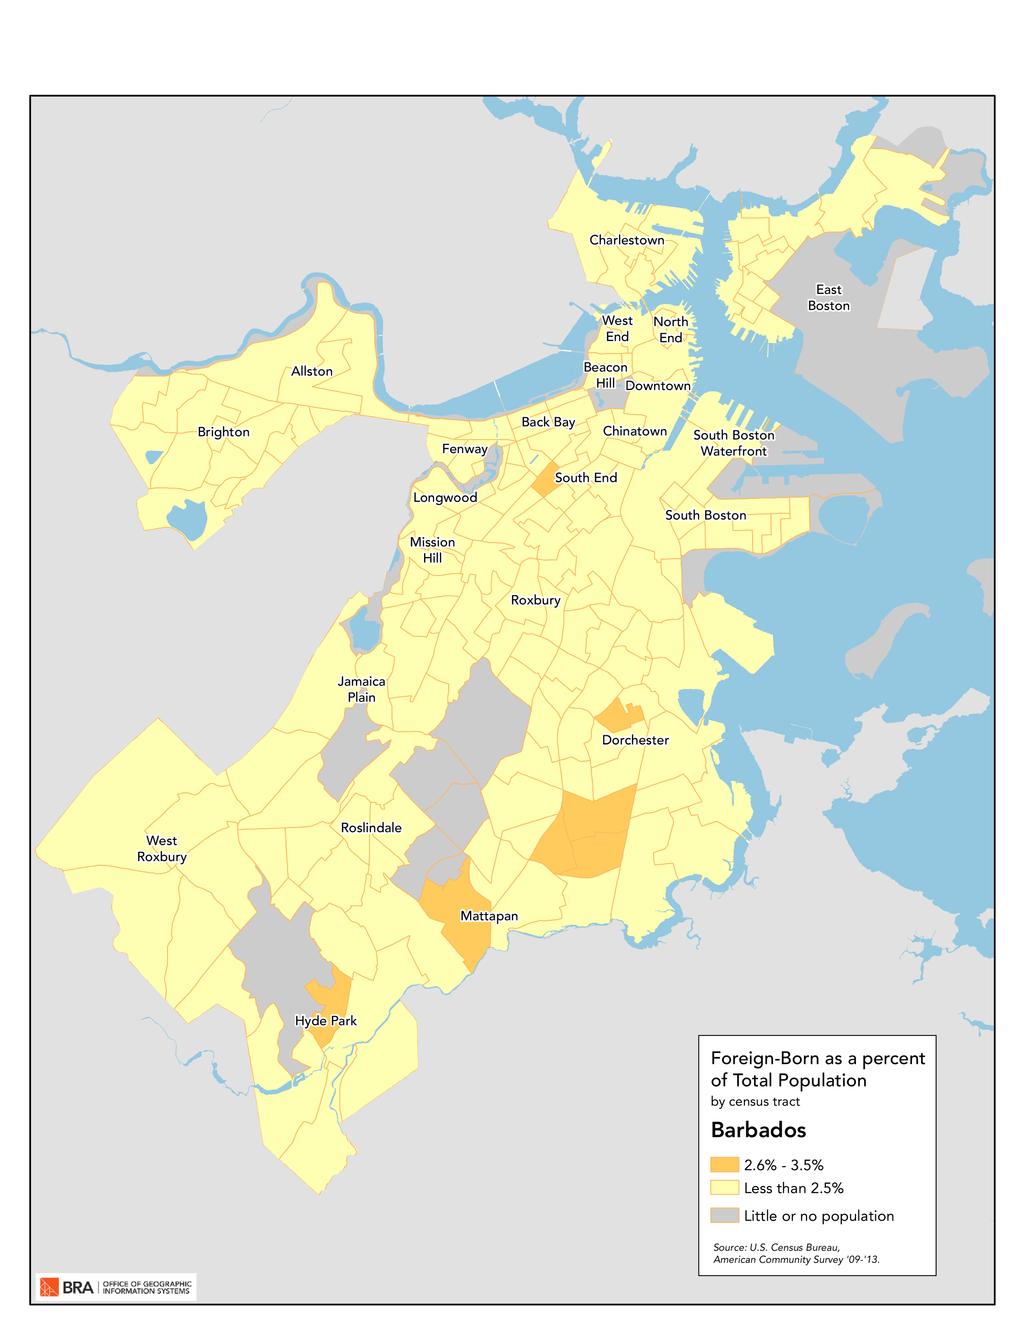
3 Demographics of Barbadians in Boston Of the 4,570 4 foreign-born Barbadians residing in Massachusetts, approximately 2,595 5 live in Boston. Barbados is the 15 th largest country of origin among Boston s foreign-born population. Overall, foreign-born Barbadians in Boston constitute 1.5 percent of the city s total foreign-born residents. Boston s foreign-born Barbadians, live mostly in the neighborhoods of Dorchester (50 percent), Mattapan (17 percent), Hyde Park (11 percent), and Roxbury (10 percent). Neighborhoods with smaller shares are the South End, Jamaica Plain, and Roslindale. 6 The U.S. Census Bureau s ACS Public Use Microdata Sample (PUMS) allows for the detailed socio-economic analysis of specific populations. For smaller populations like foreign-born Barbadians in Boston, a 5-year sample is required to limit variation due to sampling error. The analysis that follows uses ACS PUMS data. More than 50% of the Barbadians in Massachusetts live in Boston. Elan Trotman Barbadian American Berkelee-educated saxophonist Cardinal Warde Barbadian American physics professor at MIT 3
 or divorced, separated or widowed (41 percent).")
 compared to all foreign born (43 percent).")
4 Demographics and Education Barbadian migration is disproportionately female, as 66 percent of foreign-born Barbadians in Boston are female. Nearly 70 percent of foreign -born Barbadians in Boston are either married (30 percent) or divorced, separated or widowed (41 percent). Approximately 61 percent of all foreign-born Barbadians are between the ages of 35 and 64. Fewer foreignborn Barbadians in Boston entered the United States after 2000 (11 percent) compared to all foreign born (43 percent). Because they have been in the United States longer than other foreign-born populations, it is not surprising that the majority of foreign-born Barbadians (68 percent) are naturalized U.S. citizens. Only 28 percent of foreign-born Barbadians ages 25 years or older in Boston have not completed high school. This share is similar to all foreign-born residents (28 percent), but greater than the native-born population (9 percent). Approximately 31 percent of foreign-born Barbadians have a high school diploma as their highest level of educational attainment. While 41 percent of foreign-born Barbadians 25 years or older have attended college, only 9 percent have completed at least a bachelor s degree, compared with 29 percent of the entire foreign-born population and 52 percent of the native born. Less than 5 percent of foreign-born Barbadians living in Boston hold a graduate or professional degree, compared with 14 percent of all foreign born and 22 percent of the native born. 68% of foreignborn Barbadians are naturalized U.S. citizens. Educational Attainment Population 25 Years and Older U.S. Census Bureau, American Community Survey, PUMS, BRA Research Division Analysis 4
 and fewer work in white-collar occupations")

 and native born (18 percent).")
5 As an older population, Barbadians labor force participation rate 7 is lower (63 percent) than for all foreign born (68 percent) and for the native born (69 percent). Similar to other foreign born, the majority of foreign-born Barbadians work in what are generally categorized as service occupations (44 percent) and fewer work in white-collar occupations than the native born. 8 They are slightly overrepresented in blue-collar occupations (19 percent) when compared to all foreign born (17 percent). The most common occupation among foreign-born Barbadians is nursing and home health aides. Occupations by Nativity U.S. Census Bureau, American Community Survey, PUMS, BRA Research Division Analysis A greater share (21 percent) of foreign-born Barbadian workers (excluding unpaid family workers) work for a private non-profit company, compared to all foreign born (15 percent) and native born (18 percent). Fewer foreign-born Barbadians are self-employed (4 percent) than other foreign born in Boston (7 percent). Employment by Type of Employer U.S. Census Bureau, American Community Survey, PUMS, BRA Research Division Analysis 5


6 Imagine all the people: Barbados Age Gender Marital Status Source: U.S. Census Bureau, American Community Survey, PUMS, BRA Research Division Analysis 6


7 Housing Tenure* Housing Costs* Medical Uninsurance *Housing data are based on the householder s nativity. 7

8 8


9 Standard of Living Nearly 40 percent of foreign-born Barbadians have achieved a middle class standard of living, compared with 45 percent of Boston s native-born population, and 29 percent of all foreign born. A family income four times the poverty level is used as a proxy for a middle-class standard of living. The actual income needed to achieve this standard depends on the size and composition of the family. For a two-person family in 2014, a middle class income would be at least $62,920. About 19 percent of foreign-born Barbadians live below the federal poverty level compared to 20 percent for the city s population as a whole. Household Income Compared to Poverty Collectively, foreign-born Barbadians contributed close to $28 million to the regional economy in U.S. Census Bureau, American Community Survey, PUMS, BRA Research Division Analysis 9
 that calculated the value of goods and services consumed on each dollar spent.")
10 Economic Impact Foreign-born Barbadians contribute to the local economy through their labor and consumer spending. The total value of their economic contributions were estimated using a Regional Economic Model (REMI) that calculated the value of goods and services consumed on each dollar spent. Foreign-born Barbadians in Boston generated total expenditures of nearly $47 million in These annual expenditures contributed to $28 million to the regional product and generated $1.5 million in state and local taxes. 10 In total, these expenditures supported 200 jobs in the Massachusetts economy. 11 Conclusion The number of Barbadians who migrate to Boston is smaller compared to other foreign-born populations residing in Boston. They are the 15th largest foreign-born population in the city, but this small Boston population is larger than that found in four states. Foreign-born Barbadians in Boston contribute to the economy, culture, and civic life of the city. Foreign-born Barbadians labor force participation is lower than that of other foreign-born populations. Similar to Jamaicans, they are more likely to work in the non-profit sector. They have a middle-class income similar to the native-born population and have a smaller share of their population living below the federal poverty level than others in Boston. 10
11 1 The CIA World Factbook (2016). 2 UNICEF Migration Profiles, American Factfinder website Table B05006 reports 51,378 Barbadians residing in the United States in 2014 with a margin of error of +/- 4,171. The 46,799 estimate reported for this analysis was tabulated from 2014 U.S. Census Bureau Public Use Microdata Sample data. Both estimates contain a margin of error due to sampling methodology. For more information on American Fact Finder please see: factfinder.census.gov/home/saff/main.html?_lang=en 4 American Factfinder website Table B05006 reports 4,131 Barbadians residing in Massachusetts with a margin of error of +/- 1,426 in The 4,570 estimate reported for this analysis were tabulated from 2014 U.S. Census Bureau Public Use Microdata Sample data. Both estimates contain a margin of error due to sampling methodology. 5 American Factfinder website Table B05006 reports 1,934 Barbadians in Boston with a margin of error of +/-,869 in The 2014 U.S. Census Bureau Public Use Microdata Sample data estimates 2,595 foreign-born Barbadians for Boston. Lower survey response rates due to documentation issues may result in an undercount of the population. Both estimates contain a margin of error due to sampling methodology. 6 U.S. Census Bureau, American Community Survey, BRA Research 7 Defined as the share of the working-age population that is either currently employed or seeking work. U.S. Department of Labor, Bureau of Labor Statistics. (2016). 8 For a smaller population like foreign-born Barbadians in Boston, occupations fall into three broad categories. White collar includes managerial & professional, health care, education, and arts, design entertainment, sports & media occupations. Service includes service, sales, office & administrative support, community & social service occupations. Blue collar includes construction, farming, fishing, and forestry, and production occupations. Military specific occupations and long-term unemployed are excluded from the analysis. 9 BRA Research Division Analysis, 2014, Regional Economic Model, Inc., REMI calculations. 10 BRA Research Division Analysis, 2014, Regional Economic Model, Inc., REMI calculations. 11 BRA Research Division Analysis, 2014, Regional Economic Model, Inc., REMI calculations. 11


12 Brian P. Golden, Director Produced by the BRA Research Division Alvaro Lima Director of Research Jonathan Lee Deputy Director Christina Kim Research Manager Phillip Granberry Senior Researcher/Demographer Matthew Resseger Senior Researcher/Economist Kevin Kang Research Associate Kevin Wandrei Research Assistant Interns: Michael Bratsis Jingwan Wang Cyan O Garro Map by BRA Digital Cartography & GIS Alla Ziskin 12
PROFILE OF THE PUERTO RICAN POPULATION IN UNITED STATES AND PUERTO RICO: 2008
 PROFILE OF THE PUERTO RICAN POPULATION IN UNITED STATES AND PUERTO RICO: 2008 Sonia G. Collazo, Camille L. Ryan, Kurt J. Bauman U.S. Census Bureau Housing and Household Economic Statistics Division This
Puerto Ricans in Connecticut, the United States, and Puerto Rico, 2014
 Issued April 2016 Centro DS2016US-8 Puerto Ricans in Connecticut, the United States, and Puerto Rico, 2014 In 2014, Connecticut was the 6th state with most Puerto Ricans (301,182) in the United States.
East Dunbartonshire Area Profile
 East Dunbartonshire Area Profile May 2014 Contents Executive Summary.. page 3 Introduction.. page 6 Population page 7 Age Structure. page 9 Population Projections page 11 Life Expectancy page 12 Ethnicity.
Puerto Ricans in Massachusetts, the United States, and Puerto Rico, 2014
 Issued April 2016 Centro DS2016US-07 Puerto Ricans in Massachusetts, the United States, and Puerto Rico, 2014 In 2014, Massachusetts was the fifth state with most Puerto Ricans in the United States. In
East Dunbartonshire Area Profile
 East Dunbartonshire Area Profile May 2015 Contents Executive Summary.. page 3 Introduction.. page 6 Population page 7 Age Structure. page 9 Population Estimates..page 11 Population Projections page 13
AVSP 7 Summer Section 7: Visitor Profile - Demographics and Spending
 AVSP 7 Summer 2016 Section 7: Visitor Profile - Demographics and Spending Demographics Origin Visitors were asked what state, country, or province they were visiting from. The chart below shows results
Puerto Ricans in Rhode Island, the United States, and Puerto Rico, 2013
 Issued September 2016 Centro DS2015US-07 Puerto Ricans in Rhode Island, the United States, and Puerto Rico, 2013 In 2013 an estimated 36,217 Puerto Ricans lived in Rhode Island and accounted for at least
Economic Impact Analysis. Tourism on Tasmania s King Island
 Economic Impact Analysis Tourism on Tasmania s King Island i Economic Impact Analysis Tourism on Tasmania s King Island This project has been conducted by REMPLAN Project Team Matthew Nichol Principal
Puerto Ricans in Ohio, the United States, and Puerto Rico, 2014
 Issued April 2016 Centro DS2015US-12 Puerto Ricans in Ohio, the United States, and Puerto Rico, 2014 In 2014, Ohio had the tenth largest number of Puerto Ricans in the United States with 108,174 residents,
Economic Impacts of Campgrounds in New York State
 Economic Impacts of Campgrounds in New York State June 2017 Report Submitted to: Executive Summary Executive Summary New York State is home to approximately 350 privately owned campgrounds with 30,000
part one: comparing puerto ricans
 part one: comparing puerto ricans snapshot: puerto ricans across major us metro areas This section uses data from the 2010 American Community Survey one-year estimates to examine the socioeconomic characteristics
Demographic Profile 2013 census
 Demographic Profile 2013 census This profile provides basic population and demographic information on the residents of the Hauraki District. Population and demographic information is important for targeting
Puerto Ricans in Georgia, the United States, and Puerto Rico, 2014
 Issued September 2016 Centro DS2014GA-14 Puerto Ricans in Georgia, the United States, and Puerto Rico, 2014 In 2014, an estimated 89,462 Puerto Ricans lived in Georgia and accounted for 1.7 percent of
INTERNATIONAL DRIVE ECONOMIC IMPACT ANALYSIS. Luis Nieves-Ruiz, AICP Economic Development Program Manager March 29, 2017
 INTERNATIONAL DRIVE ECONOMIC IMPACT ANALYSIS Luis Nieves-Ruiz, AICP Economic Development Program Manager March 29, 2017 EAST CENTRAL FLORIDA REGIONAL PLANNING COUNCIL One of 10 RPCs Non-profit Agency Technical
North Carolina (Statewide) 2016 Prosperity Zone Data Books
 2016 Prosperity Zone Data Books") North Carolina (Statewide) 2016 Prosperity Zone Data Books 2 North Carolina Prosperity Zones Western North Carolina Prosperity Zones Northwest Region Piedmont-Triad Region Western Region Southwest Region
North Carolina (Statewide) 2016 Prosperity Zone Data Books 2 North Carolina Prosperity Zones Western North Carolina Prosperity Zones Northwest Region Piedmont-Triad Region Western Region Southwest Region
NAURU BUREAU OF STATISTICS
 GOVERNMENT OF NAURU NAURU BUREAU OF STATISTICS PROVISIONAL VISITOR ARRIVALS 3RD QUARTER (JANUARY MARCH 2016) 1. TOTAL VISITOR ARRIVALS Provisional numbers show that visitor arrivals for 3 rd Quarter March
Travel and Tourism in Ukraine: Key Trends and Opportunities to 2016
 Travel and Tourism in Ukraine: Key Trends and Opportunities to 2016 Reference code: TT0037MR_SP Published: July 2012 www.timetric.com Timetric John Carpenter House 7 Carmelite Street London EC4Y 0BS United
Chapter 1: The Population of NHS Greater Glasgow and Clyde
 Population Estimate (thousands) Chapter 1: The Population of NHS Greater Glasgow and Clyde Population Trends and Projections National Records of Scotland estimated (NRS SAPE) 1 the 2013 NHS Greater Glasgow
Department of Agricultural and Resource Economics, Fort Collins, CO
 June 2007 EDR 07-15 Department of Agricultural and Resource Economics, Fort Collins, CO 80523-1172 http://dare.colostate.edu/pubs OF WINE AND WILDLIFE: ASSESSING MARKET POTENTIAL FOR COLORADO AGRITOURISM
HEALTH SECTOR ECONOMIC INDICATORS REPORT
 HEALTH SECTOR ECONOMIC INDICATORS REPORT For: Mid North Coast Local Health District Report prepared by: April 2013 Table of Contents Introduction 3 Executive Summary 4 Output 5 Value-Added 7 Workforce
U. S. Hispanic Travelers Report
 University of Massachusetts Amherst ScholarWorks@UMass Amherst Travel and Tourism Research Association: Advancing Tourism Research Globally 2013 Marketing Outlook Forum - Outlook for 2014 U. S. Hispanic
ISRAEL- COUNTRY FACTS
 ISRAEL- COUNTRY FACTS ISRAEL-NEIGHBOURING COUNTRIES AND POLITICAL MAP Area: 22,072 sq. km Land area: 21,643 sq. km. Fast Facts Area of lakes: 429 sq. km. (Sea of Galilee 164 sq. km., the Dead Sea - 265
2015 IRVING HOTEL GUEST SURVEY Final Project Report
 2015 IRVING HOTEL GUEST SURVEY Final Project Report Research prepared for the Irving Convention & Visitors Bureau by Destination Analysts, Inc. Table of Contents S E C T I O N 1 Introduction 2 S E C T
Devonport-Takapuna Local Board Profile
 Devonport-Takapuna Local Board Profile - Initial results from the Census February 2014 Social and Economic Research Team Research, Investigations and Monitoring Unit Auckland Council Map of Devonport-Takapuna
The Economic Impact of Tourism on the District of Thanet 2011
 The Economic Impact of Tourism on the District of Thanet 2011 Prepared by: Tourism South East Research Unit 40 Chamberlayne Road Eastleigh Hampshire SO50 5JH CONTENTS 1. Summary of Results 1 2. Table of
EXECUTIVE SUMMARY. hospitality compensation as a share of total compensation at. Page 1
 EXECUTIVE SUMMARY Applied Analysis was retained by the Las Vegas Convention and Visitors Authority (the LVCVA ) to review and analyze the economic impacts associated with its various operations and southern
Zimbabwe. Provincial Report Manicaland
 Zimbabwe Provincial Report Manicaland ZIMBABWE POPULATION CENSUS 2012 Population Census Office P.O. Box CY342 Causeway Harare Tel: 04-793971-2 04-794756 E-mail: census2012@zimstat.ac.zw Census Results
2010 Nova Scotia Visitor Exit Survey Regional Report
 2010 Nova Scotia Visitor Exit Survey Regional Report A Look at Visitors Who Included Cape Breton in their Trip to Nova Scotia Reproduction in whole or in part is not permitted without the express permission
Demographic Rankings
 demographics 82 Demographic Rankings Second highest level of educational attainment of major Canadian cities Calgary ranked #3 in Top 10 Places to Raise Kids Calgary ranked #19 in Overall Ranking MoneySense
ECONOMIC CONTRIBUTION OF CRUISE TOURISM TO THE DESTINATION ECONOMIES
 BREA 201 Strykers Rd Suite 19-132 Phillipsburg, NJ 08865 Phone: (908) 213-1971 Fax: (908) 777-3521 Website: www.breanet.com ECONOMIC CONTRIBUTION OF CRUISE TOURISM TO THE DESTINATION ECONOMIES A Survey-based
ST. EUSTATIUS. Visitor Arrival Summary
 ST. EUSTATIUS Visitor Arrival Summary Tourist Arrivals (excluding Antilleans) to St. Eustatius increased by 2.5 percent to reach a total of 12.0 thousand in 2009. A strong summer season (up 6.7 percent)
NAPA VALLEY VISITOR INDUSTRY 2012 Economic Impact Report
 Join Visit Napa Valley NAPA VALLEY VISITOR INDUSTRY 2012 Economic Impact Report Research prepared for Visit Napa Valley by Destination Analysts, Inc. Table of Contents SECTION 1 Introduction 2 SECTION
The Economic Impact of Tourism Brighton & Hove Prepared by: Tourism South East Research Unit 40 Chamberlayne Road Eastleigh Hampshire SO50 5JH
 The Economic Impact of Tourism Brighton & Hove 2013 Prepared by: Tourism South East Research Unit 40 Chamberlayne Road Eastleigh Hampshire SO50 5JH CONTENTS 1. Summary of Results 1 1.1 Introduction 1 1.2
CORNWALL VISITOR FREQUENCY SURVEY
 CORNWALL VISITOR FREQUENCY SURVEY Analysis and Report from PFA Research Ltd 2 nd December 2015 Authors: Robert Rush, Managing Director robert.rush@pfa-research.com Emma Lydon, Research & Marketing Consultant
The Economic Impact of Tourism on Calderdale Prepared by: Tourism South East Research Unit 40 Chamberlayne Road Eastleigh Hampshire SO50 5JH
 The Economic Impact of Tourism on Calderdale 2015 Prepared by: Tourism South East Research Unit 40 Chamberlayne Road Eastleigh Hampshire SO50 5JH CONTENTS 1. Summary of Results 1 2. Table of Results Table
SHETLAND AREA PROFILE
 www.hie.co.uk SHETLAND AREA PROFILE May 2014 SHETLAND AREA PROFILE INTRODUCTION The Shetland area profile uses 2011 Census data and other available data sources to present an up-to-date analysis of its
The Travel & Tourism Industry in Vermont
 The Travel & Tourism Industry in Vermont A Benchmark Study of the Economic Impact of Visitor Expenditures on the Vermont Economy 2003 Prepared by: Introduction In 2003 Establishing clear and useful performance
JATA Market Research Study Passenger Survey Results
 JATA Market Research Study Passenger Survey Results Prepared for the Jackson Area Transportation Authority (JATA) April, 2015 3131 South Dixie Hwy. Suite 545 Dayton, OH 45439 937.299.5007 www.rlsandassoc.com
The Travel and Tourism Industry in Vermont. A Benchmark Study of the Economic Impact of Visitor Expenditures on the Vermont Economy 2005
 The Travel and Tourism Industry in Vermont A Benchmark Study of the Economic Impact of Visitor Expenditures on the Vermont Economy 2005 INTRODUCTION GENERAL November, 2006 This 2005 update of the original
Population, Territory and Sustainable Development The Case of the Caribbean Sub Region
 Population, Territory and Sustainable Development The Case of the Caribbean Sub Region Author: Godfrey St. Bernard Sir Arthur Lewis Institute of Social and Economic Studies The University of the West Indies
2013 IRVING HOTEL GUEST SURVEY Final Project Report
 2013 IRVING HOTEL GUEST SURVEY Final Project Report Research prepared for the Irving Convention & Visitors Bureau by Destination Analysts, Inc. Table of Contents SECTION 1 Introduction 2 SECTION 2 Executive
The Economic Impact of Tourism Eastbourne Prepared by: Tourism South East Research Unit 40 Chamberlayne Road Eastleigh Hampshire SO50 5JH
 The Economic Impact of Tourism Eastbourne 2016 Prepared by: Tourism South East Research Unit 40 Chamberlayne Road Eastleigh Hampshire SO50 5JH CONTENTS Page 1. Summary of Results 1 1.1 Introduction 1 1.2
The Economic Impact of Tourism on Scarborough District 2014
 The Economic Impact of Tourism on Scarborough District 2014 Prepared by: Tourism South East Research Unit 40 Chamberlayne Road Eastleigh Hampshire SO50 5JH CONTENTS 1. Summary of Results 1 2. Table of
2nd Quarter. AEDC is pleased to present the Anchorage Quarterly Economic Indicators Report for the second quarter of 2010.
 2010 AEDC is pleased to present the Anchorage Quarterly Economic Indicators Report for the second quarter of 2010. This report summarizes recently updated data from the Anchorage Economic Indicators Database,
T H E VILLAGE OF P h i l m o n t, N Y
 T H E VILLAGE OF P h i l m o n t, N Y Summit Reservoir Area Plan November 17, 2014 Executive Steering Committee Meeting 2 Agenda 1:00 1. Welcome 2. Housekeeping & updates i. Committee contact list review
North Lanarkshire. Skills Assessment January SDS-1163-Jan16
 North Lanarkshire Skills Assessment January 2016 SDS-1163-Jan16 Acknowledgement The Regional Skills Assessment Steering Group (Skills Development Scotland, Scottish Enterprise, the Scottish Funding Council
Contents Manningham at a Glance... 6 Location and Area... 6 Manningham Activity Centres... 6 Manningham Suburbs... 6 Population... 8 Forecast... 9 For
 Contents Manningham at a Glance... 6 Location and Area... 6 Manningham Activity Centres... 6 Manningham Suburbs... 6 Population... 8 Forecast... 9 Forecast 2011 2036... 9 Population Forecast... 9 Gross
The Economic Contributions of Agritourism in New Jersey
 The Economic Contributions of Agritourism in New Jersey Bulletin E333 Cooperative Extension Brian J. Schilling, Extension Specialist in Agricultural Policy Kevin P. Sullivan, Institutional Research Analyst
Baggage Fees User Guide and Codebook. Angus Reid Institute
 Baggage Fees 2014 User Guide and Codebook Angus Reid Institute User Guide compiled by: Data Services, Academic Services Queen s University Library 2016 Table of Contents Introduction... 2 Metadata... 2
Charts & Graphs Methodology INSIGHTS THAT TAKE YOU PLACES
 Charts & Graphs Methodology INSIGHTS THAT TAKE YOU PLACES Year-End 2017 Visitor Volume and Spending D. K. Shifflet 1749 Old Meadow Rd, Suite 425 McLean, Virginia 22102 Tel.: +1.703.536.0500 www.dksa.com
East Lothian. Skills Assessment January SDS-1154-Jan16
 East Lothian Skills Assessment January 2016 SDS-1154-Jan16 Acknowledgement The Regional Skills Assessment Steering Group (Skills Development Scotland, Scottish Enterprise, the Scottish Funding Council
The Economic Impact of Tourism New Forest Prepared by: Tourism South East Research Unit 40 Chamberlayne Road Eastleigh Hampshire SO50 5JH
 The Economic Impact of Tourism New Forest 2008 Prepared by: Tourism South East Research Unit 40 Chamberlayne Road Eastleigh Hampshire SO50 5JH CONTENTS Glossary of terms 1 1. Summary of Results 4 2. Table
The Economic Impact of Tourism Brighton & Hove Prepared by: Tourism South East Research Unit 40 Chamberlayne Road Eastleigh Hampshire SO50 5JH
 The Economic Impact of Tourism Brighton & Hove 2014 Prepared by: Tourism South East Research Unit 40 Chamberlayne Road Eastleigh Hampshire SO50 5JH CONTENTS 1. Summary of Results 1 1.1 Introduction 1 1.2
The Economic Impact of Tourism on Galveston Island, Texas
 The Economic Impact of Tourism on Galveston Island, Texas 2017 Analysis Prepared for: Headline Results Headline results Tourism is an integral part of the Galveston Island economy and continues to be a
LITERACY IN NOVA SCOTIA Implications of Findings from IALSS 2003
 LITERACY IN NOVA SCOTIA Implications of Findings from IALSS 03 Presented by Satya Brink, Ph.D. Director, National Learning Policy Research Learning Policy Directorate, HRSDC January 06 1 Key Questions
ST. EUSTATIUS. Sea Arrivals II ( Summer ( Winter Yacht Arrivals I 12, % 32.5%
 ST. EUSTATIUS Visitor Arrival Summary Tourist Arrivals (excluding Antilleans) to St. Eustatius increased by 2.5 percent to reach a total of 12.0 thousand in 2009. Holland continues to be the most important
The Economic Impact of Tourism on Galveston Island, Texas Analysis
 The Economic Impact of Tourism on Galveston Island, Texas 2012 Analysis Headline Results Headline results Tourism is a significant contributor to business sales, employment, and taxes on Galveston Island.
Newbury Population ,071 1,941 3,719 4,038 5,337 5,611 5,805
 CHAPTER 3 DEMOGRAPHICS Demographic Profile Population Demographic information can provide essential insights into the composition of a community. As a result, it is a basic element of land use planning
ECONOMIC PROFILE. Tourism
 ECONOMIC PROFILE Tourism Park City & Summit County Utah Prepared by Park City Chamber of Commerce Convention & Visitors Bureau P.O. Box 1630 ~ Park City, UT 84060-1630 800.453.1360 ~ 435.649.6100 ~ fax
NAPA VALLEY VISITOR INDUSTRY 2016 Economic Impact Report
 NAPA VALLEY VISITOR INDUSTRY 2016 Economic Impact Report Research prepared for Visit Napa Valley by Destination Analysts, Inc. Table of Contents S E C T I O N 1 Introduction 2 S E C T I O N 2 Executive
Tampa Bay 2014 Visitor Report
 Tampa Bay 2014 Visitor Report Table of Contents Introduction...... Research Objectives 4 Methodology. 5 Size & Structure of the U.S. Travel Market.. 6 Size & Structure of Tampa Bay s Domestic Travel Market..
The Economic Base of Colfax County, NM. PREPARED BY: The Office of Policy Analysis at Arrowhead Center, New Mexico State University.
 The Economic Base of Colfax County, NM PREPARED BY: The Office of Policy Analysis at Arrowhead Center, New Mexico State University DATE: July 2016 The Economic Base of Colfax County, New Mexico Introduction
The Economic Impact of Tourism in Hillsborough County, June 2018
 The Economic Impact of Tourism in Hillsborough County, 2017 June 2018 Table of contents 1) Key Findings for 2017 3 2) Local Tourism Trends 7 3) Trends in Visits and Spending 12 4) The Domestic Market 19
The Economic Impact of Tourism in Jacksonville, FL. June 2016
 The Economic Impact of Tourism in Jacksonville, FL June 2016 Highlights Visitor spending surpassed $2.0 billion in 2015, growing 4.4%. As this money flowed through Duval County, the $2.0 billion in visitor
Tourism Industry Council Tasmania Community Survey 2018 Research Report. May 2018
 Tourism Industry Council Tasmania Community Survey 2018 Research Report May 2018 This report has been prepared by Enterprise Marketing and Research Services 60 Main Road, Moonah TAS 7009 All enquiries
BRITISH VIRGIN ISLANDS
 BRITISH VIRGIN ISLANDS Visitor Arrival Summary Tourist Arrivals to the British Virgin Islands (BVI) continued the downward trend in 2009, slipping by 10.7 percent. The year end total was registered at
The Economic Impact of Travel in Minnesota Analysis
 The Economic Impact of Travel in Minnesota 2013 Analysis Overview 2013 Highlights Traveler Spending Traveler spending of $10.3 billion generated $17.6 billion in total business sales in 2013 as travel
2010 Nova Scotia Visitor Exit Survey Regional Report
 2010 Nova Scotia Visitor Exit Survey Regional Report A Look at Visitors Who Included Yarmouth and Acadian Shores in their Trip to Nova Scotia Reproduction in whole or in part is not permitted without the
2009 North Carolina Visitor Profile
 2009 Visitor Profile A publication of the Division of Tourism, Film & Sports Development August 2010 Division of Tourism, Film and Sports Development 2009 Visitor Profile 2009 Visitor Profile The Division
Tourism in numbers
 Tourism in numbers 2013-2014 Glenda Varlack Introduction Tourism is a social, cultural and economic experience which involves the movement of people to countries or places outside their usual environment
David Prendergast Ministry of Foreign Affairs and Foreign Trade 7 September 2011
 David Prendergast Ministry of Foreign Affairs and Foreign Trade 7 September 2011 Antigua & Barbuda Barbados Belize Dominica Grenada Guyana Jamaica St. Kitts & Nevis St. Lucia St. Vincent & the Grenadines
Follow this and additional works at:
 Florida International University FIU Digital Commons Palm Beach County MPO Community Background Reports 1-1-2011 Town of Lake Park Follow this and additional works at: http://digitalcommons.fiu.edu/mpo_palmbeach
Maine Office of Tourism Visitor Tracking Research 2015 Calendar Year Annual Report Regional Insights: Greater Portland & Casco Bay
 Maine Office of Tourism Visitor Tracking Research 2015 Calendar Year Annual Report Regional Insights: Prepared by April 2016 1 1 Table of Contents Research Objectives and Methodology 3 Overnight Visitors:
Youth Retention: July Value of post secondary education in regional settings. Prepared for Luminosity Youth Summit.
 Youth Retention: Value of post secondary education in regional settings Prepared for Luminosity Youth Summit July 2013 Prepared by MID NORTH COAST NSW Table of contents Table of contents... 2 Introduction...
Overseas Visitation Estimates for U.S. States, Cities, and Census Regions: 2015
 U.S. Department of Commerce International Trade Administration National Travel and Tourism Office Overseas Estimates for U.S. States, Cities, and Census Regions: Overseas to U.S. States, Cities, and Census
Economic Impact of Tourism in Hillsborough County September 2016
 Economic Impact of Tourism in Hillsborough County - 2015 September 2016 Key findings for 2015 Almost 22 million people visited Hillsborough County in 2015. Visits to Hillsborough County increased 4.5%
2011 POPULATION AND HOUSING CENSUS
 HELLENIC REPUBLIC HELLENIC STATISTICAL AUTHORITY Piraeus, 12 September 2014 2011 POPULATION AND HOUSING CENSUS Demographic and social characteristics of the Resident Population of Greece according to the
TRAVEL BAROMETER, Fall 2014
 TRAVEL BAROMETER, Fall 2014 Overall Performance The indicators used in the "travel barometer" for New Hampshire show that Fall 2014 was a positive period for the State's travel sector when compared with
Home Values near Apache Junction, AZ
 Home Values near Apache Junction, AZ Median Home Value $93,060 $94,640 $153,450 $183,450 Home Appreciation -20.0% -19.3% -16.1% -5.2% Homes Statistics near Apache Junction, AZ Median Age of Home 13.0 8.0
The Economic Contribution of Cruise Tourism to the Southeast Asia Region in Prepared for: CLIA SE Asia. September 2015
 BREA Business Research & Economic Advisors The Economic Contribution of Cruise Tourism to the Southeast Asia Region in 2014 Prepared for: CLIA SE Asia September 2015 Business Research & Economic Advisors
THE 2006 ECONOMIC IMPACT OF TRAVEL & TOURISM IN INDIANA
 THE 2006 ECONOMIC IMPACT OF TRAVEL & TOURISM IN INDIANA A Comprehensive Analysis Prepared by: In Partnership with: PREPARED FOR: Carrie Lambert Marketing Director Indiana Office of Tourism Development
State of the Shared Vacation Ownership Industry. ARDA International Foundation (AIF)
") State of the Shared Vacation Ownership Industry ARDA International Foundation (AIF) This paper includes a high-level overview of the timeshare industry with a core focus on financial growth, owner demographics
State of the Shared Vacation Ownership Industry ARDA International Foundation (AIF) This paper includes a high-level overview of the timeshare industry with a core focus on financial growth, owner demographics
ST. EUSTATIUS. Sea Arrivals ( Summer ( Winter Yacht Arrivals 11, % 32.1%
 ST. EUSTATIUS TOURISM HIGHLIGHTS FOR 2007 VISITOR ARRIVALS Tourist Arrivals I ( Summer* ( Winter* 11,568 67.9% 32.1% Sea Arrivals ( Summer ( Winter Yacht Arrivals 5,858 48.5% 51.5% 707 ACCOMMODATION STATISTICS
List of Figures List of Tables. List of Abbreviations. 1 Introduction 1
 Contents List of Tables Preface List of Abbreviations page x xv xvii xix 1 Introduction 1 part i. the caribbean in the age of free trade: from the napoleonic wars to 1900 2 The Core and the Caribbean 21
Maine Office of Tourism Visitor Tracking Research 2013 Calendar Year Annual Report Regional Insights: Downeast & Acadia
 Maine Office of Tourism Visitor Tracking Research 2013 Calendar Year Annual Report Regional Insights: Prepared by May 2014 1 1 Table of Contents Research Objectives and Methodology 3 Overnight Visitors:
Maine Office of Tourism Visitor Tracking Research 2012 Calendar Year Annual Report Regional Insights: Maine Lakes and Mountains
 Maine Office of Tourism Visitor Tracking Research 2012 Calendar Year Annual Report Regional Insights: Maine Lakes and Mountains Prepared by April 2013 1 Introduction and Methodology 2 The Maine Office
Cedar Rapids Area Convention and Visitors Bureau Visitor Study
 Cedar Rapids Area Convention and Visitors Bureau Visitor Study 2003-2004 University of Northern Iowa Sustainable Tourism & The Environment Program www.uni.edu/step Project Directors: Sam Lankford, Ph.D.
The Yorke & Mid North (State Govt) Region. Workforce Wizard Region Report
 Region. Workforce Wizard Region Report") The Yorke & Mid North (State Govt) Region Workforce Wizard Region Report Table of Contents Executive Summary 3 Population and Social Characteristics 4 Current Population 4 Age Groups 4 Key Populations
The Yorke & Mid North (State Govt) Region Workforce Wizard Region Report Table of Contents Executive Summary 3 Population and Social Characteristics 4 Current Population 4 Age Groups 4 Key Populations
NAPA VALLEY VISITOR INDUSTRY 2014 Economic Impact Report
 NAPA VALLEY VISITOR INDUSTRY 2014 Economic Impact Report Research prepared for Visit Napa Valley by Destination Analysts, Inc. Table of Contents SECTION 1 Introduction 2 SECTION 2 Executive Summary 5 SECTION
Temecula Valley Travel Impacts
 Temecula Valley Travel Impacts 2000-2013p photo courtesy of Temecula Valley Convention and Visitors Bureau June 2014 Prepared for the Temecula Valley Convention and Visitors Bureau Temecula, California
The Economic Impact of Tourism in Hillsborough County. July 2017
 The Economic Impact of Tourism in Hillsborough County July 2017 Table of contents 1) Key Findings for 2016 3 2) Local Tourism Trends 7 3) Trends in Visits and Spending 12 4) The Domestic Market 19 5) The
THANK YOU TO OUR SPONSOR
 THANK YOU TO OUR SPONSOR THANK YOU TO OUR HOST POPULATION POPULATION GROWTH St. Petersburg & Pinellas County Population Growth Rate 3.50% 3.00% 2.50% 2.00% 1.50% 1.00% 0.50% 0.00% -0.50% -1.00% -1.50%
COMPARATIVE INDICATORS TO OTHER HAMPTON ROADS CITIES. David Bradley
 COMPARATIVE INDICATORS TO OTHER HAMPTON ROADS CITIES David Bradley July 14, 2017 EXPENDITURES BY CATEGORY - FY 2015-16 ALL FUNDS 100.0% 8.1% 4.1% 7.2% 9.2% 5.8% 8.6% 6.9% 80.0% 60.0% 45.0% 49.1% 36.1%
Creating a wealth of information and knowledge!
 Prepared for: EPI Aruba (sector Hotelero) Creating a wealth of information and knowledge! By: Louisette Christiaans-Yarzagaray 1 Objective of the Presentation: Getting to know C.B.S. Role of the C.B.S.
Self Catering Holidays in England Economic Impact 2015
 Self Catering Holidays in England Economic Impact 2015 An overview of the economic impact of self catering holidays in England Published by The South West Research Company Ltd March 2017 Contents Page
The Economic Impact of Tourism in: Dane County & Madison, Wisconsin. April 2017
 The Economic Impact of Tourism in: Dane County & Madison, Wisconsin April 2017 Key themes for 2016 Visitor spending continued growing in Dane County, Wisconsin in 2016, growing 5.2% to surpass $1.2 billion.
 Home Values near Zip Code 23040 Median Home Value $138,300 $138,300 $143,900 $175,100 Home Appreciation -5.5% -5.5% -5.4% -3.2% Homes Statistics near Zip Code 23040 Median Age of Home 28.2 28.2 31.3 35.1
Fiji s Tourism Satellite Accounts
 Asia-Pacific Economic Statistics Week Bangkok 2 4 May 2016 Fiji s Tourism Satellite Accounts Mr. Bimlesh Krishna Divisional Manager Economic Statistics Fiji s Tourism Satellite Introduction The Tourism
2016 VISITOR STATISTICS WASHINGTON, DC
 2016 VISITOR STATISTICS WASHINGTON, DC TOTAL VISITATION TO WASHINGTON, DC WASHINGTON, DC (DISTRICT OF COLUMBIA) VISITORS (IN MILLIONS) 20 15 10 Overseas Domestic 15.1 14.9 1.0 1.0 14.1 13.9 18.3 19.0 17.8
Banking at the Crossroads. Annual Conference The Caribbean Association of Banks Everson W. Hull Basseterre St.Kitts November 12, 2015
 Banking at the Crossroads Annual Conference The Caribbean Association of Banks Everson W. Hull Basseterre St.Kitts November 12, 2015 1 Outline The Fragile Pillars of Economic Growth Subdued rates of growth