Zimbabwe. Provincial Report Manicaland
|
|
|
- Gladys Hamilton
- 6 years ago
- Views:
Transcription


1 Zimbabwe Provincial Report Manicaland


2 ZIMBABWE POPULATION CENSUS 2012 Population Census Office P.O. Box CY342 Causeway Harare Tel:
3
4 Census Results at a Glance: Manicaland Province Male Population Female Population Total Population Average Rate of Natural Increase (%) 2.3 Average Size of Household 4.2 4


5 5
6 Table of Contents Census Results at a Glance: Manicaland Province...4 Table of Contents...6 List of tables...7 List of Figures...12 Foreword...14 Executive Summary...15 Manicaland Province Fact Sheet...18 Chapter 1:...19 Population Size and Structure...19 Chapter 2:...30 Population Distribution and Migration...30 Chapter 3:...39 Household Characteristics...39 Chapter 4:...54 Education...54 Chapter 5:...77 Activity and Labour Force...77 Chapter 6: Fertility Chapter 7: Mortality and Orphanhood Chapter 8: Housing Characteristics Appendices Notations - Magnitude zero (percent) insignificant value NS Not Stated 6
7 List of tables Table 1.1: Percent Distribution of Population by District and Sex, Manicaland Province, Zimbabwe 2012 Census...22 Table 1.2: Crude Birth and Death Rate and Rate of Natural Increase by District, Manicaland Province, Zimbabwe 2012 Census...22 Table 1.3: Percent Composition of Population by Age Group and Sex, Manicaland Province, Zimbabwe 2012 Census...23 Table 1.4: Percent Distribution of the Population by District and Marital Status, Manicaland Province, Zimbabwe 2012 Census...23 Table 1.5: Percent Distribution of the Male Population by Age Group and Marital Status, Manicaland Province, Zimbabwe 2012 Census...24 Table 1.6: Percent Distribution of the Female Population by Age Group and Marital Status, Manicaland Province, Zimbabwe 2012 Census...25 Table 1.7: Percent Distribution of the Total Population by Age Group and Marital Status, Manicaland Province, Zimbabwe 2012 Census...27 Table 1.8: Distribution of Total Population by Broad Age Groups and Ethnicity, Manicaland Province, Zimbabwe 2012 Census...28 Table 1.9: Distribution of the Urban Population by Broad Age Groups and Ethnicity, Manicaland Province, Zimbabwe 2012 Census...29 Table 1.10: Percent Distribution of the Rural Population by Broad Age Groups and Ethnicity, Manicaland Province, Zimbabwe 2012 Census...29 Table 1.11: Distribution of the Total Population by Citizenship, Manicaland Province, Zimbabwe 2012 Census...29 Table 2.1: Distribution of Population by District, Manicaland Province, Zimbabwe 2012 Census...33 Table 2.2: Distribution of the Population for Rural and Urban Districts, Manicaland Province, Zimbabwe 2012 Census...33 Table 2.3: Population in Urban Centres by District, Manicaland Province, Zimbabwe 2012 Census.34 Table 2.4: Total Population by District of Enumeration and District of Usual Residence, Manicaland Province, Zimbabwe 2012 Census...34 Table 2.5: Population Not Usually Residing in Manicaland Province by Province of Usual Residence and District of Enumeration, Manicaland Province, Zimbabwe 2012 Census...36 Table 3.1: Population in Private Households by Number of Households and Average Household Size and District, Manicaland Province, Zimbabwe 2012 Census...41 Table 3.2: Distribution of Private Households by Size and Sex of Head of Household Manicaland Province, Zimbabwe 2012 Census...41 Table 3.3: Distribution of Private Households by Size and Sex of Head of Household and by District Manicaland Province, Zimbabwe 2012 Census...42 Table 3.3: Distribution of Private Households by Size and Sex of Head of Household and by District Manicaland Province, Zimbabwe 2012 Census
8 Table 3.4 Distribution of Heads of Private Households by Age Group and Sex, Manicaland Province, Zimbabwe 2012 Census...46 Table 3.5 Distribution of Heads of Private Households by District, Age Group and Sex Manicaland Province, Zimbabwe 2012 Census...46 Table 3.6: Percent Distribution of Population in Collective Households by Age Group and Sex, Manicaland Province, Zimbabwe 2012 Census...52 Table 3.7: Distribution of Population in Collective Households by Age Group and Marital Status, Manicaland Province, Zimbabwe 2012 Census...52 Table 3.8: Population in Private Household by Urban/Rural, Relationship to Head of Household and Sex, Manicaland Province, Zimbabwe 2012 Census...53 Table 4.1: Distribution of the Population Age 3-24 by School Attendance and by Sex, Manicaland Province, Zimbabwe 2012 Census...57 Table 4.2: Percent Distribution of the Population Age 3-24 who never attended school by Sex, Manicaland Province, Zimbabwe 2012 Census...58 Table 4.3: Percent Distribution of the Population Age 3-24 who never attended school by District and Sex, Manicaland Province, Zimbabwe 2012 Census...59 Table 4.4: Percent Distribution of the Population Age 3-24 who never attended school by Sex and District, Manicaland Province, Zimbabwe 2012 Census...69 Table 4.5: Percent Distribution of Population ever been to school by Age Group and Sex, Manicaland Province, Zimbabwe 2012 Census...70 Table 4.6: Population Age 3-24 Years Currently Attending School by Current Level of Education Being Attended and Sex, Manicaland Province, Zimbabwe 2012 Census...70 Table 4.7: Population Age 3-24 Years Currently Attending School by District and Current Level of Education Being Attended and Sex, Manicaland Province, Zimbabwe 2012 Census...71 Table 4.7: Population Age 3-24 Years Currently Attending School by District and Current Level of Education Being Attended and Sex, Manicaland Province, Zimbabwe 2012 Census...72 Table 4.8: Population Age 3-24 years Who Left School by Sex and Age Manicaland Province, Zimbabwe 2012 Census...73 Table 4.9: Primary and Secondary School Enrolment for Population Age 3-24 Years Manicaland Province, Zimbabwe 2012 Census...74 Table 4.10: Population Age 3+ by Age Group, Sex and Highest Level of Academic Education Completed, Manicaland Province, Zimbabwe 2012 Census...75 Table 4.11: Literacy Rates for the Population Aged 15+ by Province and by Sex, Manicaland Province Zimbabwe 2012 Census...76 Table 4.12: Literacy Rates for the Population Aged 15+ by District and by Sex, Manicaland Province, Zimbabwe 2012 Census...76 Table 5.1: Percent Distribution of Economically Active Persons by Sex and Activity, Manicaland Province, Zimbabwe 2012 Census...83 Table 5.2: Percent Distribution of Economically Active Population by Sex and district, Manicaland Province, Zimbabwe 2012 Census
9 Table 5.3: Percent Distribution of Economically Active Population by Sex, Manicaland Province, Zimbabwe 2012 Census...85 Table 5.4: Age-Sex-Specific Activity Rates for Age 15+ Years, Manicaland Province, Zimbabwe 2012 Census...88 Table 5.5: Activity Rates by district for Age 15+ Years, Manicaland Province, Zimbabwe 2012 Census...89 Table 5.6: Percent Distribution of Economically Active Persons by Activity and district, by Activity and district, Manicaland Province Zimbabwe Census Table 5.6: Percent Distribution of Economically Active Persons by Activity and district, by Activity and district, Manicaland Province, Zimbabwe Census Table 5.7: Percent Distribution of Economically Active Persons by Sex and District, Manicaland Province, Zimbabwe 2012 Census...91 Table 5.7: Percent Distribution of Economically Active Persons by Sex and District, Manicaland Province, Zimbabwe 2012 Census...91 Table 5.8: Percent Distribution of Economically Active Persons by Age Group and District, Manicaland Province, Zimbabwe 2012 Census...92 Table 5.10: Percent Distribution of Persons by Employment Status and Sex, Manicaland Province, Zimbabwe 2012 Census...98 Table 5.11: Percent Distribution of Persons with a Disability by Employment Status and Sex, Manicaland Province, Zimbabwe 2012 Census...98 Table 5.12: Unemployment by district, Manicaland Province, Zimbabwe 2012 Census...99 Table 5.13: Percent Distribution of Children (10-14 years) by Employment Status and Sex, Manicaland Province, Zimbabwe 2012 Census...99 Table 5.14: Percent Distribution of Economically Inactive Population by Activity and Sex, Manicaland Province, Zimbabwe 2012 Census Table 5.15: Percent Distribution of Economically Inactive Population by Activity and Sex, Manicaland Province, Zimbabwe 2012 Census Table 5.16: Percent Distribution of Economically Inactive Population by Activity and Sector, Manicaland Province, Zimbabwe 2012 Census Table 5.17: Percent Distribution of Economically Inactive Population by Sex Age Group and District, Manicaland Province, Zimbabwe 2012 Census Table 5.18: Occupational Classification by Sex, Manicaland Province, Zimbabwe 2012 Census Table 5.19: Occupational Classification by district, Manicaland Province, Zimbabwe 2012 Census108 Table 5.20: Communal Farmers as a Percentage of Employed Persons by District, Manicaland Province, Zimbabwe 2012 Census Table 5.21: Persons With A Disability by Occupational Classification and Sex, Manicaland Province, Zimbabwe 2012 Census Table 6.1: Fertility Rates by District, Manicaland Province, Zimbabwe 2012 Census Table 6.2: Total Fertility Rate by Level of Education of Mothers, Manicaland Province, Zimbabwe 2012 Census Table 6.3: Total Fertility Rate by Marital Status, Manicaland Province, Zimbabwe 2012 Census
10 Table 6.4: Percent Distribution of Women by Current Age, by Age at First Live Birth, Manicaland Province, Zimbabwe 2012 Census Table 6.5: Percent Distribution of Women by Current Age, by Age at First Live Birth for Rural and Urban, Manicaland Province, Zimbabwe 2012 Census Table 6.6: Percent Distribution of Women by Age at First Live Birth, Current Age and Level of Education, Manicaland Province, Zimbabwe 2012 Census Table 7.1 Infant Mortality Rates by Sex and District, Manicaland Province, Zimbabwe 2012 Census Table 7.1(b) Infant Mortality Rates by Sex and urban/rural, Manicaland Province, Zimbabwe 2012 Census Table 7.2: Infant Mortality Rates by Level of Education of Mother, Manicaland Province, Zimbabwe 2012 Census Table 7.3: Crude Death Rates by District, Manicaland Province, Zimbabwe 2012 Census Table 7.4: Maternal Mortality Ratio (MMR) by District, Manicaland Province, Zimbabwe 2012 Census Table 7.5: Percent Distribution of Orphans by Type of Orphanhood Manicaland Province, Zimbabwe 2012 Census Table 8.1: Percent Distribution of Households by Tenure Status and District: Manicaland Province, Zimbabwe 2002 Census Table 8.2: Percent Distribution of Households by District and Type of Dwelling Unit: Manicaland Province, Zimbabwe 2012 Census Table 8.3: Percent Distribution of Households in Dwelling Units With Electricity by District, Manicaland Province, Zimbabwe 2012 Census Table 8.4: Percent Distribution of Households by Main Source of Water for Drinking and cooking and by Distance (metres) to the source, Harare Province, Zimbabwe 2012 Census Table 8.5: Percent Distribution of Households by Main Source of Water for Drinking and Cooking and Distance (metres) to the Source, Manicaland Province, Zimbabwe 2012 Census Table 8.5b: Percent Distribution of Households by Main Source of Water for Drinking and Cooking and by Distance (metres) to the Source, Manicaland Province Zimbabwe 2012 Census Table 8.6: Percent Distribution of Households by District, Type of Toilet Facility Mostly Used by the Household, Manicaland Province, Zimbabwe 2012 Census Table 8.7: Percent Distribution of Households by District, Source of Energy Mainly Used by Households for Cooking, Manicaland Province, Zimbabwe 2012 Census Table A1.1: Distribution of Population by Sex in Districts and Wards, Total number of Households in Districts and Wards, Manicaland Province, Zimbabwe 2012 Census Table A1.2: Population Distribution by District Age Group and Sex, Manicaland Province, Zimbabwe 2012 Census Table A4.1: Distribution of Population Age 3+ by School Attendance by Sex Manicaland Province, Zimbabwe 2012 Census Table A4.3: Population Age 3-24 Currently at School by Single Age and Sex Manicaland Province, Zimbabwe Population Census
11 Table A4.4: Population Age 3+ by Age Group, Sex and Highest Level of Education Completed, Manicaland Province, Zimbabwe 2012 Census Table A6.1 Number of Women, Children Ever Born, Births in the Last 12 Months, Average Parities and ASFR by Age Group, Manicaland Province, Zimbabwe 2012 Census Table A6.2 Number of Women, Children Ever Born, Births in the Last 12 Months, Average Parities and ASFR by Urban/Rural Residence, Buhera Zimbabwe 2012 Census Table A6.8: Number of Women, Children Ever Born, Births in the Last 12 Months, Average Parities and ASFR by Level of Education of Mother, Manicaland Province, Zimbabwe 2012 Census Table A7.3: Number of Orphans by Type of Orphanhood, Manicaland Province, Zimbabwe 2012 Census
12 List of Figures Figure 1.1. Population Pyramid (percent), Manicaland Province, Zimbabwe 2012 Census Figure 1.2: Sex Ratio (Males per 100 Females by Age Group) Manicaland Province, Zimbabwe 2012 Census Figure 2.1: Population Distribution by District; Manicaland Province: Zimbabwe 2012 Census Figure 2.2: Percent Distribution of Population by Urban/Rural, Manicaland Province, Zimbabwe 2012 Census Figure 5.1: Labour Force Framework Figure 5.2: Economically Active Persons by Sex and Activity, Manicaland Province, Zimbabwe 2012 Census Figure 5.3: Age/Sex - Specific Activity Rates, Manicaland Province, Zimbabwe 2012 Census Figure 5.4: Economically Inactive Persons by Sex and Activity, Manicaland Province, Zimbabwe 2012 Census Figure 6.2: TFR by Level of Education of Mother, Manicaland Province, Zimbabwe 2012 Census Figure 6.3: TFR by Marital Status, Manicaland Province, Zimbabwe 2012 Census Figure 6.4: Median Age at First Live Birth, Manicaland Province, Zimbabwe 2012 Census Figure 6.5:AFLB by Level of Education of Mother, Manicaland Province, Zimbabwe 2012 Census 12
13 13
14 Foreword This Provincial Report is one of a series of reports being prepared by the Zimbabwe National Statistics Agency (ZimStat) based on the final results of the 2012 Population Census. In preparing this Provincial Report, ZimStat seeks to put at the disposal of users detailed data which will assist in evidence - based policy formulation and administration, research and overall development planning.. The Provincial Report provides more details of the census findings that were summarized in the National Report. Further reports on the results of the census will be published in the form of a population census atlas as well thematic analysis reports. We would like to thank the following development partners and donors for their financial, material and technical assistance:- Australian Agency for International Development, Danish International Development Agency, United Kingdom Department for International Development, European Union, Swedish International Development Agency, United Nations Development Programme, United Nations Children s Fund and United Nations Population Fund. ZimStat is appreciative of the funding and material provisions availed to the office by the Government of Zimbabwe. ZimStat would also like to thank all persons who were engaged in 2012 Population Census operations and the general public for its cooperation. Director-General, Zimbabwe National Statistics Agency Harare, October,
15 Executive Summary This profile summarizes the main findings of the 2012 Census for Manicaland Province. In most cases attempts have been made to provide highlights at both the district and provincial levels. It is believed that the information provided will meet the demands of most users. However, detailed and more specific information is available at ZimStat. Population Size and Structure The total population of the province was There were males and females. This is very close to the initial figure of released in the preliminary report in December, It should be recalled that the earlier figures were compiled manually at the census districts immediately after the census count, and were therefore subject to clerical errors. The sex ratio in the province was nearly 90. Urban and Rural Population The population in this province was mostly rural with only 17 percent of the total found in urban areas. All districts in the province have an urban area. Private and Collective Households During the census a distinction was made between private and collective households. The latter included persons who were staying in institutions of all types and constituted a population of 1 percent in the whole province. There were private households with an average size of 4.2 persons per household. The largest proportion of households (18 percent) was in the four person household size category while out of all households about 85 percent had at most 6 persons. Fifty-eight percent of the households were headed by males. Marital Status The population in Manicaland Province was relatively young with 44 percent age below 15 years and about 3 percent age 65 years and above. It was further observed that 15 about 26 percent of the population had never married. This large proportion was probably due to the presence of a high percentage of young population. However, females seemed to have entered into such unions at much younger ages than the males. Around 59 percent of the population was currently married, while about 7 percent were either divorced/separated or widowed. As expected, proportionately more females than males were widowed. The same is also the case for those who were divorced/ separated. Ethnic Origin and Citizenship Persons of African origin made up almost the entire population while those of non- African ethnic origin accounted for a negligible 0.23 percent. Citizens of Zimbabwe constituted nearly the whole population and far less than 1 percent were citizens of other countries. Citizens of Mozambique and Malawi constituted 30 and 10 percent respectively of the non Zimbabweans. Education and Literacy Census information on education revealed that about 12 percent of the population age 3-24 years had never been to school. However, percent of these were below 6 years of age and many of them likely to start school later. Sixty two percent of the population was currently attending school. The proportion of the population age 3-24 years that had left school at the census time was 26 percent. Of the total female population age 3-24 years, 30 percent had left school while the proportion for males was 24 percent. Activity and Labour-force Activity and labour force focused on the population age at least 15 years and this constituted 56 percent of the total population. Out of these, around 69 percent were in the labour force. The proportion of those in the labour force who were unemployed was about 6 percent. Two percent of children age years was economically active.
16 The proportion of those not in the labour force who were students was 44 percent, homemakers 36 percent, and retired/sick/too old 20 percent. Out of those who were employed, the highest proportions (60 percent) were engaged in agriculture related occupations, followed by services (16 percent). Housing Conditions Information on housing conditions in the province showed that 73 percent of the households lived in their own dwelling units, either as owners or purchasers. The proportion of lodgers was 10 percent. With regard to the type of dwelling units, it was observed that about 67 percent of the households in the province lived in traditional type of dwelling units, while a relatively small percentage (28) occupied dwelling units which were modern. The proportion of households not using electricity in the province was 60 percent. The proportion of households occupying dwelling units without electricity ranged between 62 percent in Makoni and 79 percent in Chipinge. This excludes Mutare Urban where 81 percent of households have access to electricity and Rusape with 8480 percent of households having access to electricity. With regard to the source of water for drinking and cooking, 74 percent of households had access to safe water, i.e. either piped or from boreholes/protected wells. The remaining 22 percent relied on relatively unsafe water from unprotected wells, rivers, streams and dams. It was further noted that 28 percent of the households had water on their premises, while 35 percent had water within a distance of less than 500 metres. Nine percent had to cover more than one kilometre for their water. It was further noted that households in Mutare Urban and Rusape were better off than those in the rural districts both in terms of the quality of water and the distance to the source. 16 Information on the type of toilet facility mainly used by the household in the province indicated that a sizeable proportion (20 percent) of the households had no toilet facility at all. The proportion of households without any toilet facility was highest in Buhera (50 percent) and lowest in Mutasa (6 percent). This observation excludes Mutare Urban and Rusape. About 15 percent of the households mainly used flush toilets, 29 percent blair toilets and 29 percent pit latrines. The proportion of households which mostly used flush toilets in Buhera was about 2 percent, compared with 85 percent in Rusape. With regard to the type of energy mainly used for cooking, it was observed that 81 percent of the households in the province used wood, while about 15 percent of them used either paraffin or electricity. Less than one percent of the households used gas, coal and other forms of energy. Disparities were observed among the districts. Fertility Estimates of the level of fertility and mortality were made using the data from the census, mainly applying direct methods. In addition estimates of crude death rate, infant and maternal mortality rate, were made using direct techniques. The rate of natural increase was also calculated using direct estimates of both the birth and death rates. It was observed that the total fertility rate for the province was about 4.3 children per woman. It was further noted that this level seemed to vary with level of education of mothers. Mortality The infant mortality rate was estimated at 69 deaths per 1000 births for The rate was generally higher for males than for females in all districts. It was also higher in rural than in urban areas. In addition, the level of infant mortality seems to indicate a decline with increasing level of education of mothers. The level of maternal mortality was also estimated using the data on reported deaths
17 in the last 12 months before the census. The maternal mortality ratio was 505 deaths from maternal causes per live births. There were wide variations among districts. The average rate of natural increase for the whole province was 2.3 percent in 2011/2012. This growth rate is the difference between fertility and mortality and does not take into account any growth due to migration. De-facto Count Finally, it should be remembered that this report is based on the population which was enumerated in the province. However, not every person who was enumerated at a particular place was a usual resident there. Four percent of the population enumerated in Manicaland Province usually resided outside the province. 17
18 Manicaland Province Fact Sheet Population Size Total Males Females Sex Ratio Sex Ratio (Males/ 100 Females) 90 Urban Population Population in Urban Areas Percent 17 Population in Rural Areas Percent 83 Age Composition/ Percent Under 15years years 3 Marital Status (Population Age 15years and Above) Percent Never Married 26 Percent Married 59 Percent Divorced/ Separated 4 Percent Widowed 9 Economically Inactive Percent Students 44 Percent Home Makers 36 Percent Retired/ Sick/ Too Old 20 Housing Conditions Percent of Households With Electricity 37 With Safe water 74 With Toilet facilities 76.8 Source of Energy Percent of Households Using Wood for Cooking 81 Fertility Crude Birth Rate (Direct Method) (Births/ 1000 Population) 33 Total Fertility Rate (Direct Method) 4.3 Mortality (Direct Methods) Crude Death Rate 10.3 Infant Mortality Rate 69 Maternal Mortality Ratio 505 Growth Rate of Natural Increase 2.3 Households Number of Private Households Average Household Size 4.2 Percent Male Headed Households 58 Education for Population Age 3-24 years Percent Never been to School 12 Percent Currently at School 62 Percent Left School 26 Ethnicity Percent African Origin 99 Citizenship Percent Zimbabwean 99 Activity and Labour Force Economically Active Percent Employed 94 Percent Unemployed 6 18
19 Manicaland Province Chapter 1 Population Size and Structure Chapter 1: Population Size and Structure Introduction This chapter looks at the population size and structure of Manicaland Province. The analysis is based on the population as enumerated with reference to the census night that is August 17/18, Population Size Manicaland Province had a total population of people out of the population of From Table 1.1 it can be observed that sex ratio varied among districts. The sex ratios were 90 or above in five districts and less than 90 in the other five districts. The sex ratio was highest in Makoni district (96) and lowest in Chipinge Urban district (84). Rate of Natural Increase Estimates of the rates of natural increase for the province and districts are presented in Table 1.2. These rates were calculated from the crude birth and death rates which were obtained using the direct method. The crude birth and death rates were obtained by dividing the number of births and deaths Zimbabwe of The proportion of male and female population was 47 and 53 percent respectively see Table 1.1. This resulted in a sex ratio of 90. Sex ratio is the average number of males per 100 females. Therefore a ratio above 100 indicates an excess of males over females while a ratio below 100 depicts the opposite. Appendix A1.1 shows the distribution of the population by district, ward and sex. The distribution of the population by district, 5 year age-groups and sex is shown in AppendixA1.2. Chipinge s population constituted about 17 percent of the population in the province whilst Rusape and Chipinge Urban contributed less than 2 percent each. respectively in the last twelve months as reported by the total population. Detailed discussions on the crude birth and death rates are presented in subsequent chapters on fertility and mortality respectively. The average rate of natural increase for the whole province was 2.3 percent for the period September 2012 to August Chipinge Urban and Rusape had the highest rates of natural increase of 4.2 percent and Buhera had the lowest rate of natural increase of 3.0 percent. This rate of natural increase is the difference between the level of fertility and mortality and does not take account of any growth due to migration. Information on migration movements between provinces will be available after the completion of data 19
20 Manicaland Province Chapter 1 Population Size and Structure processing for all the provinces and analysis will be undertaken accordingly. Age-Sex Structure The composition of population by age group and sex is presented in Table 1.3. The 0-4, 5-9 and years age groups had the highest proportions of the population each with over 16 percent. The years age group had the least proportion (1,2 percent). It can further be observed that the proportion of the young population, that is those age under 15 years, was 44 percent while that of the population age 65 years and above was about 3 percent. The age-sex structure of a population can be displayed by use of a population pyramid. This has been done using data from Table 1.3 and is shown in Figure 1.1. It can be observed that the pyramid is broad-based and narrow at the top. This emphasises the fact that this population was young since a sizeable proportion of the population belonged to the younger age groups. The sex ratios by age are also shown in Table 1.3 and in Figure 1.2. The number of males exceeded that of females for the and age groups. Females were more than males in all the other age groups. Current Marital Status Table 1.4 reveals that a large proportion (60 percent) of the population age 15 years and above in the province were in the " married" category, while 26 percent were in the "never married" group. Similar patterns were observed in all the districts. It is observed from Tables 1.5b and 1.6b that about 37 and 17 percent of the males and females respectively had never married, while 57 and 61 percent respectively were married. Proportions of divorced/separated persons were relatively smaller for males than for females. From Tables 1.5a and 1.6a it can be observed that for those who were married, less than 1 percent of the males compared to about 8 percent of the females were under 20 years of age. This disparity is further depicted in Tables 1.5b and 1.6b, where the percentages of those who were married in the years age group were about 2 for males and about 27 percent for females. In the case of those who were divorced/ separated, 71 percent of the males compared with 72 percent of the females were age years as shown in Tables 1. 5a and 1. 6a. Again, a look at Tables 1. 5b and 1. 6b reveals that the percentages of persons in this marital category and in the age groups 20
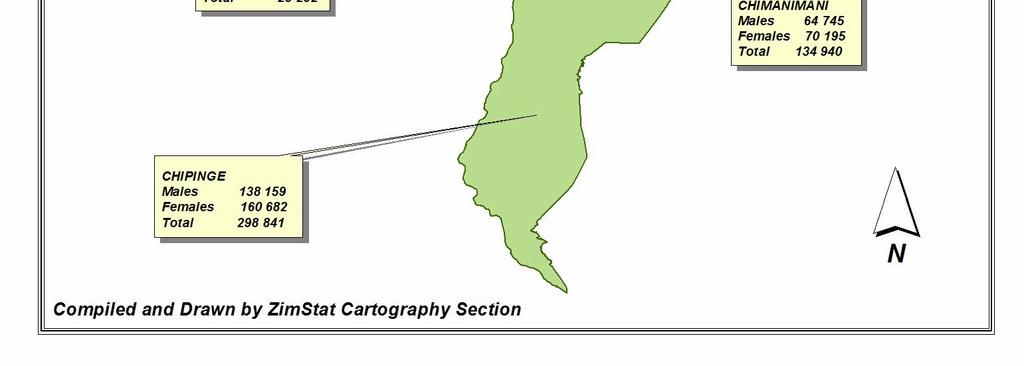
21 Manicaland Province Chapter 1 Population Size and Structure in this age range were relatively smaller for males than for females. Comparisons within age groups can be made using the same two tables. From age 45 years upwards, the proportions for males 2 percent and 4 percent in all age groups, while those for females ranged from 2 percent in the 75+ years age range to 6 percent in the years age group. Widowers made up about 2 percent of the male population, while widows were about 9 percent of the female population. Comparisons between age groups show that there were relatively higher proportions of widows than widowers in the older age groups, see Tables 1.5b and 1.6b. This phenomenon should be expected when female mortality is lower than that of males. Ethnicity It can be observed from Table 1.8 that almost all of the population in Manicaland Province was of African ethnic origin. A negligible percent (less than 1 per cent) accounted for persons of European, Asiatic and Mixed origin. The age distribution of the population of African ethnic origin was the same as for the whole population. The proportion of the population age 65 years and above was higher for persons of non- African ethnic origin than for African origin see Table 1.9 and 1.10 Citizenship The distribution of the population by country of citizenship is presented in Table It can be observed that the majority, about 99 percent of the population in the province, was made up of Zimbabweans. About 30 and 10 percent of the non- Zimbabweans were Mozambicans and Malawians, respectively. Conclusion Manicaland province had a total population of people. Sex ratio for Manicaland was about 90. The majority of the people in this province lived in Chipinge and were Zimbabweans of African origin. 21
22 Manicaland Province Chapter 1 Population Size and Structure Table 1.1: Percent Distribution of Population by District and Sex, Manicaland Province, Zimbabwe 2012 Census District Male Female Percent Number Percent Sex Ratio Buhera Chimanimani Chipinge Rural Makoni Mutare Rural Mutasa Nyanga Rural Mutare Urban Rusape Chipinge Urban Total Table 1.2: Crude Birth and Death Rate and Rate of Natural Increase by District, Manicaland Province, Zimbabwe 2012 Census District Crude Birth Rate Crude Death Rate Rate of Natural Increase (per 1000) (per 1000) (percent) Buhera Chimanimani Chipinge Makoni Mutare Rural Mutasa Nyanga Rural Mutare Rusape Chipinge Total
23 Manicaland Province Chapter 1 Population Size and Structure Table 1.3: Percent Composition of Population by Age Group and Sex, Manicaland Province, Zimbabwe 2012 Census Age Group Male Female Total Sex Ratio NS Total Table 1.4: Percent Distribution of the Population by District and Marital Status, Manicaland Province, Zimbabwe 2012 Census District Never Married Married Divorced/ separated Widowed Not Stated Total Number Buhera Chimanimani Chipinge Rural Makoni Mutare Rural Mutasa Nyanga Rural Mutare Urban Rusape Chipinge Urban Manicaland
24 Manicaland Province Chapter 1 Population Size and Structure Table 1.5: Percent Distribution of the Male Population by Age Group and Marital Status, Manicaland Province, Zimbabwe 2012 Census (a) Age Group Never Married Married Divorced/ separated Widowed Not Stated Total NS Total Number
25 Manicaland Province Chapter 1 Population Size and Structure (b) Age Group Never Married Married Divorced/ separated Widowed Not Stated Total Number * NS Total Table 1.6: Percent Distribution of the Femal e Population by Age Group and Marital Status, Manicaland Province, Zimbabwe 2012 Census (a) Age Group Never Married Married Divorced/ separated Widowed Not Stated Total NS Total Number
26 Manicaland Province Chapter 1 Population Size and Structure (b) Age Group Never Married Married Divorced/ separated Widowed Not Stated Total Number NS Total
27 Manicaland Province Chapter 1 Population Size and Structure Table 1.7: Percent Distribution of the Total Population by Age Group and Marital Status, Manicaland Province, Zimbabwe 2012 Census (a) Age Group Never Married Married Divorced/ separated Widowed Not Stated Total NS Total Number
28 Manicaland Province Chapter 1 Population Size and Structure (b) Age Group Never Married Married Divorced/ separated Widowed Not Stated Total Number NS Total Table 1.8: Distribution of Total Population by Broad Age Groups and Ethnicity, Manicaland Province, Zimbabwe 2012 Census Age Group Ethnic Origin Not Stated Total % Total African European Asiatic * Mixed Race * Other * Not Stated Total
29 Manicaland Province Chapter 1 Population Size and Structure Table 1.9: Distribution of the Urban Population by Broad Age Groups and Ethnicity, Manicaland Province, Zimbabwe 2012 Census Age Group Ethnicity Not Stated Total Number Total African European Asiatic Mixed Race Other * Not Stated Total Table 1.10: Percent Distribution of the Rural Population by Broad Age Groups and Ethnicity, Manicaland Province, Zimbabwe 2012 Census Age Group Ethnicity Not Stated Total Number Total African European * Asiatic * Mixed Race * Other * Not Stated Total Table 1.11: Distribution of the Total Population by Citizenship, Manicaland Province, Zimbabwe 2012 Census Citizenship Number Percent Zimbabwean Botswana 104 * Malawi Mozambique South Africa 488 * Zambia 524 * Other African Countries United Kingdom 234 * Other European Countries 80 * American Countries 43 * Asian Countries 452 * Other Countries 90 * Not Stated Total
30 Manicaland Province Chapter 2 Population Distribution and Migration Chapter 2: Population Distribution and Migration Introduction Population distribution is important for planning purposes as information is disaggregated to geographic subdivisions such as provinces, districts and wards. Another dimension of the distribution is between urban and rural areas. Also, of great interest are the factors which account for the redistribution of population in a country, province and/or district. Redistribution can occur as a result of internal migration, resettlement, geographic boundary changes, etc. In this chapter, an analysis of population distribution on the basis of the 2012 Population Census is made. In addition to this, an attempt is made to come up with a measure of the extent of urbanisation and provide an insight into migration patterns. Urban, Rusape and Chipinge Urban see Fig. 2.1 Table 2.1 shows population size for the province. Chipinge had the largest proportion of the population in the province (17 percent). This was followed by Makoni (16 percent), Mutare Rural (15 percent), Buhera (14 percent) and Mutare Urban (11 percent). Rusape (about 2 percent) and Chipinge Rural (1 percent) see Fig 2.2. Rural and Urban Population According to the 2012 Population Census, the definition of an urban area was based on the following criteria; i) designated urban areas ii) places which had all the following characteristics were also defined as urban areas inhabitants or more - a compact settlement pattern Population Size and Distribution According to the 2012 Population Census, Manicaland Province had a population of persons. Manicaland Province is divided into ten Census Districts, and these are Buhera, Chimanimani, Chipinge Rural, Makoni, Mutare Rural, Mutasa, Nyanga, Mutare 30 - the majority (more than 50 percent) of the employed persons engaged in nonagricultural occupations Table 2.2 shows that all districts had an urban component. Mutare Urban s population of represented the largest proportion of the province s urban population (63 percent) while Rusape had 10 percent see Table 2.3. About 17 percent of
31 Manicaland Province Chapter 2 Population Distribution and Migration the total population in the province was living in the urban area. See Fig 2.2 Migration In the 2012 Census, information was solicited through questions on i) place of enumeration, ii) place of birth and iii) place of residence in August 2002 Caution must be taken when interpreting migration data between the two censuses. In Table 2.4, the enumerated population is presented by main place of usual residence. It should be cautioned that "the usual place of residence" figures are for the population that was enumerated in the province. Buhera Of the enumerated population, 95 percent usually resided in the same district. About 1 percent was from the other districts within the same province, another 4 percent from other provinces with Masvingo and Harare being the major contributors. Chimanimani In Chimanimani district, about 94 percent of the enumerated population usually lived in the same district. About 4 percent was from other districts within the same province,2 percent from other provinces with Harare being the main contributor. A very small proportion came from other countries. Chipinge Approximately 96 percent of the enumerated population usually resided in the same district while 1 percent usually resided in other districts within the same province. About 2 percent was from other provinces and the main contributor was Masvingo. A small proportion (0,6 percent) came from other countries. Makoni In Makoni district, about 92 percent of the enumerated population usually lived in the same district. About 3 percent was from other districts within the same province, 5percent from other provinces with Mashonaland East and Harare being the main contributors. A very small proportion came from other countries. Mutare Rural About 92 percent of the enumerated population usually resided in the same district. Five percent usually resided in other districts while 3 percent and a negligible proportion were from other provinces and countries respectively. Mutasa Ninety- one percent of the enumerated population usually resided in the same district while 4 percent usually resided in 31
32 Manicaland Province Chapter 2 Population Distribution and Migration other districts, another 4 percent in other provinces. Nyanga About 93 percent of the enumerated population usually resided in the same district, 3 percent usually resided in other districts and 4 percent in other provinces. Rusape Urban Eighty-five percent of the enumerated population usually resided in the same district, 9 percent in other districts in the same province and 6 percent in other provinces. Mutare Urban About 88 percent of the population enumerated in Mutare Urban usually resided in the same district, 7 percent in other districts in the same province and 5 percent in other provinces. Table 2.5 shows that persons counted in Manicaland province usually resided in other provinces and of these, 37 percent resided in Harare, 13 percent in Masvingo and 12 percent in Mashonaland East. Conclusion About 17 percent of the population in Manicaland Province resided in urban areas. There was a sizeable movement of people from district to district and also from other provinces. About 4 percent of the population enumerated in Manicaland Province usually resided in other provinces and the main contributor was Harare. Overall, approximately 93 percent of the population enumerated in the province usually resided there. 32
33 Manicaland Province Chapter 2 Population Distribution and Migration Table 2.1: Distribution of Population by District, Manicaland Province, Zimbabwe 2012 Census District Total Population Percent Buhera Chimanimani Chipinge Rural Makoni Mutare Rural Mutasa Nyanga Rural Mutare Urban Rusape Chipinge Urban Total Table 2.2: Distribution of the Population for Rural and Urban Districts, Manicaland Province, Zimbabwe 2012 Census District Urban Rural Total Number Buhera Chimanimani Chipinge Rural Makoni Mutare Rural Mutasa Nyanga Rural Mutare Urban Rusape Chipinge Urban Total
34 Manicaland Province Chapter 2 Population Distribution and Migration Table 2.3: Population in Urban Centres by District, Manicaland Province, Zimbabwe 2012 Census District Total Population Percent Buhera Chimanimani Chipinge Rural Makoni Mutare Rural Mutasa Nyanga Rural Mutare Urban Rusape Chipinge Urban Total Table 2.4: Total Population by District of Enumeration and District of Usual Residence, Manicaland Province, Zimbabwe 2012 Census (a) Residing in Same District Residing in Other Manicaland District Residing in Other Provinces Residing in Other Countries District Total Buhera Chimanimani Chipinge Rural Makoni Mutare Rural Mutasa Nyanga Rural Mutare Urban Rusape Chipinge Urban Total
35 Manicaland Province Chapter 2 Population Distribution and Migration (b) District Residing in Same District Residing in Other Manicaland District Residing in Other Provinces Residing in Other Countries Total Number Buhera Chimanimani Chipinge Rural Makoni Mutare Rural Mutasa Nyanga Rural Mutare Urban Rusape Chipinge Urban Total
36 Manicaland Province Chapter 2 Population Distribution and Migration Table 2.5: Population Not Usually Residing in Manicaland Province by Province of Usual Residence and District of Enumeration, Manicaland Province, Zimbabwe 2012 Census District of Enumeration Province of Usual Residence Buhera Chimanimani Chipinge Rural Makoni Mutare Rural Mutasa Nyanga Rural Mutare Urban Rusape Chipinge Urban Total Mashonaland Central Mashonaland East Mashonaland West Matabeleland North Matabeleland South Midlands Masvingo Harare Bulawayo Not Known Invalid Total
37 Manicaland Province Chapter 2 Population Distribution and Migration Province of Usual Residence Buhera Chimanimani Chipinge Rural Makoni District of Enumeration Mutare Rural Mutasa Nyanga Rural Mutare Urban Rusape Chipinge Urban Mashonaland Central Mashonaland East Mashonaland West Matabeleland North Matabeleland South Midlands Masvingo Harare Bulawayo Not Known Invalid Total Number Total 37
38 Manicaland Province Chapter 2 Population Distribution and Migration Province of Usual Residence Buhera Chima nimani Chipinge Rural Makoni District of Enumeration Mutare Rural Mutasa Nyanga Rural Mutare Urban Rusape Chipinge Urban Total Number Mashonaland Central Mashonaland East Mashonaland West Matabeleland North Matabeleland South Midlands Masvingo Harare Bulawayo Not Known Invalid Total
39 Manicaland Province Chapter 3 Household Characteristics Chapter 3: Household Characteristics Introduction This chapter presents household characteristics of the population in Manicaland Province. Distinction was made between private households and collective/institutional ones. The latter included persons who were staying in hotels, hostels, holiday camps, hospitals and prisons. For census purposes, a private household was defined as a group of persons who stayed the census night together, i.e. Friday night of August 17/18, in a dwelling unit, whether or not they were related by blood or marriage. For example, visitors who were not usual members of the household, but were present during the census night, were included. On the other hand, usual members of the household who normally live there, but had spent the census night elsewhere were excluded since they would have been counted at the place where they stayed that particular night. However, those who were temporarily absent on the census night but would be returning to the household in the morning of 18 August 2012 were counted in their usual households. It should be realised that in a census situation a household was not the same as a family. The type of households which were covered included: (a) (b) (c) (d) one-person household; nuclear households whose composition was entirely singlefamily nucleus; extended household which consisted of single-family nucleus and other persons related to the nucleus, and composite household made up of at least single-family nucleus plus other persons who may or may not be related to the nucleus The head of the household was defined as that member of the household who was 39 regarded as such by those who stayed the census night with the household and was either male or female. She/he must have stayed the census night in the household or had returned on the morning of the 18th August 2012, and had not been counted elsewhere. Private Households The demographic characteristics of the population in private households did not deviate from those of the total population as given in Chapter I and are, therefore, not presented here. Table 3.1 shows the total population in private households by number of private households, average household size and by district. There were private households in the province. These households constituted a population of persons, resulting in an average household size of about 4.2 persons. The remainder of the population ( persons) was in collective households. Table 3.1 also shows that private households in Chipinge Rural constituted about 16 percent of the total number of households, while those in Chipinge Urban constituted the least (less than 2 percent). Tables 3.2a and b present the distribution of private households in the province by size of household and sex of the head of the household. The largest proportion of the households (18 percent) was in the fourperson household size category while the lowest proportion (about 7 percent) was in the seven-person household size category. About 85 percent of the total households in the province had 6 persons at most as shown in Table 3.2a. There were more male-headed households than female-headed ones in the province as shown in Table 3.2b. Fifty-eight percent of the private households were headed by males. The proportions of maleheaded households ranged from 48 to 66 percent, while those for females ranged from 34 to 52 percent considering each household size category. Table 3.3a-j shows the number and size of private households by sex of the head of the
40 Manicaland Province Chapter 3 Household Characteristics household for the districts. The proportion of one- person households ranged between 9 and 16 percent of the households in the districts. The proportion in each household size category in all districts generally increased up to households with 4 persons and then declined thereafter. Eighty-one to 91 percent of the total households in the districts had 6 persons at most. Table 3.4 presents the distribution of heads of private households by age group and sex. About 50 percent of the households were headed by persons below 40 years of age. The proportions of male-headed households were higher than those of female-headed households for each age group except the under-15 and the year age ranges. There were marked differences in the proportions between male and femaleheaded households from age 15 years onwards. The proportions of male-headed households ranged from 48 to 66 percent, while those of female headed households ranged from 35 to 52 percent. Tables 3.5a to j show the distribution of the heads of private households by age and sex in all districts in Manicaland. In Mutare Urban and Chipinge Urban male headed households accounted for 70 and 62 percent respectively while in the rest of the districts male headed households accounted for 51 to 61percent of the total households. Collective households The total population of persons in collective households constituted 1.2 percent of the total population in the province. The distribution of the collective household population by broad age groups and sex for the province is shown in Table 3.7. About 15 percent of the collective household population was under 15 years of age and about 4 percent was age 65 years and above. Males constituted 56 percent of the total population in collective households even though they only out-numbered females in the year age group Table 3.7 shows that 27 percent of the population in collective households in the province had never married, while 51 percent were married, about 3 percent were divorced or separated and another 4 percent were widowed. Living Arrangements Most household members in Manicaland are related to the head of household (Table 3.8). Of the persons living in private households less than 2 percent were not related to the head. Of the parents living with the head of households, 86 percent were females. The number of female parents relative to male parents may be reflective of the older age of widows compared with widowers. Conclusion Manicaland Province had an average household size of 4.2 persons. There were more male headed private households than female-headed ones. In collective household, there were more males than females. 40
41 Manicaland Province Chapter 3 Household Characteristics Table 3.1: Population in Private Households by Number of Households and Average Household Size and District, Manicaland Province, Zimbabwe 2012 Census Households District Population Number Percent Average Household Size Buhera Chimanimani Chipinge Rural Makoni Mutare Rural Mutasa Nyanga Mutare Urban Rusape Chipinge Urban Total Table 3.2: Distribution of Private Households by Size and Sex of Head of Household Manicaland Province, Zimbabwe 2012 Census (a) Household Size Number of Households Headed by: Males Females Total Number Percent Number Percent Number Percent Total
42 Manicaland Province Chapter 3 Household Characteristics (b) Household Size Number of Households Headed by: Males Females Total Number Percent Number Percent Number Percent Total Table 3.3: Distribution of Private Households by Size and Sex of Head of Household and by District Manicaland Province, Zimbabwe 2012 Census (a) Buhera Household Size Number of Households Headed by: Males Females Total Number Percent Number Percent Number Percent Total (b) Chimanimani Total
43 Manicaland Province Chapter 3 Household Characteristics Table 3.3: Distribution of Private Households by Size and Sex of Head of Household and by District Manicaland Province, Zimbabwe 2012 Census (c) Chipinge Rural Total (d) Makoni Household Size Number of Households Headed by: Males Females Total Number Percent Number Percent Number Percent Total (e) Mutare Rural Total
44 Manicaland Province Chapter 3 Household Characteristics Table 3.3: Distribution of Private Households by Size and Sex of Head of Household and by District Manicaland Province, Zimbabwe 2012 Census (f) Mutasa Household Number of Households Headed by: Size Males Females Total Number Percent Number Percent Number Percent Total (g) Nyanga Household Size Number of Households Headed by: Males Females Total Number Percent Number Percent Number Percent Total (h) Mutare Urban Total
45 Manicaland Province Chapter 3 Household Characteristics (j) Chipinge Urban Household Number of Households Headed by: Size Males Females Total Number Percent Number Percent Number Percent Total
46 Manicaland Province Chapter 3 Household Characteristics Table 3.4 Distribution of Heads of Private Households by Age Group and Sex, Manicaland Province, Zimbabwe 2012 Census Number of Households Headed by: Percent of Households Headed by: Age Group Males Females Total Males Females Total Percent < NS Total Table 3.5 Distribution of Heads of Private Households by District, Age Group and Sex Manicaland Province, Zimbabwe 2012 Census (a) Buhera Percent of Households Headed Number of Households Headed by: by: Age Group Males Females Total Males Females Total Percent < NS Total
47 Manicaland Province Chapter 3 Household Characteristics (b) Chimanimani Number of Households Headed by: Percent of Households Headed by: Age Group Males Females Total Males Females Total Percent NS Total
48 Manicaland Province Chapter 3 Household Characteristics (c) Chipinge Number of Households Headed by: Percent of Households Headed by: Age Group Males Females Total Males Females Total Percent < NS Total (d) Makoni < NS Total
49 Manicaland Province Chapter 3 Household Characteristics (e) Mutare Rural Number of Households Headed by: Percent of Households Headed by: Age Group Males Females Total Males Females Total Percent < NS Total (f) Mutasa < NS Total
50 Manicaland Province Chapter 3 Household Characteristics (g) Nyanga Number of Households Headed by: Percent of Households Headed by: Age Group Males Females Total Males Females Total Percent < NS Total (h) Mutare Urban < NS Total
51 Manicaland Province Chapter 3 Household Characteristics (i) Rusape Number of Households Headed by: Percent of Households Headed by: Age Group Males Females Total Males Females Total Percent < NS Total (j) Chipinge Urban < NS Total
52 Manicaland Province Chapter 3 Household Characteristics Table 3.6: Percent Distribution of Population in Collective Households by Age Group and Sex, Manicaland Province, Zimbabwe 2012 Census Broad Age Group Male Female Total Number Percent Not Stated Total Percent Total Persons Table 3.7: Distribution of Population in Collective Households by Age Group and Marital Status, Manicaland Province, Zimbabwe 2012 Census Age Groups Never Married Married Divorced/ separated Widowed Not Stated Total NS Total % Total
53 Manicaland Province Chapter 4 Education Table 3.8: Population in Private Household by Urban/Rural, Relationship to Head of Household and Sex, Manicaland Province, Zimbabwe 2012 Census (a) Rural Relationship to Head of Household Male Percent Female Percent Total Percent Head Spouse Son/daughter Parent Grandson/daughter Brother/sister Other relative Not relative Not Stated Total (b) Urban Relationship to Head of Household Male Percent Female Percent Total Percent Head Spouse Son/daughter Parent Grandson/daughter Brother/sister Other relative Not relative Not Stated Total ( c) Total Relationship to Head of Household Male Percent Female Percent Total Percent Head Spouse Son/daughter Parent Grandson/daughter Brother/sister Other relative Not relative Not Stated Total
54 Manicaland Province Chapter 4 Education Chapter 4: Education Introduction Information on education characteristics of the population for the 2012 Population Census was based on persons age three years and above and those age 3-24 years. In general, children age below three years are considered to be too young for pre-school and formal school attendance. In some tables, it should be noted that persons who did not state their ages have been included in the analysis of education, because the possibility of not identifying the age of a person under 3 years is very small. The fact that school attendance was recorded implies that the respondent s age was at least three years. The information on education was solicited by asking the respondents five questions: 1) Has (name) ever been to school? Response categories: Yes No 2) What is (name)'s highest level and grade of education completed? Response categories: Level 8=8 (None completed) Level 0=1-3 (Early education) Level 1=1-7 (Primary) Level 2=1-6 (Secondary) Level 3 (Tertiary) 1 Certificate/Diploma after primary 2 Certificate/Diploma after secondary 3 Graduate/Postgraduate The following questions were applicable to persons age 3-24 years 3) Is (name) currently attending school? 4) Was (name) ever in attendance in school at any point during this year? 5) During this school year, what level and grade is (name) attending/was enrolled in? It should be emphasized that highest level of education completed means the completion of a full academic year/course. For example, a child currently attending grade one has not completed grade one yet. At the same time, all those persons who had never been to school in the first question were categorised under "no level completed" in the second question. Some indicators relating to education were computed using the information obtained from the above responses. However, caution should be exercised with regard to their interpretation. In particular, the literacy rates obtained from this data are a proxy of the actual rate. The rate of literacy was obtained by assuming that any person who had completed at least level one at grade three was literate. Additional questions, which the census could not accommodate, would have had to be asked and a simple literacy test administered to arrive at an actual rate of literacy. Population by School Attendance Table 4. 1 presents the distribution of the population age 3 24 years by school attendance and sex. About 26 percent of this population had left school while 62 percent were still at school. Around 51 percent of males and 49 percent of females had never attended school. Out of the population that had never been to school, 13 percent were males and 12 percent were females. There was no big difference between proportions of males and females for those who were at school. Furthermore, of those who had already left school, there were more females (30 percent) than males (25 percent). Population Never Been to School About 12 percent of the population age 3-24 years had never been to school. Of this population 84 percent was below the official 54
55 Manicaland Province Chapter 4 Education entry age (i.e. below 6 years of age) see Table 4.2.Slightly more males (13 percent) than females (12 percent) had never been to school. Tables 4.3a j show that the proportion of this population varied from 74 percent in Chipinge Rural district to 91 percent in both Rusape and Mutare Urban. A district comparison shows that of the population which had never been to school the highest proportion was in Chipinge, (23 percent). The distribution of the population never been to school resembles that of the total population see Table 4.4. Population Ever Been to School A total of persons had ever been to school. These persons constituted 66 percent of the population age 3 years and above. Table 4.5 shows that generally more females than males had ever been to school. Population Currently at School Table 4.6 shows that 62 percent of the population at school were in primary school. Around 13 percent of the population currently at school was in early childhood education while Buhera, Mutare Urban and Chipinge Urban had the highest proportion (4 percent) of those currently attending tertiary education. The proportion in primary school ranged from 48 percent in Buhera, Mutare Urban and Chipinge Urban to 69 percent in Chipinge Rural (see Table 4.7 a- j). Population age 3-24 years which left school. Of the total population age 3 24 years, 26 percent had left school. Of the population that had left school 55 percent were female and 45 percent male. Of the total female population age 3 24 years, 30 percent had left school while the proportion for males was 25 percent, see Table 4.1. Table 4.8 shows that more than half of school leavers (57 percent) were age years. School Enrolment for population age 3 24 years. Table 4.9 shows that the gross enrolment ratio for primary education indicates that there were more pupils enrolled than should officially be in this level (106. The gross enrolment ratio for both males and females shows a similar pattern. The gross enrolment ratio for secondary education (55 percent) shows that there were fewer pupils than those who should officially be at this level. The gross enrolment ratio is the total enrolment in a given level of education irrespective of age expressed in ratio to the population of the age group which officially corresponds to the same level of education. The net enrolment ratios indicate that there is high participation for both sexes in the primary education, 86 for males and 87 for females. Slightly fewer females (48 percent) participate at secondary level than males (49 percent). The net enrolment ratio measures part of the pupils enrolled at the right age. It thus measures the extent of participation of school going age population. Highest Level of Education Completed In Manicaland Province 42 percent of the population age 3 years and above had completed secondary and above level of education, see Table For each sex more females have completed primary education than males (51 percent compared with 45 percent) while more males (44 percent compared with 40 percent) for females have completed secondary education and above. Literacy For the 2012 Population Census, the population age at least 15 years which had completed at least grade 3 was classified as literate. The literacy rate is thus the number of persons, who had completed at least grade 3 per 100 persons in a particular age category. From this definition, 96 percent of those age 15 years and above in the province were literate, as indicated in Table Males and females had almost similar 55
56 Manicaland Province Chapter 4 Education literacy rates. The 15-19, and years age groups had the highest literacy rate of 98 and 99 percent. As expected the literacy rate declined with increasing age, confirming that the older generation were relatively disadvantaged with regard to education. Across the districts, the literacy rates ranged from 80 percent in Chipinge Rural to see Table Conclusion In Manicaland province there were slightly more males than females who had never been to school and there were slightly more females than males at school. Among those who had left school, there were more females than males and the same was observed towards higher levels of education. Manicaland had a literacy rate of 96 percent. 56
57 Manicaland Province Chapter 4 Education Table 4.1: Distribution of the Population Age 3-24 by School Attendance and by Sex, Manicaland Province, Zimbabwe 2012 Census School Attendance Male Female Total Ever been to school? Attended School Never Attended Missing Total Currently attending school? Currently Attending Left School Missing Total Ever been to school? Attended School Never Attended Missing Total Currently attending school? Currently Attending Left School Missing Total Ever been to school? Attended School Never Attended Missing Total Number Currently attending school? Currently Attending Left School Missing Total Number
58 Manicaland Province Chapter 4 Education Table 4.2: Percent Distribution of the Population Age 3-24 who never attended school by Sex, Manicaland Province, Zimbabwe 2012 Census Age Male Female Total Total Number
59 Manicaland Province Chapter 4 Education Table 4.3: Percent Distribution of the Population Age 3-24 who never attended school by District and Sex, Manicaland Province, Zimbabwe 2012 Census (a) Buhera Age Male Female Total Total Number
60 Manicaland Province Chapter 4 Education Table 4.3: Percent Distribution of the Population Age 3-24 who never attended school by District and Sex, Manicaland Province, Zimbabwe 2012 Census (b)chimanimani Age Male Female Total Total Number
61 Manicaland Province Chapter 4 Education Table 4.3: Percent Distribution of the Population Age 3-24 who never attended school by District and Sex, Manicaland Province, Zimbabwe 2012 Census (c)chipinge Age Male Female Total Total Number
62 Manicaland Province Chapter 4 Education Table 4.3: Percent Distribution of the Population Age 3-24 who never attended school by District and Sex, Manicaland Province, Zimbabwe 2012 Census (d)makoni Age Male Female Total Total Number
63 Manicaland Province Chapter 4 Education Table 4.3: Percent Distribution of the Population Age 3-24 who never attended school by District and Sex, Manicaland Province, Zimbabwe 2012 Census (e)mutare Rural Age Male Female Total Total Number
64 Manicaland Province Chapter 4 Education Table 4.3: Percent Distribution of the Population Age 3-24 who never attended school by District and Sex, Manicaland Province, Zimbabwe 2012 Census (f) Mutasa Age Male Female Total Total Number
65 Manicaland Province Chapter 4 Education Table 4.3: Percent Distribution of the Population Age 3-24 who never attended school by District and Sex, Manicaland Province, Zimbabwe 2012 Census (g)nyanga Age Male Female Total Total Number
66 Manicaland Province Chapter 4 Education Table 4.3: Percent Distribution of the Population Age 3-24 who never attended school by District and Sex, Manicaland Province, Zimbabwe 2012 Census (h)mutare Urban Age Male Female Total Total Number
67 Manicaland Province Chapter 4 Education Table 4.3: Percent Distribution of the Population Age 3-24 who never attended school by District and Sex, Manicaland Province, Zimbabwe 2012 Census (i)rusape Age Male Female Total Total Number
68 Manicaland Province Chapter 4 Education Table 4.3: Percent Distribution of the Population Age 3-24 who never attended school by District and Sex, Manicaland Province, Zimbabwe 2012 Census (j) Chipinge Urban Age Male Female Total Total Number
69 Manicaland Province Chapter 4 Education Table 4.4: Percent Distribution of the Population Age 3-24 who never attended school by Sex and District, Manicaland Province, Zimbabwe 2012 Census District Males Females Total Buhera Chimanimani Chipinge Makoni Mutare Rural Mutasa Nyanga Rural Mutare Rusape Chipinge Percent Total
70 Manicaland Province Chapter 4 Education Table 4.5: Percent Distribution of Population ever been to school by Age Group and Sex, Manicaland Province, Zimbabwe 2012 Census Age Group Male Female Total NS Total Number Table 4.6: Population Age 3-24 Years Currently Attending School by Current Level of Education Being Attended and Sex, Manicaland Province, Zimbabwe 2012 Census Current Level Male Female Total Pre-School Primary Secondary Tertiary Not known * Missing Total Number
71 Manicaland Province Chapter 4 Education Table 4.7: Population Age 3-24 Years Currently Attending School by District and Current Level of Education Being Attended and Sex, Manicaland Province, Zimbabwe 2012 Census (a) Buhera Current Level Male Female Total Pre-School Primary Secondary Tertiary Not known Missing Total Number (b) Chimanimani Pre-School Primary Secondary Tertiary Not known * Missing Total Number (c) Chipinge Pre-School Primary Secondary Tertiary Not known * Missing Total Number (d) Makoni Pre-School Primary Secondary Tertiary Not known 0.1 * * Missing Total Number
72 Manicaland Province Chapter 4 Education Table 4.7: Population Age 3-24 Years Currently Attending School by District and Current Level of Education Being Attended and Sex, Manicaland Province, Zimbabwe 2012 Census (e) Mutare Rural Current Level Male Female Total Pre-School Primary Secondary Tertiary Not known * * * Missing Total Number (f) Mutasa Pre-School Primary Secondary Tertiary Not known * * * Missing Total Number (g) Nyanga Pre-School Primary Secondary Tertiary Not known * * * Missing Total Number (h) Mutare Urban Pre-School Primary Secondary Tertiary Not known Missing Total Number
73 Manicaland Province Chapter 4 Education (i)rusape Current Level Male Female Total Pre-School Primary Secondary Tertiary Not known * Missing Total Number (j) Chipinge Urban Pre-School Primary Secondary Tertiary Not known Missing Total Number Table 4.8: Population Age 3-24 years Who Left School by Sex and Age Manicaland Province, Zimbabwe 2012 Census School Age Percent Male Percent Female Percent Total Total
74 Manicaland Province Chapter 4 Education Table 4.9: Primary and Secondary School Enrolment for Population Age 3-24 Years Manicaland Province, Zimbabwe 2012 Census Enrolment Primary Secondary Male Female Total Male Female Total Gross Enrolment Net Enrolment Enrolled Population
75 Manicaland Province Chapter 4 Education Table 4.10: Population Age 3+ by Age Group, Sex and Highest Level of Academic Education Completed, Manicaland Province, Zimbabwe 2012 Census Age Group No Education Primary Secondary & Above Not Known Total Total Male Female Male Female Male Female Male Female Male Female Total * * NS Total Number
76 Manicaland Province Chapter 4 Education Table 4.11: Literacy Rates for the Population Aged 15+ by Province and by Sex, Manicaland Province Zimbabwe 2012 Census Literacy Rates Province Male Female Total NS Total Table 4.12: Literacy Rates for the Population Aged 15+ by District and by Sex, Manicaland Province, Zimbabwe 2012 Census Literacy Rates District Male Female Total Buhera Chimanimani Chipinge Makoni Mutare Rural Mutasa Nyanga Rural Mutare Rusape Chipinge Total
77 Manicaland Province Chapter 5 Activity and Labour Force Chapter 5: Activity and Labour Force Introduction The analysis of activity and labour force of a population gives a picture of the manpower of a nation and provides a breakdown of the activities of the nation's labour force. The information is used to classify people according to whether they are in the labour force or not and all this information is important for development planning. The 2012 Population Census collected labour force information from persons age 10 years and above. The main reason why persons age years were asked questions on activity was to obtain information on children working. The present analysis is, however, based mainly on population age 15 years and above although information on the years age group has been tabulated. Three questions on activity were asked. The first question solicited information on respondent's main activity in the last twelve months. This question had nine response categories which were: Paid employee Employer Own account worker Unpaid family worker Looking for work/unemployed Student Homemaker Retired /sick/too old Others Persons who responded that their main activity was any of the first four categories above were then asked their main occupation during the last twelve months as the second question. An additional question on field of specialisation was asked to a person whose main activity was any of the first four categories and who had some recognised post primary/secondary education/training. The economically active population refers to the total number of persons available for the production of goods and services as realised in national income statistics. The economically active population includes paid employees and employers, unpaid family workers, own account workers and those unemployed. On the other hand, homemaking, studying and being sick or too old are examples of activities of the economically inactive population. It is important to note that most women tend to report that they are homemakers even though they combine housework with other economically productive activities. The term labour force in the context of the 2012 Population Census refers to the economically active persons. The definition is in line with that stipulated by the United Nations System of National Accounts and Balances. Economically Active Population According to the 2012 Population Census, the population age 15 years and above for Manicaland Province was and 69 percent of this population was economically active. Figure 5.1 shows that out of the economically active population, 6 percent were unemployed whilst 94 percent were employed. Tables 5.1a and 5.1b describe the economically active population by sex and activity. Table 5. 1a shows that there were more females than males in the categories of unpaid family worker and own account worker. However, more males than females were in categories of paid employee, employer and unemployed. Among the economically active, there were more females (51 percent) than males (49 percent). Table 5.1b shows that for both males and females the highest proportion of 77
78 Manicaland Province Chapter 5 Activity and Labour Force Figure 5.1: Labour Force Framework Total Population Children Under % Age Not Stated % Adults 15 Years and Above % Economically Inactive % Activity Not Stated % Economically Active % Students % Home makers % Retired, Sick/Too Old, Other % Unemployed % Employed % economically active population were own account workers (54 percent and 74 percent respectively). Relatively, the percentage of unemployed was higher for males (9 percent) than for females (4 percent). The males except the urban districts of Mutare Urban, Rusape and Chipinge Urban where there were more males than females. Age-Sex Composition of the activity status of persons with a disability is similar to that described above, see Table 5.1c. Table 5.2 shows the economically active population by sex and district in the province. All districts in the province had more economically active females than Economically Active Population The proportion of persons who were economically active varied with different age and sex categories of the population. Figure 5.2 shows that there were more economically active males than females. 78
79 Manicaland Province Chapter 5 Activity and Labour Force Tables 5.3a to 5.3cshow detailed information on the economically active population by age, sex and activity. These tables show that for both sexes, the largest proportions of economically active persons were in the age range years. Thereafter the proportions declined as age increased. The extent of participation of a population in the labour force can be measured by activity rates. An activity rate is defined as the number of economically active persons in a population per hundred persons in that particular population. The rate is calculated by dividing population age 15 years and above who are economically active by the total population in that age group and then multiplying the result by hundred. The activity rate for Manicaland Province was 69. The activity rates can be specific for age and sex categories of a population, as shown in Tables 5.4a to 5.4c and in Figure 5.3. Activity rates for Manicaland Province were higher for males (71) than for females (65) and this was the case in all age groups except the year age group where activity rate was higher for females (32) than males (28). The activity rates for males ranged from 28 to 94 and those for females from 32 to 81 in the broad age range years. The activity rate for persons age 65 years+ was 60 and 45 for males and females respectively. District Distribution of the Economically Active Population Of the total number of economically active persons, the largest proportions were in Makoni (18 percent), Mutare Rural (16 percent), Buhera (14 percent) and Chipinge (13 percent). Chipinge Urban with 1 percent and Rusape with 2 percent had the lowest proportions, see Table 5.6a.These proportions seem to somehow reflect the population distribution in the province. Table 5.6b shows that the category own account worker had the highest proportion of the economically active persons for all the districts except in Mutare Urban and Chipinge Urban where it was the paid employee category. The employer category had the least proportion of economically active persons for all districts. Makoni had the highest proportion of economically active males (18 percent) while Chipinge Urban had the least (2 percent), see Table 5.7a. This was also the case for females, see Table5.7b. In Table 5.7c, all the districts except in Rusape, Mutare Urban and Chipinge Urban, the highest proportion of economically active males were in the own account worker category. The largest proportion of economically active persons in all age groups were found in Makoni 18 percent. Table 5.8 shows that twenty-five percent of the economically active persons in the 65 years and above age group were in Makoni district. Table 5.9 a-i show activity rates by age group for the ten districts separately. The highest activity rate for seven out of the ten districts was in the year age group. There was a steady decline of the activity rates in the age groups that followed with the least activity rate in the years age group in all the districts except Chipinge 79
80 Manicaland Province Chapter 5 Activity and Labour Force Urban. Employment and Unemployment A situation where the supply of labour exceeds demand gives rise to unemployment. The unemployed were those who had done no work and were looking for work and were available for work. The reference period used to determine current unemployment rate is usually one week. Information on the employment situation was obtained using a time reference period of twelve months. Persons who stated paid employee, employer, own account worker and unpaid family worker as their main activity during the reference period were regarded as employed. Census data thus provide a general picture of employment for the 12 months preceding the census night. For persons age 15 years and above, Manicaland Province had a total of employed persons and persons who reported that they were unemployed. Within the unemployed category there were more males (66 percent) than females (44 percent). There were more females (53 percent) than males (47 percent) in the employed category, see Table 5.10a. Table 5.10b indicates that of all the economically active persons 94 percent were employed while 6 percent were unemployed. About 4 percent of persons with a disability were unemployed (see Table 5.11). Table 5.12 shows unemployment rate by district. This Table shows that Mutare Urban and Chipinge Urban had the highest unemployment rates of 18 percent and 16 percent respectively. Chimanimani had the least unemployment rate of about 2 percent. Children Working The analysis of children working in this chapter is based only on children age years because the 2012 Population Census did not collect data on activity for children under ten years of age. According to the International Labour Organisation (ILO) children under fifteen years of age are not normally supposed to be economically active. Manicaland Province had a total of children age years. About two percent of these children, (8 892 children) were economically active The largest proportion of working children (37 percent) were unpaid family workers, followed by own account workers (27 percent). About 20 percent of children age years stated that they were paid employees while 16 percent were looking for work, see Table 5.13a and b Economically Inactive Population The economically inactive population can be put in the following categories, o Homemakers o Students o retired persons/sick/too old o others. A homemaker was defined as a person of either sex who was engaged in household chores in their own household, e.g. cooking and fetching water. Homemakers were not paid for doing these duties and they did not work for profit. Domestic workers were not placed in this category because they were paid for their duties. Those who worked on household businesses were categorised either as own account workers or unpaid family workers. For the 2012 Population Census, students were those who attended any regular formal public or private educational institution. Retired/sick/too old were those persons who reported that they were not engaged in any activity for most of the last twelve months because they had retired, were sick or too old. The "other" category was for those persons who were not working and did not fit in any 80
81 Manicaland Province Chapter 5 Activity and Labour Force of the categories mentioned above. Prisoners were included in this category. Table 5.14a and b and Figure 5.4 give a picture of inactive population by various activities in the province. Proportionately, more females were economically inactive than males in the province (62 percent females and 38 percent males). Eighty-four percent of all homemakers were females, see Table 5.14a. Table 5.14b shows that the highest proportion of inactive females (52 percent) reported homemaking as their main activity while the highest proportion of inactive males (66 percent) reported studying as their main activity see Figure 5.4. Table 5.14b also shows that persons who mentioned homemaking as their main activity were 36 percent of the economically inactive population while 44 percent were studying. The other economically inactive persons were sick, too old or retired. Among the economically inactive persons with a disability, the largest proportion (61 percent) was in the retired, sick, too old category as shown in Table 5.14c. Details on the economically inactive population by age, sex and activity are shown in Tables 5.15a to c. As expected, the majority (86 percent) of those who reported studying as their main activity were young persons age years. This was the case for both males and females. The tables also show that the proportion of inactive persons declined as age increased. The majority (70 percent) of retired/sick/too old persons were in the age group 65 years and above, see Table 5.15c. Distribution of the Economically Inactive Population by District. Among the economically inactive the largest proportion was in the rural areas (75 percent). Within the rural areas economically inactive population, students contributed largest proportion (46 percent). In the urban areas the home maker category was the largest (47 percent). The other category had the least proportion of the inactive persons in both the rural and urban areas see Table 5.16 a and b. Tables 5.17a to c show that the majority of the economically inactive persons were in Chipinge Rural (23 percent), Mutare Rural (13 percent) and Buhera (12 percent).the least proportions were in Rusape (2 percent) and Chipinge Urban (2 percent). Among the economically inactive persons with a disability, the largest proportion was in the retired, sick, too old 81
82 Manicaland Province Chapter 5 Activity and Labour Force category. Age Dependency Ratios There are three types of dependency ratios, i) the old age, ii) child and iii) the age dependency ratio (child plus old age dependency). The old age dependency ratio is the number of persons age 65 years and above per hundred persons age years. The old age dependency ratio for the province was 9 dependents per 100 persons in the age group years. The child dependency ratio is the number of children under 15 years of age per hundred adults in the ages years. This dependency ratio was 86 dependents per 100 persons in the age group years. The age dependency ratio refers to the number of persons who are under 15 years of age plus persons 65 years and above, per hundred persons in the years age group. This is used to measure the ratio of the young children and the aged to the potential working population. When this dependency ratio is high, it shows that there is a high dependency burden for that particular population. The age dependency ratio for Manicaland Province in 2012 was 95 dependents per 100 persons in the age group years. Occupation Table 5.1 shows occupational classification by sex for the population in Manicaland Province. The highest proportion of employed persons had their occupations in agriculture (60 percent) followed by those in services (16 percent).seventy-one percent of persons with a disability were employed in the agricultural occupations while 12 percent were employed in services (see Table 5.21).This pattern was followed in all the seven rural districts. Makoni had 81 percent of employed persons in the agricultural occupations, followed by those in the services (7 percent) and mining and construction with 2 percent.. In Chimanimani 61 percent of employed 82 persons were in agriculture occupations, 15 percent were in services occupations, 6 percent in mining and construction and 3 percent in manufacturing. In the urban districts, the services occupation had the highest percent followed by education and mining and construction. Rusape district had 41 percent in services, 7 percent in education occupations, 6 percent in both mining and construction and business and finance. Mutare Urban had 35 percent of employed persons in the services occupation, followed by 8 percent in education and 6% in mining and construction. Table 5.20 shows that of the employed persons enumerated in Manicaland province about 52 percent were communal farmers/communal farm workers while the other employed persons were 48 percent. Conclusion Data on activity for Manicaland province from the 2012 Population Census show that about 69 percent of the total population for the province was in the economically active category. The economically active population constituted 71 percent of persons age 15 years and above. Of the economically active population, 6 percent were unemployed and 94 percent employed. The data also show that more males than females were economically active in Manicaland province and that most of the employed persons had occupations in the agricultural sector.
83 Manicaland Province Chapter 5 Activity and Labour Force Table 5.1: Percent Distribution of Economically Active Persons by Sex and Activity, Manicaland Province, Zimbabwe 2012 Census (a) Activity Males Females Total Total Persons Paid Employee Employer Own account worker Unpaid family worker Looking for work Total (b) Activity Males Females Total Number Percent Number Percent Number Percent Paid Employee Employer Own account worker Unpaid family worker Looking for work Total (c) Disability Activity Males Females Total Number Paid Employee Employer Own account worker Unpaid family worker Looking for work Total
84 Manicaland Province Chapter 5 Activity and Labour Force Table 5.2: Percent Distribution of Economically Active Population by Sex and district, Manicaland Province, Zimbabwe 2012 Census Activity Males Females Total Total Persons Buhera Chimanimani Chipinge Rural Makoni Mutare Rural Mutasa Nyanga Mutare Urban Rusape Chipinge Urban Total
85 Manicaland Province Chapter 5 Activity and Labour Force Table 5.3: Percent Distribution of Economically Active Population by Sex, Manicaland Province, Zimbabwe 2012 Census Males Activity Age Group Paid Employee Employer Own account worker Unpaid family worker Looking for work Number % Number % Number % Number % Number % Number % Total Total 85
86 Manicaland Province Chapter 5 Activity and Labour Force Females Activity Age Group Paid Employee Employer Own account worker Unpaid family worker Looking for work Num % Num % Num % Num % Num % Num % Total Total
87 Manicaland Province Chapter 5 Activity and Labour Force Total Activity Age Group Paid Employee Employer Own account worker Unpaid family worker Looking for work Number % Number % Number % Number % Number % Number % Total Total 87
88 Manicaland Province Chapter 5 Activity and Labour Force Table 5.4: Age-Sex-Specific Activity Rates for Age 15+ Years, Manicaland Province, Zimbabwe 2012 Census (a)males Age Group Total Economically Active Activity Rate Total (b)females Age Group Total Economically Active Activity Rate Total
89 Manicaland Province Chapter 5 Activity and Labour Force (c)total Age Group Total Economically Active Activity Rate Total Table 5.5: Activity Rates by district for Age 15+ Years, Manicaland Province, Zimbabwe 2012 Census District Persons 15 Years and Above Economically Active Persons Activity Rate Buhera Chimanimani Chipinge Rural Makoni Mutare Rural Mutasa Nyanga Mutare Urban Rusape Chipinge Urban
90 Manicaland Province Chapter 5 Activity and Labour Force Table 5.6: Percent Distribution of Economically Active Persons by Activity and district, by Acti vity and district, Manicaland Province Zimbabwe Census 2012 (a) Activity Buhera Chimanimani Chipinge Rural Makoni Mutare Rural Mutasa Nyanga Mutare Urban Rusape Chipinge Urban Total Percent Total Persons Paid Employee Employer Own account worker Unpaid family worker Looking for work Total Table 5.6: Percent Distribution of Economically Active Persons by Activity and district, by Acti vity and district, Manicaland Province, Zimbabwe Census 2012 (b) Activity Buhera Chimanimani Chipinge Rural Makoni Mutare Rural Mutasa Nyanga Mutare Urban Rusape Chipinge Urban Total Paid Employee Employer Own account worker Unpaid family worker Looking for work Total Percent Total Persons
91 Manicaland Province Chapter 5 Activity and Labour Force Table 5.7: Percent Distribution of Economically Active Persons by Sex and District, Manicaland Province, Zimbabwe 2012 Census Males Activity Buhera Chimanimani Chipinge Rural Makoni Mutare Rural Mutasa Nyanga Mutare Urban Rusape Chipinge Urban Total Percent Total Persons Paid Employee Employer Own account worker Unpaid family worker Looking for work Total Table 5.7: Percent Distribution of Economically Active Persons by Sex and District, Manicaland Province, Zimbabwe 2012 Census Males Activity Buhera Chimanimani Chipinge Rural Makoni Mutare Rural Mutasa Nyanga Mutare Urban Rusape Chipinge Urban Total Percent Paid Employee Employer Own account worker Unpaid family worker Looking for work Total Total Persons
92 Manicaland Province Chapter 5 Activity and Labour Force Females Activity Buhera Chimanimani Chipinge Rural Makoni Mutare Rural Mutasa Nyanga Mutare Urban Rusape Chipinge Urban Total Percent Paid Employee Employer Own account worker Unpaid family worker Looking for work Total Percent Total Persons Table 5.8: Percent Distribution of Economically Active Persons by Age Group and District, Manicaland Province, Zimbabwe 2012 Census Age Group Buhera Chimanimani Chipinge Rural Makoni Mutare Rural Mutasa Nyanga Mutare Urban Rusape Chipinge Urban Total Persons Total
93 Manicaland Province Chapter 5 Activity and Labour Force Buhera Age Group Persons 15 Years and Above Economically Active Persons Activity Rate Total Chimanimani Age Group Persons 15 Years and Above Economically Active Persons Activity Rate Total
94 Manicaland Province Chapter 5 Activity and Labour Force Chipinge Rural Age Group Persons 15 Years and Above Economically Active Persons Activity Rate Total Makoni Persons 15 Years and Above Economically Active Persons Activity Rate Age Group Total
95 Manicaland Province Chapter 5 Activity and Labour Force Mutare Rural Age Group Persons 15 Years and Above Economically Active Persons Activity Rate Total Mutasa Age Group Persons 15 Years and Above Economically Active Persons Activity Rate Total
96 Manicaland Province Chapter 5 Activity and Labour Force Nyanga Persons 15 Years and Above Economically Active Persons Activity Rate Age Group Total Mutare Urban Persons 15 Years and Above Economically Active Persons Activity Rate Age Group Total
97 Manicaland Province Chapter 5 Activity and Labour Force Rusape Persons 15 Years and Above Economically Active Persons Activity Rate Age Group Total Chipinge Urban Age Group Persons 15 Years and Above Economically Active Persons Activity Rate Total
98 Manicaland Province Chapter 5 Activity and Labour Force Table 5.10: Percent Distribution of Persons by Employment Status and Sex, Manicaland Province, Zimbabwe 2012 Census Employment Status Males Females Total Total Persons Employed Unemployed All Employment Status Males Females Total Employed Unemployed Total Percent Total Persons Table 5.11: Percent Distribution of Persons with a Disability by Employment Status and Sex, Manicaland Province, Zimbabwe 2012 Census Employment Status Males Females Total Total Persons Employed Unemployed All Employment Status Males Females Total Employed Unemployed Total Percent Total Persons
99 Manicaland Province Chapter 5 Activity and Labour Force Table 5.12: Unemployment by district, Manicaland Province, Zimbabwe 2012 Census Province Economically Active Persons Unemployed Persons Unemployment Rate Buhera Chimanimani Chipinge Rural Makoni Mutare Rural Mutasa Nyanga Mutare Urban Rusape Chipinge Urban Total Table 5.13: Percent Distribution of Children (10-14 years) by Employment Status and Sex, Manicaland Province, Zimbabwe 2012 Census Activity Males Females Total Percent Total Persons Paid Employee Employer Own account worker Unpaid family worker Looking for work Total Activity Males Females Total Paid Employee Employer Own account worker Unpaid family worker Looking for work Total Persons Total Persons
100 Manicaland Province Chapter 5 Activity and Labour Force Table 5.14: Percent Distribution of Economically Inactive Population by Activity and Sex, Manicaland Province, Zimbabwe 2012 Census (a) Activity Males Females Total Total Persons Student Homemaker Retired/Sick/Too Old Other Total (b) Activity Males Females Total Percent Student Homemaker Retired/Sick/Too Old Other Total Percent Total Persons (c) Disability Activity Males Females Total Persons Percent Student Homemaker Retired/Sick/Too Old Other Total
101 Manicaland Province Chapter 5 Activity and Labour Force Table 5.15: Percent Distribution of Economically Inactive Population by Activity and Sex, Manicaland Province, Zimbabwe 2012 Census Males Age Group Student Homemaker Retired/Sick/Too Old Other Total Total Percent Total Persons Females Age Group Student Homemaker Retired/Sick/Too Old Other Total Total Percent Total Persons
102 Manicaland Province Chapter 5 Activity and Labour Force Total Age Group Age Group Student Homemaker Retired/Sick/Too Old Other Total Total Percent Total Persons Table 5.16: Percent Distribution of Economically Inactive Population by Activity and Sector, Manicaland Province, Zimbabwe 2012 Census Activity Rural Urban Total Percent Total Persons Student Homemaker Retired/Sick/Too Old Other Total Activity Rural Urban Total Student Homemaker Retired/Sick/Too Old Other Total Percent Total Persons
103 Manicaland Province Chapter 5 Activity and Labour Force 103
104 Manicaland Province Chapter 5 Activity and Labour Force Table 5.17: Percent Distribution of Economically Inactive Population by Sex Age Group and District, Manicaland Province, Zimbabwe 2012 Census Males Age Group Buhera Chimanimani Chipinge Rural Makoni Mutare Rural Mutasa Nyanga Mutare Urban Rusape Chipinge Urban Total Number Total
105 Manicaland Province Chapter 5 Activity and Labour Force Females Age Group Buhera Chimanimani Chipinge Rural Makoni Mutare Rural Mutasa Nyanga Mutare Urban Rusape Chipinge Urban Total Number Total
106 Manicaland Province Chapter 5 Activity and Labour Force Total Age Group Buhera Chimanimani Chipinge Rural Makoni Mutare Rural Mutasa Nyanga Mutare Urban Rusape Chipinge Urban Total Number Total
107 Manicaland Province Chapter 5 Activity and Labour Force Table 5.18: Occupational Classification by Sex, Manicaland Province, Zimbabwe 2012 Census Occupational Group Males Females Total Percent Gvt and Snr Officials Directors/ Mgrs & Co Secretaries Natural Sciences Business & Finance Engineers & Technicians Life Sciences Professionals Education Law and Security Information Social Science Artists Religion Machine Operators Administration Clerks & Secretaries Transport Services Agriculture Mining & Construction Mechanics Manufacturing Not known Invalid Code Others Total
108 Manicaland Province Chapter 5 Activity and Labour Force Table 5.19: Occupational Classification by district, Manicaland Provi nce, Zimbabwe 2012 Census Occupational Group Buhera Chimanimani Chipinge Rural Makoni Mutare Rural Mutasa Nyanga 108 Mutare Urban Rusape Chipinge Urban Gvt and Snr Officials Directors/ Mgrs & Co Secretaries Natural Sciences Business & Finance Engineers & Technicians Life Sciences Professionals Education Law and Security Information Social Science Artists Religion Machine Operators Administration Clerks & Secretaries Transport Services Agriculture Mining & Construction Mechanics Manufacturing Others Not known Invalid Code Total Percent Total Persons Total
109 Manicaland Province Chapter 5 Activity and Labour Force Table 5.20: Communal Farmers as a Percentage of Employed Persons by District, Manicaland Province, Zimbabwe 2012 Census Province Employed Persons Communal Farmer Total Number Buhera Chimanimani Chipinge Rural Makoni Mutare Rural Mutasa Nyanga Mutare Urban Rusape Chipinge Urban Total
110 Manicaland Province Chapter 5 Activity and Labour Force Table 5.21: Persons With A Disability by Occupational Classification and Sex, Manicaland Province, Zimbabwe 2012 Census Activity Males Females Total Percent Others Gvt and Snr Officials Directors/ Mgrs & Co Secretaries Natural Sciences Business & Finance Engineers & Technicians Life Sciences Professionals Education Law and Security Information Social Science Artists Religion Machine Operators Administration Clerks & Secretaries Transport Services Agriculture Mining & Construction Mechanics Manufacturing Not known Invalid Code Total
111 Manicaland Province Chapter 6 Fertility Chapter 6: Fertility Introduction Fertility is one of the three components of population change, the others being mortality and migration. the measurement of fertility can be approached in two ways. The first is to view fertility as a period event, while the second would view it as a cohort event. There is a clear distinction between these two approaches, conceptually and in terms of data required to fulfil the measurements. This chapter is concerned with the measurement of period fertility as it is the most commonly used approach in studies of population. Period fertility measures the level of fertility during a specified period of time, usually, a year. Indicators of fertility are based on either registered or reported births in a specified period of time and the population relating to the same time period. In Zimbabwe, the registration system is not complete, and therefore information on registered births is deficient. Similarly, births are usually underreported in surveys and censuses, partly because respondents make mistakes about the reference period. The vague expression "during the last 12 months" might not be interpreted properly as exactly 12 months prior to the date of interview. However, estimates of fertility based on the births in the last 12 months provide the true pattern, but may underestimate the level of fertility. On the other hand, estimates based on the average number of children ever born to women provide lifetime fertility levels without a time reference. Estimates on fertility have been made using direct methods. Information on live births in the last 12 months was obtained from all women age 15 to 49 years, irrespective of their marital status. Based on this information on births in the last 12 months and the total population, the crude birth rate was calculated. The information on children ever born referred only to the woman's biological children. To avoid bias from misreporting, this information was collected in three parts: those children currently living with the mother, those living elsewhere, and those who had died. Four measures of fertility will be discussed in this chapter. These will be in order of their complexity, i.e. in terms of the data required to calculate them. The four measures are Crude Birth Rate (CBR); General Fertility Rate (GFR); Age-Specific Fertility Rate (ASFR) and Total Fertility Rate (TFR). The reference period for these estimates was September, 2011 to August, Crude Birth Rates (CBR) This refers to the number of births per 1000 population in a given period which is usually a year. It is obtained by dividing the number of births occurring in the year by the total population, multiplied by The CBR for Manicaland Province, estimated using the direct method, was 33 births per one thousand populations, see Table 6.1. Fertility levels at provincial level mask some important spatial, and at times, temporal variations in fertility within the province itself or among districts. The level of fertility displayed at the provincial level is not uniform at lower levels as is indicated in Table The CBRs ranged from 31 for Makoni to 36 for Mutare Rural, Chipinge Urban and Rusape. The crude birth rate is affected by the sex and age structure of the population. For example, it is not every member of the population who is at the risk of child bearing. As a result, direct comparisons between populations with different sex-age structures can lead to wrong conclusions. Therefore, to overcome this limitation of lack of comparability, it is necessary to look beyond the crude measures of fertility to more specific measures. 111
112 Manicaland Province Chapter 6 Fertility General Fertility Rate (GFR) The General Fertility Rate (GFR) is the simplest fertility measure that tries to relate the births to the population which is at risk of giving birth. It is defined as the number of births in a year per women in childbearing ages, usually 15 to 49 years. As shown in Table 6.1, the GFR for Manicaland Province was 142 births per women of reproductive ages. The GFR fell between 112 for Mutare Urban and 161 for Mutare Rural. This measure also has its limitations because the control for the age structure is only differences in the age structure between populations within the reproductive age ranges. Age-Specific Fertility Rate (ASFR) Age-Specific Fertility Rate (ASFR) is the average number of live births in the last 12 months per woman in the 5 year age groups in the reproductive age range 15 to 49 years. It is obtained by dividing the number of births to women in a particular age group by the total number of women in the same age group. It provides the age pattern of fertility for the women in their child bearing ages. As shown in Figure 6.1 and Appendix Table partial as there may be substantial 112 A6.1, childbearing peaks in the age group
113 Manicaland Province Chapter 6 Fertility years. The last reproductive age group (45-49 years) exhibited the least contribution as expected because there were Appendix Tables A6.2 to A6.5 show the ASFRs by age-group for each of the 10 districts in the province. The ASFRs peak at the years age groups in all the ten districts. This is an indication that women were having their children at relatively young ages. Although the ASFRs provide the best indicators of fertility, they are difficult to comprehend as they have to be presented in a set of seven, i.e. one for each age group, from to years. Comparisons of ASFRs between or among relatively fewer births at the extreme ends of the reproductive age ranges. make. Therefore, a single indicator summarising the fertility experience for a particular population is necessary. The total fertility rate is the most appropriate indicator. Total Fertility Rate (TFR) The Total Fertility Rate (TFR) represents the average number of children a group of women would have by the end of their reproductive years if they had children according to a set of age specific fertility population groups are even more difficult to rates pertaining to a particular period. The 113
114 Manicaland Province Chapter 6 Fertility rate is totally free of age and sex biases and therefore of great use in comparative analysis. The rate has a major limitation in that it assumes that women of different age groups undergo similar fertility experiences throughout their reproductive periods. The TFR for the province was about 4.3. From Table 6. 1, it can be observed that Buhera had the highest TFR of 4.9 while Mutare Urban and Rusape had a TFR of 3.3. Fertility Differentials Estimates of fertility by the level of education of mothers and by marital status are shown in Tables 6.2 and 6.3. Figure 6.2 shows that there seemed to be a negative relationship between fertility and education level of mothers. The level of fertility declined with increasing level of education. The TFR was 4.9 children per woman for women with primary education and 4.1 for those with at least secondary education. The number of women with no education is so small that it does not allow for meaningful interpretation. However, the TFR for women with no education was 3.8. It has been shown in many studies that education in women gives them, among other things, a new vision and normative orientation which will result in better health care, better employment opportunities outside the home and better knowledge of With regard to marital status, the married women category had the highest TFR of 6.0 children per woman. It should be noted that the TFR for the married category is high and needs further analysis. The never married group experienced the lowest fertility with a TFR of 0.9 children per woman. Figure 6.3 illustrates the different TFRs diagrammatically. The higher TFR among the married women may be attributed to them being at a higher risk of giving birth than women in the other categories. In Table 6.4, the distribution of women by age at first live birth is presented. The median ages at first live birth were about 20 years for all age groups. These ages are relatively low, and therefore exposed the women to long periods of childbearing. This is illustrated in Figure 6.4. Appendix Tables A6.5 to A6.7 show ASFRs by age group of women and by their marital status, by rural and urban areas and by level of education respectively for the province. The median age at first live birth by rural / urban residence shows that the age at first live birth for rural women was slightly lower than for urban women (20 compared with 21 years) see Tables 6.5 a and b. Table 6.6 presents the distribution of women by age at first live birth and by level of education. It can be observed that the and access to family planning methods. These, in turn, may produce a depressing effect on fertility. median age varied with level of education of the mother. A high proportion of women with at least secondary education had their 114
115 Manicaland Province Chapter 6 Fertility first live birth between years. About 50 percent of the women who had completed no education level and those with primary education had their first live birth between 19 and 21years. Figures 6.5 illustrates the observations diagrammatically. Conclusion This chapter shows that a woman in Manicaland Province would have had an average of 4.3 children by the end of her reproductive years if she had children according to a set of age specific fertility rates pertaining to the period August 2011 to July The data on fertility also show that there seemed to have been a negative relationship between fertility and education level of the mother. 115
116 Manicaland Province Chapter 6 Fertility Table 6.1: Fertility Rates by District, Manicaland Province, Zimbabwe 2012 Census District CBR GFR TFR Buhera Chimanimani Chipinge Rural Makoni Mutare Rural Mutasa Nyanga Mutare Urban Rusape Chipinge Urban Total Table 6.2: Total Fertility Rate by Level of Education of Mothers, Manicaland Province, Zimbabwe 2012 Census Level of Education TFR No Education 3.8 Primary 4.9 Secondary 4.1 Tertiary 3.2 Not Known 3.9 Total 4.3 Table 6.3: Total Fertility Rate by Marital Status, Manicaland Province, Zimbabwe 2012 Census Marital Status TFR Never Married 0.9 Married 6.0 Divorced/separated 3.5 Widowed 2.6 Not Stated 2.6 Total
117 Manicaland Province Chapter 6 Fertility Table 6.4: Percent Distribution of Women by Current Age, by Age at First Live Birth, Manicaland Province, Zimbabwe 2012 Census Current Age of Women Age at First Live Birth Total Number Median
118 Manicaland Province Chapter 6 Fertility Table 6.5: Percent Distribution of Women by Current Age, by Age at First Live Birth for and Urban, Manicaland Province, Zimbabwe 2012 Census Rural (a) Rural Age at First Live Birth Current Age of Women Total Number Median (b) Urban Age at First Live Birth Current Age Of Women Total Number Median
119 Manicaland Province Chapter 6 Fertility Table 6.6: Percent Distribution of Women by Age at First Live Birth, Current Age and Level of Education, Manicaland Province, Zimbabwe 2012 Census (a) No Education Current Age of Women Age at First Live Birth Total Number Median (b) Primary Current Age of Women Age at First Live Birth Total Number Median (c) Secondary and above Current Age of Women Age at First Live Birth Total Number Median
120 Manicaland Province Chapter 7 Mortality and Orphanhood Chapter 7: Mortality and Orphanhood Introduction Mortality plays an important role in changing the rate of population growth in developing countries although the level of fertility is expected to be a more decisive factor in the growth of a population. Mortality level is one of the main health indicators which also contributes to the assessment of the quality of life. Ideally, indicators on mortality are computed directly from data on reported or registered deaths relating to a particular period and the total population exposed to the risk of dying during that same period. However, in the case of Zimbabwe, data on deaths based on registration are not complete. At the same time, data on deaths reported by respondents during surveys or censuses are also incomplete, partly because some respondents are reluctant to discuss details of their deceased relatives. In the absence of such information on deaths, methods have been developed for the estimation of mortality using an indirect approach. These methods utilise information on children ever born and those surviving for mothers in their child bearing ages and the survival of parents. The latter provides the basis for estimating levels of adult mortality, while the former leads to the estimation of levels of infant and child mortality. In this chapter, indicators of infant and maternal mortality are presented. These have been estimated using the direct approach. Direct methods were used to calculate Crude Death and Maternal Mortality Ratios. Indicators showing differentials by level of education of mothers and by urban and rural areas are also included. Appendix Tables A7.1 and A7.2 show the number of children surviving by age-group of mother. Infant Mortality In every population, there are pronounced age differentials in the level of mortality. The typical pattern is high infant mortality, i.e. deaths in the first year of life, declining to the lowest level in age group 5-9 years or years and then increasing with age. Deaths during the first year of life constitute the largest proportion of the total deaths. The level of mortality for this age group is measured by infant mortality rate IMR which is the number of children dying before they celebrate their first birthday out of born alive. The estimated infant mortality rates for the province are presented in Table 7.1a and b. Males experienced higher mortality than females. The infant mortality rate derived from the question on infant deaths in the last 12 months was 69. Using information on survival of last live birth, the infant mortality rate was 69. Further analysis of levels of mortality will be done after thorough analysis of quality of data. Child mortality estimates were difficult to obtain because of quality of data. Estimates of life expectancy will be done during in depth analysis of mortality data. Mortality Differences among Districts Table 7.1 shows that Mutasa district had the highest infant mortality rate of 87 deaths per live births while Mutare Urban had the lowest of 51 deaths per live births. In all districts, male mortality was higher than female mortality Differentials by Education of Mother It has been observed that the level of education of mothers in a population has an impact on the level of infant mortality of that particular population. In Table 7.2, the estimates were derived from information on the survival status of the last live birth. It can be observed that the level of mortality does not allow for any meaningful interpretation. It is generally agreed that as the education of the mother increases, there 120
121 Manicaland Province Chapter 7 Mortality and Orphanhood is also an increased awareness in terms of hygiene, improved diet, prevention of disease through immunisation, etc, which contributes to the reduction of deaths. Crude Death Rates The Crude Death Rate (CDR) is the number of deaths per population in a given period, usually a year. Although it is one of the most commonly used indices of mortality, it is affected by the age-sex structure of the population and is therefore not useful for comparative purposes. The Crude Death Rates presented below were obtained using the direct method of dividing the number of deaths in the last twelve months (as reported) by the total population. Usually, reported deaths will underestimate the true levels. Indirect methods could have been used but the population showed that it was not stable which made it impossible to use the method. The estimates of the CDRs for the province and its districts are presented in Table 7.3. The overall CDR for the province was about 10 deaths per population. The CDR were between 8 for Mutare Urban and 13 for Makoni Maternal Mortality Maternal mortality relates to deaths which occur to females in child-bearing ages and are caused by complications during the time of pregnancy and childbirth, as well as deaths occurring within 42 days of a pregnancy termination, if such deaths were birth related. In Zimbabwe, data on maternal deaths are based on hospital records and vital registration which are incomplete. At the same time, because of the rareness of these events in the general population, they are not adequately captured in sample surveys. The population census provided a good opportunity of collecting data on these events. The nature of census taking was such that it was not possible to collect detailed data relating to the events. The question in the census had to be made as simple and clear as possible. If a death to a female age years had occurred in the household within the last 12 months, the respondent was asked whether, other than dying from an accident, the deceased had died while pregnant, during childbirth or within one month after childbirth. The data collected in this manner would not strictly reflect the true maternal deaths, but they will be quite close to the actual figure and can therefore be used to estimate the levels of maternal mortality in the country. In Table 7.4, the estimates of maternal mortality ratios for the province by district are presented. A maternal mortality ratio is the number of deaths from maternal causes per live births, i.e. the risk of dying from pregnancy related causes. It should be noted that maternal deaths were reported by households and not by place of occurrence. The overall maternal mortality ratio for the province was 505. This rate was lowest in Mutare Urban (317) and highest in Chipinge Urban (761). It should be recalled that both the numerator (reported maternal deaths) and the denominator (reported births) can be subject to response errors. However, the figure observed should provide a reasonable proxy for the level of maternal mortality in the province. Orphanhood Table 7.5 shows percent distribution of orphans by type of orphanhood,. Orphans were those children aged 17 years and below whose mothers were dead but fathers were alive or whose fathers were dead and mothers were alive or both parents were dead. Sixty percent of the orphans had their father dead, 17 had their mother dead whilst 24 percent had both parents dead The proportion in each orphanhood category was the same for both sexes Conclusion Although the 2012 Population Census asked direct questions on deaths in an attempt to estimate levels of mortality directly, indirect methods should be used to come up with some of the mortality indicators for reasons put forward in the introduction. However, responses to direct questions are vital in the assessment of data quality and have been 121
122 Manicaland Province Chapter 7 Mortality and Orphanhood used to calculate crude death rate infant mortality rate and maternal mortality ratio Indicators of mortality showed that there has been an increase in infant mortality and a decrease in maternal mortality between 2002 and
123 Manicaland Province Chapter 7 Mortality and Orphanhood Table 7.1 Infant Mortality Rates by Sex and District, Manicaland Province, Zimbabwe 2012 Census (a) District Males Females Total Buhera Chimanimani Chipinge Rural Makoni Mutare Rural Mutasa Nyanga Mutare Urban Rusape Chipinge Urban Total Table 7.1(b) Infant Mortality Rates by Sex and urban/rural, Manicaland Province, Zimbabwe 2012 Census Sector Males Females Total Rural Urban Total Table 7.2: Infant Mortality Rates by Level of Education of Mother, Manicaland Province, Zimbabwe 2012 Census Level of Education IMR No Education 9.3 Primary 45.8 Secondary and above 35.6 Total
124 Manicaland Province Chapter 7 Mortality and Orphanhood Table 7.3: Crude Death Rates by District, Manicaland Province, Zimbabwe 2012 Census District CDR Buhera 9.6 Chimanimani 9.7 Chipinge Rural 9.6 Makoni 12.7 Mutare Rural 11.7 Mutasa 11.4 Nyanga 9.5 Mutare Urban 7.8 Rusape 7.9 Chipinge Urban 8.8 Total 10.3 Table 7.4: Maternal Mortality Ratio (MMR) by District, Manicaland Province, Zimbabwe 2012 Census District MMR Buhera 505 Chimanimani 413 Chipinge Rural 585 Makoni 741 Mutare Rural 495 Mutasa 324 Nyanga 408 Mutare Urban 317 Rusape 368 Chipinge Urban 761 Total 505 Table 7.5: Percent Distribution of Orphans by Type of Orphanhood Manicaland Province, Zimbabwe 2012 Census Type of Orphan Males Females Total Father Dead Mother Alive Father Alive Mother Dead Both Parents Dead Total
125 Manicaland Province Chapter 8 Housing Characteristics Chapter 8: Housing Characteristics Introduction This chapter describes the housing characteristics in Manicaland province. Information on housing characteristics collected from private households was on tenure status, type of dwelling unit, access to electricity, main source of water for drinking and cooking and distance to source, toilet facilities and main source of energy for cooking. Such housing characteristics provide indicators to assess the living conditions of the population. Tenure Status Tenure status refers to the arrangement under which the household occupies its living quarters and the nature of its right to be there. The distribution of private households by tenure status can be observed in Table 8.1. Owners/Purchasers accounted for about 73 percent of the households while households in tied accommodation were 16 percent. Ten percent were lodgers and 2 percent tenants. In all districts in the province owners/purchasers constituted the largest proportion except in Mutare Urban, Rusape and Chipinge Urban where lodgers accounted for between 47 percent and 52 percent in each. Households in tied accommodation constituted the second largest proportion in all districts except Mutare Urban, Rusape and Chipinge Urban. In these urban the second largest proportion was in the owner/ purchaser category. Type of Dwelling Unit Type of dwelling unit refers to the kind of housing occupied by the household. Traditional dwelling units are found in the old style family settlement in which a number of buildings are made of pole and dagga/bricks with thatched roofs. A mixed dwelling unit is found in old style family settlement where one or more of the buildings in a cluster are built of materials more modern than pole and dagga/bricks and thatch. A detached dwelling unit is a structurally separate dwelling unit which is built of materials other than pole and dagga. Access to the street is by means of a path, or steps, directly on to the pavement, not shared by other dwelling units. Semidetached dwelling units consist of one of two dwelling units with a common wall between them. Flat/town-house is one of three or more dwelling units in a row divided by common walls, with their gardens separated by fences, hedges or walls and whose separate accesses to the street meet the conditions as given for the detached house. Residential buildings with several floors are also included in this category. The distribution of households by type of dwelling unit in Table 8.2 indicates that about 29 percent of the households in the province lived in modern type of dwelling units. A high percentage (67 percent) occupied dwelling units which were either traditional or mixed. With the exception of Mutare Urban, Rusape and Chipinge Urban the proportion of households in modern type of dwelling units ranged from 9 percent in Buhera to 33 percent in Chimanimani. Dwelling Units with Electricity Table 8.3 shows that 60 percent of the households in the province had dwelling units without electricity. The proportion of households occupying dwelling units with electricity were 17 percent in Chipinge Rural and 31 percent in Chimanimani. Eighty-eight and 80 percent of the households in Mutare Urban and Rusape respectively lived in dwelling units with electricity. Main Source of Water for Drinking and Cooking Table 8.4 shows that 9 percent of all the households had piped water inside their dwelling units. A further 13 percent had
126 Manicaland Province Chapter 8 Housing Characteristics piped water outside their dwelling units. About 46 percent of the households fetched their water from boreholes and protected wells, 6 percent from communal taps, and about 22 percent from unprotected wells and rivers/streams and dams. Table 8.5a shows that 28 percent of the households had their main source of water on their premises, while 35 and 24 percent respectively had their main source of water within 500 and between 500 and 1000 metres of the facility and 10 percent had their main source of water from a distance of more than 1000 metres. For those using piped water outside their dwelling units, 78 percent had this on their premises while 22 percent had to cover a distance of less than 500 metres to fetch the water. In the case of communal tap users, about 15 percent had this facility on their premises, 70 percent within 500 metres, 2 percent between 500 and 1000 metres and about less than 1 percent covered a distance of more than 1000 metres. A proxy of the proportion of households using what could be termed safe water can be obtained. Without applying any rigorous health or hygienic standards one could say that households using piped water, communal taps, protected boreholes and wells have access to safe water. Ninety- Six percent of the households in Rusape had access to safe water while 97 percent of the households in Mutare Urban District had access to safe water. Mutasa had 65 percent, Chipinge Rural 66 percent and Makoni 71 see Tables 8.5b-j. Table 8.5b presents the distribution of households by main source of water for drinking and cooking as well as the distance from the dwelling unit to the source for Buhera district. Twenty percent of the households had their main source of water on premises, 36 percent fetched their water from within a distance of 500 metres and 29 percent had to cover a distance of between 500 and 1000 metres and a small proportion (11 percent) covered a distance of more than 1000 metres. Information on main source of water for drinking and cooking in Chimanimani district can be observed in Table 8.5c. Twenty-four percent of the households in this district had water on premises, 42 percent had their water source located within 500 metres and 22 percent had to cover a distance of 500 metres or more. The situation for Chipinge Rural with regard to accessibility of water can be observed in Table 8.5d. Eleven percent of the households had water on premises and about 33 percent fetched their water from within a distance of less than 500 metres while a large proportion (32 percent) had this facility more than 500 metres from the dwelling unit. In Makoni 23 percent of households had their main source of water on premises. Close to 40 percent of households covered a distance of 500 metres or more, see Table 8.5e.Nineteen percent of households in Mutare Rural had their main source of water on premises and 40 percent fetched their water from within a distance of less than 500 metres, 28 percent covered a distance of metres or more while 9 percent had their water source located 1000 metres or more, see Table 8.5f. It can be observed from Table 8.5g that in Mutasa district 17 percent of the household had water on premises, 50 percent had their water source located within 500 metres, 24 percent had to cover a distance of metres and 5 percent had their water source located 1000 metres or more. In Nyanga 20 percent had their main source of water on premises. Thirty percent covered a distance of metres, see Table 8.5h. The situation for Mutare Urban and Rusape with regard to accessibility of water can be observed in Tables 8.5h and i 82 percent Mutare Urban and 94 percent for Rusape of the households had water on premises or fetched water from within a distance of less than 500 metres in both districts.
127 Manicaland Province Chapter 8 Housing Characteristics Toilet Facilities Information on toilet facilities is presented in Table 8.6. Fifteen percent of the households in the province mostly used flush toilets. The proportion of households which mostly used blair toilets was 27 percent while that which mostly used pit latrines was 29 percent. There was a significant proportion (20 percent) of households which was not using any type of toilet facility at all. The largest proportions of households which mostly used flush toilets were in Rusape and Mutare Urban, 85 and 86 percent respectively. The proportion of households without any toilet facility ranged from less than one percent each in Mutare Urban and Chipinge Urban to 50 percent in Buhera. Source of Energy Mostly Used for Cooking Table 8.7 shows that 81 percent of the households in the province used wood as the main source of fuel for cooking. The proportion of households which used paraffin was less than one percent, while that which used electricity was 15 percent. A very small proportion of households, less than one percent, used either gas, coal or some other form of fuel for cooking. Generally, all districts had high proportions of households over 89 percent using wood for cooking with the exception of Chipinge Urban, Rusape and Mutare. Seventy-three percent each of households in Mutare Urban and Rusape used electricity for cooking. Conclusion This chapter shows that most households in the province lived in traditional type of accommodation, had access to clean water, used wood as their main source of energy for cooking and had access to blair toilets.
128 Manicaland Province Chapter 8 Housing Characteristics Table 8.1: Percent Distribution of Households by Tenure Status and District: Manicaland Province, Zimbabwe 2002 Census Manicaland Owner/Purchaser Tenant Lodger Tied accommodation Other Missing Total Number Buhera Chimanimani Chipinge Makoni Mutare Rural Mutasa Nyanga Rural Mutare Rusape Chipinge Total Table 8.2: Percent Distribution of Households by District and Type of Dwelling Unit: Manicaland Province, Zimbabwe 2012 Census District Traditional Mixed Detached Semi-detached Flat/townhouse Shack Other Missing Total Number Buhera Chimanimani Chipinge Makoni Mutare Rural Mutasa Nyanga Rural Mutare Rusape Chipinge Total
129 Manicaland Province Chapter 8 Housing Characteristics Table 8.3: Percent Distribution of Households in Dwelling Units With Electricity by District, Manicaland Province, Zimbabwe 2012 Census District Yes No Missing Total Number Buhera Chimanimani Chipinge Makoni Mutare Rural Mutasa Nyanga Rural Mutare Rusape Chipinge Total
130 Manicaland Province Chapter 8 Housing Characteristics Table 8.4: Percent Distribution of Households by Main Source of Water for Drinking and cooking and by Distan ce (metres) to the source, Harare Province, Zimbabwe 2012 Census Source of Water On premises Less than 500m 500m to 1km More than 1km Missing Total Piped water inside house Piped water outside house Communal tape Well/borehole protected Well - unprotected River/stream/dam Other specify Missing Total Number
131 Manicaland Province Chapter 8 Housing Characteristics Table 8.5: Percent Distribution of Households by Main Source of Water for Drinking and Cooking and Distance (metres) to the Source, Manicaland Province, Zimbabwe 2012 Census (a) Water Source On premises Less than 500m 500m to 1km More than 1km Missing Total Number Piped water inside house Piped water outside house Communal tape Well/borehole protected Well - unprotected River/stream/dam Other specify Missing Total
132 Manicaland Province Chapter 8 Housing Characteristics Table 8.5b: Percent Distribution of Households by Main Source of Water for Drinking and Cooking and by Distance (metres) to the Source, Manicaland Province Zimbabwe 2012 Census Manicaland (a) Buhera Source of water On premises Less than 500m 500m to 1km More than 1km Missing Total Number Piped water inside house Piped water outside house Communal tape Well/borehole protected Well - unprotected River/stream/dam Other specify Missing Total
133 Manicaland Province Chapter 8 Housing Characteristics (b) Chimanimani On premises Less than 500m 500m to 1km More than 1km Missing Total Number Source of water Piped water inside house Piped water outside house Communal tape Well/borehole protected Well - unprotected River/stream/dam Other specify Missing Total
134 Manicaland Province Chapter 8 Housing Characteristics (c) Chipinge Less than 500m More than 1km Missing Total Number Source of water On premises 500m to 1km Piped water inside house Piped water outside house Communal tape Well/borehole protected Well - unprotected River/stream/dam Other specify Missing Total
135 Manicaland Province Chapter 8 Housing Characteristics (d)makoni Less than 500m More than 1km Missing Total Number Source of water On premises 500m to 1km Piped water inside house Piped water outside house Communal tape Well/borehole protected Well - unprotected River/stream/dam Other specify Missing Total
136 Manicaland Province Chapter 8 Housing Characteristics (e) Mutare Rural Less than 500m More than 1km Missing Total Number Source of water On premises 500m to 1km Piped water inside house Piped water outside house Communal tape Well/borehole protected Well - unprotected River/stream/dam Other specify Missing Total
137 Manicaland Province Chapter 8 Housing Characteristics (f) Mutasa Less than 500m More than 1km Missing Total Number Source of water On premises 500m to 1km Piped water inside house Piped water outside house Communal tape Well/borehole protected Well - unprotected River/stream/dam Other specify Missing Total
138 Manicaland Province Chapter 8 Housing Characteristics (g) Nyanga Rural Less than 500m More than 1km Missing Total Number Source of water On premises 500m to 1km Piped water inside house Piped water outside house Communal tape Well/borehole protected Well - unprotected River/stream/dam Other specify Missing Total
139 Manicaland Province Chapter 8 Housing Characteristics (h) Mutare Less than 500m More than 1km Missing Total Number Source of water On premises 500m to 1km Piped water inside house Piped water outside house * Communal tape Well/borehole protected Well - unprotected River/stream/dam Other specify Missing Total
140 Manicaland Province Chapter 8 Housing Characteristics (i) Rusape On premises Less than 500m 500m to 1km More than 1km Missing Total Number Source of water Piped water inside house Piped water outside house * * Communal tape Well/borehole protected Well - unprotected River/stream/dam Other specify Missing Total *
141 Manicaland Province Chapter 8 Housing Characteristics (j) Chipinge On premises Less than 500m 500m to 1km More than 1km Missing Total Number Source of water Piped water inside house Piped water outside house Communal tape Well/borehole protected Well - unprotected River/stream/dam Other specify Missing Total
142 Manicaland Province Chapter 8 Housing Characteristics Total On premises Less than 500m 500m to 1km More than 1km Missing Total Number Source of water Piped water inside house Piped water outside house Communal tape Well/borehole protected Well - unprotected River/stream/dam Other specify Missing Total
143 Manicaland Province Chapter 8 Housing Characteristics Table 8.6: Percent Distribution of Households by District, Type of Toilet Facility Mostly Used by the Household, Manicaland Province, Zimbabwe 2012 Census District Flush Blair Pit Communal None Missing Total Number Buhera Chimanimani Chipinge Makoni Mutare Rural Mutasa Nyanga Rural Mutare Rusape Chipinge Total
144 Manicaland Province Chapter 8 Housing Characteristics Table 8.7: Percent Distribution of Households by District, Source of Energy Mainly Used by Households for Cooking, Manicaland Province, Zimbabwe 2012 Census District Wood Paraffin Electricity Gas Coal Other Missing Total Number Buhera * * * Chimanimani * * * Chipinge * Makoni * * * Mutare Rural * * * Mutasa * * Nyanga Rural * * * Mutare * Rusape * * Chipinge Total * *
145 Manicaland Province Appendices Appendices Table A1.1: Distribution of Population by Sex in Districts and Wards, Total number of Households in Districts and Wards, Manicaland Province, Zimbabwe 2012 Census Buhera Ward Population Households Males Females Total Number Percent Number Percent Number Percent Sex Ratio Number Average Size Ward Ward Ward Ward Ward Ward Ward Ward Ward Ward Ward Ward Ward Ward Ward Ward Ward Ward Ward Ward Ward Ward Ward Ward Ward Ward Ward Ward Ward Ward Ward Ward Ward Total
146 Manicaland Province Appendices Chimanimani Ward Population Households Males Females Total Number Percent Number Percent Number Percent Sex Ratio Number Average Size Ward Ward Ward Ward Ward Ward Ward Ward Ward Ward Ward Ward Ward Ward Ward Ward Ward Ward Ward Ward Ward Ward Ward Total
147 Manicaland Province Appendices Chipinge Rural Ward Population Households Males Females Total Number Percent Number Percent Number Percent Sex Ratio Number Average Size Ward Ward Ward Ward Ward Ward Ward Ward Ward Ward Ward Ward Ward Ward Ward Ward Ward Ward Ward Ward Ward Ward Ward Ward Ward Ward Ward Ward Ward Ward Ward Total
148 Manicaland Province Appendices Makoni Ward Population Households Males Females Total Number Percent Number Percent Number Percent Sex Ratio Number Average Size Ward Ward Ward Ward Ward Ward Ward Ward Ward Ward Ward Ward Ward Ward Ward Ward Ward Ward Ward Ward Ward Ward Ward Ward Ward Ward Ward Ward Ward Ward Ward Ward Ward Ward Ward Ward Ward Ward Ward Total
149 Manicaland Province Appendices Mutare Rural Ward Population Households Males Females Total Number Percent Number Percent Number Percent Sex Ratio Number Average Size Ward Ward Ward Ward Ward Ward Ward Ward Ward Ward Ward Ward Ward Ward Ward Ward Ward Ward Ward Ward Ward Ward Ward Ward Ward Ward Ward Ward Ward Ward Ward Ward Ward Ward Ward Ward Total
150 Manicaland Province Appendices Mutasa Ward Population Households Males Females Total Number Percent Number Percent Number Percent Sex Ratio Number Average Size Ward Ward Ward Ward Ward Ward Ward Ward Ward Ward Ward Ward Ward Ward Ward Ward Ward Ward Ward Ward Ward Ward Ward Ward Ward Ward Ward Ward Ward Ward Ward Total
151 Manicaland Province Appendices Nyanga Ward Population Households Males Females Total Number Percent Number Percent Number Percent Sex Ratio Number Average Size Ward Ward Ward Ward Ward Ward Ward Ward Ward Ward Ward Ward Ward Ward Ward Ward Ward Ward Ward Ward Ward Ward Ward Ward Ward Ward Ward Ward Ward Ward Ward Total
152 Manicaland Province Appendices Mutare Urban Ward Population Households Males Females Total Number Percent Number Percent Number Percent Sex Ratio Number Average Size Ward Ward Ward Ward Ward Ward Ward Ward Ward Ward Ward Ward Ward Ward Ward Ward Ward Ward Ward Total Rusape Ward Population Households Males Females Total Number Percent Number Percent Number Percent Sex Ratio Number Average Size Ward Ward Ward Ward Ward Ward Ward Ward Ward Ward Total
153 Manicaland Province Appendices Chipinge Urban Ward Population Households Males Females Total Number Percent Number Percent Number Percent Sex Ratio Number Average Size Ward Ward Ward Ward Ward Ward Ward Ward Total
154 Manicaland Province Appendices Table A1.2: Population Distribution by District Age Group and Sex, Manicaland Province, Zimbabwe 2012 Census Buhera Age Group Males Number Percent Females Number Percent Total Number Percent NS Under ' ' ' Total Chimanimani Age Group Males Number Percent Females Number Percent Total Number Percent NS Under ' ' ' Total Chipinge Rural Age Males Percent Females Percent Total Percent
155 Manicaland Province Appendices Table A1.2: Population Distribution by District Age Group and Sex, Manicaland Province, Zimbabwe 2012 Census Group Number Number Number NS Under ' ' ' Total Makoni Age Group Males Number Percent Females Number Percent Total Number Percent NS Under ' ' ' Total Mutare Rural Age Group Males Number Percent Females Number Percent Total Number Percent NS
156 Manicaland Province Appendices Table A1.2: Population Distribution by District Age Group and Sex, Manicaland Province, Zimbabwe 2012 Census Under ' ' ' Total Mutasa Age Group Males Number Percent Females Number Percent Total Number Percent NS Under ' ' ' Total Nyanga Age Group Males Number Percent Females Number Percent Total Number Percent NS Under '
157 Manicaland Province Appendices Table A1.2: Population Distribution by District Age Group and Sex, Manicaland Province, Zimbabwe 2012 Census ' ' Total Mutare Urban Age Group Males Number Percent Females Number Percent Total Number Percent NS Under ' ' ' Total Rusape Age Group Males Number Percent Females Number Percent Total Number Percent NS Under ' ' '
158 Manicaland Province Appendices Table A1.2: Population Distribution by District Age Group and Sex, Manicaland Province, Zimbabwe 2012 Census Total Chipinge Urban Age Group Males Number Percent Females Number Percent Total Number Percent NS Under ' ' ' Total Age Group Males Number Percent Females Number Percent Total Number Percent NS Under ' ' '
159 Manicaland Province Appendices Table A1.2: Population Distribution by District Age Group and Sex, Manicaland Province, Zimbabwe 2012 Census Total
160 Manicaland Province Appendices Table A4.1: Distribution of Population Age 3+ by School Attendance by Sex Manicaland Province, Zimbabwe 2012 Census Never been at School District Males Females Total Buhera Chimanimani Chipinge Rural Makoni Mutare Rural Mutasa Nyanga Mutare Urban Rusape Chipinge Urban Total At school District Males Females Total Buhera Chimanimani Chipinge Rural Makoni Mutare Rural Mutasa Nyanga Mutare Urban Rusape Chipinge Urban Total
161 Manicaland Province Appendices Left School District Males Females Total Buhera Chimanimani Chipinge Rural Makoni Mutare Rural Mutasa Nyanga Mutare Urban Rusape Chipinge Urban Total
162 Manicaland Province Appendices Table A4.3: Population Age 3-24 Currently at School by Single Age and Sex Manicaland Province, Zimbabwe Population Census 2012 Age No Education Primary Secondary Tertiary Not known Total Males Females Males Females Males Females Males Females Males Females Males Females Total
163 Manicaland Province Appendices Table A4.4: Population Age 3+ by Age Group, Sex and Highest Level of Education Completed, Manicaland Provin ce, Zimbabwe 2012 Census No Education Primary Secondary Tertiary Not known Total Age Males Females Males Females Males Females Males Females Males Females Males Females NS Total
164 Manicaland Province Appendices Table A6.1 Number of Women, Children Ever Born, Births in the Last 12 Months, Average Parities and ASFR by Age Group, Manicaland Province, Zimbabwe 2012 Census Children Ever Born Fertility Age Group Number of Women Male Female Total Last Live Births Average Parities ASFR Total Table A6.2 Number of Women, Children Ever Born, Births in the Last 12 Months, Average Parities and ASFR by Urban/Rural Residence, Buhera Zimbabwe 2012 Census (a) Buhera Children Ever Born Age of Women Number of Women Male Female Total Total Births Average Parities ASFR Total (b) Chimanimani Children Ever Born Age of Women Number of Women Male Female Total Total Births Average Parities ASFR Total
165 Manicaland Province Appendices Chipinge Children Ever Born Age of Women Number of Women Male Female Total Total Births Average Parities ASFR Total (d) Makoni Children Ever Born Age of Women Number of Women Male Female Total Total Births Average Parities ASFR Total
166 Manicaland Province Appendices (e) Mutare Rural Children Ever Born Age of Women Number of Women Male Female Total Total Births Average Parities ASFR Total (f) Mutasa Children Ever Born Age of Women Number of Women Male Female Total Total Births Average Parities ASFR Total (g) Nyanga Rural Children Ever Born Age of Women Number of Women Male Female Total Total Births Average Parities ASFR Total
167 Manicaland Province Appendices (h) Mutare Children Ever Born Age of Women Number of Women Male Female Total Total Births Average Parities ASFR Total (i) Rusape Children Ever Born Age of Women Number of Women Male Female Total Total Births Average Parities ASFR Total (j) Chipinge Children Ever Born Age of Women Number of Women Male Female Total Total Births Average Parities ASFR Total
168 Manicaland Province Appendices Total Children Ever Born Age of Women Number of Women Male Female Total Total Births Average Parities ASFR Total Table A6. 6: Number of Women, Children Ever Born, Births in the Last 12 Months, Average Parities and ASFR by Urban /Rural Residence, Manicaland Urban Zimbabwe 2012 Census (a) Urban Children Ever Born Age of Women Number of Women Male Female Total Total Births Average Parities ASFR Total (b) Rural Children Ever Born Age of Women Number of Women Male Female Total Total Births Average Parities ASFR Total
169 Manicaland Province Appendices Total Urban/Rural Children Ever Born Age of Women Number of Women Male Female Total Total Births Average Parities ASFR Total Table A6.8: Number of Women, Children Ever Born, Births in the Last 12 Months, Average Parities and ASFR by Level of Education of Moth er, Manicaland Province, Zimbabwe 2012 Census (a) No Education Children Ever Born Age of Women Number of Women Male Female Total Total Births Average Parities ASFR Total (b) Primary Children Ever Born Age of Women Number of Women Male Female Total Total Births Average Parities ASFR Total
170 Manicaland Province Appendices c) Secondary and Above Children Ever Born Age of Women Number of Women Male Female Total Total Births Average Parities ASFR Total (d) Not Known Children Ever Born Age of Women Number of Women Male Female Total Total Births Average Parities ASFR Total Total Education Children Ever Born Age of Women Number of Women Male Female Total Total Births Average Parities ASFR Total
171 Manicaland Province Appendices Table A6.9: Number of Women, Children Ever Born, Births in the Last 12 Months, Average Parities and ASFR by Marital Status, Manicaland Zimbabwe 2012 Census. (a) Marital Status Children Ever Born Age of Women Number of Women Male Female Total Total Births Average Parities ASFR Total (b)married Children Ever Born Age of Women Number of Women Male Female Total Total Births Average Parities ASFR Total (c) Divorced/separated Children Ever Born Age of Women Number of Women Male Female Total Total Births Average Parities ASFR Total (d)widowed Children Ever Born
172 Manicaland Province Appendices Age of Women Number of Women Male Female Total Total Births Average Parities ASFR Total
173 Manicaland Province Appendices Table A7. 1: Number of Children Surviving, by Sex and Age of Mother by District, Manicaland Zimbabwe 2012 Census Children Surviving Age of Women Male Female Total Not Stated Total (a)buhera Children Surviving Age of Mother Male Female Total Total (b) Chimanimani Children Surviving Age of Women Male Female Total Total
174 Manicaland Province Appendices (c)chipinge Children Surviving Age of Women Male Female Total Total (d) Makoni Children Surviving Age of Women Male Female Total Total (e) Mutare Rural Children Surviving Age of Women Male Female Total Total (f) Mutasa Children Surviving Age of Women Male Female Total Total
175 Manicaland Province Appendices (i) Nyanga Rural Children Surviving Age of Women Male Female Total Total (j) Mutare Children Surviving Age of Women Male Female Total Total
176 Manicaland Province Appendices (k) Rusape Children Surviving Age of Women Male Female Total Total (l) Chipinge Children Surviving Age of Women Male Female Total Total
177 Manicaland Province Appendices Table A7. 2:Number of Women, Children Surviving, by Education and Age of Mother, By Sex, Manicaland Zimbabwe 2012 Census (a) No Education Children Surviving Age of Women Male Female Total Total (b) Primary Children Surviving Age of Women Male Female Total Total (c) Secondary Above Children Surviving Age of Women Male Female Total Total
178 Manicaland Province Appendices (d) Not Known Children Surviving Age of Women Male Female Total Total Total Children Surviving Age of Women Male Female Total Total Table A7.3: Number of Orphans by Type of Orphanhood, Manicaland Province, Zimbabwe 2012 Census Type of Orphan Total Father Dead, Mother Alive 503,905 Father Alive, Mother Dead 162,910 Both Parents Dead 226,020 Total 892,835


179 Manicaland Province Appendices
180 Manicaland Province Appendices

181 Manicaland Province Appendices


182 Manicaland Province Appendices

183 Manicaland Province Appendices
East Dunbartonshire Area Profile
 East Dunbartonshire Area Profile May 2014 Contents Executive Summary.. page 3 Introduction.. page 6 Population page 7 Age Structure. page 9 Population Projections page 11 Life Expectancy page 12 Ethnicity.
East Dunbartonshire Area Profile
 East Dunbartonshire Area Profile May 2015 Contents Executive Summary.. page 3 Introduction.. page 6 Population page 7 Age Structure. page 9 Population Estimates..page 11 Population Projections page 13
Devonport-Takapuna Local Board Profile
 Devonport-Takapuna Local Board Profile - Initial results from the Census February 2014 Social and Economic Research Team Research, Investigations and Monitoring Unit Auckland Council Map of Devonport-Takapuna
Chapter 1: The Population of NHS Greater Glasgow and Clyde
 Population Estimate (thousands) Chapter 1: The Population of NHS Greater Glasgow and Clyde Population Trends and Projections National Records of Scotland estimated (NRS SAPE) 1 the 2013 NHS Greater Glasgow
Published by the Stationery Office, Dublin, Ireland. Government Publications Sales Office, Sun Alliance House, Molesworth Street, Dublin 2,
 Published by the Stationery Office, Dublin, Ireland. To be purchased from the: Central Statistics Office, Information Section, Skehard Road, Cork, Government Publications Sales Office, Sun Alliance House,
Demographic Profile 2013 census
 Demographic Profile 2013 census This profile provides basic population and demographic information on the residents of the Hauraki District. Population and demographic information is important for targeting
URBAN DYNAMICS WESTERN CAPE 67
 URBAN DYNAMICS WESTERN CAPE 67 5. SOCIO-ECONOMIC CONTEXT 5.1 Demographic Profile 5.1.1 Introduction The demographic information contained in the synopsis is derived from the supposedly inaccurate 2001
SHETLAND AREA PROFILE
 www.hie.co.uk SHETLAND AREA PROFILE May 2014 SHETLAND AREA PROFILE INTRODUCTION The Shetland area profile uses 2011 Census data and other available data sources to present an up-to-date analysis of its
CHOBE SUB DISTRICT VOL 9.0
 CHOBE SUB DISTRICT VOL 9.0 CHOBE SUB DISTRICT Population and Housing Census 2011 Selected Indicators for s and Localities i Population and Housing Census 2011 [ Selected indicators ] 3 ii 3 Table of Contents
 CONTENTS FOREWORD... 3 1. INTRODUCTION... 4 1.1. General information... 4 1.2. The sample... 4 1.3. Questionnaires... 5 1.4. Changes in the 2007 questionnaire compared to 2004... 5 1.5. Data entry... 6
The Yorke & Mid North (State Govt) Region. Workforce Wizard Region Report
 Region. Workforce Wizard Region Report") The Yorke & Mid North (State Govt) Region Workforce Wizard Region Report Table of Contents Executive Summary 3 Population and Social Characteristics 4 Current Population 4 Age Groups 4 Key Populations
The Yorke & Mid North (State Govt) Region Workforce Wizard Region Report Table of Contents Executive Summary 3 Population and Social Characteristics 4 Current Population 4 Age Groups 4 Key Populations
Inverness, Culloden and Suburbs Settlement Economic Overview
 Strategic planning and research Economic information December 2007 Inverness, Culloden and Suburbs Settlement Economic Overview Summary Between 2001 and 2006, the population of Inverness, Culloden and
CAMPBELTOWN PROFILE May 2014
 www.hie.co.uk CAMPBELTOWN PROFILE May 2014 CAMPBELTOWN PROFILE INTRODUCTION The Campbeltown profile uses 2011 Census data and other available data sources to present an up-to-date analysis of its population
Barbadians. imagine all the people. Barbadians in Boston
 Barbadians imagine all the people Barbadians in Boston imagine all the people is a series of publications produced by the Boston Redevelopment Authority for the Mayor s Office of Immigrant Advancement.
Youth Retention: July Value of post secondary education in regional settings. Prepared for Luminosity Youth Summit.
 Youth Retention: Value of post secondary education in regional settings Prepared for Luminosity Youth Summit July 2013 Prepared by MID NORTH COAST NSW Table of contents Table of contents... 2 Introduction...
Swaziland. HDI values and rank changes in the 2013 Human Development Report
 Human Development Report 2013 The Rise of the South: Human Progress in a Diverse World Explanatory note on 2013 HDR composite indices Swaziland HDI values and rank changes in the 2013 Human Development
DUNOON PROFILE May 2014
 www.hie.co.uk DUNOON PROFILE May 2014 DUNOON PROFILE INTRODUCTION The Dunoon profile uses 2011 Census data and other available data sources to present an up-to-date analysis of its population and labour
PORTREE PROFILE May 2014
 www.hie.co.uk PORTREE PROFILE May 2014 PORTREE PROFILE INTRODUCTION The Portree profile uses 2011 Census data and other available data sources to present an up-to-date analysis of its population and labour
Coordinated Population Forecast for Clackamas County, its Urban Growth Boundaries (UGB), and Area Outside UGBs
, and Area Outside UGBs") Coordinated Population Forecast for Clackamas County, its Urban Growth Boundaries (UGB), and Area Outside UGBs 2017-2067 Prepared by Population Research Center College of Urban and Public Affairs Portland
Coordinated Population Forecast for Clackamas County, its Urban Growth Boundaries (UGB), and Area Outside UGBs 2017-2067 Prepared by Population Research Center College of Urban and Public Affairs Portland
Puerto Ricans in Connecticut, the United States, and Puerto Rico, 2014
 Issued April 2016 Centro DS2016US-8 Puerto Ricans in Connecticut, the United States, and Puerto Rico, 2014 In 2014, Connecticut was the 6th state with most Puerto Ricans (301,182) in the United States.
DINGWALL PROFILE May 2014
 www.hie.co.uk DINGWALL PROFILE May 2014 DINGWALL PROFILE INTRODUCTION The Dingwall profile uses 2011 Census data and other available data sources to present an up-to-date analysis of its population and
International migration data in the case of South Africa
 International migration data in the case of South Africa A presentation made at the Workshop on strengthening the collection and use of international migration data for development held in Addis Ababa,
Puerto Ricans in Rhode Island, the United States, and Puerto Rico, 2013
 Issued September 2016 Centro DS2015US-07 Puerto Ricans in Rhode Island, the United States, and Puerto Rico, 2013 In 2013 an estimated 36,217 Puerto Ricans lived in Rhode Island and accounted for at least
Domestic Tourism Survey 2016
 STATISTICAL RELEASE P0352.1 Domestic Tourism Survey 2016 January to December 2016 Embargoed until: 04 September 2017 10:30 ENQUIRIES: FORTHCOMING ISSUE: EXPECTED RELEASE DATE User Information Services
2011 POPULATION AND HOUSING CENSUS
 HELLENIC REPUBLIC HELLENIC STATISTICAL AUTHORITY Piraeus, 12 September 2014 2011 POPULATION AND HOUSING CENSUS Demographic and social characteristics of the Resident Population of Greece according to the
BOTSWANA AGRICULTURAL CENSUS REPORT 2015
 BOTSWANA AGRICULTURAL CENSUS REPORT 2015 STATISTICS BOTSWANA BOTSWANA AGRICULTURAL CENSUS REPORT 2015 1 BOTSWANA AGRICULTURAL CENSUS REPORT 2015 2 BOTSWANA AGRICULTURAL CENSUS REPORT 2015 BOTSWANA AGRICULTURAL
Tourism Statistics Annual Report
 Tourism Statistics 2012 Annual Report Research and Development Department, June 2012 Table of Contents PREFACE... 3 THE WORLD TOURISM SCENE... 3 THIS REPORT... 3 INTERNATIONAL ARRIVAL STATISTICS... 4 INTRODUCTION...
Poverty in Seychelles: Policy Digest
 Poverty in Seychelles: Policy Digest Christophe Muller (United Nations Development Programme Consultant, July 2012) This document reports on the estimation of a poverty line and a poverty profile for Seychelles
BOTSWANA. Multi-Topic HOUSEHOLD SURVEY Report 2015/16
 BOTSWANA Multi-Topic HOUSEHOLD SURVEY Report 2015/16 Private Bag 0024, Gaborone. Botswana TOLL FREE NUMBER: 0800600200 Tel: ( +267) 367 1300 Fax: ( +267) 395 2201 E-mail: info@statsbots.org.bw Website:
Projected demand for independent schools in New South Wales over the next 40 years: Summary report
 Projected demand for independent schools in New South Wales over the next 40 years: Summary report Association of Independent Schools of New South Wales 22 October 2014 Glossary ABS ACT AIS ASGS DAE FTE
ARAGON BASIC DATA, 2018 Instituto Aragonés de Estadística
 22 ARAGON BASIC DATA, 218 Instituto és de Estadística POPULATION Population structure Population structure by age and sex, 217 Unit: persons. Both sexes Men Women % Both sexes Men Women % Total 1.38.75
POPULATION AND HOUSEHOLDS POPULATION HOUSEHOLDS HOUSING.
 POPULATION AND HOUSEHOLDS POPULATION HOUSEHOLDS HOUSING 22 ARAGON BASIC DATA, 217 Instituto és de Estadística POPULATION Population structure Population structure by age and sex, 216 Unit: persons. Both
POPULATION AND HOUSEHOLDS POPULATION HOUSEHOLDS HOUSING
 21 POPULATION AND HOUSEHOLDS POPULATION HOUSEHOLDS HOUSING 22 ARAGON BASIC DATA, 216 Instituto és de Estadística POPULATION Population structure Population structure by age and sex, 215 Unit: persons.
Page 1. Economic Impact Assessment of the Palm Island Community Company
 Page 1 Economic Impact Assessment of the Palm Island Community Company INCORPORATING: Empower North is a group of expert consultants providing select clients with an integrated service across the specialist
Puerto Ricans in Ohio, the United States, and Puerto Rico, 2014
 Issued April 2016 Centro DS2015US-12 Puerto Ricans in Ohio, the United States, and Puerto Rico, 2014 In 2014, Ohio had the tenth largest number of Puerto Ricans in the United States with 108,174 residents,
UK household giving new results on regional trends
 CGAP Briefing Note 6 UK household giving new results on regional trends 01 08 July 10 Tom McKenzie and Cathy Pharoah In a climate of growing political emphasis on charitable activity at local levels, this
Population, Territory and Sustainable Development The Case of the Caribbean Sub Region
 Population, Territory and Sustainable Development The Case of the Caribbean Sub Region Author: Godfrey St. Bernard Sir Arthur Lewis Institute of Social and Economic Studies The University of the West Indies
Statistical Picture of Aboriginal and Torres Strait Islander School Students in Australia
 Chapter 2 Statistical Picture of Aboriginal and Torres Strait Islander School Students in Australia Statistical Picture The Australian Bureau of Statistics (ABS) reported that the estimated resident Aboriginal
STATISTICAL BULLETIN ON INTERNATIONAL ARRIVALS, DEPARTURES AND MIGRATION 2011 SERIES NO. SDT: Government of Tonga
 SERIES NO. SDT: 38-13 Government of Tonga STATISTICAL BULLETIN ON INTERNATIONAL ARRIVALS, DEPARTURES AND MIGRATION 2011 Statistics Department, P.O. Box 149, Nuku alofa, Kingdom of Tonga Website: www.spc.int/prism/tonga/
THE REPUBLIC OF THE UNION OF MYANMAR. The 2014 Myanmar Population and Housing Census. Nay Pyi Taw. Census Report Volume 3 O
 THE REPUBLIC OF THE UNION OF MYANMAR The 04 Myanmar Population and Housing Census Nay Pyi Taw Census Report Volume 3 O Department of Population Ministry of Immigration and Population May 05 The 04 Myanmar
HOUSEHOLD TRAVEL SURVEY
 HOUSEHOLD TRAVEL SURVEY Household Travel Survey i TABLE OF CONTENTS Page 1.0 INTRODUCTION... 1 2.0 SUMMARY OF TRAVEL... 2 2.1 All-Day Travel Patterns... 2 2.1.1 Automobile Availability... 2 2.1.2 Trip
EXPO 88 IMPACT THE IMPACT OF WORLD EXPO 88 ON QUEENSLAND'S TOURISM INDUSTRY QUEENSLAND TOURIST AND TRAVEL CORPORATION GPO BOX 328, BRISBANE, 4001
 EXPO 88 IMPACT THE IMPACT OF WORLD EXPO 88 ON QUEENSLAND'S TOURISM INDUSTRY QUEENSLAND TOURIST AND TRAVEL CORPORATION GPO BOX 328, BRISBANE, 4001 Prepared by The National Centre for Studies in Travel and
UNDERSTANDING TOURISM: BASIC GLOSSARY 1
 UNDERSTANDING TOURISM: BASIC GLOSSARY 1 Tourism is a social, cultural and economic phenomenon related to the movement of people to places outside their usual place of residence pleasure being the usual
Puerto Ricans in Georgia, the United States, and Puerto Rico, 2014
 Issued September 2016 Centro DS2014GA-14 Puerto Ricans in Georgia, the United States, and Puerto Rico, 2014 In 2014, an estimated 89,462 Puerto Ricans lived in Georgia and accounted for 1.7 percent of
SADC SELECTED ECONOMIC AND SOCIAL INDICATORS, 2016
 SADC SELECTED ECONOMIC AND SOCIAL INDICATORS, 2016 1. INTRODUCTION This report is an attempt to provide data series and a brief trend analysis of the major socio-economic characteristics of SADC region
Contents Manningham at a Glance... 6 Location and Area... 6 Manningham Activity Centres... 6 Manningham Suburbs... 6 Population... 8 Forecast... 9 For
 Contents Manningham at a Glance... 6 Location and Area... 6 Manningham Activity Centres... 6 Manningham Suburbs... 6 Population... 8 Forecast... 9 Forecast 2011 2036... 9 Population Forecast... 9 Gross
SYNOPSIS OF INFORMATION FROM CENSUS BLOCKS AND COMMUNITY QUESTIONNAIRE FOR TONOPAH, NEVADA
 TECHNICAL REPORT UCED 93-04 SYNOPSIS OF INFORMATION FROM CENSUS BLOCKS AND COMMUNITY QUESTIONNAIRE FOR TONOPAH, NEVADA UNIVERSITY OF NEVADA, RENO i Synopsis of Information from Census Blocks and Community
POPULATION INTRODUCTION
 POPULATION INTRODUCTION The socio-economic data available at the time of this writing is a conglomeration of data provided by the Kentucky State Data Center, OKI Regional Council of Governments, 2010 U.S.
PROFILE OF THE PUERTO RICAN POPULATION IN UNITED STATES AND PUERTO RICO: 2008
 PROFILE OF THE PUERTO RICAN POPULATION IN UNITED STATES AND PUERTO RICO: 2008 Sonia G. Collazo, Camille L. Ryan, Kurt J. Bauman U.S. Census Bureau Housing and Household Economic Statistics Division This
2009 North Carolina Visitor Profile
 2009 Visitor Profile A publication of the Division of Tourism, Film & Sports Development August 2010 Division of Tourism, Film and Sports Development 2009 Visitor Profile 2009 Visitor Profile The Division
Figure 1.1 St. John s Location. 2.0 Overview/Structure
 St. John s Region 1.0 Introduction Newfoundland and Labrador s most dominant service centre, St. John s (population = 100,645) is also the province s capital and largest community (Government of Newfoundland
LITERACY IN NOVA SCOTIA Implications of Findings from IALSS 2003
 LITERACY IN NOVA SCOTIA Implications of Findings from IALSS 03 Presented by Satya Brink, Ph.D. Director, National Learning Policy Research Learning Policy Directorate, HRSDC January 06 1 Key Questions
Chapter 1: Kosovo and its Population
 Chapter 1: Kosovo and its Population The Territory Kosovo is a small and landlocked territory in the center of the Balkan Peninsula. Kosovo borders Macedonia (FYROM), Albania, Serbia and Montenegro. Its
Report on Palm Beach County Tourism Fiscal Year 2007/2008 (October 2007 September 2008)
") Report on Palm Beach County Tourism Fiscal Year 2007/2008 (October 2007 September 2008) Prepared for: Tourist Development Council of Palm Beach County Prepared by: 4020 S. 57 th Avenue Lake Worth, FL 33463
Report on Palm Beach County Tourism Fiscal Year 2007/2008 (October 2007 September 2008) Prepared for: Tourist Development Council of Palm Beach County Prepared by: 4020 S. 57 th Avenue Lake Worth, FL 33463
Perth & Kinross Council. Community Planning Partnership Report June 2016
 Perth & Kinross Council Community Planning Partnership Report June 2016 Contents Foreword... 3 Section 1: Spring 2016 destination follow up of 2014/15 school leavers... 4 Background... 4 Section A: Initial
2006 RENO-SPARKS VISITOR PROFILE STUDY
 2006 RENO-SPARKS VISITOR PROFILE STUDY PREPARED FOR RENO-SPARKS CONVENTION & VISITOR AUTHORITY Study Conducted and Reported by 475 Hill Street, Suite 2 Reno, Nevada 89501 (775) 323-7677 www.infosearchintl.com
2015 IRVING HOTEL GUEST SURVEY Final Project Report
 2015 IRVING HOTEL GUEST SURVEY Final Project Report Research prepared for the Irving Convention & Visitors Bureau by Destination Analysts, Inc. Table of Contents S E C T I O N 1 Introduction 2 S E C T
Industry and occupation of population in Montenegro
 MONTENEGRO STATISTICAL OFFICE R E L A S E 197 No Podgorica, 20 July 2012 Name the source when using the data Industry and occupation of population in Montenegro Census of Population, Households, and Dwellings
JATA Market Research Study Passenger Survey Results
 JATA Market Research Study Passenger Survey Results Prepared for the Jackson Area Transportation Authority (JATA) April, 2015 3131 South Dixie Hwy. Suite 545 Dayton, OH 45439 937.299.5007 www.rlsandassoc.com
The Economic Impact of Tourism on Scarborough District 2014
 The Economic Impact of Tourism on Scarborough District 2014 Prepared by: Tourism South East Research Unit 40 Chamberlayne Road Eastleigh Hampshire SO50 5JH CONTENTS 1. Summary of Results 1 2. Table of
2016 Edition. Lesotho Tourism Development Corporation. July Page of 39
 2016 Edition Lesotho Tourism Development Corporation July 2017 Page of 39 TABLE OF CONTENTS FOREWORD... I 1. ANNUAL TOURISM PERFORMANCE 2016... 3 1.1 KEY HIGHLIGHTS OF LESOTHO S TOURISM SECTOR..3 2. ARRIVAL
Aboriginal and Torres Strait Islander Life Expectancy and Mortality Trend Reporting to 2014
 Aboriginal and Torres Strait Islander Life Expectancy and Mortality Trend Reporting to 2014 Technical Report June 2016 Authors: Clare Coleman, Nicola Fortune, Vanessa Lee, Kalinda Griffiths, Richard Madden
AMSTERDAM. Yearbook: Summary Results 180
 AMSTERDAM Amsterdam is the capital of the Netherlands and the country's cultural, financial and commercial services centre. The NUTS 3 Greater-Amsterdam region is located in the northern part of the predominantly
Department of Agricultural and Resource Economics, Fort Collins, CO
 June 2007 EDR 07-15 Department of Agricultural and Resource Economics, Fort Collins, CO 80523-1172 http://dare.colostate.edu/pubs OF WINE AND WILDLIFE: ASSESSING MARKET POTENTIAL FOR COLORADO AGRITOURISM
Taking Part 2015/16: WEST MIDLANDS
 Taking Part 2015/16: WEST MIDLANDS 1 This report provides an overview of the arts and cultural engagement of adults living in the West Midlands. Data is taken from the Taking Part Survey 2015/16 and makes
2013 IRVING HOTEL GUEST SURVEY Final Project Report
 2013 IRVING HOTEL GUEST SURVEY Final Project Report Research prepared for the Irving Convention & Visitors Bureau by Destination Analysts, Inc. Table of Contents SECTION 1 Introduction 2 SECTION 2 Executive
Census 2002 OF WOOD BUFFALO
 Census 2002 THE REGIONAL MUNICIPALITY OF WOOD BUFFALO Census 2002 The Regional Municipality of Wood Buffalo* 2002 Census was conducted from May 7 to June 30.** The information gathered from the enumeration
The Economic Impact of Tourism on Calderdale Prepared by: Tourism South East Research Unit 40 Chamberlayne Road Eastleigh Hampshire SO50 5JH
 The Economic Impact of Tourism on Calderdale 2015 Prepared by: Tourism South East Research Unit 40 Chamberlayne Road Eastleigh Hampshire SO50 5JH CONTENTS 1. Summary of Results 1 2. Table of Results Table
Puerto Ricans in Massachusetts, the United States, and Puerto Rico, 2014
 Issued April 2016 Centro DS2016US-07 Puerto Ricans in Massachusetts, the United States, and Puerto Rico, 2014 In 2014, Massachusetts was the fifth state with most Puerto Ricans in the United States. In
Baku, Azerbaijan November th, 2011
 Baku, Azerbaijan November 22-25 th, 2011 Overview of the presentation: Structure of the IRTS 2008 Main concepts IRTS 2008: brief presentation of contents of chapters 1-9 Summarizing 2 1 Chapter 1 and Chapter
Millennium Development Goal 1: eradicate extreme poverty and hunger. International poverty line a Share of population below PPP $1.
 3.1 Millennium Development Goal 1: eradicate extreme poverty and hunger International poverty line a Share of population below PPP $1.25 a day Poverty gap ratio at PPP $1.25 a day Share of population below
Tourism in South Africa A statistical overview
 Tourism in South Africa A statistical overview Purpose of presentation Purpose of the presentation is to present different tourism statistics produced by Stats SA People like to travel we are a country
Aboriginal and Torres Strait Islander Life Expectancy and Mortality Trend Reporting
 Aboriginal and Torres Strait Islander Life Expectancy and Mortality Trend Reporting Technical Report December 2015 Amended May 2016 Authors: Clare Coleman, Nicola Fortune, Vanessa Lee, Kalinda Griffiths,
Stavros Rodokanakis. Regional Development Fund, Region of Central Macedonia, K. Rossidou 11, Thessaloniki, Greece.
 Stavros Rodoanais Regional Development Fund, Region of Central Macedonia, K. Rossidou 11, 540 08 Thessalonii, Greece Tel.: +30-2310-40.93.83 (office) E-mail: srodo2003@yahoo.gr Title: Econometric analysis
Tourism Statistics
 Tourism Statistics 2006-2010 TABLE OF CONTENTS FOREWORD 4 DEFINITIONS 5 STATISTICAL SUMMARY FOR 2010 6 INTERNATIONAL TOURIST ARRIVALS 7 International Tourist Arrivals: 1994-2010 7 International Tourist
Dr. Dimitris P. Drakoulis THE REGIONAL ORGANIZATION OF THE EASTERN ROMAN EMPIRE IN THE EARLY BYZANTINE PERIOD (4TH-6TH CENTURY A.D.
 Dr. Dimitris P. Drakoulis THE REGIONAL ORGANIZATION OF THE EASTERN ROMAN EMPIRE IN THE EARLY BYZANTINE PERIOD (4TH-6TH CENTURY A.D.) ENGLISH SUMMARY The purpose of this doctoral dissertation is to contribute
North Lanarkshire. Skills Assessment January SDS-1163-Jan16
 North Lanarkshire Skills Assessment January 2016 SDS-1163-Jan16 Acknowledgement The Regional Skills Assessment Steering Group (Skills Development Scotland, Scottish Enterprise, the Scottish Funding Council
National Accounts Workshop for SADC countries
 ESA/STAT/AC.184/21 National Accounts Workshop for SADC countries 16-19 June 2009, Windhoek, Namibia Strengthening statistical capacity-building in support of progress towards the Internationally Agreed
FOREWORD KEY HIGHLIGHTS... 3
 TABLE OF CONTENTS FOREWORD... 1 1. KEY HIGHLIGHTS... 3 2. ARRIVAL STATISTICS... 4 2.1. TRACKING TOURISM DEMAND 4 2.2. TOURISM ARRIVALS BY YEAR... 4 2.3.2. TOP SIX OVERSEAS MARKETS FOR LESOTHO... 7 2.3.3.
Key Indicators for South Sudan
 Key Indicators for South Sudan National Bureau of Statistics Fast Facts Total Population of South Sudan is 8.26 million Total Area of South Sudan is 644,329 sq. km More than half (51%) of the population
SADC Harmonised Consumer Price Indices (HCPI) March 2017
 March 2017") News Release Issue No. 67 SADC Harmonised Consumer Price Indices (HCPI) March 2017 SADC Secretariat Telephone: (267) 3951863 Directorate -Policy Planning and Resource Mobilization Telefax: (267) 3972848/3181070
News Release Issue No. 67 SADC Harmonised Consumer Price Indices (HCPI) March 2017 SADC Secretariat Telephone: (267) 3951863 Directorate -Policy Planning and Resource Mobilization Telefax: (267) 3972848/3181070
Bardala village profile
 Bardala village profile Produced by The Applied Research Institute - Jerusalem In cooperation with Funded by February, 2006 This document has been produced with the financial assistance of the European
HIGH-END ECOTOURISM AS A SUSTAINABLE LAND USE OPTION IN RURAL AFRICA:
 HIGH-END ECOTOURISM AS A SUSTAINABLE LAND USE OPTION IN RURAL AFRICA: THE ROLE OF EMPLOYMENT IN POVERTY REDUCTION & SOCIAL WELFARE Sue Snyman, March 2011 sues@wilderness.co.za INTRODUCTION Rural Communities
Produced by: Destination Research Sergi Jarques, Director
 Produced by: Destination Research Sergi Jarques, Director Economic Impact of Tourism Norfolk - 2017 Contents Page Summary Results 2 Contextual analysis 4 Volume of Tourism 7 Staying Visitors - Accommodation
THE MOST AND LEAST CHILD-FRIENDLY GOVERNMENTS IN AFRICA
 The Most and Least Child-friendly Governments in Africa 5 THE MOST AND LEAST CHILD-FRIENDLY GOVERNMENTS IN AFRICA We must put the best interests of children at the heart of all political and business decision-making,
Employment characteristics of UK tourism industries in 2008
 Employment characteristics of UK tourism industries in 2008 Eddie Smith, Dominic Webber and Sean White Tourism Intelligence Unit, Office for National Statistics Summary This article uses an analysis of
Travel and Tourism in Ukraine: Key Trends and Opportunities to 2016
 Travel and Tourism in Ukraine: Key Trends and Opportunities to 2016 Reference code: TT0037MR_SP Published: July 2012 www.timetric.com Timetric John Carpenter House 7 Carmelite Street London EC4Y 0BS United
Adventure Tourists in Himachal Pradesh and Uttarakhand
 Volume 6, Issue 10, April 2014 Adventure Tourists in Himachal Pradesh and Uttarakhand Dr. Kashmir Singh Principal S.G.B.T College Shri Anandpur Sahib, Punjab Abstract Tourism is a lucrative source for
A COMPARISON OF THE MILWAUKEE METROPOLITAN AREA TO ITS PEERS
 KRY/WJS/EDL #222377 (PDF: #223479) 1/30/15 PRELIMINARY DRAFT Memorandum Report A COMPARISON OF THE MILWAUKEE METROPOLITAN AREA TO ITS PEERS EXECUTIVE SUMMARY This memorandum report provides a statistical
The Economic Contributions of Agritourism in New Jersey
 The Economic Contributions of Agritourism in New Jersey Bulletin E333 Cooperative Extension Brian J. Schilling, Extension Specialist in Agricultural Policy Kevin P. Sullivan, Institutional Research Analyst
QCOSS Regional Homelessness Profile Mackay Statistical Division
 QCOSS Regional Homelessness Profile Mackay Statistical Division March 2011 Council of Social Service Inc (QCOSS) March 2011 QCOSS would like to thank the Department of Communities for providing data from
Accommodation Survey: November 2009
 Embargoed until 10:45am 19 January 2010 Accommodation Survey: November 2009 Highlights Compared with November 2008: International guest nights were up 2 percent, while domestic guest nights were down 1
APPENDIX 8. Leeds Socio-Economic Baseline Report. Report. July Metro and Leeds City Council
 APPENDIX 8 Leeds Socio-Economic Baseline Report Report July 2009 Prepared for: Prepared by: Metro and Leeds City Council Steer Davies Gleave West Riding House 67 Albion Street Leeds LS1 5AA +44 (0)113
SOCIO-ECONOMIC STATUS OF THE BLACK POPULATION BY PEEL NEIGHBOURHOODS, 2006
 SOCIO-ECONOMIC STATUS OF THE BLACK POPULATION BY PEEL NEIGHBOURHOODS, 2006 F.A.C.E.S. of Peel Collaborative January 2015 Prepared by the Social Planning Council of Peel Table of Contents ABSTRACT... 1
East African Community Facts and Figures 2014
 The East African Community EAC IRC Repository http://repository.eac.int 1. EAC Secretariat Reports/Publications 2014-09 East African Community Facts and Figures 2014 EAC EAC http://hdl.handle.net/11671/219
COUNTRY CASE STUDIES: OVERVIEW
 APPENDIX C: COUNTRY CASE STUDIES: OVERVIEW The countries selected as cases for this evaluation include some of the Bank Group s oldest (Brazil and India) and largest clients in terms of both territory
Produced by: Destination Research Sergi Jarques, Director
 Produced by: Destination Research Sergi Jarques, Director Economic Impact of Tourism Oxfordshire - 2015 Economic Impact of Tourism Headline Figures Oxfordshire - 2015 Total number of trips (day & staying)
Produced by: Destination Research Sergi Jarques, Director
 Produced by: Destination Research Sergi Jarques, Director Economic Impact of Tourism North Norfolk District - 2016 Contents Page Summary Results 2 Contextual analysis 4 Volume of Tourism 7 Staying Visitors
Produced by: Destination Research Sergi Jarques, Director
 Produced by: Destination Research Sergi Jarques, Director Economic Impact of Tourism Norfolk - 2016 Contents Page Summary Results 2 Contextual analysis 4 Volume of Tourism 7 Staying Visitors - Accommodation
Supporting lone parents into work: The British Experience. Jane Hall Dept for Work and Pensions
 Supporting lone parents into work: The British Experience Jane Hall Dept for Work and Pensions Overview Current number of lone parents in Great Britain Provision for lone parents from the 1990s - Work