----- AMP Data Entry Page -----
|
|
|
- Barbara Clarke
- 6 years ago
- Views:
Transcription
1 ----- AMP Data Entry Page Losing Facility Information Type of Distribution to Consolidate: Orig & Dest MODS/BPI Office Facility Name & Type: Street Address: City: Paducah P&D F 300 S 4th St Paducah State: KY 5D Facility ZIP Code: District: Kentuckiana Area: Eastern Finance Number: Current 3D ZIP Code(s): Miles to Gaining Facility: EXFC office: Yes Plant Manager: Senior Plant Manager: District Manager: Facility Type after AMP: Pam Hightower Steve Cronic David J. Dillman Post Office 2. Gaining Facility Information Facility Name & Type: Evansville P&D F Street Address: 7100 Petersburg Rd City: Evansville State: IN 5D Facility ZIP Code: District: Kentuckiana Area: Eastern Finance Number: Current 3D ZIP Code(s): 424, 476, 477 EXFC office: Yes Plant Manager: Senior Plant Manager: District Manager: 3. Background Information Jemal Jones Steve Cronic David J, Dillman Start of Study: 9/15/2011 Date Range of Data: Jul : Jun Processing Days per Year: 310 Bargaining Unit Hours per Year: 1,745 EAS Hours per Year: 1,822 Date of HQ memo, DAR Factors/Cost of Borrowing/ New Facility Start-up Costs Update June 16, 2011 Date & Time this workbook was last saved: 2/19/ :45 4. Other Information Area Vice President: Vice President, Network Operations: Area AMP Coordinator: HQ AMP Coordinator: Package Page 1 Jordan M. Small David E. Williams Bob Roseberry Gary T Curran rev 10/10/2011 AMP Data Entry Page
2
3 Gaining Facility Name and Type: Current 3D ZIP Code(s): Executive Summary Last Saved: February 13, 2012 Losing Facility Name and Type: Paducah P&D F Street Address: 300 S 4th St City, State: Paducah, KY Current 3D ZIP Code(s): 420 Type of Distribution to Consolidate: Orig & Dest Miles to Gaining Facility: 112 Evansville P&D F 424, 476, 477 Summary of AMP Worksheets Savings/Costs Mail Processing Craft Workhour Savings Non-MP Craft/EAS + Shared LDCs Workhour Savings (less Maint/Trans) PCES/EAS Supervisory Workhour Savings = $1,165,069 = $4,128 = $248,861 from Workhour Costs - Proposed from Other Curr vs Prop from Other Curr vs Prop Transportation Savings = $664,690 from Transportation (HCR and PVS) Maintenance Savings = $495,907 from Maintenance Space Savings = $0 from Space Evaluation and Other Costs Total Annual Savings = $2,578,656 Total One-Time Costs = $495,625 from Space Evaluation and Other Costs Staffing Positions Total First Year Savings = $2,083,031 Craft Position Loss = 16 from Staffing - Craft Volume PCES/EAS Position Loss = 0 from Staffing - PCES/EAS Service Total FHP to be Transferred (Average Daily Volume) = 452,154 from Workhour Costs - Current Current FHP at Gaining Facility (Average Daily Volume) = 851,631 from Workhour Costs - Current Losing Facility Cancellation Volume (Average Daily Volume) = 61,431 Service Standard Impacts UPGRADED DOWNGRADED (= Total TPH / Operating Days) Unchanged + Upgrades Unchanged + Upgrades by ADV ADV ADV ADV % First-Class Mail #DIV/0! Priority Mail #DIV/0! Package Services #DIV/0! Periodicals N/A* N/A* N/A* N/A* Standard Mail N/A* N/A* N/A* N/A* Code to destination 3-digit ZIP Code volume is not available rev 10/15/2009 Package Page 3 AMP Executive Summary
4 Losing Facility Name and Type: Current 3D ZIP Code(s): Type of Distribution to Consolidate: Gaining Facility Name and Type: Current 3D ZIP Code(s): Summary Narrative Last Saved: February 13, 2012 Paducah P&D F 420 Orig & Dest Evansville P&D F 424, 476, 477 Paducah P&DF to Evansville P&DF AMP BACKGROUND The Kentuckiana District, with assistance from the Eastern Area, has completed this brief summary of the Paducah P&DF AMP into the Evansville P&DF. This study was conducted to determine if the Postal Service could increase efficiency by consolidating Paducah s mail processing operations, which are currently being performed at the Paducah P&DF, into the Evansville P&DF. The Paducah P&DF is a postal owned facility that processes originating and destinating volumes for the service area of 420. The Paducah facility is 42,541 square feet with very limited excess space outside. The Paducah facility is 112 miles from the Evansville facility, approximately 2 hours 20 minutes via interstate highways. The proposed AMP will transfer all originating and destinating letters, flats, and priority volumes from the 420 service area to the Evansville P&DF (477). Additionally, Express volumes will be move to the Evansville facility as well. The BMEU will remain on the current Paducah plant. Plans are to have the Paducah Carrier Annex move into the old plant, eliminating a lease and enabling the BMEU to remain. This will also act as a Transportation HUB for all destinating mail returning from the Evansville facility. Note: The Network Optimization plan includes consolidating the following sites into to the Evansville P&DF. Review these workbooks for all costs and savings associated with the Network Optimization plan. Terre Haute P&DF SCF 475 (approximately 47% of Terre Haute volume) Paducah P&DF SCF 420 (100% of Paducah s volume) Centralia CSMPC SCF 629 (100% of Centralia s volume) Carbondale CSMPC SCF 628 (100% of Carbondale s volume) FINANCIAL JUSTIFICATION SUMMARY Financial savings proposed for the consolidation of SCF 420 from the Paducah P&DF to the Evansville, IN P&DF are: Total Annual Savings: $2,578,656 Total First Year Savings: $2,083,031 The total FHP volume to be transferred to the Evansville P&DF from Paducah P&DF is 452,154 pieces which includes all letters, flats, and packages. rev 06/10/2009 Package Page 4 AMP Summary Narrative
5 Summary Narrative (continued) Summary Narrative Page 2 CUSTOMER & SERVICE IMPACTS The Proposal calls for a change in AADC labeling listing, adding AADC Evansville IN 477 which would include SCF 420. Also, the proposal calls for a change in the ADC labeling list, adding an ADC Evansville IN 477 which would include SCF 420. Collection Box times will not be affected. Specific service standard changes associated with this Area Mail Processing consolidation are contingent upon the resolution of both (a) the rulemaking in which current market dominant product service standards in 39 CFR Part 121 are being evaluated, and (b) all remaining AMP consolidation proposals that are part of the same network rationalization initiative. A complete file reflecting any new service standards will be published at once all of the related AMP decisions that provide the foundation for new service standards are made. Priority and Express Mail service standards will be based upon the capability of the network. RETAIL AND BUSINESS MAIL ENTRY UNIT (BMEU) IMPACTS The BMEU in Paducah will remain at their original location at the Paducah P&DF. The Retail Unit for the Paducah Post Office would not be affected. Function 4 - Function 7 (Retail / BMEU) are not included in this AMP study. Workhours for these Functions are associated with the following Finance numbers (Retail) and (BMEU) and will remain intact. SPACE CONSIDERATIONS The Paducah P&DF will be surveyed for improvements and will be examined by Eastern Area FSO to determine if other consolidation opportunities exist here. Preliminary plans are for the Paducah Carrier Annex, located at 3550 Park Plaza Road, to be relocated into the current P&DF. This would eliminate the current lease ($101,500 / year) and would allow the Postal Service to use the current P&DF as a transportation HUB for all the destinating SCF 420 volume coming in from Evansville P&DF. This move would also keep the current BMEU intact as well as the main retail unit. The Evansville P&DF, with the additional equipment needed for the processing of all the AMPed volume, would need to acquire additional space. The P&DF at 7100 Petersburg Road is severely space deficient for this. Potential Space would be the old Evansville Federal Office Building at 101 NW Martin Luther King Blvd., which is already owned by the United States Postal Service. This space would be an ideal candidate. Potentially, cancellations and all letter operations would be performed at the Evansville P&DF at Petersburg Road. All Flats and Package operations would be at the Federal Building on MLK Blvd, with regular transportation between the two facilities. Mail Processing operated this way in Evansville for many years. This distance between the two facilities is approximately 6.2 miles, about 13 minutes travel time. CFS and PARS Currently, the Paducah P&DF sends their PARS and CFS volumes to the Louisville P&DC for processing and Distribution. This will continue to be the workflow until any PARS or CFS consolidations take place. rev 06/10/2009 Package Page 5 AMP Summary Narrative

6
7 Summary Narrative (continued) Summary Narrative Page 4 TRANSPORTATION Transportations Savings will be achieved by the elimination of two major highway contract routes: HCR 40012, service between Louisville and Paducah, will no longer be needed and will result in a saving of $ 637, The mail volume now goes to the Evansville P&DF from Louisville and will be utilizing existing transportation routes. HCR 37016, service between Nashville and Paducah, will no longer be needed and will result in a savings of $117, The volume no goes to the Evansville P&DF and will be supported by existing transportation. SCF 420: Proposed Transportation Outgoing: Paducah Plant acts as Transportation HUB for Originating Mail. Consolidation point for all originating volumes from the SCF 420 Associate Offices. Same transportation trips can be used to carry the collection mail to Evansville. Route trips 2 and 4 run from Paducah to Evansville Daily. These will continue to be utilized. Transportation times will be adjusted to ensure collection volumes on the last trip arrive NLT 2300 at the Evansville facility to meet operational clearance times and service commitments. Trucks will be changed from Straight Truck to Tractor Trailers. (Cost of $45,150.00) SCF 420: Proposed Transportation Incoming: Paducah Plant acts as Transportation HUB Destinating Mail Evansville will dispatch mail to he Paducah Post Office will all major offices broken down. At the Paducah Post Office, a dock breakdown will be performed for all the smaller individual Associated Offices and then dispatched from here. Associate Office transportation routes already exist from Paducah. Route trips 1 and 3 from run Evansville to Paducah Daily. These will continue to be utilized This transportation will be adjusted to be in line with the new operational windows of the network optimization. Destinating Priority and Express for the smaller 420 offices will be worked at the Transportation HUB. SPBS/Flats will break out larger offices, and act as a primary sort for smaller offices. Trucks will be changed from Straight Truck to Tractor Trailers (Cost of $45,150.00) Return trips are the collection trips coming in from Paducah. rev 06/10/2009 Package Page 7 AMP Summary Narrative
8 Summary Narrative (continued) Summary Narrative Page 5 DAR / EXPANSION OR RENOVATION At the Evansville P&DF, power drops will have to be relocated to address the redesign of the workroom floor. Renovation and upgrades will need to be done at the old Federal building if this site is chosen to accommodate the new mail processing operations. Demolition of walls, installation of power and air for the MPE, and general facility upgrades will cost an estimated. MPI Network issues will have to be addressed here as well. EQUIPMENT RELOCATION 1 DIOSS will be moved to the Evansville P&DF from the Paducah P&DF. (See AutoCAD drawing). An additional DIOSS will also be needed for the Evansville P&DF. Also, a small parcel bundle sorter (Lexington P&DF possibly) and (2) AFSM 100 will be relocated to the new Annex: one currently in Evansville P&DF and one possibly from the Lexington P&DF closure. SUMMARY The proposed AMP has the potential to save approximately $2,418,575 annually by increasing mail processing efficiency. Transportation has been assessed and costs will be incurred to ensure service commitments and processing capabilities. Operational clearance times and effectiveness will be improved and/or maintained with the shift in all operations and volumes to the Evansville P&DF. The study will enable the Kentuckiana District to consolidate resources and better manage costs and functions for efficient mail processing. rev 06/10/2009 Package Page 8 AMP Summary Narrative

9 Losing Facility Name and Type: Current 3D ZIP Code(s): Type of Distribution to Consolidate: Gaining Facility Name and Type: Current 3D ZIP Code(s): 24 Hour Indicator Report 24 Hour Clock Last Saved: February 13, 2012 Paducah P&D F 420 Orig & Dest Evansville P&D F 424, 476, % 100% 100% 100% Millions 100% 100% 86.9% Weekly Trends Beginning Day Facility Cancelled by 2000 Data Source = EDW MCRS OGP Cleared by 2300 Data Source = EDW EOR OGS Cleared by 2400 Data Source = EDW EOR MMP Cleared by 2400 Data Source = EDW EOR % MMP Volume On Hand at 2400 Data Source = EDW MCRS Mail Assigned Commercial / FedEx By 0230 Data Source = EDW SASS DPS 2nd Pass Cleared by 0700 Data Source = EDW EOR Trips On-Time Data Source = EDW TIMES 30-Apr SAT 4/30 PADUCAH P&DF 70.8% 98.8% 98.8% % 88.5% 96.7% 7-M ay SAT 5/7 PADUCAH P&DF 81.1% 97.7% 100.0% % 90.6% 99.0% 14-M ay SAT 5/14 PADUCAH P&DF 103.5% 100.0% 100.0% % 98.2% 100.0% 21-M ay SAT 5/21 PADUCAH P&DF 75.3% 100.0% 100.0% % 96.5% 95.8% 28-M ay SAT 5/28 PADUCAH P&DF 71.4% 97.3% 100.0% % 93.9% 92.7% 4-Jun SAT 6/4 PADUCAH P&DF 92.5% 100.0% 100.0% % 90.8% 91.6% 11-Jun SAT 6/11 PADUCAH P&DF 94.5% 100.0% 100.0% % 95.6% 92.1% 18-Jun SAT 6/18 PADUCAH P&DF 92.4% 100.0% 100.0% % 99.2% 95.9% 25-Jun SAT 6/25 PADUCAH P&DF 115.1% 100.0% 100.0% % 96.1% 95.8% 2-Jul SAT 7/2 PADUCAH P&DF 97.3% 100.0% 100.0% % 94.4% 81.2% 9-Jul SAT 7/9 PADUCAH P&DF 93.6% 100.0% 100.0% % 98.1% 91.8% 16-Jul SAT 7/16 PADUCAH P&DF 290.5% 100.0% 100.0% % 95.9% 84.2% 23-Jul SAT 7/23 PADUCAH P&DF 99.6% 100.0% 100.0% % 96.2% 100.0% 30-Jul SAT 7/30 PADUCAH P&DF 91.7% 100.0% 100.0% % 93.4% 94.5% 6-Aug SAT 8/6 PADUCAH P&DF 95.8% 100.0% 100.0% % 91.8% 99.0% 13-Aug SAT 8/13 PADUCAH P&DF 102.0% 100.0% 100.0% % 98.4% 100.0% 20-Aug SAT 8/20 PADUCAH P&DF 93.2% 100.0% 100.0% % 97.5% 97.2% 27-Aug SAT 8/27 PADUCAH P&DF 67.3% 100.0% 100.0% % 93.5% 99.0% 3-Sep SAT 9/3 PADUCAH P&DF 82.6% 100.0% 100.0% % 86.5% 68.9% 10-Sep SAT 9/10 PADUCAH P&DF 94.5% 100.0% 100.0% % 84.4% 47.0% 17-Sep SAT 9/17 PADUCAH P&DF 90.8% 100.0% 100.0% % 86.2% 54.6% rev 04/2/2008 Package Page 9 AMP 24 Hour Clock
: Evansville P&D F 424, 476, 477 rev 03/20/2008 Package Page 10 AMP")
10 Losing Facility Name and Type: Paducah P&D F Current 3D ZIP Code(s): 420 Miles to Gaining Facility: 112 MAP Last Saved: February 13, 2012 Gaining Facility Name and Type: Current 3D ZIP Code(s): Evansville P&D F 424, 476, 477 rev 03/20/2008 Package Page 10 AMP MAP
11 Service Standard Impacts Last Saved: February 13, 2012 Losing Facility: Paducah P&D F Losing Facility 3D ZIP Code(s): Gaining Facility 3D ZIP Code(s): , 476, 477 Based on report prepared by Network Integration Support dated: mm/dd/yyyy Service Standard Changes - Average Daily Volume (data obtained from ODIS is derived from sampling and may vary from actual volume) FCM PRI PER * STD * PSVC ALL CLASSES Overnight % Change All Others % Change Total % Change All % Change All % Change All % Change All % Change All % Change UPGRADE DOWNGRADE TOTAL NET UP+NO CHNG VOLUME TOTAL * - Periodical and Standard mail origin 3-digit ZIP Code to destination 3-digit ZIP Code volume is not available Selected summary fields are transferred to the Executive Summary Service Standard Changes - Pairs FCM PRI PER STD PSVC ALL CLASSES Overnight % Change All Others % Change Total % Change All % Change All % Change All % Change All % Change All % Change UPGRADE DOWNGRADE TOTAL NET rev 10/16/2009 Package Page 11 AMP Service Standard Impacts
12 (WorkBook Tab Notification - 1) Losing Facility: Paducah P&D F Stakeholders Notification Last Saved: February 13, 2012 Stakeholder Notification Page 1 AMP Event: Start of Study Package Page 12 rev 07/16/2008 AMP Stakeholders Notification

13

14

15
16 (1) (2) (3) (4) (5) (6) (7) (8) (9) (10) (11) (12) (13) (14) Current Current Current Current Current Current Current Current Current Current Current Current % Moved to % Moved to Operation Annual FHP Annual TPH or Annual Productivity Annual Operation Annual FHP Annual TPH or Annual Productivity Annual Gaining Losing Numbers Volume NATPH Volume Workhours (TPH or NATPH) Workhour Costs Numbers Volume NATPH Volume Workhours (TPH or NATPH) Workhour Costs Package Page 16 AMP Workhour Costs - Current
17 (1) (2) (3) (4) (5) (6) (7) (8) (9) (10) (11) (12) (13) (14) Current Current Current Current Current Current Current Current Current Current Current Current % Moved to % Moved to Operation Annual FHP Annual TPH or Annual Productivity Annual Operation Annual FHP Annual TPH or Annual Productivity Annual Gaining Losing Numbers Volume NATPH Volume Workhours (TPH or NATPH) Workhour Costs Numbers Volume NATPH Volume Workhours (TPH or NATPH) Workhour Costs Package Page 17 AMP Workhour Costs - Current
18 (1) (2) (3) (4) (5) (6) (7) (8) (9) (10) (11) (12) (13) (14) Current Current Current Current Current Current Current Current Current Current Current Current % Moved to % Moved to Operation Annual FHP Annual TPH or Annual Productivity Annual Operation Annual FHP Annual TPH or Annual Productivity Annual Gaining Losing Numbers Volume NATPH Volume Workhours (TPH or NATPH) Workhour Costs Numbers Volume NATPH Volume Workhours (TPH or NATPH) Workhour Costs Totals Moved to Gain 140,167, ,974,580 72,846 5,216 $3,043,511 Impact to Gain 234,828, ,553, ,866 5,292 $4,994,189 Impact to Lose No Calc $0 Moved to Lose No Calc $0 Total Impact 140,167, ,974,580 72,846 5,216 $3,043,511 Total Impact 234,828, ,553, ,866 5,292 $4,994,189 Totals Non-impacted 0 1,054 4,328 0 $182,063 Non-impacted 0 892,007 5, $210,832 Gain Only 29,177,029 35,386,877 38, $1,562,055 All 140,167, ,975,634 77,175 4,924 $3,225,574 All 264,005, ,832, ,526 4,176 $6,767,076 Total FHP to be Transferred (Average Daily Volume) : 452,154 (This number is carried forward to AMP Worksheet Executive Summary ) Current FHP at Gaining Facility (Average Daily Volume) : 851,631 (This number is carried forward to AMP Worksheet Executive Summary ) Combined Current Workhour Annual Workhour Costs : $9,992,650 (This number is carried forward to the bottom of AMP Worksheet Workhour Costs-Proposed ) Comb Totals Impact to Gain 374,996,477 1,072,528, ,713 5,265 $8,037,700 Impact to Lose No Calc $0 Total Impact 374,996,477 1,072,528, ,713 5,265 $8,037,700 Non-impacted 0 893,061 9, $392,895 Gain Only 29,177,029 35,386,877 38, $1,562,055 All 404,173,506 1,108,808, ,701 4,405 $9,992,650. rev 06/11/2008 Package Page 18 AMP Workhour Costs - Current

19

20

21
22 (1) (2) (3) (4) (5) (6) (7) (8) (9) (10) (11) (12) Proposed Proposed Proposed Proposed Proposed Proposed Proposed Proposed Proposed Proposed Proposed Proposed Operation Annual FHP Annual TPH or Annual Productivity Annual Operation Annual FHP Annual TPH or Annual Productivity Annual Numbers Volume NATPH Volume Workhours (TPH or NATPH) Workhour Costs Numbers Volume NATPH Volume Workhours (TPH or NATPH) Workhour Costs Package Page 22 AMP Workhour Costs - Proposed
23 (1) (2) (3) (4) (5) (6) (7) (8) (9) (10) (11) (12) Proposed Proposed Proposed Proposed Proposed Proposed Proposed Proposed Proposed Proposed Proposed Proposed Operation Annual FHP Annual TPH or Annual Productivity Annual Operation Annual FHP Annual TPH or Annual Productivity Annual Numbers Volume NATPH Volume Workhours (TPH or NATPH) Workhour Costs Numbers Volume NATPH Volume Workhours (TPH or NATPH) Workhour Costs Package Page 23 AMP Workhour Costs - Proposed
24 (1) (2) (3) (4) (5) (6) (7) (8) (9) (10) (11) (12) Proposed Proposed Proposed Proposed Proposed Proposed Proposed Proposed Proposed Proposed Proposed Proposed Operation Annual FHP Annual TPH or Annual Productivity Annual Operation Annual FHP Annual TPH or Annual Productivity Annual Numbers Volume NATPH Volume Workhours (TPH or NATPH) Workhour Costs Numbers Volume NATPH Volume Workhours (TPH or NATPH) Workhour Costs Moved to Gain 0 10,269 5,122 2 $209,118 Impact to Gain 374,996,477 1,072,518, ,715 6,551 $6,367,575 Impact to Lose No Calc $0 Moved to Lose No Calc $0 Total Impact 0 10,269 5,122 2 $209,118 Total Impact 374,996,477 1,072,518, ,715 6,551 $6,367,575 Non Impacted 0 1,054 4,328 0 $182,063 Non Impacted 0 892,007 5, $210,832 Gain Only 29,177,029 35,386,877 44, $1,857,993 All 0 11,323 9,451 1 $391,181 All 404,173,506 1,108,797, ,789 5,186 $8,436,400 Package Page 24 AMP Workhour Costs - Proposed
25 (1) (2) (3) (4) (5) (6) (7) (8) (9) (10) (11) (12) Proposed Proposed Proposed Proposed Proposed Proposed Proposed Proposed Proposed Proposed Proposed Proposed Operation Annual FHP Annual TPH or Annual Productivity Annual Operation Annual FHP Annual TPH or Annual Productivity Annual Numbers Volume NATPH Volume Workhours (TPH or NATPH) Workhour Costs Numbers Volume NATPH Volume Workhours (TPH or NATPH) Workhour Costs (13) New Flow Adjustments at Losing Facility (14) New Flow Adjustments at Gaining Facility Op# FHP TPH/NATPH Workhours Productivity Workhour Cost Op# FHP TPH/NATPH Workhours Productivity Workhour Cost Totals No Calc $0 Totals No Calc $0 Impact to Gain 374,996,477 1,072,528, ,837 6,352 $6,576,693 Combined Current Annual Workhour Cost : $9,992,650 Impact to Lose No Calc $0 (This number brought forward from Workhour Costs - Current ) Total Impact 374,996,477 1,072,528, ,837 6,352 $6,576,693 Non-impacted 0 893,061 9, $392,895 Proposed Annual Workhour Cost : $8,827,581 Gain Only 29,177,029 35,386,877 44, $1,857,993 (Total of Columns 6 and 12 on this page) Tot Before Adj 404,173,506 1,108,808, ,240 4,967 $8,827,581 Lose Adj No Calc $0 Minimum Function 1 Workhour Savings : $632,895 Gain Adj No Calc $0 (This number represents proposed workhour savings with no productivity improvements All 404,173,506 1,108,808, ,240 4,967 $8,827,581 applied to operations at the gaining facility) Function 1 Workhour Savings : $1,165,069 (This number equals the difference in the current and proposed workhour costs above and is carried forward to the Executive Summary ) Comb Totals Cost Impact Comb Current 404,173,506 1,108,808, ,701 4,405 $9,992,650 Proposed 404,173,506 1,108,808, ,240 4,967 $8,827,581 Change 0 0 (28,461) ($1,165,069) Change % 0.0% 0.0% -11.3% -11.7% rev 04/02/2009 Package Page 25 AMP Workhour Costs - Proposed
26
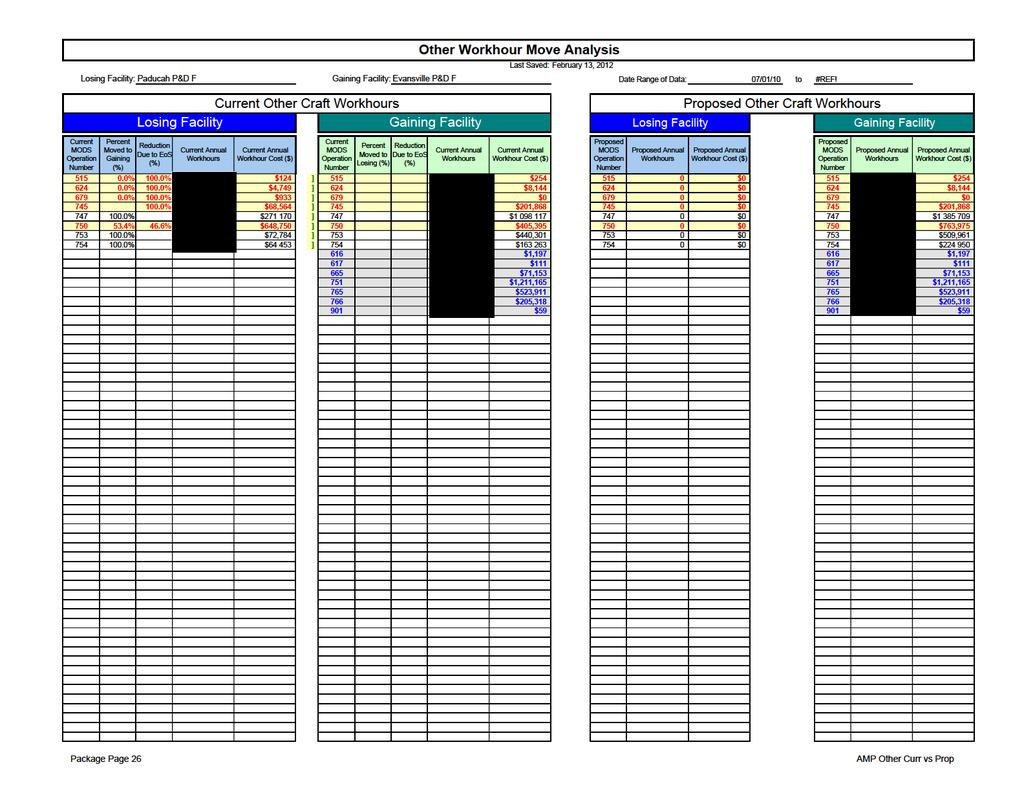
27 Package Page 27 AMP Other Curr vs Prop

28
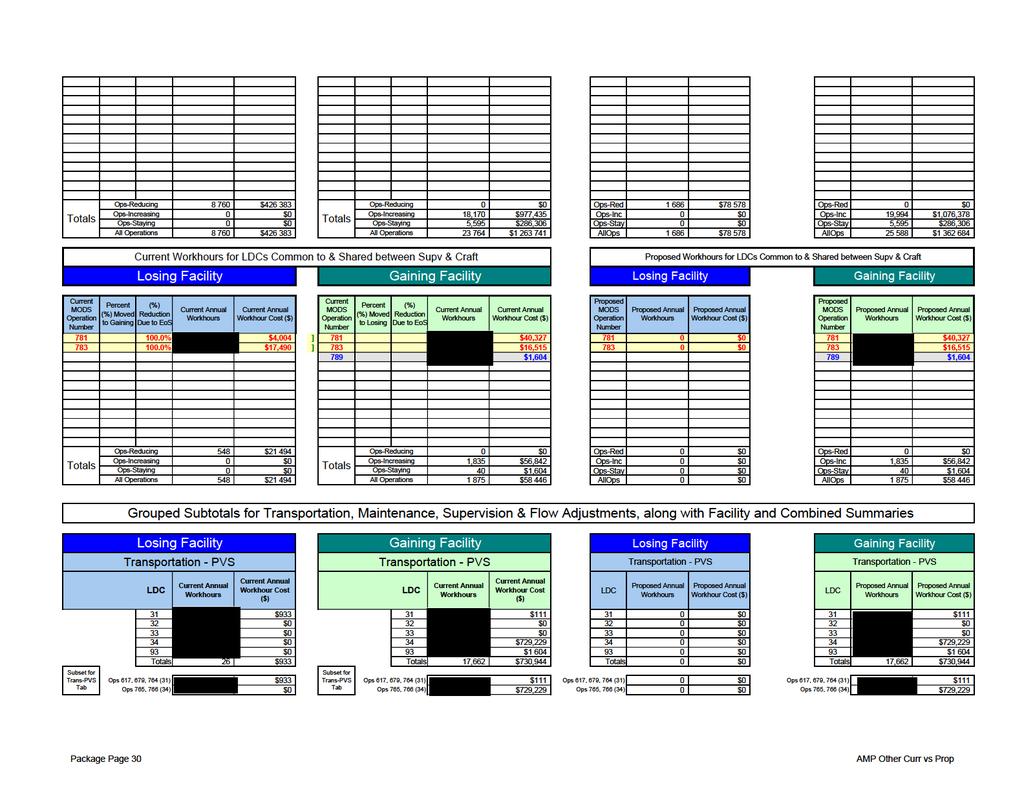
29 Package Page 29 AMP Other Curr vs Prop
30
31 Maintenance Maintenance Maintenance Maintenance LDC Current Annual Workhours Current Annual Workhour Cost ($) LDC Current Annual Workhours Current Annual Workhour Cost ($) LDC Proposed Annual Workhours Proposed Annual Workhour Cost ($) LDC Proposed Annual Workhours Proposed Annual Workhour Cost ($) 36 $ $ $0 36 $ $137, $603, $0 37 $734, $271, $1,098, $0 38 $1,385, $ $ $0 39 $ $17, $16, $0 93 $16,515 Totals 25,665 $1,147,960 Totals 77,666 $3,545,965 Totals 0 $0 Totals 94,609 $4,323,485 Supervisor Summary Supervisor Summary Supervisory Supervisory LDC Current Annual Workhours Current Annual Workhour Cost ($) LDC Current Annual Workhours Current Annual Workhour Cost ($) LDC Proposed Annual Workhours Proposed Annual Workhour Cost ($) LDC Proposed Annual Workhours Proposed Annual Workhour Cost ($) 'Other Craft' Ops (note 1) Transportation Ops (note 2) Maintenance Ops (note 3) Supervisory Ops Supv/Craft Joint Ops (note 4) Total 01 $0 01 $0 01 $0 01 $0 10 $238, $624, $78, $624, $0 20 $0 20 $0 20 $0 30 $0 30 $61, $0 30 $61, $102, $451, $0 35 $550, $0 40 $0 40 $0 40 $0 50 $0 50 $0 50 $0 50 $0 60 $0 60 $0 60 $0 60 $0 70 $0 70 $0 70 $0 70 $0 80 $85, $126, $0 80 $126, $0 81 $0 81 $0 81 $0 88 $0 88 $0 88 $0 88 $0 Totals 8,760 $426,383 Totals 23,764 $1,263,741 Totals 1,686 $78,578 Totals 25,588 $1,362,684 Current - Combined Summary by Sub-Group Special Adjustments - Combined - Proposed + Special Adjustments - Combined - Annual Workhours Annual Dollars Annual Workhours Annual Dollars Annual Workhours Annual Dollars Workhour Change % Change Dollars Change Percent Change 1,735 $71,590 0 $0 1,731 $71,466 (3) -0.2% ($124) -0.2% 17,648 $730,273 0 $0 17,622 $729,340 (26) -0.1% ($933) -0.1% 103,330 $4,693,925 0 $0 94,609 $4,323,485 (8,721) -8.4% ($370,441) -7.9% 32,524 $1,690,124 0 $0 27,275 $1,441,262 (5,250) -16.1% ($248,861) -14.7% 1,585 $45,935 0 $0 1,463 $41,931 (121) -7.7% ($4,004) -8.7% 156,822 $7,231,848 0 $0 142,700 $6,607,484 (14,122) -9.0% ($624,363) -8.6% Change Special Adjustments at Losing Site Special Adjustments at Gaining Site Summary by Facility LDC Proposed MODS Proposed Annual Operation Workhours Number Proposed Annual Workhour Cost ($) LDC Proposed MODS Operation Number Proposed Annual Workhours Proposed Annual Workhour Cost ($) Losing Facility Summary Proposed Annual Workhours Proposed Annual Workhour Cost ($) Gaining Facility Summary Proposed Annual Workhours Proposed Annual Workhour Cost ($) Before 34,576 $1,579,404 Before 122,247 $5,652,443 After $ After $ Adj 0 $0 Adj 0 $0 AfterTot 1,686 $78,578 AfterTot 141,014 $6,528,906 Change (32,889) ($1,500,826) Change 18,767 $876,463 % Diff -95.1% -95 0% % Diff 15.4% 15.5% Notes: 1) less Ops going to 'Trans-PVS' & 'Maintenance' Tabs 2) going to Trans-PVS tab 3) going to Maintenance tab 4) less Ops going to Maintenance' Tabs Combined Summary Total Adj 0 $0 Total Adj 0 $0 Before 156,822 $7,231,848 After 142,700 $6,607,484 Adj 0 $0 AfterTot $ Change (14,122) ($624,363) % Diff -9 0% -8.6% Package Page 31 AMP Other Curr vs Prop
32 Staffing - Management Last Saved: February 13, 2012 Losing Facility: Paducah P&D F Data Extraction Date: Finance Number: (1) Position Title Management Positions (2) (3) (4) (5) (6) Current Auth Staffing Current On-Rolls Proposed Staffing Line Level Difference 1 MGR PROCESSING/DISTRIBUTION FCLTY EAS MGR MAINTENANCE EAS OPERATIONS SUPPORT SPECIALIST EAS SUPV DISTRIBUTION OPERATIONS EAS Package Page 32 AMP Staffing - PCES/EAS
33 Totals (3) Retirement Eligibles: 0 Position Loss: 3 Package Page 33 AMP Staffing - PCES/EAS
34 Gaining Facility: Evansville P&D F Data Extraction Date: Finance Number: (12) Position Title Management Positions (13) (14) (15) (16) (17) Current Auth Staffing Current On-Rolls Proposed Staffing Line Level Difference 1 MGR PROCESSING/DISTRIBUTION FCLTY EAS MGR DISTRIBUTION OPERATIONS EAS MGR MAINTENANCE EAS OPERATIONS SUPPORT SPECIALIST EAS SUPV DISTRIBUTION OPERATIONS EAS SUPV MAINTENANCE OPERATIONS EAS SUPV TRANSPORTATION OPERATIONS EAS SECRETARY (FLD) EAS Package Page 34 AMP Staffing - PCES/EAS
35 Total Retirement Eligibles: 0 Position Loss: (3) Total PCES/EAS Position Loss: 0 (This number carried forward to the Executive Summary) rev 11/05/2008 Package Page 35 AMP Staffing - PCES/EAS
36 Losing Facility: Paducah P&D F Finance Number: (1) (2) (3) (4) (5) (6) Craft Positions Casuals/PSEs Part Time Full Time Total Total On-Rolls On-Rolls On-Rolls On-Rolls Proposed Difference Function 1 - Clerk (30) Function 4 - Clerk Function 1 - Mail Handler Function 4 - Mail Handler Function 1 & 4 Sub-Total (30) Function 3A - Vehicle Service Function 3B - Maintenance (13) Functions Lmtd/Rehab/WC 0 0 Other Functions Total (43) Retirement Eligibles: 13 Staffing - Craft Last Saved: February 13, 2012 Data Extraction Date: 09/21/11 Gaining Facility: Evansville P&D F Finance Number: Data Extraction Date: 09/21/11 (7) (8) (9) (10) (11) (12) Craft Positions Casuals/PSEs Part Time Full Time Total Total On-Rolls On-Rolls On-Rolls On-Rolls Proposed Difference Function 1 - Clerk Function 1 - Mail Handler Function 1 Sub-Total Function 3A - Vehicle Service Function 3B - Maintenance Functions Lmtd/Rehab/WC 0 0 Other Functions Total Retirement Eligibles: 47 Total Craft Position Loss: 16 (This number carried forward to the Executive Summary ) staff remains at Paducah. (13) Notes: Per the Maint AMP Findings The WHEP estimates for Paducah reflects 1 FTE LDC 38 rev 11/05/2008 Package Page 36 AMP Staffing - Craft
37 Maintenance Last Saved: February 13, 2012 Losing Facility: Paducah P&D F Gaining Facility: Evansville P&D F Date Range of Data: Jul : Jun Workhour Activity Current Cost (1) (2) (3) (4) (5) (6) Proposed Proposed Difference Workhour Activity Current Cost Difference Cost Cost LDC 36 Mail Processing Equipment $ 648,750 $ 0 $ (648,750) LDC 36 Mail Processing Equipment $ 1,616,560 $ 1,975,140 $ 358,580 LDC 37 Building Equipment $ 137,237 $ 0 $ (137,237) LDC 37 Building Equipment $ 603,563 $ 734,911 $ 131,347 LDC 38 Building Services $ 271,170 $ 0 $ (271,170) LDC 38 (Custodial Cleaning) Building Services $ 1,098,117 $ 1,385,709 $ 287,592 (Custodial Cleaning) LDC 39 LDC 93 Maintenance Operations Support $ 73,314 $ 0 $ (73,314) LDC 39 Maintenance Operations Support $ 211,210 $ 211,210 $ 0 Maintenance Training $ 17,490 $ 0 $ (17,490) LDC 93 Maintenance $ 16,515 $ 16,515 $ 0 Training Workhour Cost Subtotal $ 1,147,960 $ 0 $ (1,147,960) Workhour Cost $ 3,545,965 $ 4,323,485 $ 777,519 Subtotal Other Related Maintenance & Facility Costs Current Cost Proposed Cost Difference Other Related Maintenance & Facility Costs Current Cost Proposed Cost Difference Total Maintenance Parts, Supplies & Facility Utilities $ 205,853 $ $ (205,853) Total Maintenance Parts, Supplies & $ 550,111 $ 630,498 $ 80,387 Facility Utilities Adjustments (from "Other Curr vs Prop" tab) $ 0 Adjustments (from "Other Curr vs Prop" tab) $ 0 Grand Total $ 1,353,813 $ 0 $ (1,353,813) Grand Total $ 4,096,076 $ 4,953,983 $ 857,906 Annual Maintenance Savings: $495,907 (This number carried forward to the Executive Summary) (7) Notes: rev 04/13/2009 Package Page 37 AMP Maintenance

38
39 Transportation - HCR Last Saved: February 13, 2012 Losing Facility: Paducah P&D F Gaining Facility: Evansville P&D F Type of Distribution to Consolidate: Orig & Dest CET for cancellations: 23:00 CET for OGP: 0:00 Date of HCR Data File: CT for Outbound Dock: 2: Current Current Current Proposed Proposed Proposed Current Current Current Proposed Proposed Proposed Route Annual Annual Cost per Annual Annual Cost per Route Annual Annual Cost per Annual Annual Cost per Numbers Mileage Cost Mile Mileage Cost Mile Numbers Mileage Cost Mile ,252 $636,737 $ ,081 $178,452 $ ,436 $117,320 $ ,081 $178,452 $1.21 Package Page 39 AMP Transportation - HCR
40 Current Current Current Proposed Proposed Proposed Current Current Current Proposed Proposed Proposed Route Annual Annual Cost per Annual Annual Cost per Route Annual Annual Cost per Annual Annual Cost per Numbers Mileage Cost Mile Mileage Cost Mile Numbers Mileage Cost Mile Mileage Cost Mile Package Page 40 AMP Transportation - HCR
41 Current Current Current Proposed Proposed Proposed Current Current Current Proposed Proposed Proposed Route Annual Annual Cost per Annual Annual Cost per Route Annual Annual Cost per Annual Annual Cost per Numbers Mileage Cost Mile Mileage Cost Mile Numbers Mileage Cost Mile Mileage Cost Mile Totals 685, ,081 Totals 148, ,081 Other Other Current Moving Trips from Current Moving Trips from Changes Proposed Result Changes Losing to Gain (-) Gaining Gaining to Lose (-) Losing (+/-) (+/-) Proposed Trip Impacts Proposed Trip Impacts Proposed Result HCR Annual Savings (Losing Facility): $708,907 HCR Annual Savings (Gaining Facility): ($45,150) Total HCR Transportation Savings: $663,757 <<== (This number is summed with Total from 'Trans-PVS' and carried forward to the Executive Summary as Transportation Savings ) rev 11/05/2008 Package Page 41 AMP Transportation - HCR
42 Distribution Changes Last Saved: February 13, 2012 Losing Facility: Paducah P&D F Type of Distribution to Consolidate Orig & Dest Indicate each DMM labeling list affected by placing an If revisions to DMM L005 or DMM L201 are needed, indicate "X" to the left of the list. proposed DMM label change below. (1) (2) DMM Labeling List L005-3-Digit ZIP Code Prefix Groups - SCF Sortation DMM L001 DMM L011 From: x DMM L002 x DMM L201 Action Code* Column A - 3-Digit ZIP Code Prefix Group x DMM L003 DMM L601 DMM L004 DMM L602 D 420 Column B - Label to x DMM L005 DMM L603 To: DMM L006 DMM L604 Action Code* Column A - 3-Digit ZIP Code Prefix Group Column B - Label to DMM L007 DMM L605 CT 424, 476, 477 DMM L008 DMM L606 CT 420, 424, 476, 477 *Action Codes: A=add D=delete CF-change from CT=change to DMM L009 DMM L607 Important Note: Section 2 & 3 illustrate possible changes to DMM labeling lists. Section 2 relates to consolidation of Destination DMM L010 DMM L801 Operations. Section 3 pertains to Originating Operations. The Area Distribution Network group will submit appropriate requests for DMM changes after AMP approval. (3) DMM Labeling List L201 - Periodicals Origin Split Action Code* Column A - Entry ZIP Codes Column B - 3-Digit ZIP Code Destinations Column C - Label to Column C - Label to Action Code* Column A - Entry ZIP Codes Column B - 3-Digit ZIP Code Destinations Column C - Label to Action Code* Column A - Entry ZIP Codes Column B - 3-Digit ZIP Code Destinations Column C - Label to Action Code* Column A - Entry ZIP Codes Column B - 3-Digit ZIP Code Destinations Column C - Label to *Action Codes: A=add D=delete CF-change from CT=change to (4) Drop Shipments for Destination Entry Discounts - FAST Appointment Summary Report Month Losing/Gaining NASS Total No-Show Late Arrival Open Closed Unschd Facility Name Code Schd Appts Count % Count % Count % Count % Count 11-Jul Losing Facility 420 Paducah % 32 14% 0 0% % 0 11-Aug Losing Facility 420 Paducah % 29 12% 0 0% % 0 11-Jul Gaining Facility 476 Evansville % 53 21% 0 0% % 5 11-Aug Gaining Facility 476 Evansville % 62 24% 0 0% % 6 (5) Notes rev 5/14/2009 Package Page 42 AMP Distr bution Changes
43 Losing Facility: Paducah P&D F Data Extraction Date: MPE Inventory Last Saved: February 19, 2012 Gaining Facility: Evansville P&D F (1) (2) (3) (4) (5) (6) (7) (8) Current Number Proposed Number Current Number Proposed Number Equipment Change Relocation Costs Equipment Difference Equipment Difference Type Type AFCS 3 0 (3) AFCS 2 0 (2) (5) AFCS AFCS AFSM - ALL 0 0 AFSM - ALL $101,401 APPS 0 0 APPS CIOSS 0 0 CIOSS CSBCS 0 0 CSBCS DBCS 3 0 (3) DBCS 9 7 (2) (5) DBCS-OSS 0 0 DBCS-OSS DIOSS 1 0 (1) DIOSS $13,786 FSS 0 0 FSS SPBS 0 0 SPBS $120,438 UFSM 1 0 (1) UFSM 0 0 (1) FC / MICRO MARK 0 0 FC / MICRO MARK ROBOT GANTRY 0 0 ROBOT GANTRY HSTS / HSUS 0 0 HSTS / HSUS LCTS / LCUS 0 0 LCTS / LCUS LIPS 2 0 (2) LIPS 0 0 (2) MPBCS-OSS 0 0 MPBCS-OSS TABBER 0 0 TABBER PIV 0 0 PIV LCREM 0 0 LCREM Mail Processing Equipment Relocation Costs from Losing to Gaining Facility: $235,625 (9) Notes: AFSM-ALL and SPBS equipment will be relocated to the Evansville IL MP Annex. The relocation costs will be absorbed by the Evansville IL P&DF (This number is carried forward to Space Evaluation and Other Costs ) rev 03/04/2008 Package Page 43 AMP MPE Inventory
44 Losing Facility: Paducah P&D F 5-Digit ZIP Code: Data Extraction Date: 11/04/11 Customer Service Issues Last Saved: February 13, Digit ZIP Code: Digit ZIP Code: 3-Digit ZIP Code: 3-Digit ZIP Code: Current Current Current Current 1. Collection Points Mon. - Fri. Sat. Mon. - Fri. Sat. Mon. - Fri. Sat. Mon. - Fri. Sat. Number picked up before 1 p.m Number picked up between 1-5 p.m Number picked up after 5 p.m Total Number of Collection Points How many collection boxes are designated for "local delivery"? NONE 3. How many "local delivery" boxes will be removed as a result of AMP? NONE 4. Delivery Performance Report Quarter/FY Percent % Carriers returning before 5 p.m. Qtr 4/FY % Qtr 3/FY % Qtr 2/FY % Qtr 1/FY % 5. Retail Unit Inside Losing Facility (Window Service Times) 6. Business (Bulk) Mail Acceptance Hours Current Proposed Start End Start End Start End Start End Monday 8:30am 5:00pm 8:30am 5:00pm Monday 9:00am 4:00pm 9:00am 4:00pm Tuesday 8:30am 5:00pm 8:30am 5:00pm Tuesday 9:00am 4:00pm 9:00am 4:00pm Wednesday 8:30am 5:00pm 8:30am 5:00pm Wednesday 9:00am 4:00pm 9:00am 4:00pm Thursday 8:30am 5:00pm 8:30am 5:00pm Thursday 9:00am 4:00pm 9:00am 4:00pm Friday 8:30am 5:00pm 8:30am 5:00pm Friday 9:00am 4:00pm 9:00am 4:00pm Saturday Closed Closed Closed Closed Saturday Closed Closed Closed Closed Current Proposed 7. Can customers obtain a local postmark in accordance with applicable policies in the Postal Operations Manual? NO 8. Notes: Gaining Facility: Evansville P&D F 9. What postmark will be printed on collection mail? Line 1 Line 2 Evansville IN OCT 2011 PM 1 T rev 6/18/2008 Package Page 44 AMP Customer Service Issues
45 Space Evaluation and Other Costs Losing Facility: Paducah P&D F Last Saved: February 13, 2012 Space Evaluation 1. Affected Facility Facility Name Street Address: City, State ZIP: Paducah P&D F 300 S 4th St Paducah KY Lease Information. (If not leased skip to 3 below.) Enter annual lease cost Enter lease expiration date Enter lease options/terms $0 3. Current Square Footage Enter the total interior square footage of the facility Enter gained square footage expected with the AMP 42,541 42, Planned use for acquired space from approved AMP Preliminary plans are to relocated the Paducah Carrier Annex into the old P&DF. This would elimina a lease of $101,500 annually, and the plant could also be utilized as a Transportation Hu BMEU and main Retail Unit could stay intact 5. Facility Costs 6. Savings Information Enter any projected one-time facility costs: Space Savings ($): $260,000 (This number shown below under One-Time Costs section. $0 (This number carried forward to the Executive Summary ) 7. Notes One-Time Costs Employee Relocation Costs: Mail Processing Equipment Relocation Costs: (from MPE Inventory ) Facility Costs: (from above) Total One-Time Costs: $0 $235,625 $260,000 $495,625 (This number carried forward to Executive Summary ) Remote Encoding Center Cost per 1000 Losing Facility: Paducah P&D F YTD Range of Report: 07/01/10 : 06/30/11 Gaining Facility: Evansville P&D F (1) Product Letters Flats PARS COA PARS Redirects APPS (2) Associated REC Salt Lake City Utah Salt Lake City Utah Salt Lake City Utah Salt Lake City Utah Salt Lake City Utah (3) (4) (5) (6) Current Cost per 1,000 Images Product Associated REC $29.83 Letters Salt Lake City UT $29.83 $29.67 Flats Salt Lake City UT $29.67 $ PARS COA Salt Lake City UT $ $36.46 PARS Redirects Salt Lake City UT $36.46 $30.76 APPS Salt Lake City UT $30.76 rev 9/24/2008 Current Cost per 1,000 Images Package Page 45 AMP Space Evaluation and Other Costs
----- AMP Data Entry Page -----
 ----- AMP Data Entry Page ----- 1. Losing Facility Information Type of Distribution to Consolidate: Destinating Non-MODS/Non-BPI Office Facility Name & Type: Street Address: City: Centralia CSMPC 314 S
----- AMP Data Entry Page -----
 Type of Distribution to Consolidate: Orig & Dest Non-MODS/Non-BPI Office Facility Name & Type: Street Address: City: Carbondale CSMPC 1301 E Main St Carbondale State: IL 5D Facility ZIP Code: 62901 District:
----- AMP Data Entry Page -----
 Type of Distribution to Consolidate: Orig & Dest Non-MODS/Non-BPI Office Facility Name & Type: Street Address: City: Owensboro CSMPC 54 Bon Harbor Hls Owensboro State: KY 5D Facility ZIP Code: 42301 District:
----- AMP Data Entry Page -----
 ----- AMP Data Entry Page ----- 1. Losing Facility Information Type of Distribution to Consolidate: Destinating MODS/BPI Office Facility Name & Type: Street Address: City: Panama City FL P&DF 1336 Sherman
----- AMP Data Entry Page -----
 ----- AMP Data Entry Page ----- 1. Losing Facility Information Type of Distribution to Consolidate: Destinating MODS/BPI Office Facility Name & Type: Street Address: City: Columbus GA CSMPC 3916 Milgen
August 13, Certified Mail Tracking Number:
 August 13, 2013 Mr. Cliff Guffey President American Postal Workers Union, AFL-CIO 1300 L Street, NW Washington, DC 20005-4128 Certified Mail Tracking Number: 7013 1090 0002 44351572 Dear Cliff: As information,
March 12, Certified Mail Tracking Number:
 March 12, 2014 Mr. Mark Dimondstein President American Postal Workers Union, AFL-CIO 1300 L Street, NW Washington, DC 20005-4128 Certified Mail Tracking Number: 7013 1090 0002 4435 8007 Dear Mark: As information,
With the completion of this project, we would like to follow-up on the projections as well as highlight a few other items:
 TO: FROM: Mayor and Council Interim City Manager Rebecca Underhill, Director of Finance DATE: February 28, 2014 SUBJECT: Water Meter Project Analysis On March 28, 2012, Acting City Manager Mike Loftin
Q1 Fiscal 2019 Statistics
 Q1 Fiscal 2019 Statistics FedEx Corporation Financial and Operating Statistics First Quarter Fiscal 2019 September 17, 2018 This report is a statistical supplement to FedEx s interim financial reports
SYSTEM BRIEF DAILY SUMMARY
 SYSTEM BRIEF SUMMARY * ANNUAL (PEAK HOURS 7:00 AM TO 10:00 PM MON-SAT) MaxTemp NEL (MWH) Hr Ending Hr Ending LOAD ENERGY (MWH) INCREMENTAL COST DAY DATE Civic TOTAL MAXIMUM @Max MINIMUM @Min FACTOR ON
JANUARY 2017 BOARD INFORMATION PACKAGE
 JANUARY 2017 BOARD INFORMATION PACKAGE MEMORANDUM TO: Members of the Airport Authority FROM: Lew Bleiweis, Executive Director DATE: January 13, 2017 Financial Report (document) Informational Reports: A.
EZ Travel Form. General Tips for using the EZ Travel Form 1. Enable Excel Macros. 2. Always use the Tab key to move between fields when entering data.
 EZ Travel Form General Tips for using the EZ Travel Form 1. Enable Excel Macros. 2. Always use the Tab key to move between fields when entering data. 1. General Info Enter the claimants personal information
October 2013 Passenger and Cargo Traffic Statistics Reno-Tahoe International Airport
 October 2013 Passenger and Cargo Traffic Statistics Reno-Tahoe International Airport December 4, 2013 U.S. DOMESTIC INDUSTRY OVERVIEW FOR OCTOBER 2013 All RNO Carriers Systemwide year over year comparison
Q1 Fiscal 2018 Statistics
 Q1 Fiscal 2018 Statistics FedEx Corporation Financial and Operating Statistics First Quarter Fiscal 2018 September 19, 2017 This report is a statistical supplement to FedEx s interim financial reports
AUGUST 2008 MONTHLY PASSENGER AND CARGO STATISTICS
 Inter-Office Memo Reno-Tahoe Airport Authority Date: October 2, 2008 To: Statistics Recipients From: Tom Medland, Director Air Service Business Development Subject: RENO-TAHOE INTERNATIONAL AIRPORT PASSENGER
JANUARY 2018 BOARD INFORMATION PACKAGE
 JANUARY 2018 BOARD INFORMATION PACKAGE MEMORANDUM TO: Members of the Airport Authority FROM: Lew Bleiweis, Executive Director DATE: January 19, 2018 Financial Report (document) Informational Reports: A.
PORT OF SEATTLE MEMORANDUM. COMMISSION AGENDA Item No. 6a ACTION ITEM Date of Meeting August 23, 2016
 PORT OF SEATTLE MEMORANDUM COMMISSION AGENDA Item No. 6a ACTION ITEM Date of Meeting August 23, 2016 DATE: TO: FROM: Michael Ehl, Director, Airport Operations Wayne Grotheer, Director, Aviation Project
Report for Jan-Nov-2006 pdf. General Statistics
 Report for Jan-Nov-006 pdf Time range: /8/006 07:3:37 - /3/006 3:50:6 Generated on Mon Jan 0, 007-9:3:5 General Statistics Summary Summary Hits Total Hits 97,06 Average Hits per Day 89 Average Hits per
Industry Update. ACI-NA Winter Board of Directors Meeting February 3, 2016 Orlando, FL
 Industry Update ACI-NA Winter Board of Directors Meeting February 3, 2016 Orlando, FL U.S. & Canadian GDP 8% 6% 4% U.S.* Canada** Estimate by BEA as of 02/11/16 2% 0% -2% -4% -6% -8% -10% The U.S. economy
SAS Group Q Teleconference
 SAS Group Q4 2012 Teleconference December 12, 2012 1 Break-even result in 2012 despite 1.6 bn SEK higher fuel cost 23 MSEK EBT (before non-recurring items) despite 1.6 bn SEK higher fuel cost Positive
APRIL 2016 BOARD INFORMATION PACKAGE
 APRIL 2016 BOARD INFORMATION PACKAGE MEMORANDUM TO: Members of the Airport Authority FROM: Lew Bleiweis, Executive Director DATE: April 8, 2016 Financial Report (document) Informational Reports: A. February,
Sound Transit Operations August 2015 Service Performance Report. Ridership
 Ridership Total Boardings by Mode Mode Aug-14 Aug-15 % YTD-14 YTD-15 % ST Express 1,534,241 1,553,492 1.3% 11,742,839 12,354,957 5.2% Sounder 275,403 326,015 18.4% 2,139,086 2,463,422 15.2% Tacoma Link
Dallas Love Field Update. Dallas City Council Briefing February 18, 2015
 Dallas Love Field Update Dallas City Council Briefing February 18, 2015 Purpose Construction Update Impacts of Wright Amendment Repeal Increase in operations/passengers/ projections Concessions performance
2009 Muskoka Airport Economic Impact Study
 2009 Muskoka Airport Economic Impact Study November 4, 2009 Prepared by The District of Muskoka Planning and Economic Development Department BACKGROUND The Muskoka Airport is situated at the north end
Q4 Fiscal 2018 Statistics
 Q4 Fiscal 2018 Statistics FedEx Corporation Financial and Operating Statistics Fourth Quarter Fiscal 2018 June 19, 2018 This report is a statistical supplement to FedEx s interim financial reports and
September 2013 Passenger and Cargo Traffic Statistics Reno-Tahoe International Airport
 September 2013 Passenger and Cargo Traffic Statistics Reno-Tahoe International Airport October 31, 2013 U.S. DOMESTIC INDUSTRY OVERVIEW FOR SEPTEMBER 2013 All RNO Carriers Systemwide year over year comparison
Q3 Fiscal 2018 Statistics
 Q3 Fiscal 2018 Statistics FedEx Corporation Financial and Operating Statistics Third Quarter Fiscal 2018 March 20, 2018 This report is a statistical supplement to FedEx s interim financial reports and
Local Grievance # Union Facts and Contentions (Block #17 on PS Form 8190):
:") Local Grievance # Issue Statement (Block #15 on PS Form 8190): Did management violate Sections 211.1 and 214 of the M-39 Handbook via Article 19 of the National Agreement by failing to conduct a proper
Local Grievance # Issue Statement (Block #15 on PS Form 8190): Did management violate Sections 211.1 and 214 of the M-39 Handbook via Article 19 of the National Agreement by failing to conduct a proper
Educational Assistant Staff Base Wage Determination. Information & Input Session
 Educational Assistant Staff Base Wage Determination Information & Input Session Educational Assistant Staff Base Wage Determination Group Meeting - Purpose District Sharing Information Creating a Common
Corporate presentation CIBC Whistler Institutional Investor Conference January 21, 2010
 Corporate presentation CIBC Whistler Institutional Investor Conference January 21, 2010 Forwardlooking statement Certain information in this presentation and statements made during this presentation, including
CWC LA - Cash Balance (January 2012)
") CWC LA - Cash Balance 2012-13 (January 2012) 1,200,000 Cash Balance 1,000,000 800,000 ($1,000s) 600,000 400,000 200,000 - CWC LA - Actuals/Projected CWC LA - ed (Nov) 1 1 CWC Hollywood - Financial Dashboard
CWC LA - Cash Balance 2012-13 (January 2012) 1,200,000 Cash Balance 1,000,000 800,000 ($1,000s) 600,000 400,000 200,000 - CWC LA - Actuals/Projected CWC LA - ed (Nov) 1 1 CWC Hollywood - Financial Dashboard
RIDERSHIP TRENDS. October 2017
 RIDERSHIP TRENDS October 2017 Prepared by the Division of Strategic Capital Planning December 2017 Table of Contents Executive Summary...1 Ridership...3 Estimated Passenger Trips by Line...3 Estimated
Q3 Fiscal 2017 Statistics
 Q3 Fiscal 2017 Statistics FedEx Corporation Financial and Operating Statistics Third Quarter Fiscal 2017 February 28, 2017 This report is a statistical supplement to FedEx s interim financial reports and
November 2013 Passenger and Cargo Traffic Statistics Reno-Tahoe International Airport
 November 2013 Passenger and Cargo Traffic Statistics Reno-Tahoe International Airport December 26, 2013 U.S. DOMESTIC INDUSTRY OVERVIEW FOR NOVEMBER 2013 All RNO Carriers Domestic Systemwide year over
December 2013 Passenger and Cargo Traffic Statistics Reno-Tahoe International Airport
 December 2013 Passenger and Cargo Traffic Statistics Reno-Tahoe International Airport January 24, 2014 U.S. DOMESTIC INDUSTRY OVERVIEW FOR DECEMBER 2013 All RNO Carriers Domestic Systemwide year over year
Operating Budget Data
 J00I00 Maryland Aviation Administration Maryland Department of Transportation Operating Budget Data ($ in Thousands) FY 15 FY 16 FY 17 FY 16-17 % Change Actual Working Allowance Change Prior Year Special
Sound Transit Operations March 2018 Service Performance Report. Ridership
 March 218 Service Performance Report Ridership Total Boardings by Mode Mar-17 Mar-18 % YTD-17 YTD-18 % ST Express 1,622,116 1,47,79-4.6% 4,499,798 4,428,14-1.6% Sounder 393,33 39,6.% 1,74,96 1,163,76 8.3%
RIDERSHIP TRENDS. August 2018
 RIDERSHIP TRENDS August Prepared by the Division of Strategic Capital Planning October Table of Contents Executive Summary...1 Ridership...3 Estimated Passenger Trips by Line...3 Estimated Passenger Trips
APPENDIX 1 BACKGROUND AND OVERVIEW OF THE GS/OAS TRAVEL
 1. THE GS/OAS TRAVEL PROFILE APPENDIX 1 BACKGROUND AND OVERVIEW OF THE GS/OAS TRAVEL The travel of the General Secretariat of the Organization of American States (GS/OAS) is focused on the Western Hemisphere.
Presentation on Results for the 3rd Quarter FY Idemitsu Kosan Co.,Ltd. February 2, 2016
 Presentation on Results for the 3rd Quarter FY 2015 Idemitsu Kosan Co.,Ltd. February 2, 2016 Table of Contents 1. 3 rd Quarter FY 2015 Financials (1) Overview (2) Segment Information 2. Forecast for FY
RAPID CITY REGIONAL AIRPORT
 RAPID CITY REGIONAL AIRPORT Budget: $16,232,274 Full time Employees: 24 Mission Statement It is the mission of the Rapid City Regional Airport Board to provide safe, efficient, environmentally sensitive,
Sound Transit Operations March 2017 Service Performance Report. Ridership. Total Boardings by Mode
 March 217 Service Performance Report Ridership ST Express Sounder Tacoma Link Link Paratransit Mar-16 Mar-17 % 1,83,4 1,621,49 2.4% 37,496 82,631 1,264,47 3,821 Total Boardings by Mode 389,98 87,39 1,89,43,297
SAS Group Q2 2012/13. Q2 Restructuring programme moving KPIs in the right direction
 SAS Group Q2 2012/13 1 Q2 Restructuring programme moving KPIs in the right direction Operating revenues +1.6%* Yield improvement of +2.7%* Forceful implementation of 4XNG plan: Unit cost down by 10.7%
Sound Transit Operations February 2018 Service Performance Report. Ridership
 February 218 Service Performance Report Ridership Total Boardings by Mode Feb-17 Feb-18 % YTD-17 YTD-18 % ST Express 1,373,96 1,372,88 -.1% 2,877,294 2,88,719.1% Sounder 314,96 32,187 11.9% 681,923 768,69
Runway Scheduling Limits Summer 2015
 Appendix 1 Runway Scheduling Limits Summer 2015 Arrivals Hour (UTC) 05 06 07 08 09 10 11 12 13 14 15 16 17 18 19 20 21 Average Total Summer 2014 38 39 37 40 40 41 40 43 43 41 41 44 44 43 38 44 20 39.8
RIDERSHIP TRENDS. January 2018
 RIDERSHIP TRENDS January 2018 Prepared by the Division of Strategic Capital Planning March 2018 Table of Contents Executive Summary...1 Ridership...3 Estimated Passenger Trips by Line...3 Estimated Passenger
Q1 Fiscal 2011 Statistics
 Q1 Fiscal 2011 Statistics FedEx Corporation Financial and Operating Statistics First Quarter Fiscal 2011 September 16, 2010 This report is a statistical supplement to FedEx s interim financial reports
January 2014 Passenger and Cargo Traffic Statistics Reno-Tahoe International Airport
 January 2014 Passenger and Cargo Traffic Statistics Reno-Tahoe International Airport March 12, 2014 U.S. DOMESTIC INDUSTRY OVERVIEW FOR DECEMBER 2013 All RNO Carriers Domestic Systemwide year over year
Presentation on Results for the 2nd Quarter FY Idemitsu Kosan Co.,Ltd. November 14, 2018
 Presentation on Results for the 2nd Quarter FY 2018 Idemitsu Kosan Co.,Ltd. November 14, 2018 Table of Contents 1. FY 2018 2nd Quarter Financials (1) Overview (2) Segment Information 2. Reference Materials
Q1 Fiscal 2009 Statistics
 Q1 Fiscal 2009 Statistics FedEx Corporation Financial and Operating Statistics First Quarter Fiscal 2009 September 18, 2008 This report is a statistical supplement to FedEx s interim financial reports
TABLE OF CONTENTS. Coral Springs Charter High School and Middle School Job No Page 2
 Job No. 15-019 Page 2 TABLE OF CONTENTS 1.0 INTRODUCTION... 4 2.0 EXISTING CONDITIONS... 5 3.0 TRAFFIC GENERATION... 7 4.0 TRIP DISTRIBUTION... 8 5.0 FUTURE CONDITIONS... 8 6.0 SITE ACCESS...13 7.0 CONCLUSION...13
SEPTEMBER 2015 BOARD INFORMATION PACKAGE
 SEPTEMBER 2015 BOARD INFORMATION PACKAGE MEMORANDUM TO: Members of the Airport Authority FROM: Lew Bleiweis, Executive Director DATE: September 11, 2015 Financial Report (document) Informational Reports:
Produced by: Destination Research Sergi Jarques, Director
 Produced by: Destination Research Sergi Jarques, Director Economic Impact of Tourism Norfolk - 2017 Contents Page Summary Results 2 Contextual analysis 4 Volume of Tourism 7 Staying Visitors - Accommodation
Sound Transit Operations June 2016 Service Performance Report. Ridership
 Ridership Total Boardings by Mode Mode Jun-15 Jun-16 % YTD-15 YTD-16 % ST Express 1,622,222 1,617,420-0.3% 9,159,934 9,228,211 0.7% Sounder 323,747 361,919 11.8% 1,843,914 2,099,824 13.9% Tacoma Link 75,396
HOLIDAY TIME REPORTING AMBULATORY CARE NURSING FOR. Presented by The UMHS Payroll Office 2015
 IDAY TIME REPORTING FOR AMBULATORY CARE NURSING Presented by The UMHS Payroll Office 2015 Presented by: Melissa Henes, Payroll Analyst Kim Watson, Payroll Analyst Special Guest: Jerri Atkins Human Resources
Isles of Scilly Visitor Survey Final report. Produced for and on behalf of the Islands Partnership. May 2017
 Isles of Scilly Visitor Survey 2016 Final report Produced for and on behalf of the Islands Partnership by The South West Research Company Ltd. May 2017 Contents Page Summary 3 6 Introduction 7 10 Visitor
LAKE COVE HOTEL RESORT / REND LAKE
 LAKE COVE HOTEL RESORT / REND LAKE 14711 FREEWAY LANE WHITTINGTON, IL 62897 Kurt Lord Managing Director 314.862.5566 x14 kurt.lord@svn.com Cheri Simon Advisor 314.862.5566 cheri.simon@svn.com SVN Lord
Air China Limited Annual Results. March Under IFRS
 Air China Limited 21 Annual Results Under IFRS March 211 Agenda Part 1 Highlights Part 2 Business Overview Part 3 Financial Overview Part 4 Outlook 2 Part 1 Highlights Steady Economic Growth; Asia Pacific
Tourism Trends. Humphrey Walwyn Head of VisitEngland Research October 2018
 Tourism Trends Humphrey Walwyn Head of VisitEngland Research October 2018 1 England Research & Evaluation GBTS - Overnights (statutory research & official statistic) GBDVS - Day (statutory/ official) Occupancy
Produced by: Destination Research Sergi Jarques, Director
 Produced by: Destination Research Sergi Jarques, Director Economic Impact of Tourism North Norfolk District - 2016 Contents Page Summary Results 2 Contextual analysis 4 Volume of Tourism 7 Staying Visitors
Produced by: Destination Research Sergi Jarques, Director
 Produced by: Destination Research Sergi Jarques, Director Economic Impact of Tourism Norfolk - 2016 Contents Page Summary Results 2 Contextual analysis 4 Volume of Tourism 7 Staying Visitors - Accommodation
Administration and Projects Committee Meeting STAFF REPORT July 3, 2014 Page 2 of 2 Agreement Consultant Project General Scope CT 107 URS Corporation
 Administration and Projects Committee Meeting STAFF REPORT Meeting Date: July 3, 2014 Subject Summary of Issues Recommendations Authorize s to Various Agreements Over the years, the Authority has contracted
Analysts and Investors conference call. Q results. 15 May 2013
 Analysts and Investors conference call Q1 2013 results 15 May 2013 Management summary Key messages of Q1 2013 +6% +9% +3.3%p. Q1 2013 operational KPIs are in line with 109.7 116.2 6.5 7.1 82.3 85.6 expectations,
May Air Traffic Statistics. Prepared by the Office of Corporate Risk and Strategy
 May 214 Air Traffic Statistics Prepared by the Office of Corporate Risk and Strategy Commercial Total Int'l Dom Air Traffic Summary May 214 Passenger Activity (in Millions) Current Month Year-to-Date Last
Statistics of Air, Water, and Land Transport Statistics of Air, Water, and Land. Transport Released Date: August 2015
 Statistics of Air, Water, and Land Transport 2014 2013 1 Released Date: August 2015 Table of Contents Introduction... 4 Key Points... 5 1. Air Transport... 6 1.1 Aircraft movements... 6 1.2 Number of passengers...
Passenger and Cargo Statistics Report
 Passenger and Cargo Statistics Report RenoTahoe International Airport December 2015 U.S. DOMESTIC INDUSTRY OVERVIEW FOR DECEMBER 2015 All RNO Carriers Domestic Systemwide year over year comparison Average
AIRPORT IRREGULAR OPERATIONS (IROPS) PLAN. South Bend International Airport (SBN) St. Joseph County Airport Authority
 PLAN. South Bend International Airport (SBN) St. Joseph County Airport Authority") AIRPORT IRREGULAR OPERATIONS (IROPS) PLAN (SBN) St. Joseph County Airport Authority TABLE OF CONTENTS TABLE OF CONTENTS... 2 INTRODUCTION... 3 AIRPORT INFORMATION... 3 CONTACT INFORMATION... 4 PASSENGER
AIRPORT IRREGULAR OPERATIONS (IROPS) PLAN (SBN) St. Joseph County Airport Authority TABLE OF CONTENTS TABLE OF CONTENTS... 2 INTRODUCTION... 3 AIRPORT INFORMATION... 3 CONTACT INFORMATION... 4 PASSENGER
Kentucky Lock Project Update Inland Waterways Users Board Meeting No. 84
 Kentucky Lock Project Update Inland Waterways Users Board Meeting No. 84 MR. DON GETTY PROJECT MANAGER Kentucky Lock Addition Nashville District 19 July 2017 The views, opinions and findings contained
Standardizes the handling of visa-regressed cases throughout USCIS field offices nationwide;
 INTERIM MEMO FOR COMMENT Posted: 01-11-2011 Comment period ends: 01-26-2011 This memo is in effect until further notice. U.S. Citizenship and Immigration Services Office of the Director (MS 2000) Washington,
U.S. DOMESTIC INDUSTRY OVERVIEW FOR OCTOBER 2010 All RNO Carriers Systemwide year over year comparison
 Inter-Office Memo Reno-Tahoe Airport Authority Date: November 22, 2010 To: Chairman and Board of Trustees From: Krys T. Bart, A.A.E., President/CEO Subject: RENO-TAHOE INTERNATIONAL AIRPORT OCTOBER 2010
January 2018 Air Traffic Activity Summary
 January 2018 Air Traffic Activity Summary Jan-2018 Jan-2017 CY-2018 CY-2017 Passengers 528,947 505,421 4.7% 528,947 505,421 4.7% Passengers 537,332 515,787 4.2% 537,332 515,787 4.2% Passengers 1,066,279
2019 Vacation Bidding
 2019 Vacation Bidding Flight Attendant Guide Published September 24, 2018 Published September 24, 2018 1 2019 FLIGHT ATTENDANT VACATION TIMELINE Vacation Timeline Open Date & Time Close Date & Time Posting
Section (a)(1). Description of Projects Impose and Use
(1). Description of Projects Impose and Use") November 21, 2017 Mrs. Kelly Lane SkyWest Airlines 444 South River Road St. George, UT 84790 RE: Notice of Intent to Impose and Use a New Passenger Facility Charge Bert Mooney Airport Butte, Montana Dear
November 21, 2017 Mrs. Kelly Lane SkyWest Airlines 444 South River Road St. George, UT 84790 RE: Notice of Intent to Impose and Use a New Passenger Facility Charge Bert Mooney Airport Butte, Montana Dear
Public Notice of Opportunity to Comment on Los Angeles World Airports Passenger Facility Charge Application at Los Angeles International Airport
 Re: Public Notice of Opportunity to Comment on Los Angeles World Airports Passenger Facility Charge Application at Los Angeles International Airport Los Angeles World Airports (LAWA) intends to submit
Q4 Fiscal 2017 Statistics
 Q4 Fiscal 2017 Statistics FedEx Corporation Financial and Operating Statistics Fourth Quarter Fiscal 2017 July 17, 2017 This report is a statistical supplement to FedEx s interim financial reports and
Air Berlin PLC AGM 06 June 2013 London
 Air Berlin PLC AGM 06 June 2013 London airberlin a strong European carrier Market position as of 31 December 2012 No. 2 in core market: Germany / Austria / Switzerland No. 7 in Europe with 33.3 m guests
Current Operations CHAPTER II INTRODUCTION DESCRIPTION OF TRANSPORTATION SERVICES
 Chapter II CHAPTER II Current Operations INTRODUCTION This chapter provides an overview of Centre Area Transportation Authority (CATA). CATA is a joint municipal authority formed under the Municipal Authorities
Presentation on Results for the 2nd Quarter FY Idemitsu Kosan Co.,Ltd. November 1, 2016
 Presentation on Results for the 2nd Quarter FY 2016 Idemitsu Kosan Co.,Ltd. November 1, 2016 Table of Contents 1. 2nd Quarter FY 2016 Financials (1) Overview (2) Segment Information 2. Reference Materials
U.S. DOMESTIC INDUSTRY OVERVIEW FOR MAY 2009
 Inter-Office Memo Reno-Tahoe Airport Authority Date: June 30, 2009 To: Statistics Recipients From: Krys T. Bart, A.A.E., President/CEO Subject: RENO-TAHOE INTERNATIONAL AIRPORT PASSENGER STATISTICS U.S.
MONTHLY OPERATIONS REPORT DECEMBER 2015
 MONTHLY OPERATIONS REPORT DECEMBER 215 Table of Contents DECEMBER 215 Section Page December Highlights... 3 Strategic Goals Progress Update... 4 Ridership... 6 Revenue... 9 Expenses... 1 System Summary...
Q1 Fiscal 2010 Statistics
 Q1 Fiscal 2010 Statistics FedEx Corporation Financial and Operating Statistics First Quarter Fiscal 2010 September 17, 2009 This report is a statistical supplement to FedEx s interim financial reports
Salt Lake City International Airport April 23, 2013 Budget Briefing. Page 1
 Budget Briefing Fiscal Year 2014 Budget Honorable Members of the City Council April 23, 2013 Page 1 FY 2014 Budget Goals and Objectives Develop and implement a plan of execution for the terminal redevelopment
MONTHLY OPERATIONS REPORT SEPTEMBER 2015
 MONTHLY OPERATIONS REPORT SEPTEMBER 215 Table of Contents SEPTEMBER 215 Section Page September Highlights... 3 Strategic Goals Progress Update... 4 Ridership... 6 Revenue... 9 Expenses... 1 System Summary...
Myth Busting MyTravel. Kim Coleman and Nancy Herbst 26, March 2014
 Myth Busting MyTravel Kim Coleman and Nancy Herbst 26, March 2014 Introduction How-Tos, Things to Keep in Mind, and the Future Looks Bright PRESENTATION TITLE HERE Introduction MyTravel is a payment tool
PRELIMINARY ACCOUNTS FOR 2012
 INTERIM REPORT FOR Q4 2012 AND INTERIM REPORT FOR Q4 2012 AND PRELIMINARY ACCOUNTS FOR 2012 HIGHLIGHTS Q4 with growth in volume and improved normalized EBITDA MNOK 261 improvement in normalized EBITDA
Frequently Asked Questions
 What is VBS? The Vehicle Booking System is a slot allocation system designed to manage the flow of traffic in and out of the terminal. Why have a VBS? The idea of the VBS is to smooth the peaks and troughs
Gerry Laderman SVP Finance, Procurement and Treasurer
 Gerry Laderman SVP Finance, Procurement and Treasurer Safe Harbor Statement Certain statements included in this release are forward-looking and thus reflect our current expectations and beliefs with respect
FERRY AVAILABILITY REVIEW JUNE OCTOBER 2013
 TITLE OUTER HEBRIDES TOURISM INDUSTRY ASSOCIATION FERRY AVAILABILITY REVIEW JUNE OCTOBER 2013 Research and reporting carried out by the Outer Hebrides Tourism Industry Association, on behalf of HITRANS,
LCCs: in it for the long-haul?
 October 217 ANALYSIS LCCs: in it for the long-haul? Exploring the current state of long-haul low-cost (LHLC) using schedules, fleet and flight status data Data is powerful on its own, but even more powerful
NC811 UCC Report for January 2017
 NC811 UCC Report for January 2017 Outer Banks (Dare/Currituck Counties) Downtown Asheville 2016 A Year In Review Locate Requests & Transmissions Dec. 2016 vs 2015 Tickets 2016: 138,076 2015: 116,302
Produced by: Destination Research Sergi Jarques, Director
 Produced by: Destination Research Sergi Jarques, Director Economic Impact of Tourism Oxfordshire - 2015 Economic Impact of Tourism Headline Figures Oxfordshire - 2015 Total number of trips (day & staying)
Irregular Operations (IROPS) Emergency Contingency Plan
 Emergency Contingency Plan") Irregular Operations (IROPS) Emergency Contingency Plan Introduction Denver International Airport (the Airport ) has prepared this Emergency Contingency Plan pursuant to 42301 of the FAA Modernization
Irregular Operations (IROPS) Emergency Contingency Plan Introduction Denver International Airport (the Airport ) has prepared this Emergency Contingency Plan pursuant to 42301 of the FAA Modernization
Passenger Traffic Achieves Strong Growth of 4.8% for the Month of August
 Passenger Traffic Achieves Strong Growth of 4.8% for the Month of August Montréal, 7 October Passenger traffic experienced a slight surge in growth to almost +5% for August compared to previous months
METRO OPERATIONS COMMITTEE
 Los Angeles County Metropolitan Transportation Authority Item 1 CHIEF OPERATIONS OFFICER S S REPORT METRO OPERATIONS COMMITTEE Lonnie Mitchell Chief Operations Officer May 19, 20 1 Employee Recognition
Passenger and Cargo Statistics Report
 Passenger and Cargo Statistics Report RenoTahoe International Airport September 2015 U.S. DOMESTIC INDUSTRY OVERVIEW FOR SEPTEMBER 2015 All RNO Carriers Domestic Systemwide year over year comparison Average
Produced by: Destination Research Sergi Jarques, Director
 Produced by: Destination Research Sergi Jarques, Director Economic Impact of Tourism Oxfordshire - 2016 Economic Impact of Tourism Headline Figures Oxfordshire - 2016 number of trips (day & staying) 27,592,106
Reno-Tahoe Airport Authority U.S. DOMESTIC INDUSTRY OVERVIEW FOR FEBRUARY
 Inter-Office Memo Reno-Tahoe Airport Authority Date: March 30, 2009 To: Statistics Recipients From: Krys T. Bart, A.A.E., President/CEO Subject: RENO-TAHOE INTERNATIONAL AIRPORT PASSENGER STATISTICS U.S.
(1) Question: Who is eligible to participate in Flight Deck Training during this notice period?
 Question: Who is eligible to participate in Flight Deck Training during this notice period?") MEMORANDUM OF UNDERSTANDING BETWEEN THE NATIONAL AIR TRAFFIC CONTROLLERS ASSOCIATION AND THE FEDERAL AVIATION ADMINISTRATION REGARDING FLIGHT DECK TRAINING (FDT) This Memorandum of Understanding (MOU)
MEMORANDUM OF UNDERSTANDING BETWEEN THE NATIONAL AIR TRAFFIC CONTROLLERS ASSOCIATION AND THE FEDERAL AVIATION ADMINISTRATION REGARDING FLIGHT DECK TRAINING (FDT) This Memorandum of Understanding (MOU)
Service Performance Election / Political Mail Update Hurricane Michael California Wild Fires National Operations Control Center Update MTE Update
 November 27, 2018 USPS Leadership Forum for Stakeholders Service Performance Election / Political Mail Update Hurricane Michael California Wild Fires National Operations Control Center Update MTE Update
Passenger and Cargo Statistics Report
 Passenger and Cargo Statistics Report RenoTahoe International Airport August 2015 U.S. DOMESTIC INDUSTRY OVERVIEW FOR AUGUST 2015 All RNO Carriers Domestic Systemwide year over year comparison Average