March 12, Certified Mail Tracking Number:
|
|
|
- Ilene Howard
- 5 years ago
- Views:
Transcription
1 March 12, 2014 Mr. Mark Dimondstein President American Postal Workers Union, AFL-CIO 1300 L Street, NW Washington, DC Certified Mail Tracking Number: Dear Mark: As information, enclosed is a copy of the first Post Implementation Review for the Panama City, Florida Processing & Distribution Facility (P&DF) Area Mail Processing (AMP). In accordance with the Non-Disclosure Agreement dated February 11, 2013, the Postal Service is providing both redacted and unredacted copies of the PIR. If you have any questions, please contact Rickey Dean at extension Patrick M. Devine Manager Contract Administration (APWU) Enclosures (CA )
2 REDACTED Type of Distribution Consolidated: Destinating Facility Name & Type: Panama City FL P&DF Street Address: 1336 Sherman Ave City: Panama City State: FL 50 Facility ZIP Code: District: North Florida Area: Southwest Finance Number: Current 30 ZIP Code(s): 324 Miles to Gaining Facility: 106 EXFC office: Yes Plant Manager: N/A Senior Plant Manager: Stephen R. Hardin (A) District Manager: Charles J. Miller Facility Name & Type: Pensacola FL P&DC Street Address: 1400 W. Jordan St City: Pensacola State: FL 50 Facility ZIP Code: District: North Florida Area: Southwest Finance Number: Current 30 ZIP Code(s): 325 EXFC office: Yes Plant Manager: Robert L. Johnson Senior Plant Manager: Stephen R. Hardin (A) District Manager: Charles J. Miller Approval Date: February 20, 2012 Implementation Date: Apr PIR Type: 1st PIR Date Range of Data: Apr : Sep Processing Days per Year: 310 Bargaining Unit Hours per Year: 1,745 EAS Hours per Year: 1,822 Date of HQ memo, DAR Factors/Cost of Borrowing/ New Facility Start-up Costs Update June 16,2011 r ~ Date & Time this workbook was last saved: :08 Area Vice President: Vice President, Network Operations: Area AMP Coordinator: NAI Contact: Jo Ann Feindt David E. Williams Steve Jackson Sarah Grover PIR Data Entry Page
3 &..q,\ul! Fj!J~ P!l%m Mli~l!lg~~r:
4 Executive Summary PIR Type: 1st PIR Last Saved January 8, 2014 Date Range of Data Apr Sep Losing Facility Name and Type: Street Address: City: State: Current SCF ZIP Code(s): Type of Distribution Consolidated: Gaining Facility Name and Type: Street Address: City: State: Savings/Costs 1st PIR vs Pre AMP 1st PIR vs Approved Function 1 Workhour Savings Non-Processing Craft Workhour Savings (less Maint/Trans) PCES/EAS Workhour Savings Transportation Savings Maintenance Savings Space Savings from Workhour Costs - Combined from Other Curr vs Prop from Other Curr vs Prop from Transportation HCR and Transportation PVS from Maintenance from Space Evaluation and Other Costs Total Annual Savings Total One-Time Costs Total First Year Savings ($346,709) $269,535 from Space Evaluation and Other Costs Staffing Craft Position Loss from Staffing-Gran Service Losing Current Qtr Gaining Current Qtr First-Class Mail Service Performance (EXFC 0/N) from Service Performance & CSM First-Class Mail Service Performance (EXFC 2 Day) 97.69% 97.02% from Service Performance & CSM First-Class Mail Service Performance (EXFC 3 Day) Customer Experience Measurement Overall Satisfaction Residential at PFC level Customer Experience Measurement Overall Satisfaction Small Business at PFC level 94.16% 95.38% 90.90% from Service Performance & CSM from Service Performance & CSM from Service Performance & CSM PIR Executive Summary
5 Combined Losing and Gaining Facility Data: Pre AMP Proposed 1st PIR Function 1 Workhour Costs $14,008,089 $12,845,300 $12,480,626 Non-Processing Craft Workhour Costs (less Maintenance & Transportation) $528,265 $447,108 $938,284 PCES/EAS Workhour Costs $2,004,487 $1,515,405 $1,609,783 Transportation Costs $4,567,382 $4,445,391 $3,967,449 Maintenance Costs $8,476,190 $6,969,007 $7,227,809 Space Savings $0 $0 $0 Total Annual Cost $29,584,414 $26,222,211 $26,223,951 Total One-Time Costs $0 $616,244 $346,709 Total First Year Costs $29,584,414 $26,838,455 $26,570,660 Staffing Craft Position Total On-Rolls PCES/EAS Position Total On-Rolls st PIR vs Pre-AMP Approved AMP Function 1 Workhour Savings $1,527,463 $364,674 $1,162,789 ($410,020) ($491 '176) $81,157 Non-Processing Craft Workhour Savings (less MainVTrans) PCES/EAS Workhour Savings $394,705 ($94,377) $489,082 Transportation Savings $599,933 $477,942 $121,991 Maintenance Savings $1,248,381 ($258,802) $1,507,183 Space Savings $0 $0 $0 Total Annual Savings $3,360,463 ($1,740) $3,362,202 Total One-Time Costs ($346,709) $269,535 ($616,244) Total First Year Staffing Craft Position Loss PCES/EAS Position Loss PIR Executive Summary
6 Losing Facility Name and Type: Current SCF ZIP Code(s): Type of Distribution Consolidated: Summary Narrative Last Saved: January 8, 2014 Panama City FL P&DF 324 Destinating Gaining Facility Name and Type: Current SCF ZIP Code(s): Pensacola FL P&DC 325 Background: This is the First Post Implementation Review (PIR) of the consolidation of Destinating mail volumes from the Panama City FL P&DF into the Pensacola FL P&DC (SCF 325). The AMP study called for the consolidation of Destinating mail volumes for SCF 324 due to the overall decline in volumes and to increase efficiency. The hub operations were transferred to the Post office finance number at the start of the AMP. The Panama City P&DF is approximately 106 miles from the Pensacola P&DC. Financial Summary: The baseline data for this PIR was taken from the period of April 1, September 30, This 6- month period was annualized to represent a full year for the first PIR Financial savings for the consolidation from the Panama City P&DF into the Pensacola P&DC are: Total First Year Savings Total Annual Savings One time costs Allotted Funds: Original 1x costs Deviation #1 $3,013,754 $3,360,463 $ (346,709) $ (616,244) N/A Calculation References Combined LOlling and Gaining Facility Dilts: Function 1 Work.hour Costs Non-Processing Craft Workhour Costs (less Maintenance & Transportation) PCES/EAS Workhour Costs Transportation Costs Maintenance Costs Space Savings Total Annual Cost PreAMP $14,008,089 $528,265 $2,004,487 $4,567,382 $8,476,190 $0 $29,584,414 Proposed $12,845,300 $447,108 $1,515,405 $4,445,391 $6,969,007 $0 $26,222,211 1st PlR $12,480,626 $938,284 $1,609,783 $3,967,449 $7,227,809 $0 $26,223,951 Total One-Time Costa $0 $616,244 $346,709 Total First Year Costs $29,584,414 $26,838,455 $26,570,660 There were one times costs that totaled $346,709 of the approved $616,244. The costs include the building design, construction, support and the installation of 3 DBCS's at the Pensacola P&DC. In order to expedite the full closure all mail processing operations of Panama City P&DF, it was decided to establish a central hub point to cross dock both Originating and Destinating mail volumes between the customer service offices and the Panama City P&DF. Once the Hub operations were started the work hours were transferred to the Post Office finance number The hub work hours and associated work hour costs were added directly into the PIR data based on FLASH data supplied by District Finance and the Jacksonville P&DC OPS Support office. There was a total of 4,782 LDC 43 and 10,330 hours of LDC 48 work hours (annualized) used at the Panama City hub, adding a cost of $550,963. Function 38 employees from the P&DC remain currently on finance number Maintenance work hours were transferred to the Panama City Post office finance number These work hours and their associated work hour rates have been added into the PIR data for the time period specified. PIR Summary Narrative

7 Other Concurrent Initiatives: The other initiatives that would impact the shared LDC workhour savings is the DBCS Certification training which required all automation craft & EAS employees be trained on 5 courses of automation for a total of 6.25 hours per person. Another initiative was the elnduction training for all craft & EAS accepting drop shipments complete a 2 hour training course and pass a test. These two training requirements occurred within the 6 months used to compare to pre-amp and have increased work hour training operation considerably. Customer & Service Impacts: The BMEU, Box Section, and Retail Unit located at the Panama City P&DF were not affected. A local postmark continues to be available at retail service locations. Transportation: The Panama City P&DF is 2 hrs 35 minutes of travel time from the Pensacola P&DC. Both Panama City P&DF and Pensacola P&DC are HCR sites that are not serviced by PVS. The $94,738 in PVS savings was from LDC 31 not actual PVS driving hours. The follow HCR routes were changed due to the AMP as listed in the PIR. Those include 32193, 32512A, 32433, 32434, 324A8, 324AA, 324B3, 324DA, 324L3 and 324L4. Those listed below are larger adjustments made to the Pre-AMP transportation. The overall savings are $684,000. HCR 324CA was eliminated due to no longer required HCR 324L2 was combined with HCR 324L4 which is listed in the PIR HCR 323BG was originally looked at to be eliminated but no changes were made to it HCR was eliminated. Some routes were identified by the District staff that have changed and were not due to the AMP. Those costs should not be charged to this AMP/PIR. Those routes include: HCR All trips were eliminated for a savings of $211,870 HCR is a Jacksonville Panama City route, we were able to eliminate some Sunday trips for a saving of $4,000. Currently it shows a cost of $1,323,853.this added costs are not related to the AMP. HCR is a Jacksonville Tallahassee route. All 324 trips were eliminated for a savings of $319,352. This additional projected cost of $73,574 was avoided any additional cost are not related to the Panama City AMP. HCR 328SE All Panama City stops were eliminated at a savings of $25,649. HCR All Panama City stops eliminated for a savings of $5,668. Losing Facfl!ty: Panama City FL P&DF Type of Distribution Consolidate<!: Destinatlng Dats of HCR Data File: PIR Type: 1 st PIR PIR Summary Narrative
8 Staffing Impacts: Mail processing staffing impacts for the 1st PIR resulted in loss of 55 craft positions between the two sites. In the Panama City P&DF, they are 5 craft employees over the proposed numbers. In the Pensacola P&DC is 22 employees below their proposed craft numbers due to other non-amp items. All of the hub operations craft employees were moved to finance number. The hub operation used an annualized work hour total of 15,112. EAS resulted in a net loss of 6 employees. The Panama City P&DF has no EAS remaining in finance number The Pensacola P&DC is at their proposed supervisor staffing levels. 1 Craft = Career + Non-career Maintenance Impacts: During the 1 t PIR timeframe, the overall Maintenance Savings for the First PIR was $1,248,381. The Panama City P&DF maintenance did reduce their staffing from 31 to 15. As discussed in the financial summary, the employees remained on finance number while the work hours for the maintenance staff are charged to finance number MPE moves: In order to prepare for the Destinating Panama City volumes, 3 DBCS's were installed in Pensacola P&DC. The one time costs for the DBCS move totaled $23,600. An AFSM 100 was proposed for the Panama City move, but was deemed unnecessary at the time of the consolidation. A NODE Study as of November 4th by the Facilities Service Office plans to retain the Panama City P&DC as a hub. Retail, BMEU, PO Box, Caller Services, and Delivery will remain at the Panama City facility. In the future, carriers from both the Northside and Downtown Stations will relocate into the P&DC facility. PIR Summary Narrative
9 Service Performance and Customer Satisfaction Measurement Last Saved: January 8, 2014 Losing Facility: Panama City FL P&DF District: North Florida PIR Type: Implementation Date: 1st PIR 04/01/13 Gaining Facility: Pensacola FL P&DC District: North Florida (15) Notes: Customer Satisfaction Measurement (CSM) became Customer Experience Measurem1 Data reflects most recently completed quarter available in CEM. Satisfaction (Overall Experience) PIR Service Performance and Customer Satisfaction Measurement

10 I Combined Facilities I Workhour Costs - Combined Facilities Lam Saved: January 8, 2014 PIR Type : -.fi;:.;-;:-jm;;:;;;;;;;;;s;s;;;;;""':;;<jjrl;;;tf'fr Type of Distribution Consolidated: Destinating Date Range of Data: Apr to Sep PlR Workhour Costs - Combined F acllities
11 PIR Work:hour Costs - Combined Facilities
12 (27)NOTES: t!w1l4f~xj!r PIR Work:hour Costs ~ Combined F acitities

13 Losing Facility: Panama City FL P&OF Workhour Costs -Losing Facility Last Saved: January 8, :m 4 PIR Type : ~~~=""'m.dio<fw Type ot Dlstnbutton Consotidated: Destinatmg Date Range of Data: Apr-( to Sep ANNUliUZED j PIR Workhour Costs - Losing

14 PlR Workhour Costs - Losing

15 Workhour Costs Gaining Facility Last Saved: January S_ 2014 Gaining Facility: Pensacola FL P&DC Type of Distribution Consolidated: Destinating.. "'... Function 1 11 $ $ $ PIR Type :.;~~ :..c,:p-,:~~~"'tr"c:::;ol:-::mn=s "" -=,=nu:::w= -:-:od;c;fo:::,-;cfm= PIR. Date Range of Data: Apr to Sep ~'t0'7":1.ta PIR Workhour Costs - Gaining

16 PlR Workhour Costs - Gaining
17 (2nNoTES:~~========================================================================================================================================~ P!R Workhour Costs- Gaining

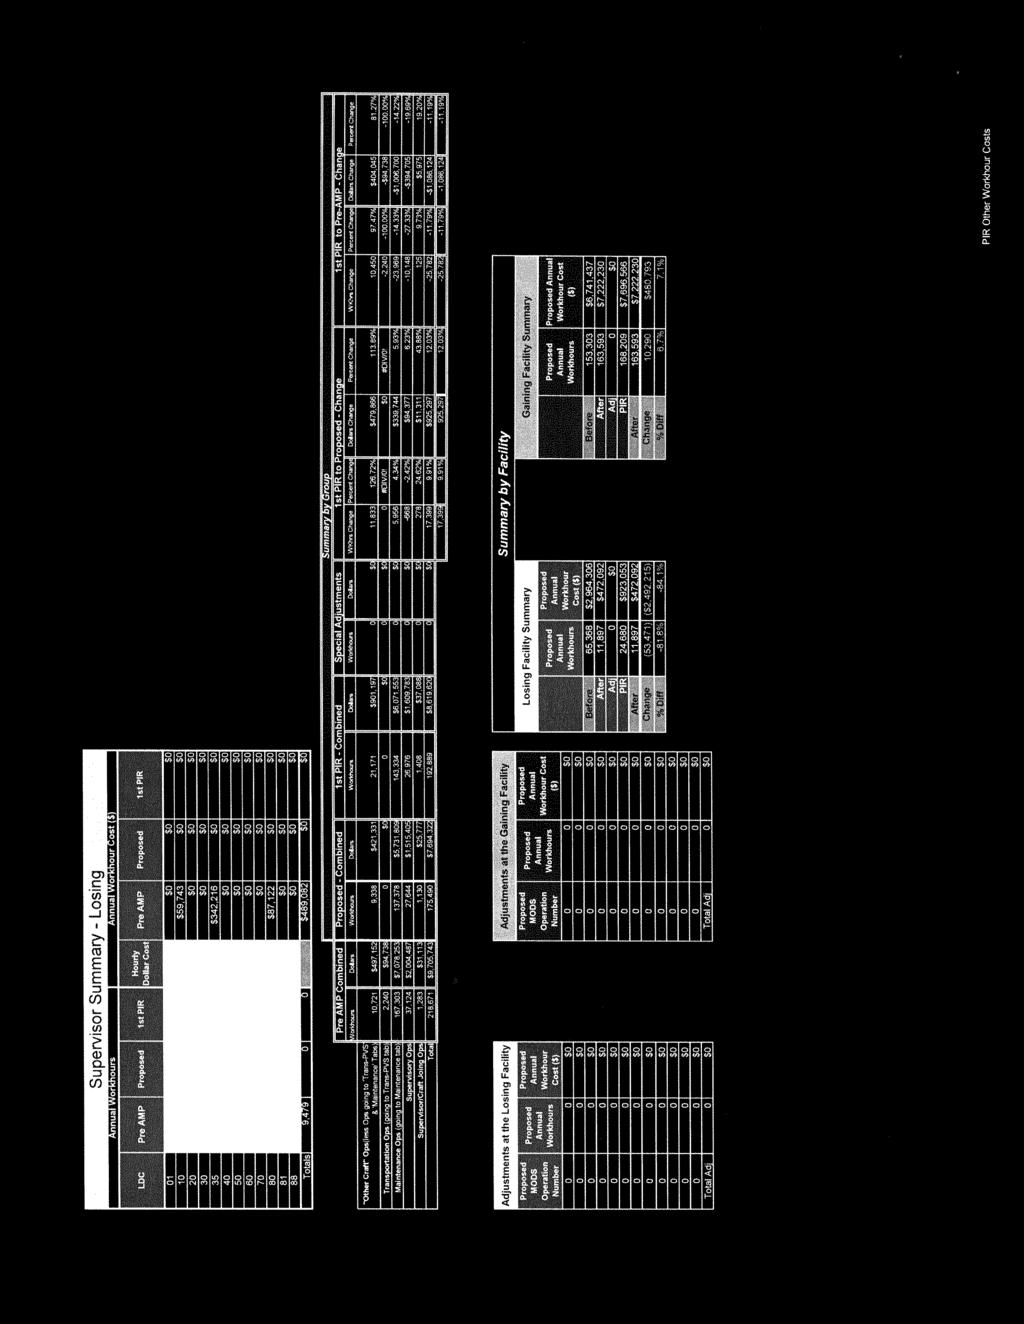
18 I Other Workhour Move Analysis I PIR Other Worl<hour Costs
19 P IR Other Workhour Costs
20 PIR Other Workhour Costs
21


22 I Distribution to Other PIR Worksheet Tabs I PIR Other Workhour Costs


23 P IR Other Workhour Costs
 1 i 1st PIR vs Pre AMP i 1st PIR vs Proposed ~ Total Craft Position Loss:L- - ~ - - 1 - - 1_2 - -J (Above numbers are carried forward to the Executive Summary) PIR Staffing -")
24 Staffing -Craft Last Saved: January 8, 2014 PIR Type: 1st PIR Data Extraction Date: 10/07/13 Finance #: Craft Positions Craft Positions 1, ~ ~ (23) 1 (24) 1 i 1st PIR vs Pre AMP i 1st PIR vs Proposed ~ Total Craft Position Loss:L- - ~ _2 - -J (Above numbers are carried forward to the Executive Summary) PIR Staffing - Craft

25 Staffing- PCES/EAS Last Saved: January 8, 2014 PIR Type: 1st PIR Losing Facility: Panama City FL P&OF Data Extraction Date: 10/3/2013 Finance# _1_17...;2_80 PCES/EAS Positions PIR Staffing- PCES/EAS
 1 I I I j Position Lossj 6 j 0 j ~----------------~-------------~-------------~ (Above numbers are carried forward to the Executive Summary) PIR Staffing-")
26 Gaining Facility: Pensacola FL P&DC Data Extraction Date: Finance# -'1-'17'-4'-'1-'1 r- -~-~-~-~-~-~-~,~-~-~-~---~--,~-~- -~---~-~, 1 Total PCES/EAS' < 37 ) 1 < 38 ) 1 I I I j Position Lossj 6 j 0 j ~ ~ ~ ~ (Above numbers are carried forward to the Executive Summary) PIR Staffing- PCES/EAS

27 Transportation - PVS Last Saved: January 8, 2014 PIR Type: :::::::...:...:..:_ 1st PIR Losing Facility: Panama City FL P&DF Finance Number: ~~~ PVS Owned Equipment Seven Ton Trucks Eleven Ton Trucks Single Axle Tractors Tandem Axle Tractors Spotters PVS Transportation Number of Schedules Total Annual Mileage Total Mileage Costs (2) w I Variance ~ 1st Variance ~ 1st I I Date Range of Data: Apr to- Sep Gaining Facility: Pensacola FL P&DC Finance Number: (7) (8) (9) I (10) Variance 1st Variance 1st Proposed 1st PIR I PIR vs Pre PIR vs Proposed PIR PIR vs Pre PIR vs AMP Proposed Proposed PVS Owned EQuipment 0 0 Seven Ton Trucks Eleven Ton Trucks Single Axle Tractors 0 I Tandem Axle Tractors ~~ 0 I I I I PVS Transportation Total N"mOO<Of Annual ~~""' Mileage 0 0 $0 $0 $0 $0 Total Mileage Costs $0 $0 $0 $0 PVS Leases Total Vehicles Leased Total Lease Costs PVS Leases f 0 I 0 ' ' t Total Vehicles Leased.. 'l"'f'( $0 $0 $0 $0 Total Lease Costs 0 0 $0 $0 $0 $0 PVS Workhour Costs LDC 31 (617, 679, 764) LDC 34 (765, 766) Total Workhour Costs PVS Workhour Costs $0 $0 LDC 31 (617, 679, 764) $0 $0 $0 $0 LDC 34 (765, 766) $94,738 $94,738 ($0) $0 I--::T;:-o 7 ta-:i:-;-wi::;-o~rk 7 h_o..:..u_r-::c:-o-s-:-ts*~~* $0 $0 $0 $0 $0 $0 (11) Total 1st PIR vs Pre AMP Transportation-PVS Savings: ($0) (12) Total 1st PIR vs Proposed Transportation-PVS Savings: $0 (This number added to the Executive Summary (This number added to the Executive Summary) (13) Notes: There are no PVS service in Panama City. The workhour costs are attributed to the wrong operation number. As directed, the proposed costs were made equal to the Pre-AMP costs in order to show no savings. PIR Transportation - PVS

28 Losing Facility: Panama City FL P&DF Transportation - HCR Last Saved: January 8, 2014 PIR Type: 1st PIR Type of Distribution Consolidated: Destinating Data of HCR Data File: 10/01/13 CT for Outbound Dock: 22:05 ~- a - PIR Transportation HCR - Losing

29 Notes: Change Analysis 1st PIR vs Pre AMP I 1st PIR vs Proposed PIR Transportation HCR - Losing

30 Gaining Facility: Pensacola FL P&DC Type of Distribution Consolidated: Destinating Date ofhcr Data File: 10/01/13 Transportation - HCR Last Saved: January 8, 2014 CET for Inbound Dock: CET for Cancellations: PIR Type: Destinating CET for OGP: 20:00 20:00 CT for Outbound Dock: 1 :30 1ft\; ~... PIR Transportation HCR - Gaining
 Total 1st PIR vs Proposed Transportation-HeR Savings: (from losing and gaining facilities) HCR PVS (15) Total 1st PIR vs Pre AMP Transportation (PVS & HCR): (This number carried forward")
31 Change Analysis 1st PIR vs Pre AMP I 1st PIR vs Proposed Losin Summary HCR Losing & Gaining (13) I (14l (13) Total 1st PIR vs Pre AMP Transportation-HeR Savings: (from losing and gaining facilities) Notes: (14) Total 1st PIR vs Proposed Transportation-HeR Savings: (from losing and gaining facilities) HCR PVS (15) Total 1st PIR vs Pre AMP Transportation (PVS & HCR): (This number carried forward to the Executive Summary) (16) Total 1st PIR vs Proposed Transportation (PVS & HCR): {This number carried forward to the Executive Summary} PIR Transportation HCR - Gaining

32 MPE Inventory Last Saved: January 8, 2014 Data Extraction Date:----- PIR Type: 1st PIR Date Range of Data: Apr to - Sep Losing Facility: Panama City FL P&DF Gaining Facility: Pensacola FL P&DC <s> 1 <s> 11 <7> <s> <s> Proposed 1st PIR V.. 1st PIR IH Relocation Relocation a~~:: 10 Costs Costs 2 1 $0 $0 AFCS 200 <(,.b:.,k0'.(j 0 2 $0 $0 AFSM-ALL ;;;> 2 1 $141,064 APPS '.'ll'' (\~ 0 0 $0 ClOSS ~ $0 CSBCS ' i ~vio'f: i.ti 0 0 $0 $0 DBCS. t:'i' 11;' c 8 6 $8,060 $23,600 DBCS-OSS ;. ;.ri;;s 0 2!', $0 $0 DIOSS 1 /S~;;,),. 3 3 ' $16,120 $0 FSS > " < 0 0 $0 $0 SBPS.i.1t,~.ii+i 1 1 $0 $0 UFSM,:5~/J~;{\~pf 0 0 $0 $0 0 0 $0 $0 ROBOT GANTRY ~ '" 0 0 $0 $0 HSTS I HSUS.;')'(;...,,, 0 0 $0 $0 LCTS I LCUS ; ff ; 5 :! ~;; ~ 1 1 $0 $0 LIPS t ' s:n ;, <;(~ 0 0 $0 $0 MLOCR-ISS. O >; 'S2 0 0 $0 $0 MPBCS-OSS ~~ii]t~ 0 0 $0 $0 TABBER INDUSTRIAL I ''k}'l I 0 LCREM 0 0 ~ ~ (10) Notes: The $23,600 in DBCS costs, was for the installation of 3 DBCS in Pensacola Proposed AFSM deemed not necessary by Southern Area due to volumes at time of consolidation. Carried to Space Evaluation and Other Costs PIR MPE Inventory
 Proposed ~ (3) (; (4) ;:, Variance 1st PIR?")
33 Maintenance Last Saved: January 8, 2014 PIR Type :...:1.::st:...:P :I:...:R Date Range of Data: Apr : Sep losing Facility: Panama City FL P&DF Gaining Facility: Pensacola FL P&DC Workhour Activity (2) Proposed ~ (3) (; (4) ;:, Variance 1st PIR? 1st PIR to Costs PreAMP (5) Variance 1st PIR to Proposed Workhour Activity (7} Proposed Costs (8) (9) Variance 1st 1st PIR PIR to Pre Costs AMP (10) Variance 1st PIR to Pre Proposed LDC36 $ 0 $ 245,717 $ 2,595,529 $ 2,543,654 $ $ 165,270 $ $, 1,546,030 $ 1,382,492 '$ $ 306,231 $ 231,878 $ 755, ,806 $ 478,806 $ 0 $ $ 293,727 $ $ 0 $ 471,502 $ 0 $ $ $ 73,267 69,114 $ --- 5,260,307 71,$14 747,270 62, ,477 Total Parts and Supplies Maintenance Stockroom and S 187,534 0 Grand Total $ 260,801 Grand Total (11) 1st PIR vs Pre AMP- Maintenance Savings: (12) 1st PIR vs Proposed- Maintenance Savings: $258,802 (These numbers carried forward to the Executive Summary) (These numbers carried forward to the Executive Summary) (13) Notes: Maintenance workhours for Panama City were moved to the Post office finance number Workhour rates & hours were transferred into the PIR data for the 6 mth period. '"Data in PIR columns is annualized for First PIR 'rev-1j$.12008: PIR Maintenance
34 Distribution Changes Last Saved: January 8, 2014 Losing Facility : Panama City FL P&DF PIR Type: 1st PIR Type of Distribution Consolidated: Destinating Date Range of Data: Apr to- Sep (1) Place a "X" next to the DMM labeling list(s) revised as result of the approved AMP. DMM L001 DMM L011 X DMM L002 DMM L201 Identify the date of the Postal Bulletin that contained DMM labeling list revisions. < 2 > PB Dec DMML003 DMM L004 DMM L601 DMM L602 Was the Service Standard Directory updated for the approved AMP? < 3 > Yes X DMM L005 DMM L603 DMML006 DMM LOO? DMM L008 DMM L604 DMM L605 DMM L606 DMM L009 X DMM L607 DMM L010 DMM L801 (4) Drop Shipments for Destination Entry Discounts FAST Appointment Summary Report NASS Total No-Show Late Arrival Open Month Losing I Gaining Facility Facility Name Code Schd Count % Count % Count % Aug '13 Losing Facility 324 Panama City N/A Closed Unschd, Count % Count Sep '13 Losing Facility 324 Panama City N/A Aug '13 Gaining Facility 325 Pensacola % % % Sep '13 Gaining Facility 325 Pensacola % % % --- L '-- -L.- -~ (5) Notes: % % 1 I PIR Distribution Changes
35 losing Facility: Panama City FL P&DF 5-0igit ZIP Code: Data Extraction Date:-:;1~01;:::1=:-1/~1-= Customer Service Issues Last Saved: January 8, Collection Points Number picked up before 1 p.m. Number picked up between 1-5 p.m. Number picked up after 5 p.m. Total Number of Collection Points 2. How many collection boxes are currently designated for "local delivery"? 3. How many "local delivery" boxes were removed as a result of AMP? [JCJ [-JC] 4. Delivery Performance Report % Carriers returning before 5 p.m. 5. Retail Unit Inside Losing Facility (Window Service Times) 6. Business (Bulk) Mail Acceptance Hours r - au"',_f-j Proposed u.. -"''"", - 1::.\-ru' Proposed Start End Start End Start End None None 9:00 17:30 None None None None 9:00 17:30 None None None None 9:00 17:30 None None None None 9:00 17:30 None None None None 9:00 17:30 None None None None 9:00 12:30 0:00 0:00 1st PIR Start End 11:00 17:30 11:00 17:30 11:00 17:30 11:00 17:30 11:00 17:30 0:00 0:00 7. Can customers obtain a local postmark in accordance with applicable policies in the Postal Operations Manual? Yes 8. Notes: Retail & BMEU were not affected as originally planned. Gaining Facility: Pensacola FL P&DC 9. What postmark is printed on collection mail? Pensacola FL 325 (Day-Month-Year PM) machine# T0\1:1~12!1 PIR Customer Service Issues
36 Space Evaluation and Other Costs Last Saved: January 8, 2014 Losing Facility: Panama City Fl P&DF Date: Affected Facility 2. One-Time Costs 3. Savings Information Enter any one-time costs:_..;$"'4""5""1,,;.000;,;,.,._ $323,109 ($ ) (These numbers shown below under One-Time Costs section.) Space Savings ($):.;.$0;;... $0 $0 (These numbers carried forward to the Executive Summary) 4. Did you utilize the acquired space as planned? Explain. A NODE Study as of November 4th by the Facilities Service Office plans to retain the Panama City P&DC as a hub. Retail, BMEU, PO Box, Caller Services, and Delivery will remain at the Panama City facility. In the future, carriers from both the Northside and Downtown Stations will relocate into the P&DC facility. 5. Notes: Per FSO: Demolition of existing CMU walls and relocation of Swing Room in order to provide additional Workroom for staging areas. New structural beams were added to support the existing Look Out Gallery running along these demolished walls. Also included was the relocation of two existing columns to clear space for new DBCSs. Finally, the Mechanical system was rebalanced. Employee Relocation Costs Mail Processing Equipment Relocation Costs (from MPE Inventory) $165,244 Facility Costs (from above) Total One-Time Costs $451,000 ($ ) $616,244 $346,709 ($269,535) PIR costs carried forward to Executive Summary) Losing Facility: Panama City Fl P&DF Gaining Facility: Pensacola Fl P&DC Pre-AMP: FY 2011 Range of Report PIR: FY 2012 YTD PIR Space Evaluation and Other Costs
37
August 13, Certified Mail Tracking Number:
 August 13, 2013 Mr. Cliff Guffey President American Postal Workers Union, AFL-CIO 1300 L Street, NW Washington, DC 20005-4128 Certified Mail Tracking Number: 7013 1090 0002 44351572 Dear Cliff: As information,
----- AMP Data Entry Page -----
 ----- AMP Data Entry Page ----- 1. Losing Facility Information Type of Distribution to Consolidate: Destinating MODS/BPI Office Facility Name & Type: Street Address: City: Panama City FL P&DF 1336 Sherman
----- AMP Data Entry Page -----
 ----- AMP Data Entry Page ----- 1. Losing Facility Information Type of Distribution to Consolidate: Destinating Non-MODS/Non-BPI Office Facility Name & Type: Street Address: City: Centralia CSMPC 314 S
----- AMP Data Entry Page -----
 Type of Distribution to Consolidate: Orig & Dest Non-MODS/Non-BPI Office Facility Name & Type: Street Address: City: Carbondale CSMPC 1301 E Main St Carbondale State: IL 5D Facility ZIP Code: 62901 District:
----- AMP Data Entry Page -----
 Type of Distribution to Consolidate: Orig & Dest Non-MODS/Non-BPI Office Facility Name & Type: Street Address: City: Owensboro CSMPC 54 Bon Harbor Hls Owensboro State: KY 5D Facility ZIP Code: 42301 District:
----- AMP Data Entry Page -----
 ----- AMP Data Entry Page ----- 1. Losing Facility Information Type of Distribution to Consolidate: Orig & Dest MODS/BPI Office Facility Name & Type: Street Address: City: Paducah P&D F 300 S 4th St Paducah
----- AMP Data Entry Page -----
 ----- AMP Data Entry Page ----- 1. Losing Facility Information Type of Distribution to Consolidate: Destinating MODS/BPI Office Facility Name & Type: Street Address: City: Columbus GA CSMPC 3916 Milgen
With the completion of this project, we would like to follow-up on the projections as well as highlight a few other items:
 TO: FROM: Mayor and Council Interim City Manager Rebecca Underhill, Director of Finance DATE: February 28, 2014 SUBJECT: Water Meter Project Analysis On March 28, 2012, Acting City Manager Mike Loftin
PORT OF SEATTLE MEMORANDUM. COMMISSION AGENDA Item No. 6a ACTION ITEM Date of Meeting August 23, 2016
 PORT OF SEATTLE MEMORANDUM COMMISSION AGENDA Item No. 6a ACTION ITEM Date of Meeting August 23, 2016 DATE: TO: FROM: Michael Ehl, Director, Airport Operations Wayne Grotheer, Director, Aviation Project
MONTHLY OPERATIONS REPORT DECEMBER 2015
 MONTHLY OPERATIONS REPORT DECEMBER 215 Table of Contents DECEMBER 215 Section Page December Highlights... 3 Strategic Goals Progress Update... 4 Ridership... 6 Revenue... 9 Expenses... 1 System Summary...
MONTHLY OPERATIONS REPORT SEPTEMBER 2015
 MONTHLY OPERATIONS REPORT SEPTEMBER 215 Table of Contents SEPTEMBER 215 Section Page September Highlights... 3 Strategic Goals Progress Update... 4 Ridership... 6 Revenue... 9 Expenses... 1 System Summary...
Industry Update. ACI-NA Winter Board of Directors Meeting February 3, 2016 Orlando, FL
 Industry Update ACI-NA Winter Board of Directors Meeting February 3, 2016 Orlando, FL U.S. & Canadian GDP 8% 6% 4% U.S.* Canada** Estimate by BEA as of 02/11/16 2% 0% -2% -4% -6% -8% -10% The U.S. economy
AUGUST 2008 MONTHLY PASSENGER AND CARGO STATISTICS
 Inter-Office Memo Reno-Tahoe Airport Authority Date: October 2, 2008 To: Statistics Recipients From: Tom Medland, Director Air Service Business Development Subject: RENO-TAHOE INTERNATIONAL AIRPORT PASSENGER
Reno-Tahoe Airport Authority U.S. DOMESTIC INDUSTRY OVERVIEW FOR FEBRUARY
 Inter-Office Memo Reno-Tahoe Airport Authority Date: March 30, 2009 To: Statistics Recipients From: Krys T. Bart, A.A.E., President/CEO Subject: RENO-TAHOE INTERNATIONAL AIRPORT PASSENGER STATISTICS U.S.
PERFORMANCE REPORT JANUARY Keith A. Clinkscale Performance Manager
 PERFORMANCE REPORT JANUARY 2018 Keith A. Clinkscale Performance Manager INTRODUCTION/BACKGROUND Keith A. Clinkscale Performance Manager FIXED ROUTE DASHBOARD JANUARY 2018 Safety Max Target Goal Preventable
U.S. DOMESTIC INDUSTRY OVERVIEW FOR OCTOBER 2010 All RNO Carriers Systemwide year over year comparison
 Inter-Office Memo Reno-Tahoe Airport Authority Date: November 22, 2010 To: Chairman and Board of Trustees From: Krys T. Bart, A.A.E., President/CEO Subject: RENO-TAHOE INTERNATIONAL AIRPORT OCTOBER 2010
RIDERSHIP TRENDS. October 2017
 RIDERSHIP TRENDS October 2017 Prepared by the Division of Strategic Capital Planning December 2017 Table of Contents Executive Summary...1 Ridership...3 Estimated Passenger Trips by Line...3 Estimated
ORDER REQUESTING PROPOSALS
 Order 2017-2-4 Served: February 13, 2017 DEPARTMENT UNITED OF STATES TRANSPORTATION OF AMERICA UNITED STATES OF AMERICA DEPARTMENT OF TRANSPORTATION OFFICE OF THE SECRETARY WASHINGTON, D.C. Issued by the
14 YORK REGION TRANSIT (YRT/VIVA) SOUTHWEST DIVISION OPERATIONS AND MAINTENANCE CONTRACT EXTENSION
 SOUTHWEST DIVISION OPERATIONS AND MAINTENANCE CONTRACT EXTENSION") Clause No. 14 in Report No. 13 of the was adopted, without amendment, by the Council of The Regional Municipality of York at its meeting held on September 11, 2014. 14 YORK REGION TRANSIT (YRT/VIVA) SOUTHWEST
Clause No. 14 in Report No. 13 of the was adopted, without amendment, by the Council of The Regional Municipality of York at its meeting held on September 11, 2014. 14 YORK REGION TRANSIT (YRT/VIVA) SOUTHWEST
CITY OF BROOKFIELD Capital Improvement Fund Budget
 CITY OF BROOKFIELD Capital Improvement Fund Budget The City adopts an annual capital improvement budget, based on a five-year capital improvement program (CIP). The annual budget and CIP are prepared by
Project Progress Report #1
 Project Progress Report #1 As of February 28, 2002 Sam M. McCall, CPA, CIA, CGFM City Auditor AirTran Transportation Services Agreement Report #0214 April 9, 2002 Summary On September 12, 2001, the City
Sound Transit Operations February 2018 Service Performance Report. Ridership
 February 218 Service Performance Report Ridership Total Boardings by Mode Feb-17 Feb-18 % YTD-17 YTD-18 % ST Express 1,373,96 1,372,88 -.1% 2,877,294 2,88,719.1% Sounder 314,96 32,187 11.9% 681,923 768,69
U.S. DOMESTIC INDUSTRY OVERVIEW FOR MARCH
 Inter-Office Memo Reno-Tahoe Airport Authority Date: April 30, 2009 To: Statistics Recipients From: Krys T. Bart, A.A.E., President/CEO Subject: RENO-TAHOE INTERNATIONAL AIRPORT PASSENGER STATISTICS U.S.
U.S. DOMESTIC INDUSTRY OVERVIEW FOR MAY 2009
 Inter-Office Memo Reno-Tahoe Airport Authority Date: June 30, 2009 To: Statistics Recipients From: Krys T. Bart, A.A.E., President/CEO Subject: RENO-TAHOE INTERNATIONAL AIRPORT PASSENGER STATISTICS U.S.
RIDERSHIP TRENDS. August 2018
 RIDERSHIP TRENDS August Prepared by the Division of Strategic Capital Planning October Table of Contents Executive Summary...1 Ridership...3 Estimated Passenger Trips by Line...3 Estimated Passenger Trips
Feb 6 th, 2007 Japan Airlines Corporation
 Feb 6 th, 2007 Japan Airlines Corporation 0 Table of Contents JAL Group Q3 AccountSettlement For FY2006. Q3 Account Settlement For FY2006 Outline of the Consolidated Financial StatemeP3 Revision of Revenue
218 N. Spring Street Pensacola, FL Circa 1901
 For Lease Historic Stand Alone 218 N. Spring Street Pensacola, FL 32502 Circa 1901 Architectural features throughout great downtown presence charming historic stand alone For more information: Cameron
August 2014 Passenger and Cargo Traffic Statistics Reno-Tahoe International Airport
 August 2014 Passenger and Cargo Traffic Statistics Reno-Tahoe International Airport October 8, 2014 U.S. DOMESTIC INDUSTRY OVERVIEW FOR AUGUST 2014 All RNO Carriers Domestic Systemwide year over year comparison
Office of Program Policy Analysis And Government Accountability
 THE FLORIDA LEGISLATURE Report No. 98-70 Office of Program Policy Analysis And Government Accountability John W. Turcotte, Director February 1999 Preliminary Review of the Suspension of the State Contract
December 2011 Passenger and Cargo Traffic Statistics Reno-Tahoe International Airport
 December 2011 Passenger and Cargo Traffic Statistics Reno-Tahoe International Airport January 27, 2012 U.S. DOMESTIC INDUSTRY OVERVIEW FOR DECEMBER 2011 All RNO Carriers Systemwide year over year comparison
UNITED STATES SECURITIES AND EXCHANGE COMMISSION. Washington, D.C FORM 8-K
 UNITED STATES SECURITIES AND EXCHANGE COMMISSION Washington, D.C. 20549 FORM 8-K CURRENT REPORT Pursuant to Section 13 or 15(d) of the Securities Exchange Act of 1934 Date of Report (Date of earliest event
Q1 Fiscal 2019 Statistics
 Q1 Fiscal 2019 Statistics FedEx Corporation Financial and Operating Statistics First Quarter Fiscal 2019 September 17, 2018 This report is a statistical supplement to FedEx s interim financial reports
PUBLIC NOTICE The Greater Boise Auditorium District will hold a Regular Board Meeting on Thursday, December 20, 2018 at 2 p.m. Boise Centre West Room
 PUBLIC NOTICE The Greater Boise Auditorium District will hold a Regular Board Meeting on Thursday, December 20, 2018 at 2 p.m. Boise Centre West Room 200 GREATER BOISE AUDITORIUM DISTRICT REGULAR BOARD
Preliminary Draft Budget FY Airline Rates and Charges. Sea-Tac International Airport
 Draft Budget FY 2015 Airline Rates and Charges Sea-Tac International Airport Aviation Finance & Budget 2015 Budget Airline Rates and Charges TABLE OF CONTENTS Exhibit Contents 1 Aeronautical Revenue Summary
Sound Transit Operations March 2018 Service Performance Report. Ridership
 March 218 Service Performance Report Ridership Total Boardings by Mode Mar-17 Mar-18 % YTD-17 YTD-18 % ST Express 1,622,116 1,47,79-4.6% 4,499,798 4,428,14-1.6% Sounder 393,33 39,6.% 1,74,96 1,163,76 8.3%
LOS ALAMOS COUNTY 1000 Central Avenue, Suite Los Alamos, NM Phone (505) Fax (505) Website:
 Fax (505) Website:") 1111 1111 LOS ALAMOS COUNTY 1000 Central Avenue, Suite 350 - Los Alamos, NM 87544 Phone (505) 663-1750 Fax (505) 662-8079 Website: www.losalamosnm.us COUNTY COUNCIL Council Chair Geoff Rodgers Council
1111 1111 LOS ALAMOS COUNTY 1000 Central Avenue, Suite 350 - Los Alamos, NM 87544 Phone (505) 663-1750 Fax (505) 662-8079 Website: www.losalamosnm.us COUNTY COUNCIL Council Chair Geoff Rodgers Council
2017/2018 Q3 Performance Measures Report. Revised March 22, 2018 Average Daily Boardings Comparison Chart, Page 11 Q3 Boardings figures revised
 2017/2018 Q3 Performance Measures Report Revised March 22, 2018 Average Daily Boardings Comparison Chart, Page 11 Q3 Boardings figures revised Contents Ridership & Revenue... 1 Historical Revenue & Ridership...
October 2013 Passenger and Cargo Traffic Statistics Reno-Tahoe International Airport
 October 2013 Passenger and Cargo Traffic Statistics Reno-Tahoe International Airport December 4, 2013 U.S. DOMESTIC INDUSTRY OVERVIEW FOR OCTOBER 2013 All RNO Carriers Systemwide year over year comparison
Investor Update July 22, 2008
 JetBlue Airways Investor Relations Lisa Studness (718) 709-2202 ir@jetblue.com Investor Update July 22, 2008 This investor update provides our investor guidance for the third quarter ending September 30,
Q Earnings Financial Results for the Third Quarter Ended December 31, January 28, 2016 OMRON Corporation
 Q3 2015 Earnings Financial Results for the Third Quarter Ended December 31, 2015 January 28, 2016 OMRON Corporation Summary FY15 Q1-Q3 Results Sales remained flat while operating income decreased, Y/Y.
Management Presentation. November 2011
 Management Presentation November 2011 Forward looking statements This presentation as well as oral statements made by officers or directors of Allegiant Travel Company, its advisors and affiliates (collectively
Q1 Fiscal 2018 Statistics
 Q1 Fiscal 2018 Statistics FedEx Corporation Financial and Operating Statistics First Quarter Fiscal 2018 September 19, 2017 This report is a statistical supplement to FedEx s interim financial reports
Operating Budget Data
 J00I00 Maryland Aviation Administration Maryland Department of Transportation Operating Budget Data ($ in Thousands) FY 15 FY 16 FY 17 FY 16-17 % Change Actual Working Allowance Change Prior Year Special
PERFORMANCE REPORT DECEMBER Performance Management Office
 PERFORMANCE REPORT DECEMBER 2018 Performance Management Office INTRODUCTION/BACKGROUND Performance Management Office FIXED ROUTE DASHBOARD FY 2019 Safety Max Target Goal Preventable Collisions per 100k
Standardizes the handling of visa-regressed cases throughout USCIS field offices nationwide;
 INTERIM MEMO FOR COMMENT Posted: 01-11-2011 Comment period ends: 01-26-2011 This memo is in effect until further notice. U.S. Citizenship and Immigration Services Office of the Director (MS 2000) Washington,
Dwight E Herring. Shoreway Environmental Center Shoreway Facility Operations Monthly Reporting October Dear Joe:
 Shoreway Environmental Center Operations Monthly Reporting Dear Joe: Cardboard (OCC) improved $4.64 per ton and Sorted Mixed Paper (SMP) improved $2.49 per ton. We anticipate Asia markets will continue
SIA GROUP FINANCIAL RESULTS
 FINANCIAL RESULTS For Ended 30 June 2018 197200078R Operating Result Q1 Q1 Better/ FY18/19 FY17/18 R1 (Worse) ($M) ($M) (%) Total Revenue 3,844 3,864 (0.5) Q1 Better/ FY17/18 R2 (Worse) ($M) (%) 3,689
Dwight E Herring. Shoreway Environmental Center Shoreway Facility Operations Monthly Reporting May Dear Joe:
 Shoreway Environmental Center Operations Monthly Reporting Dear Joe: With the advent of China s National Sword, U. S. MRFs are unable to produce a paper product that can meet the stringent quality standards
Master Plan Phase 2 Workshop
 Master Plan Phase 2 Workshop Tampa Airport: A Legacy of Innovation and Convenience Tampa Airport: A legacy of Innovation and Convenience The world s first airport people mover Tampa Airport: A legacy of
Implications of Construction Cost Escalation
 Implications of Construction Cost Escalation 2007 ACI-NA Economics and Finance Conference James Gill, CPA Deputy Airport Director Finance, Business & Administration Raleigh-Durham Airport Authority Presentation
The North American Electric Reliability Corporation ( NERC ) hereby submits the
 hereby submits the") VIA OVERNIGHT MAIL September 10, 2015 Sheri Young, Secretary of the Board National Energy Board 517 10 th Avenue SW Calgary, Alberta T2R 0A8 Re: Notice of Filing of the North American Electric Reliability
VIA OVERNIGHT MAIL September 10, 2015 Sheri Young, Secretary of the Board National Energy Board 517 10 th Avenue SW Calgary, Alberta T2R 0A8 Re: Notice of Filing of the North American Electric Reliability
Sound Transit Operations January 2018 Service Performance Report. Ridership
 January 218 Service Performance Report Ridership Total Boardings by Mode Jan-17 Jan-18 % YTD-17 YTD-18 % ST Express 1,3,33 1,7,91.3% 1,3,33 1,7,91.3% Sounder 367,33 416,8 13.3% 367,33 416,8 13.3% Tacoma
The NESCAUM Method of Estimating Aircraft Emissions
 The NESCAUM Method of Estimating Aircraft Emissions Presentation to the OTC Mobile Source Committee December 5, 2001 Baltimore-Washington International Airport Ingrid Ulbrich Environmental Analyst NESCAUM
RENO-TAHOE INTERNATIONAL AIRPORT APRIL 2008 PASSENGER STATISTICS
 Inter-Office Memo Reno-Tahoe Airport Authority Date: June 5, 2008 To: Statistics Recipients From: Tom Medland, Director Air Service Business Development Subject: RENO-TAHOE INTERNATIONAL AIRPORT PASSENGER
Q Fast growth continued, Comparable operating result at record high levels Pekka Vauramo
 2018 Fast growth continued, Comparable operating result at record high levels 17.7.2018 Pekka Vauramo 2 A good - Comparable operating result increased to new seasonal high Revenue Comparable operating
Matt Miller, Planning Manager Margaret Heath-Schoep, Paratransit & Special Projects Manager
 DATE May 2, 218 Item #12 TO FROM GCTD Board of Directors Matt Miller, Planning Manager Margaret Heath-Schoep, Paratransit & Special Projects Manager MS SUBJECT I. EXECUTIVE SUMMARY This quarterly report
July 2012 Passenger and Cargo Traffic Statistics Reno-Tahoe International Airport
 July 2012 Passenger and Cargo Traffic Statistics Reno-Tahoe International Airport August 31, 2012 U.S. DOMESTIC INDUSTRY OVERVIEW FOR JULY 2012 All RNO Carriers Systemwide year over year comparison Average
LONG-RANGE STATE AIRCRAFT FLEET REPLACEMENT PLAN
 LONG-RANGE STATE AIRCRAFT FLEET REPLACEMENT PLAN Texas Transportation Commission Workshop December 14, 2016 Background Texas Government Code, Section 2205.032 directs the Texas Department of Transportation
DOWNTOWN, CHARLOTTE AMALIE
 TOTAL VISITOR ARRIVALS TO THE USVI : DECEMBER YEAR TO DATE DECEMBER TOTAL VISITOR ARRIVALS 2,85, 2,8, 2,814,257 2,75, 2,7, 2,65, 2,6, 2,642,118 2,71,542 2,648,5 2,55, 212 213 214 215 Visitor arrivals ended
SUPERSEDED. [Docket No. 99-NE-48-AD; Amendment ; AD ]
![SUPERSEDED. [Docket No. 99-NE-48-AD; Amendment ; AD ]](/thumbs/92/108861290.jpg "SUPERSEDED. [Docket No. 99-NE-48-AD; Amendment ; AD ]") [Federal Register: March 20, 2003 (Volume 68, Number 54)] [Rules and Regulations] [Page 13618-13619] From the Federal Register Online via GPO Access [wais.access.gpo.gov] [DOCID:fr20mr03-3] DEPARTMENT
[Federal Register: March 20, 2003 (Volume 68, Number 54)] [Rules and Regulations] [Page 13618-13619] From the Federal Register Online via GPO Access [wais.access.gpo.gov] [DOCID:fr20mr03-3] DEPARTMENT
Sound Transit Operations March 2017 Service Performance Report. Ridership. Total Boardings by Mode
 March 217 Service Performance Report Ridership ST Express Sounder Tacoma Link Link Paratransit Mar-16 Mar-17 % 1,83,4 1,621,49 2.4% 37,496 82,631 1,264,47 3,821 Total Boardings by Mode 389,98 87,39 1,89,43,297
EXHIBIT 1. BOARD AUTHORIZATION FOR PUBLIC HEARING AND SUBSEQUENT ISSUANCE OF A JOINT DEVELOPMENT SOLICITATION
 EXHIBIT 1. BOARD AUTHORIZATION FOR PUBLIC HEARING AND SUBSEQUENT ISSUANCE OF A JOINT DEVELOPMENT SOLICITATION Washington Metropolitan Area Transit Authority Board Action/Information Summary @Action O Information
EXHIBIT HOURS. ACS Biennial Convention October 4-7, 2018 Hotel Captain Cook 939 W. 5th Ave., Anchorage, AK EXHIBIT PACKAGES.
 ACS Biennial Convention October 4-7, 2018 Hotel Captain Cook 939 W. 5th Ave., Anchorage, AK 99503 EXHIBIT PACKAGES EARLY BIRD PRICING: $50 DISCOUNT IF APPLICATION AND PAYMENT ARE RECEIVED BY JULY 31! Space
Sound Transit Operations January 2017 Service Performance Report. Ridership. Total Boardings by Mode
 January 217 Service Performance Report Ridership ST Express Sounder Tacoma Link Link Paratransit Jan-16 Jan-17 % 1,433,7 1,3,33 4.9% 331,27 7,121 98,411 3,633 Total Boardings by Mode 363,6 74,823 1,76,914
air traffic statistics
 October 213 air traffic statistics Prepared by the Office of Finance Department of Internal Controls, Compliance and Financial Strategy Metropolitan Washington Airports Authority Air Traffic Statistics
May Air Traffic Statistics. Prepared by the Office of Corporate Risk and Strategy
 May 214 Air Traffic Statistics Prepared by the Office of Corporate Risk and Strategy Commercial Total Int'l Dom Air Traffic Summary May 214 Passenger Activity (in Millions) Current Month Year-to-Date Last
Local Grievance # Union Facts and Contentions (Block #17 on PS Form 8190):
:") Local Grievance # Issue Statement (Block #15 on PS Form 8190): Did management violate Sections 211.1 and 214 of the M-39 Handbook via Article 19 of the National Agreement by failing to conduct a proper
Local Grievance # Issue Statement (Block #15 on PS Form 8190): Did management violate Sections 211.1 and 214 of the M-39 Handbook via Article 19 of the National Agreement by failing to conduct a proper
PRELIMINARY ACCOUNTS FOR 2012
 INTERIM REPORT FOR Q4 2012 AND INTERIM REPORT FOR Q4 2012 AND PRELIMINARY ACCOUNTS FOR 2012 HIGHLIGHTS Q4 with growth in volume and improved normalized EBITDA MNOK 261 improvement in normalized EBITDA
COVER SHEET. Reduced Vertical Separation Minimum (RVSM) Information Sheet Part 91 RVSM Letter of Authorization
 Information Sheet Part 91 RVSM Letter of Authorization") COVER SHEET Reduced Vertical Separation Minimum (RVSM) Information Sheet Part 91 RVSM Letter of Authorization NOTE: FAA Advisory Circular 91-85, Authorization of Aircraft and Operators for Flight in Reduced
COVER SHEET Reduced Vertical Separation Minimum (RVSM) Information Sheet Part 91 RVSM Letter of Authorization NOTE: FAA Advisory Circular 91-85, Authorization of Aircraft and Operators for Flight in Reduced
Camp AB Summer Day Camp June 5, 2017 August 4, :00 am 5:00 pm Extended Day 7:00 am 6:00 pm
 Abyssinia Baptist Church 10325 Interstate Center Drive Jacksonville, Florida 32218 Phone: 904-696-1770 Web: www.abyssinia.org email: ehopkins@abyssinia.org Camp AB Summer Day Camp June 5, 2017 August 4,
air traffic statistics
 December 213 air traffic statistics Prepared by the Office of Finance Department of Internal Controls, Compliance and Financial Strategy Commercial Total Dom Int'l Passengers % Change Air Traffic Summary
Educational Assistant Staff Base Wage Determination. Information & Input Session
 Educational Assistant Staff Base Wage Determination Information & Input Session Educational Assistant Staff Base Wage Determination Group Meeting - Purpose District Sharing Information Creating a Common
Investor Update October 23, 2008
 JetBlue Airways Investor Relations (718) 709-2202 ir@jetblue.com Investor Update October 23, 2008 This investor update provides our investor guidance for the fourth quarter ending December 31, 2008 and
Weekly Performance Update
 Pr. Rupert Vancouver Grain Monitoring Program Weekly Performance Update January, 19 For Grain (1-19 CY) Summary 1. Stocks in Store (' tonnes) Country Elevators % of Working T his Week Last Week Var. fro
air traffic statistics
 September 213 air traffic statistics Prepared by the Office of Finance Department of Internal Controls, Compliance and Financial Strategy Commercial Total Int'l Dom Passengers % Change Air Traffic Summary
Weekly Performance Update
 Pr. Rupert Vancouver Grain Monitoring Program Weekly Performance Update February 19, 19 For Grain (18-19 CY) Summary 1. Stocks in Store (' tonnes) Country Elevators % of Working T his Week Last Week Var.
Air Operator Certificate Issue / Renewal Application Form (Flight Standards Directorate CAA Pakistan)
") Air Operator Certificate Issue / Renewal Application Form (Flight Standards Directorate CAA Pakistan) DOC No. CAAD-624-016 REV. No. 05 DATED: 01.02.2007 Note: Please read the instructions on last page
Air Operator Certificate Issue / Renewal Application Form (Flight Standards Directorate CAA Pakistan) DOC No. CAAD-624-016 REV. No. 05 DATED: 01.02.2007 Note: Please read the instructions on last page
air traffic statistics
 July 23 air traffic statistics Prepared by the Office of Finance Department of Internal Controls, Compliance and Financial Strategy Air Traffic Summary July 23 Below is a summary of the July 23 Air Traffic
Presentation on Results for the 3rd Quarter FY Idemitsu Kosan Co.,Ltd. February 14, 2019
 Presentation on Results for the 3rd Quarter FY 2018 Idemitsu Kosan Co.,Ltd. February 14, 2019 Table of Contents 1. FY 2018 3rd Quarter Results (1) Overview (2) Segment Information 2. Forecast for FY 2018
YEAR-END 2010 INDUSTRIAL MARKET SURVEY JACKSONVILLE
 YEAR-END 2010 INDUSTRIAL MARKET SURVEY JACKSONVILLE 2010 [ MARKET TOTALS ] Overall Market A generally positive trend in 2010 indicators points to a slow, varying recovery for the Jacksonville Metropolitan
AGENDA. Alaska Marine Highway System Background Data. Fiscal Year 2015 Look Forward. Dayboat Alaska Class Ferry Reservations & Manifest System
 AGENDA Alaska Marine Highway System Background Data Fiscal Year 2015 Look Forward Dayboat Alaska Class Ferry Reservations & Manifest System 2 MISSION STATEMENT DOT&PF: Keep Alaska moving through service
Weekly Performance Update
 Pr. Rupert Vancouver Grain Monitoring Program Weekly Performance Update January, 19 For (1-19 CY) Summary 1. Stocks in Store (' tonnes) Country Elevators % of Working T his Week Last Week Var. fro m Last
Nova Southeastern University Joint-Use Library Agreement: Review of Public Usage
 Exhibit 1 Nova Southeastern University Joint-Use Library Agreement: Robert Melton, CPA, CIA, CFE, CIG County Auditor Audit Conducted by: Gerard Boucaud, CISA, Audit Manager Dirk Hansen, CPA, Audit Supervisor
Madison Metro Transit System
 Madison Metro Transit System 1101 East Washington Avenue Madison, Wisconsin, 53703 Administrative Office: 608 266 4904 Fax: 608 267 8778 TO: FROM: SUBJECT: Plan Commission Timothy Sobota, Transit Planner,
Exhibit 4 Page 1 of 9
 % Page 1 of 9 Prior Contract No. X1054111B1 Awarded 2/12/13 (Schindler Elevator Corp.) Union Rates for Local 71 NEBA 2018 Agreement with IUEC Miami-Dade County Contract No. E9946-0/18 Awarded 12/18/17
Recommendations for Northbound Aircraft Departure Concerns over South Minneapolis
 Recommendations for Northbound Aircraft Departure Concerns over South Minneapolis March 21, 2012 Noise Oversight Committee Agenda Item #4 Minneapolis Council Member John Quincy Background Summer of 2011
November 2013 Passenger and Cargo Traffic Statistics Reno-Tahoe International Airport
 November 2013 Passenger and Cargo Traffic Statistics Reno-Tahoe International Airport December 26, 2013 U.S. DOMESTIC INDUSTRY OVERVIEW FOR NOVEMBER 2013 All RNO Carriers Domestic Systemwide year over
CONTACT: Investor Relations Corporate Communications
 NEWS RELEASE CONTACT: Investor Relations Corporate Communications 435.634.3200 435.634.3553 Investor.relations@skywest.com corporate.communications@skywest.com SkyWest, Inc. Announces Second Quarter 2017
Indiabulls Real Estate Limited (CIN : L45101DL2006PLC148314)
") Indiabulls Real Estate Limited (CIN : L45101DL2006PLC148314) Earnings Update Audited Financial Results FY 2013-14 April 23, 2014 Safe Harbor Statement This document contains certain forward looking statements
Indiabulls Real Estate Limited (CIN : L45101DL2006PLC148314) Earnings Update Audited Financial Results FY 2013-14 April 23, 2014 Safe Harbor Statement This document contains certain forward looking statements
NMEA International Conference and Expo Annual Business Meeting. September 29, 2011 Sanibel Island, Ft. Myers, Florida
 NMEA International Conference and Expo Annual Business Meeting September 29, 2011 Sanibel Island, Ft. Myers, Florida President s Membership Report NMEA International Conference and Expo Annual Business
Grain Monitoring Program
 Pr. Rupert Vancouver Grain Monitoring Program Weekly Performance Update.November, 1 For 1 (1-19 CY) Summary 1. Stocks in Store (' tonnes) Country Elevators % of Working T his Week Last Week Var. fro m
May 2011 Passenger and Cargo Traffic Statistics Reno-Tahoe International Airport
 May 2011 Passenger and Cargo Traffic Statistics Reno-Tahoe International Airport July 5, 2011 U.S. DOMESTIC INDUSTRY OVERVIEW FOR MAY 2011 All RNO Carriers Systemwide year over year comparison Average
Inter-Office Memo Reno-Tahoe Airport Authority
 Inter-Office Memo Reno-Tahoe Airport Authority Date: November 30, 2009 To: Statistics Recipients From: Krys T. Bart, A.A.E., President/CEO Subject: RENO-TAHOE INTERNATIONAL AIRPORT PASSENGER STATISTICS
DRAFT. CALIFORNIA WING SUPPLEMENT 5 CAP REGULATION December Finance FINANCIAL MANAGEMENT PROCEDURE 7 - B & C FLYING PROCEDURE
 CALIFORNIA WING SUPPLEMENT 5 CAP REGULATION 173-1 14 December 2016 DRAFT Finance FINANCIAL MANAGEMENT PROCEDURE 7 - B & C FLYING PROCEDURE CAP Regulation 173-1, dated 15 November 2012, is supplemented
Kent Business Barometer December 2018
 Kent Business Barometer December Q4 1 Contents BREXIT- Business sentiment 3 Summary of findings 4 Marketing update 5 Visitor Attractions: monthly performance 7 Visitor Attractions: quarterly performance
Fort Wayne International Airport Master Plan Study. Executive Summary
 Fort Wayne International Airport Master Plan Study Executive Summary March 2012 Introduction Airport Background Forecast of Aviation Activity Development Plans Recommended Airfield & Access Development
Premier Airport Park Airport Haul Road, Fort Myers, FL , ,890 SF FOR LEASE ALL OR PART
 Phase I Under Construction - Complete 3rd /4th Qtr 2018 Premier Airport Park Airport Haul Road, Fort Myers, FL 33913 9,180-104,890 SF FOR LEASE ALL OR PART PREMIER AIRPORT PARK PREMIER AIRPORT PARK is
Air France KLM ADM Policy In compliance with IATA resolution 850m
 Applicable as from January 2018 issuances Air France KLM ADM Policy - Letter for external communication to Travel Agents In accordance with IATA resolution 850m 1. General Scope policies ensure fare rules
Administration and Projects Committee Meeting STAFF REPORT July 3, 2014 Page 2 of 2 Agreement Consultant Project General Scope CT 107 URS Corporation
 Administration and Projects Committee Meeting STAFF REPORT Meeting Date: July 3, 2014 Subject Summary of Issues Recommendations Authorize s to Various Agreements Over the years, the Authority has contracted
RIDERSHIP TRENDS. January 2018
 RIDERSHIP TRENDS January 2018 Prepared by the Division of Strategic Capital Planning March 2018 Table of Contents Executive Summary...1 Ridership...3 Estimated Passenger Trips by Line...3 Estimated Passenger