----- AMP Data Entry Page -----
|
|
|
- Blake Carr
- 5 years ago
- Views:
Transcription
1 ----- AMP Data Entry Page Losing Facility Information Type of Distribution to Consolidate: Destinating MODS/BPI Office Facility Name & Type: Street Address: City: Panama City FL P&DF 1336 Sherman Ave Panama City State: FL 5D Facility ZIP Code: District: North Florida Area: Southwest Finance Number: Current 3D ZIP Code(s): Miles to Gaining Facility: EXFC office: Yes Plant Manager: Senior Plant Manager: District Manager: Facility Type after AMP: Eugene Green Arthur Rosenberg Eric Chavez CLOSED 2. Gaining Facility Information Facility Name & Type: Pensacola FL P&DC Street Address: 1400 W. Jordan St City: Pensacola State: FL 5D Facility ZIP Code: District: North Florida Area: Southwest Finance Number: Current 3D ZIP Code(s): 325 EXFC office: Yes Plant Manager: Senior Plant Manager: District Manager: 3. Background Information Ethel King Arthur Rosenberg Eric Chavez Start of Study: 9/15/2011 Date Range of Data: Jul : Jun Processing Days per Year: 310 Bargaining Unit Hours per Year: 1,745 EAS Hours per Year: 1,822 Date of HQ memo, DAR Factors/Cost of Borrowing/ New Facility Start-up Costs Update June 16, 2011 Date & Time this workbook was last saved: 2/16/ :52 4. Other Information Area Vice President: Vice President, Network Operations: Area AMP Coordinator: HQ AMP Coordinator: Jo Ann Feindt David E. Williams Steve Jackson Sarah Grover rev 10/10/2011 Package Page 1 AMP Data Entry Page
2
3 Gaining Facility Name and Type: Current 3D ZIP Code(s): Executive Summary Last Saved: February 16, 2012 Losing Facility Name and Type: Panama City FL P&DF Street Address: 1336 Sherman Ave City, State: Panama City, FL Current 3D ZIP Code(s): 324 Type of Distribution to Consolidate: Destinating Miles to Gaining Facility: 106 Pensacola FL P&DC 325 Summary of AMP Worksheets Savings/Costs Mail Processing Craft Workhour Savings Non-MP Craft/EAS + Shared LDCs Workhour Savings (less Maint/Trans) PCES/EAS Supervisory Workhour Savings = $1,162,789 = $81,157 = $489,082 from Workhour Costs - Proposed from Other Curr vs Prop from Other Curr vs Prop Transportation Savings = $121,991 from Transportation (HCR and PVS) Maintenance Savings = $1,507,183 from Maintenance Space Savings = $0 from Space Evaluation and Other Costs Total Annual Savings = $3,362,202 Total One-Time Costs = $616,244 from Space Evaluation and Other Costs Staffing Positions Total First Year Savings = $2,745,958 Craft Position Loss = 38 from Staffing - Craft Volume PCES/EAS Position Loss = 6 from Staffing - PCES/EAS Service Total FHP to be Transferred (Average Daily Volume) = 443,802 from Workhour Costs - Current Current FHP at Gaining Facility (Average Daily Volume) = 1,279,957 from Workhour Costs - Current Losing Facility Cancellation Volume (Average Daily Volume) = N/A Service Standard Impacts UPGRADED DOWNGRADED (= Total TPH / Operating Days) Unchanged + Upgrades Unchanged + Upgrades by ADV ADV ADV ADV % First-Class Mail #DIV/0! Priority Mail #DIV/0! Package Services #DIV/0! Periodicals N/A* N/A* N/A* N/A* Standard Mail N/A* N/A* N/A* N/A* Code to destination 3-digit ZIP Code volume is not available rev 10/15/2009 Package Page 3 AMP Executive Summary
4 Losing Facility Name and Type: Current 3D ZIP Code(s): Type of Distribution to Consolidate: Gaining Facility Name and Type: Current 3D ZIP Code(s): Summary Narrative Last Saved: February 16, 2012 Panama City FL P&DF 324 Destinating Pensacola FL P&DC 325 BACKGROUND: This feasibility study is for the consolidation of Panama City P&DF (SCF 324) destinating volumes into the Pensacola FL P&DC. Pensacola already processes the originating SCF 324 mail from the Panama City P&DF. The implementation of the originating mail AMP was completed on July 1, Panama City P&DF currently only processes the destinating mail for SCF 324. This study addresses the future consolidation of all letter and flat destinating volumes, all Express mail, and all Priority Mail from the Panama City P&DF (SCF 324) into the Pensacola P&DC (SCF 325). The current FHP from Panama City P&DF to be transferred (Average Daily Volume) is 443,802 pieces. Panama City P&DF is approximately 106 miles from the Pensacola P&DC. This study includes the full closure of the Panama City P&DF to all mail processing operations while Retail, BMEU, Box Section and Carrier Units will be considered in an additional Node Study. Consolidation is necessary due to the significant decline in originating and destinating volumes, and to increase efficiencies in processing the mail. The results of this feasibility study are based on the requirement of realigning current Service Standards with the ADC and AADC Network. FINANCIAL SUMMARY: The annual baseline data for this AMP feasibility study is taken from the period of July 1, 2010 June 30, Financial savings proposed for this consolidation of and average daily volume of 443,802 FHP destinating pieces from the Panama City P&DF (324) into the Pensacola FL P&DC are: Total Annual Savings $3,362,202 Total First Year Savings $2,745,958 A one-time cost of $616,244 will be incurred for facility construction and the relocation for mail processing equipment at the Pensacola P&DC. Currently the ADC for Panama City for First Class and Priority is the Mobile P&DC. Those volumes will shift to Pensacola if this AMP is implemented. Those volumes are not included in this study. CUSTOMER SERVICE CONSIDERATIONS: There will be no changes to collection box times and a local postmark will continue to be available at retail service locations. Specific service standard changes associated with this Area Mail Processing consolidation are contingent upon the resolution of both (a) the rulemaking in which current market dominant product service standards in 39 CFR Part 121 are being evaluated, and (b) all remaining AMP consolidation proposals that are part of the same network rationalization initiative. A complete file reflecting any new service standards will be published at once all of the related AMP decisions that provide the foundation for new service standards are made. Priority and Express Mail service standards will be based upon the capability of the network. rev 06/10/2009 Package Page 4 AMP Summary Narrative
5 Summary Narrative (continued) Summary Narrative Page 2 FSO PRELIMINARY DISPOSITION STUDY RECOMMENDATION & DESCRIPTION OF FACILITY IMPACTS Panama City P&DF (Dispose) BMEU Relocated to Panama City Northside Station located 3.07 miles away. Work hours for the BMEU are in another function and will be reallocated and/or adjusted to the new facility according to the new workload analysis; expansion and new build out will be needed for BMEU. Retail, PO Boxes and Caller Services Retail will be relocated to the Panama City Northside Station 3.07 miles; function 4 work hours will be reallocated or adjusted accordingly. Carriers Will relocate to Panama City Northside Station 3.07 miles away. Carrier work hours will be reallocated to new delivery unit. Workhours and staffing for BMEU and Retail are under a separate Customer Service Finance Number and were not modified in the AMP Study. TRANSPORTATION CHANGES: Transportation supporting the Panama City P&DF is HCR Service. Currently, there is transportation supporting the originating volumes between Panama City P&DF and Pensacola P&DC. Jacksonville NDC Eliminate service on and add two trips to Jacksonville P&DC Continue one trip on to Pensacola P&DC Mobile AL Delete daily trip from Mobile P&DC Add two trips from Mobile THS to Pensacola Route Delete the 25.5 ft truck and three 53 foot trailers Leave all current SCF 324 contracts in place (There are 2 daily trips to each office, times will need adjustment). Route 323BG Express run will be retained. These transportation changes will render a savings of $ 121,991. STAFFING IMPACTS: The approved AMP proposal identified a reduction of 38 craft employees and 6 EAS employee positions due to the consolidation of destinating operations into the Pensacola P&DC. Six positions will be retained for use in a hub operation and the workhours have been retained in the study and will need to be transferred to the site once the move is made. There are 28 craft employees in Panama City and 83 craft employees in Pensacola that are eligible to retire. Management and Craft Staffing Impacts Panama City Total Total Current Proposed On- Rolls Diff Total Current On- Rolls Pensacola Total Proposed Diff Net Diff Craft (164) (138) Management 7 - (7) (6) 1 Craft = FTR+PTR+PTF+Casuals rev 06/10/2009 Package Page 5 AMP Summary Narrative
6 Summary Narrative (continued) Summary Narrative Page 3 Mail Processing Management to Craft Ratio Management to Craft 2 Ratios Current Proposed SDOs to Craft 1 MDOs+SDOs to Craft 1 SDOs to Craft 1 MDOs+SDOs to Craft 1 (1:25 target) (1:22 target) (1:25 target) (1:22 target) Panama City 1 : 22 1 : 22 #DIV/0! #DIV/0! Pensacola 1 : 23 1 : 20 1 : 27 1 : 23 1 Craft = FTR+PTR+PTF+Casuals 2 Craft = F1 + F4 at Losing; F1 only at Gaining As a matter of policy, the Postal Service follows the Worker Adjustment and Retraining Notification Act s ( WARN ) notification requirements when the number of employees experiencing an employment loss within the meaning of WARN would trigger WARN S requirements. Some or all of the impacted employees described above may not experience an employment loss within the meaning of WARN due to transfers or reassignments. EQUIPMENT RELOCATION AND MAINTENANCE IMPACTS: The AMP feasibility study projects an annual Maintenance savings of $1,507,183. Maintenance hours to accommodate BMEU and retail office have been stayed until their move is complete. The hours will need to be transferred to their new office. Equipment identified for relocation to support operations at the Pensacola P&DC include 1 AFSM, 1 DBCS and 2 DIOSS. SUMMARY: There is a First Year savings of $2,745,958. The First Year savings only reflects the operations included in the AMP study. This figure does not include the relocation costs associated with the remaining mail processing equipment at the Panama City P&DF. The Panama City P&DF will close as a mail processing facility and all mail processing operations will be relocated to the Pensacola FL P&DC. The Area Mail Processing project to consolidate all of the Panama City P&DF operations into the Pensacola FL P&DC will result in a savings to the Postal Service of approximately $3,362,202 per year if approved. This consolidation of operations will increase processing efficiency, create substantial financial savings, and be accomplished with no inconvenience to our customers. rev 06/10/2009 Package Page 6 AMP Summary Narrative
7 Weekly Trends Beginning Day Last Saved: February 16, 2012 Losing Facility Name and Type: Panama City FL P&DF Current 3D ZIP Code(s): 324 Type of Distribution to Consolidate: Destinating Gaining Facility Name and Type: Current 3D ZIP Code(s): 24 Hour Indicator Report Facility 24 Hour Clock Pensacola FL P&DC % 100% 100% 100% Millions 100% 100% 86.9% Cancelled by 2000 Data Source = EDW MCRS OGP Cleared by 2300 Data Source = EDW EOR OGS Cleared by 2400 Data Source = EDW EOR MMP Cleared by 2400 Data Source = EDW EOR MMP Volume On Hand at 2400 Data Source = EDW MCRS Mail Assigned Commercial / FedEx By 0230 Data Source = EDW SASS DPS 2nd Pass Cleared by 0700 Data Source = EDW EOR Trips On-Time Data Source = EDW T MES % 16-Apr SAT 4/16 PANAMA CITY P&DF #VALUE! 94.4% 94.2% 23-Apr SAT 4/23 PANAMA CITY P&DF #VALUE! 92.9% 93.4% 30-Apr SAT 4/30 PANAMA CITY P&DF #VALUE! 90.3% 90.6% 7-May SAT 5/7 PANAMA CITY P&DF #VALUE! 87.2% 90.0% 14-May SAT 5/14 PANAMA CITY P&DF #VALUE! 92.0% 92.0% 21-May SAT 5/21 PANAMA CITY P&DF #VALUE! 91.0% 89.1% 28-May SAT 5/28 PANAMA CITY P&DF #VALUE! 92.7% 88.6% 4-Jun SAT 6/4 PANAMA CITY P&DF #VALUE! 93.6% 94.2% 11-Jun SAT 6/11 PANAMA CITY P&DF #VALUE! 92.0% 94.2% 18-Jun SAT 6/18 PANAMA CITY P&DF #VALUE! 94.4% 89.8% 25-Jun SAT 6/25 PANAMA CITY P&DF #VALUE! 87.4% 94.9% 2-Jul SAT 7/2 PANAMA CITY P&DF #VALUE! 90.1% 83.3% 9-Jul SAT 7/9 PANAMA CITY P&DF #VALUE! 92.4% 95.7% 16-Jul SAT 7/16 PANAMA CITY P&DF #VALUE! 99.5% 95.7% 23-Jul SAT 7/23 PANAMA CITY P&DF #VALUE! 91.3% 94.2% 30-Jul SAT 7/30 PANAMA CITY P&DF #VALUE! 89.2% 87.6% 6-Aug SAT 8/6 PANAMA CITY P&DF #VALUE! 94.0% 94.9% 13-Aug SAT 8/13 PANAMA CITY P&DF #VALUE! 92.6% 95.7% 20-Aug SAT 8/20 PANAMA CITY P&DF #VALUE! 95.1% 89.8% 27-Aug SAT 8/27 PANAMA CITY P&DF #VALUE! 95.0% 94.9% 3-Sep SAT 9/3 PANAMA CITY P&DF #VALUE! 88.7% 90.7% Weekly Trends Beginning Day % 24 Hour Indicator Report Facility 80% 100% 100% 100% Millions 100% 100% 86.9% Cancelled by 2000 Data Source = EDW MCRS 16-Apr SAT 4/16 PENSACOLA P&DC 50.7% 83.0% 97.0% % 100.0% 91.6% 23-Apr SAT 4/23 PENSACOLA P&DC 46.0% 80.4% 93.0% % 100.0% 92.2% 30-Apr SAT 4/30 PENSACOLA P&DC 31.4% 76.1% 96.4% #VALUE! 89.4% 100.0% 81.6% 7-May SAT 5/7 PENSACOLA P&DC 40.3% 76.8% 90.3% % 100.0% 82.7% 14-May SAT 5/14 PENSACOLA P&DC 47.4% 84.6% 87.9% % 100.0% 94.4% 21-May SAT 5/21 PENSACOLA P&DC 49.6% 90.0% 96.9% 93.1% % 100.0% 87.2% 28-May SAT 5/28 PENSACOLA P&DC 48.3% 94.9% 99.1% 91.5% % 100.0% 91.1% 4-Jun SAT 6/4 PENSACOLA P&DC 47.8% 94.9% 96.1% 95.5% % 100.0% 88.0% 11-Jun SAT 6/11 PENSACOLA P&DC 46.8% 97.3% 96.7% 93.3% % 100.0% 83.8% 18-Jun SAT 6/18 PENSACOLA P&DC 50.9% 97.9% 96.4% 93.3% % 100.0% 85.0% 25-Jun SAT 6/25 PENSACOLA P&DC 47.1% 97.9% 95.1% 92.5% % 100.0% 91.6% 2-Jul SAT 7/2 PENSACOLA P&DC 41.2% 92.3% 90.1% 82.0% % 100.0% 85.8% 9-Jul SAT 7/9 PENSACOLA P&DC 52.2% 97.8% 96.4% 94.1% % 100.0% 82.6% 16-Jul SAT 7/16 PENSACOLA P&DC 52.7% 98.6% 99.7% 96.5% % 100.0% 87.4% 23-Jul SAT 7/23 PENSACOLA P&DC 51.3% 98.2% 98.9% 93.9% % 100.0% 83.8% 30-Jul SAT 7/30 PENSACOLA P&DC 53.9% 99.5% 93.8% 90.8% % 100.0% 79.6% 6-Aug SAT 8/6 PENSACOLA P&DC 48.9% 99.5% 95.0% 87.1% % 100.0% 91.0% 13-Aug SAT 8/13 PENSACOLA P&DC 51.7% 99.5% 97.4% 90.7% % 100.0% 84.4% 20-Aug SAT 8/20 PENSACOLA P&DC 50.4% 99.7% 91.6% 93.7% % 100.0% 87.4% 27-Aug SAT 8/27 PENSACOLA P&DC 42.1% 99.4% 91.2% 92.4% #VALUE! 97.0% 100.0% 91.3% 3-Sep SAT 9/3 PENSACOLA P&DC 48.7% 98.7% 77.5% 88.4% #VALUE! 90.3% 100.0% 85.5% OGP Cleared by 2300 Data Source = EDW EOR OGS Cleared by 2400 Data Source = EDW EOR MMP Cleared by 2400 Data Source = EDW EOR MMP Volume On Hand at 2400 Data Source = EDW MCRS Mail Assigned Commercial / FedEx By 0230 Data Source = EDW SASS DPS 2nd Pass Cleared by 0700 Data Source = EDW EOR Trips On-Time Data Source = EDW TMES rev 04/2/2008 Package Page 7 AMP 24 Hour Clock
: Pensacola FL P&DC 325 rev 03/20/2008 Package Page 8 AMP")
8 Losing Facility Name and Type: Panama City FL P&DF Current 3D ZIP Code(s): 324 Miles to Gaining Facility: 106 MAP Last Saved: February 16, 2012 Gaining Facility Name and Type: Current 3D ZIP Code(s): Pensacola FL P&DC 325 rev 03/20/2008 Package Page 8 AMP MAP
9 Service Standard Impacts Last Saved: February 16, 2012 Losing Facility: Panama City FL P&DF Losing Facility 3D ZIP Code(s): Gaining Facility 3D ZIP Code(s): Based on report prepared by Network Integration Support dated: mm/dd/yyyy Service Standard Changes - Average Daily Volume (data obtained from ODIS is derived from sampling and may vary from actual volume) FCM PRI PER * STD * PSVC ALL CLASSES Overnight % Change All Others % Change Total % Change All % Change All % Change All % Change All % Change All % Change UPGRADE TBD DOWNGRADE TBD TOTAL TBD NET UP+NO CHNG TBD VOLUME TOTAL TBD * - Periodical and Standard mail origin 3-digit ZIP Code to destination 3-digit ZIP Code volume is not available Selected summary fields are transferred to the Executive Summary Service Standard Changes - Pairs FCM PRI PER STD PSVC ALL CLASSES Overnight % Change All Others % Change Total % Change All % Change All % Change All % Change All % Change All % Change UPGRADE TBD DOWNGRADE TBD TOTAL TBD NET TBD rev 10/16/2009 Package Page 9 AMP Service Standard Impacts
10 (WorkBook Tab Notification - 1) Losing Facility: Panama City FL P&DF Stakeholders Notification Last Saved: February 16, 2012 Stakeholder Notification Page 1 AMP Event: Start of Study Package Page 10 rev 07/16/2008 AMP Stakeholders Notification
11

12

13
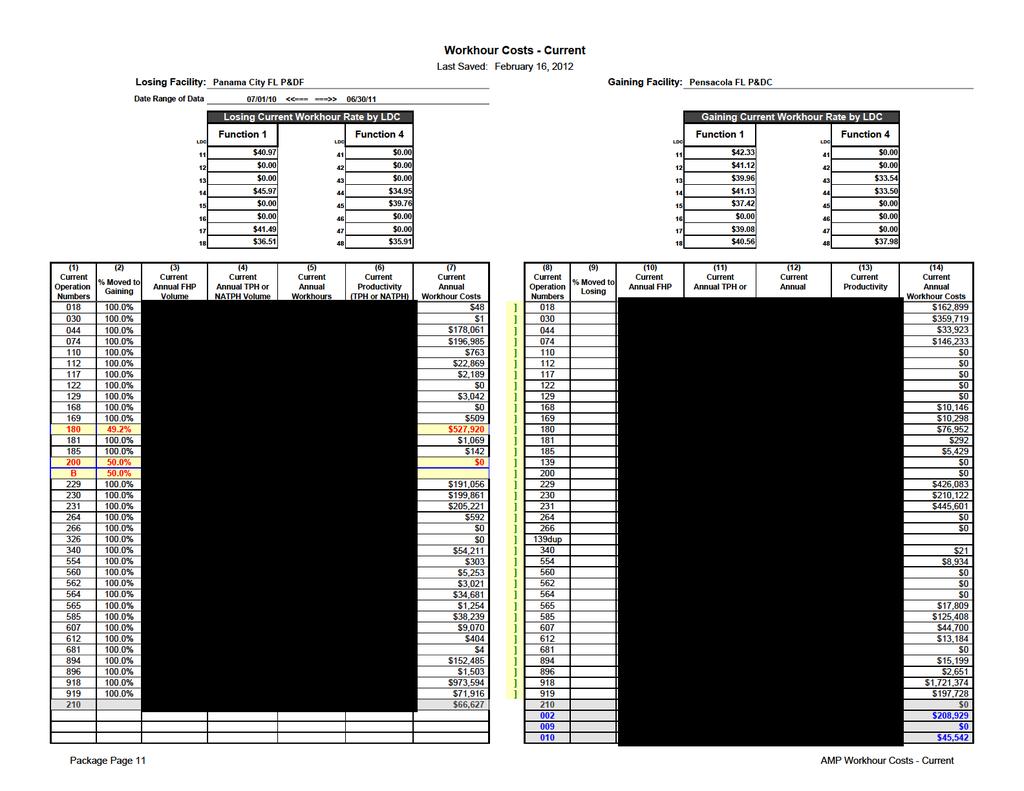
14 (1) (2) (3) (4) (5) (6) (7) (8) (9) (10) (11) (12) (13) (14) Current Current Current Current Current Current Current Current Current Current Current Current % Moved to % Moved to Operation Annual FHP Annual TPH or Annual Productivity Annual Operation Annual FHP Annual TPH or Annual Productivity Annual Gaining Losing Numbers Volume NATPH Volume Workhours (TPH or NATPH) Workhour Costs Numbers Volume NATPH Volume Workhours (TPH or NATPH) Workhour Costs Package Page 14 AMP Workhour Costs - Current
15 (1) (2) (3) (4) (5) (6) (7) (8) (9) (10) (11) (12) (13) (14) Current Current Current Current Current Current Current Current Current Current Current Current % Moved to % Moved to Operation Annual FHP Annual TPH or Annual Productivity Annual Operation Annual FHP Annual TPH or Annual Productivity Annual Gaining Losing Numbers Volume NATPH Volume Workhours (TPH or NATPH) Workhour Costs Numbers Volume NATPH Volume Workhours (TPH or NATPH) Workhour Costs Package Page 15 AMP Workhour Costs - Current
16 (1) (2) (3) (4) (5) (6) (7) (8) (9) (10) (11) (12) (13) (14) Current Current Current Current Current Current Current Current Current Current Current Current % Moved to % Moved to Operation Annual FHP Annual TPH or Annual Productivity Annual Operation Annual FHP Annual TPH or Annual Productivity Annual Gaining Losing Numbers Volume NATPH Volume Workhours (TPH or NATPH) Workhour Costs Numbers Volume NATPH Volume Workhours (TPH or NATPH) Workhour Costs Totals Moved to Gain 137,578, ,006,157 69,294 5,397 $2,876,266 Impact to Gain 132,143, ,274,189 98,532 6,478 $4,034,704 Impact to Lose No Calc $0 Moved to Lose No Calc $0 Total Impact 137,578, ,006,157 69,294 5,397 $2,876,266 Total Impact 132,143, ,274,189 98,532 6,478 $4,034,704 Totals Non-impacted 0 29,874 1, $66,627 Non-impacted 0 50,458 0 No Calc $0 Gain Only 264,643, ,081, ,987 2,564 $7,030,492 All 137,578, ,036,031 70,900 5,276 $2,942,893 All 396,786,789 1,084,405, ,519 3,979 $11,065,196 Total FHP to be Transferred (Average Daily Volume) : 443,802 (This number is carried forward to AMP Worksheet Executive Summary ) Current FHP at Gaining Facility (Average Daily Volume) : 1,279,957 (This number is carried forward to AMP Worksheet Executive Summary ) Combined Current Workhour Annual Workhour Costs : $14,008,089 (This number is carried forward to the bottom of AMP Worksheet Workhour Costs-Proposed ) Comb Totals Impact to Gain 269,722,163 1,012,280, ,825 6,032 $6,910,970 Impact to Lose No Calc $0 Total Impact 269,722,163 1,012,280, ,825 6,032 $6,910,970 Non-impacted 0 80,332 1, $66,627 Gain Only 264,643, ,081, ,987 2,564 $7,030,492 All 534,365,290 1,458,441, ,418 4,247 $14,008,089. rev 06/11/2008 Package Page 16 AMP Workhour Costs - Current
17
18
19
20 (1) (2) (3) (4) (5) (6) (7) (8) (9) (10) (11) (12) Proposed Proposed Proposed Proposed Proposed Proposed Proposed Proposed Proposed Proposed Proposed Proposed Operation Annual FHP Annual TPH or Annual Productivity Annual Operation Annual FHP Annual TPH or Annual Productivity Annual Numbers Volume NATPH Volume Workhours (TPH or NATPH) Workhour Costs Numbers Volume NATPH Volume Workhours (TPH or NATPH) Workhour Costs Package Page 20 AMP Workhour Costs - Proposed
21 (1) (2) (3) (4) (5) (6) (7) (8) (9) (10) (11) (12) Proposed Proposed Proposed Proposed Proposed Proposed Proposed Proposed Proposed Proposed Proposed Proposed Operation Annual FHP Annual TPH or Annual Productivity Annual Operation Annual FHP Annual TPH or Annual Productivity Annual Numbers Volume NATPH Volume Workhours (TPH or NATPH) Workhour Costs Numbers Volume NATPH Volume Workhours (TPH or NATPH) Workhour Costs Package Page 21 AMP Workhour Costs - Proposed
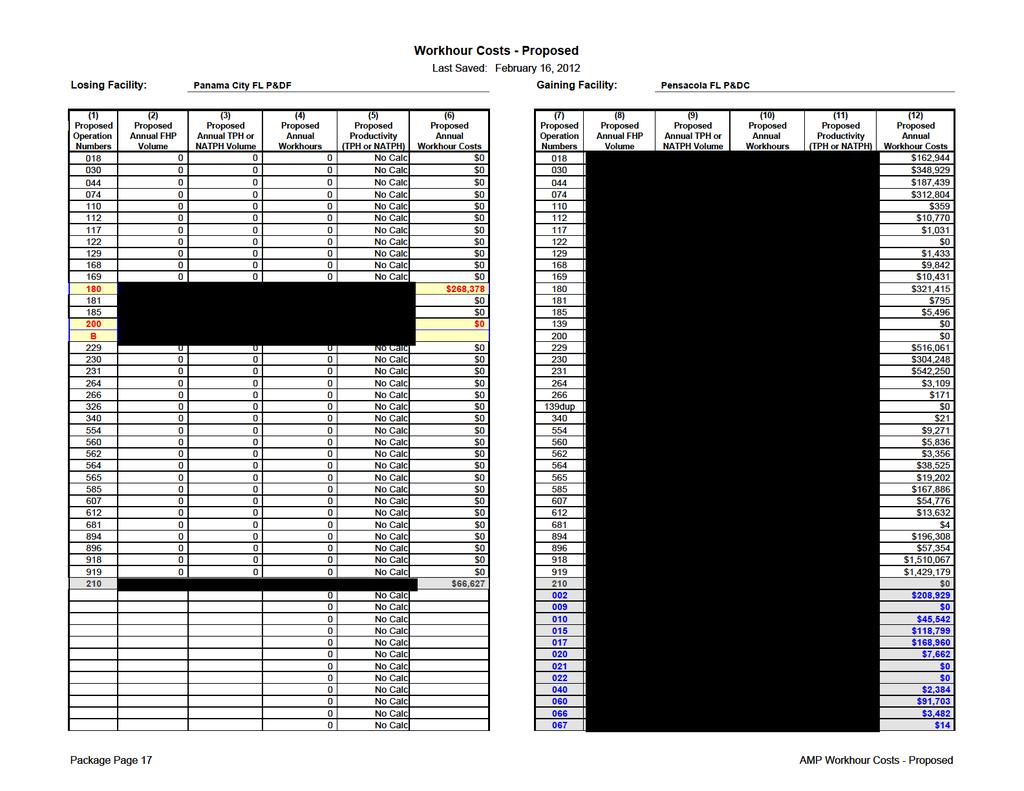
22 (1) (2) (3) (4) (5) (6) (7) (8) (9) (10) (11) (12) Proposed Proposed Proposed Proposed Proposed Proposed Proposed Proposed Proposed Proposed Proposed Proposed Operation Annual FHP Annual TPH or Annual Productivity Annual Operation Annual FHP Annual TPH or Annual Productivity Annual Numbers Volume NATPH Volume Workhours (TPH or NATPH) Workhour Costs Numbers Volume NATPH Volume Workhours (TPH or NATPH) Workhour Costs Moved to Gain 0 26,633,263 6,469 4,117 $268,378 Impact to Gain 269,722, ,647, ,127 6,479 $6,244,942 Impact to Lose No Calc $0 Moved to Lose No Calc $0 Total Impact 0 26,633,263 6,469 4,117 $268,378 Total Impact 269,722, ,647, ,127 6,479 $6,244,942 Non Impacted 0 29,874 1, $66,627 Non Impacted 0 50,458 0 No Calc $0 Gain Only 264,643, ,081, ,493 2,869 $6,265,352 All 0 26,663,137 8,075 3,302 $335,005 All 534,365,290 1,431,778, ,620 4,654 $12,510,294 Package Page 22 AMP Workhour Costs - Proposed
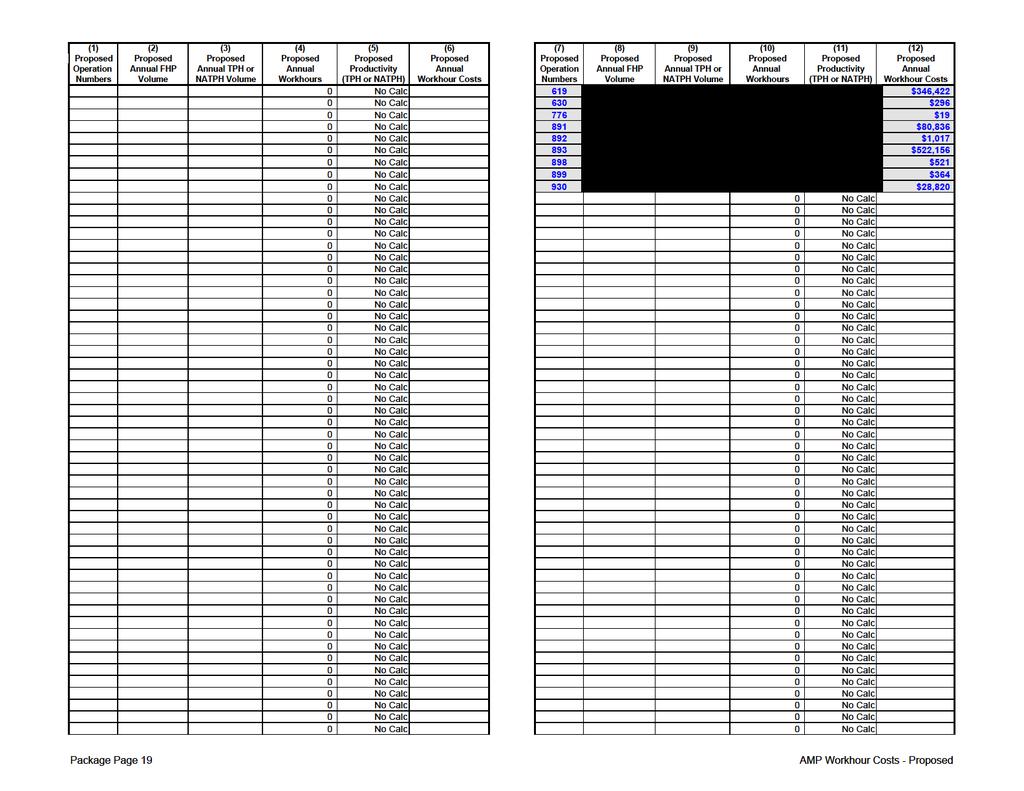
23 (1) (2) (3) (4) (5) (6) (7) (8) (9) (10) (11) (12) Proposed Proposed Proposed Proposed Proposed Proposed Proposed Proposed Proposed Proposed Proposed Proposed Operation Annual FHP Annual TPH or Annual Productivity Annual Operation Annual FHP Annual TPH or Annual Productivity Annual Numbers Volume NATPH Volume Workhours (TPH or NATPH) Workhour Costs Numbers Volume NATPH Volume Workhours (TPH or NATPH) Workhour Costs (13) New Flow Adjustments at Losing Facility (14) New Flow Adjustments at Gaining Facility Op# FHP TPH/NATPH Workhours Productivity Workhour Cost Op# FHP TPH/NATPH Workhours Productivity Workhour Cost Totals No Calc $0 Totals No Calc $0 Impact to Gain 269,722,163 1,012,280, ,596 6,383 $6,513,321 Combined Current Annual Workhour Cost : $14,008,089 Impact to Lose No Calc $0 (This number brought forward from Workhour Costs - Current ) Total Impact 269,722,163 1,012,280, ,596 6,383 $6,513,321 Non-impacted 0 80,332 1, $66,627 Proposed Annual Workhour Cost : $12,845,300 Gain Only 264,643, ,081, ,493 2,869 $6,265,352 (Total of Columns 6 and 12 on this page) Tot Before Adj 534,365,290 1,458,441, ,695 4,620 $12,845,300 Lose Adj No Calc $0 Minimum Function 1 Workhour Savings : $34,938 Gain Adj No Calc $0 (This number represents proposed workhour savings with no productivity improvements All 534,365,290 1,458,441, ,695 4,620 $12,845,300 applied to operations at the gaining facility) Function 1 Workhour Savings : $1,162,789 (This number equals the difference in the current and proposed workhour costs above and is carried forward to the Executive Summary ) Comb Totals Cost Impact Comb Current 534,365,290 1,458,441, ,418 4,247 $14,008,089 Proposed 534,365,290 1,458,441, ,695 4,620 $12,845,300 Change 0 0 (27,723) ($1,162,789) Change % 0.0% 0.0% -8.1% -8.3% rev 04/02/2009 Package Page 23 AMP Workhour Costs - Proposed

24
25 Package Page 25 AMP Other Curr vs Prop

26
27 Package Page 27 AMP Other Curr vs Prop

28

29
30 Staffing - Management Last Saved: February 16, 2012 Losing Facility: Panama City FL P&DF Data Extraction Date: Finance Number: (1) Position Title Management Positions (2) (3) (4) (5) (6) Current Auth Staffing Current On-Rolls Proposed Staffing Line Level Difference 1 MGR PROCESSING/DISTRIBUTION FCLTY EAS MGR MAINTENANCE EAS SUPV DISTRIBUTION OPERATIONS EAS SUPV MAINTENANCE OPERATIONS EAS OPERATIONS SUPPORT SPECIALIST EAS Package Page 30 AMP Staffing - PCES/EAS
31 Totals (7) Retirement Eligibles: 0 Position Loss: 7 Package Page 31 AMP Staffing - PCES/EAS
32 Gaining Facility: Pensacola FL P&DC Data Extraction Date: Finance Number: (12) Position Title Management Positions (13) (14) (15) (16) (17) Current Auth Staffing Current On-Rolls Proposed Staffing Line Level Difference 1 MGR PROCESSING/DISTRIBUTION EAS MGR MAINTENANCE EAS MGR DISTRIBUTION OPERATIONS EAS OPERATIONS SUPPORT SPECIALIST EAS OPERATIONS SUPPORT SPECIALIST EAS SUPV DISTRIBUTION OPERATIONS EAS SUPV MAINTENANCE OPERATIONS EAS NETWORKS SPECIALIST EAS SECRETARY (FLD) EAS Package Page 32 AMP Staffing - PCES/EAS
33 Total Retirement Eligibles: 0 Position Loss: (1) Total PCES/EAS Position Loss: 6 (This number carried forward to the Executive Summary ) rev 11/05/2008 Package Page 33 AMP Staffing - PCES/EAS
34 Losing Facility: Panama City FL P&DF Finance Number: (1) (2) (3) (4) (5) (6) Craft Positions Casuals/PSEs Part Time Full Time Total Total On-Rolls On-Rolls On-Rolls On-Rolls Proposed Difference Function 1 - Clerk (29) Function 4 - Clerk Function 1 - Mail Handler (8) Function 4 - Mail Handler Function 1 & 4 Sub-Total (37) Function 3A - Vehicle Service Function 3B - Maintenance (24) Functions Lmtd/Rehab/WC (1) Other Functions (2) Total (64) Retirement Eligibles: 28 Staffing - Craft Last Saved: February 16, 2012 Data Extraction Date: 10/01/11 Gaining Facility: Pensacola FL P&DC Finance Number: Data Extraction Date: (7) (8) (9) (10) (11) (12) Craft Positions Casuals/PSEs Part Time Full Time Total Total On-Rolls On-Rolls On-Rolls On-Rolls Proposed Difference Function 1 - Clerk Function 1 - Mail Handler Function 1 Sub-Total Function 3A - Vehicle Service Function 3B - Maintenance Functions Lmtd/Rehab/WC Other Functions Total Retirement Eligibles: 83 Total Craft Position Loss: 38 (This number carried forward to the Executive Summary ) (13) Notes: 6 MH left for hubbing operations. Proposed authorized maint staffing per HQ Fnc review rev 11/05/2008 Package Page 34 AMP Staffing - Craft
35 Losing Facility: Panama City FL P&DF Date Range of Data: Jul : Jun Maintenance Last Saved: February 16, 2012 Gaining Facility: Pensacola FL P&DC (1) (2) (3) (4) (5) (6) Workhour Activity Current Cost Proposed Cost Difference Workhour Activity Current Cost Proposed Cost Difference LDC 36 Mail Processing Equipment $ 885,542 $ 0 $ (885,542) LDC 36 Mail Processing $ 2,123,795 $ 2,595,529 $ 471,734 Equipment LDC 37 Building Equipment $ 425,122 $ 165,270 $ (259,852) LDC 37 Building Equipment $ 1,546,030 $ 1,546,030 $ 0 LDC 38 Building Services (Custodial Cleaning) $ 806,614 $ 306,231 $ (500,383) LDC 38 Building Services (Custodial Cleaning) $ 755,907 $ 755,907 $ 0 LDC 39 LDC 93 Maintenance Operations Support $ 172,079 $ 0 $ (172,079) LDC 39 Maintenance $ 293,727 $ 293,727 $ 0 Operations Support Maintenance Training $ 9,382 $ 0 $ (9,382) LDC 93 Maintenance $ 60,055 $ 69,114 $ 9,059 Training Workhour Cost Subtotal $ 2,298,739 $ 471,502 $ (1,827,238) Workhour Cost Subtotal $ 4,779,514 $ 5,260,307 $ 480,793 Other Related Maintenance & Facility Costs Current Cost Proposed Cost Difference Other Related Maintenance & Facility Costs Current Cost Proposed Cost Difference Total Maintenance Parts, Supplies & Facility Utilities $ 366,939 $ 0 $ (366,939) Total Maintenance Parts, Supplies & $ 1,030,998 $ 1,237,198 $ 206,200 Facility Utilities Adjustments (from "Other Curr vs Prop" tab) $ 0 Adjustments (from "Other Curr vs Prop" tab) $ 0 Grand Total $ 2,665,678 $ 471,502 $ (2,194,177) Grand Total $ 5,810,512 $ 6,497,505 $ 686,993 Annual Maintenance Savings: $1,507,183 (This number carried forward to the Executive Summary ) (7) Notes: rev 04/13/2009 Package Page 35 AMP Maintenance

36
37 Transportation - HCR Last Saved: February 16, 2012 Losing Facility: Panama City FL P&DF Type of Distribution to Consolidate: Destinating Gaining Facility: Pensacola FL P&DC CET for cancellations: CET for OGP: Date of HCR Data File: CT for Outbound Dock: Current Current Current Proposed Proposed Proposed Current Current Current Proposed Proposed Proposed Route Annual Annual Cost per Annual Annual Cost per Route Annual Annual Cost per Annual Annual Cost per Numbers Mileage Cost Mile Mileage Cost Mile Numbers Mileage Cost Mile Mileage Cost Mile ,428 $209,415 $ $2 $ ,670 $163,350 $ ,230,233 $1,439,373 $ A8 110,899 $164,694 $ A 125,714 $335,656 $ AA 31,762 $134,173 $ B 64,931 $124,668 $ B3 61,941 $97,202 $ BG 81,725 $79,828 $ CA 18,667 $62,628 $ DA 41,418 $83,972 $ L2 82,431 $135,560 $ L3 111,909 $169,977 $ L4 159,463 $295,672 $ ,639 $241,547 $ BG 81,725 $79,828 $ ,741 $655,100 $1.16 Package Page 37 AMP Transportation - HCR
38 Current Current Current Proposed Proposed Proposed Current Current Current Proposed Proposed Proposed Route Annual Annual Cost per Annual Annual Cost per Route Annual Annual Cost per Annual Annual Cost per Numbers Mileage Cost Mile Mileage Cost Mile Numbers Mileage Cost Mile Mileage Cost Mile Package Page 38 AMP Transportation - HCR
39 Current Current Current Proposed Proposed Proposed Current Current Current Proposed Proposed Proposed Route Annual Annual Cost per Annual Annual Cost per Route Annual Annual Cost per Annual Annual Cost per Numbers Mileage Cost Mile Mileage Cost Mile Numbers Mileage Cost Mile Mileage Cost Mile Totals 1,589, ,588 Totals 1,502,604 2,151,585 Other Other Current Moving Trips from Current Moving Trips from Changes Proposed Result Changes Losing to Gain (-) Gaining Gaining to Lose (-) Losing (+/-) (+/-) Proposed Trip Impacts Proposed Trip Impacts Proposed Result HCR Annual Savings (Losing Facility): $976,475 HCR Annual Savings (Gaining Facility): ($854,484) Total HCR Transportation Savings: $121,991 <<== (This number is summed with Total from 'Trans-PVS' and carried forward to the Executive Summary as Transportation Savings ) rev 11/05/2008 Package Page 39 AMP Transportation - HCR
40 Distribution Changes Last Saved: February 16, 2012 Losing Facility: Panama City FL P&DF Type of Distribution to Consolidate Destinating Indicate each DMM labeling list affected by placing an If revisions to DMM L005 or DMM L201 are needed, indicate "X" to the left of the list. proposed DMM label change below. (1) (2) DMM Labeling List L005-3-Digit ZIP Code Prefix Groups - SCF Sortation DMM L001 DMM L011 From: X DMM L002 DMM L201 Action Code* Column A - 3-Digit ZIP Code Prefix Group Column B - Label to DMM L003 DMM L601 D 324 PANAMA CITY FL 324 DMM L004 DMM L602 CF 325 PENSACOLA FL 325 X DMM L005 DMM L603 To: DMM L006 DMM L007 DMM L604 Action Code* Column A - 3-Digit ZIP Code Prefix Group DMM L605 CT 324, 325 Column B - Label to PENSACOLA FL 325 DMM L008 DMM L606 DMM L009 X DMM L607 *Action Codes: A=add D=delete CF-change from CT=change to Important Note: Section 2 & 3 illustrate possible changes to DMM labeling lists. Section 2 relates to consolidation of Destination DMM L010 DMM L801 Operations. Section 3 pertains to Originating Operations. The Area Distribution Network group will submit appropriate requests for DMM changes after AMP approval. (3) DMM Labeling List L201 - Periodicals Origin Split Action Code* Column A - Entry ZIP Codes Column B - 3-Digit ZIP Code Destinations Column C - Label to Column C - Label to Action Code* Column A - Entry ZIP Codes Column B - 3-Digit ZIP Code Destinations Column C - Label to Action Code* Column A - Entry ZIP Codes Column B - 3-Digit ZIP Code Destinations Column C - Label to Action Code* Column A - Entry ZIP Codes Column B - 3-Digit ZIP Code Destinations Column C - Label to *Action Codes: A=add D=delete CF-change from CT=change to (4) Drop Shipments for Destination Entry Discounts - FAST Appointment Summary Report Month Losing/Gaining NASS Total No-Show Late Arrival Open Closed Unschd Facility Name Code Schd Appts Count % Count % Count % Count % Count Oct-11 Losing Facility 324 Panama City % 43 20% 0 0% % 6 Sep-11 Losing Facility 324 Panama City % 39 19% 0 0% % 1 Oct-11 Gaining Facility 325 Pensacola % 62 19% 0 0% % 3 Sep-11 Gaining Facility 325 Pensacola % 52 16% 0 0% % 7 (5) Notes rev 5/14/2009 Package Page 40 AMP Distr bution Changes
41 Losing Facility: Panama City FL P&DF Data Extraction Date: MPE Inventory Last Saved: February 16, 2012 Gaining Facility: Pensacola FL P&DC (1) (2) (3) (4) (5) (6) (7) (8) Current Proposed Current Proposed Equipment Equipment Difference Equipment Difference Number Number Number Number Change Type Type AFCS 0 0 AFCS 3 2 (1) (1) AFCS AFCS Relocation Costs AFSM - ALL AFSM - ALL $141,064 APPS 0 0 APPS CIOSS 0 0 CIOSS CSBCS 0 0 CSBCS DBCS 5 0 (5) DBCS (4) $8,060 DBCS-OSS 0 0 DBCS-OSS DIOSS 1 0 (1) DIOSS $16,120 FSS 0 0 FSS SPBS SPBS UFSM 2 0 (2) UFSM 0 0 (2) FC / MICRO MARK 0 0 FC / MICRO MARK ROBOT GANTRY 0 0 ROBOT GANTRY HSTS / HSUS 0 0 HSTS / HSUS LCTS / LCUS 0 0 LCTS / LCUS LIPS 0 0 LIPS MPBCS-OSS 0 0 MPBCS-OSS TABBER 0 0 TABBER PIV 0 0 PIV #VALUE! LCREM 0 0 LCREM #VALUE! Mail Processing Equipment Relocation Costs from Losing to Gaining Facility: $165,244 (9) Notes: Costs for relocation of 1 AFSM, 1 DBCS, 2 DIOSS Relocation costs for excessed equipment will not be incurred in this study. (This number is carried forward to Space Evaluation and Other Costs ) rev 03/04/2008 Package Page 41 AMP MPE Inventory
42 Losing Facility: Panama City FL P&DF 5-Digit ZIP Code: Data Extraction Date: Customer Service Issues Last Saved: February 16, Digit ZIP Code: Digit ZIP Code: 3-Digit ZIP Code: 3-Digit ZIP Code: Current Current Current Current 1. Collection Points Mon. - Fri. Sat. Mon. - Fri. Sat. Mon. - Fri. Sat. Mon. - Fri. Sat. Number picked up before 1 p.m Number picked up between 1-5 p.m Number picked up after 5 p.m Total Number of Collection Points How many collection boxes are designated for "local delivery"? 3. How many "local delivery" boxes will be removed as a result of AMP? 4. Delivery Performance Report Quarter/FY Percent % Carriers returning before 5 p.m. QTR 3 FY % QTR 2 FY % QTR 1 FY % QTR 4 FY % 5. Retail Unit Inside Losing Facility (Window Service Times) 6. Business (Bulk) Mail Acceptance Hours Current Proposed Current Proposed Start End Start End Start End Start End Monday 9:00 17:30 None None Monday 11:00 17:30 None None Tuesday 9:00 17:30 None None Tuesday 11:00 17:30 None None Wednesday 9:00 17:30 None None Wednesday 11:00 17:30 None None Thursday 9:00 17:30 None None Thursday 11:00 17:30 None None Friday 9:00 17:30 None None Friday 11:00 17:30 None None Saturday 9:00 12:30 None None Saturday 7. Can customers obtain a local postmark in accordance with applicable policies in the Postal Operations Manual? 8. Notes: Gaining Facility: Pensacola FL P&DC 9. What postmark will be printed on collection mail? Line 1 PENSACOLA FL P&DC 325 Line 2 rev 6/18/2008 Package Page 42 AMP Customer Service Issues
43 Space Evaluation and Other Costs Losing Facility: Panama City FL P&DF Last Saved: February 16, 2012 Space Evaluation 1. Affected Facility Facility Name: Street Address: City, State ZIP: Panama City FL P&DF 1336 Sherman Ave Panama City, FL Lease Information. (If not leased skip to 3 below.) Enter annual lease cost: Enter lease expiration date: Enter lease options/terms: 3. Current Square Footage Enter the total interior square footage of the facility: Enter gained square footage expected with the AMP: USPS OWNED USPS OWNED USPS OWNED 123,000 sq ft 4. Planned use for acquired space from approved AMP 5. Facility Costs 6. Savings Information Enter any projected one-time facility costs: Space Savings ($): $451,000 (This number shown below under One-Time Costs section. (This number carried forward to the Executive Summary ) 7. Notes Employee Relocation Costs: One-Time Costs Mail Processing Equipment Relocation Costs: (from MPE Inventory ) Facility Costs: (from above) Total One-Time Costs: $165,244 $451,000 $616,244 (This number carried forward to Executive Summary ) Remote Encoding Center Cost per 1000 Losing Facility: Panama City FL P&DF Gaining Facility: Pensacola FL P&DC Package Page 43 AMP Space Evaluation and Other Costs
----- AMP Data Entry Page -----
 Type of Distribution to Consolidate: Orig & Dest Non-MODS/Non-BPI Office Facility Name & Type: Street Address: City: Carbondale CSMPC 1301 E Main St Carbondale State: IL 5D Facility ZIP Code: 62901 District:
----- AMP Data Entry Page -----
 ----- AMP Data Entry Page ----- 1. Losing Facility Information Type of Distribution to Consolidate: Destinating Non-MODS/Non-BPI Office Facility Name & Type: Street Address: City: Centralia CSMPC 314 S
----- AMP Data Entry Page -----
 ----- AMP Data Entry Page ----- 1. Losing Facility Information Type of Distribution to Consolidate: Orig & Dest MODS/BPI Office Facility Name & Type: Street Address: City: Paducah P&D F 300 S 4th St Paducah
----- AMP Data Entry Page -----
 Type of Distribution to Consolidate: Orig & Dest Non-MODS/Non-BPI Office Facility Name & Type: Street Address: City: Owensboro CSMPC 54 Bon Harbor Hls Owensboro State: KY 5D Facility ZIP Code: 42301 District:
----- AMP Data Entry Page -----
 ----- AMP Data Entry Page ----- 1. Losing Facility Information Type of Distribution to Consolidate: Destinating MODS/BPI Office Facility Name & Type: Street Address: City: Columbus GA CSMPC 3916 Milgen
March 12, Certified Mail Tracking Number:
 March 12, 2014 Mr. Mark Dimondstein President American Postal Workers Union, AFL-CIO 1300 L Street, NW Washington, DC 20005-4128 Certified Mail Tracking Number: 7013 1090 0002 4435 8007 Dear Mark: As information,
August 13, Certified Mail Tracking Number:
 August 13, 2013 Mr. Cliff Guffey President American Postal Workers Union, AFL-CIO 1300 L Street, NW Washington, DC 20005-4128 Certified Mail Tracking Number: 7013 1090 0002 44351572 Dear Cliff: As information,
With the completion of this project, we would like to follow-up on the projections as well as highlight a few other items:
 TO: FROM: Mayor and Council Interim City Manager Rebecca Underhill, Director of Finance DATE: February 28, 2014 SUBJECT: Water Meter Project Analysis On March 28, 2012, Acting City Manager Mike Loftin
October 2013 Passenger and Cargo Traffic Statistics Reno-Tahoe International Airport
 October 2013 Passenger and Cargo Traffic Statistics Reno-Tahoe International Airport December 4, 2013 U.S. DOMESTIC INDUSTRY OVERVIEW FOR OCTOBER 2013 All RNO Carriers Systemwide year over year comparison
May Air Traffic Statistics. Prepared by the Office of Corporate Risk and Strategy
 May 214 Air Traffic Statistics Prepared by the Office of Corporate Risk and Strategy Commercial Total Int'l Dom Air Traffic Summary May 214 Passenger Activity (in Millions) Current Month Year-to-Date Last
air traffic statistics
 September 213 air traffic statistics Prepared by the Office of Finance Department of Internal Controls, Compliance and Financial Strategy Commercial Total Int'l Dom Passengers % Change Air Traffic Summary
air traffic statistics
 October 213 air traffic statistics Prepared by the Office of Finance Department of Internal Controls, Compliance and Financial Strategy Metropolitan Washington Airports Authority Air Traffic Statistics
Service Performance Election / Political Mail Update Hurricane Michael California Wild Fires National Operations Control Center Update MTE Update
 November 27, 2018 USPS Leadership Forum for Stakeholders Service Performance Election / Political Mail Update Hurricane Michael California Wild Fires National Operations Control Center Update MTE Update
Industry Update. ACI-NA Winter Board of Directors Meeting February 3, 2016 Orlando, FL
 Industry Update ACI-NA Winter Board of Directors Meeting February 3, 2016 Orlando, FL U.S. & Canadian GDP 8% 6% 4% U.S.* Canada** Estimate by BEA as of 02/11/16 2% 0% -2% -4% -6% -8% -10% The U.S. economy
AUGUST 2008 MONTHLY PASSENGER AND CARGO STATISTICS
 Inter-Office Memo Reno-Tahoe Airport Authority Date: October 2, 2008 To: Statistics Recipients From: Tom Medland, Director Air Service Business Development Subject: RENO-TAHOE INTERNATIONAL AIRPORT PASSENGER
SYSTEM BRIEF DAILY SUMMARY
 SYSTEM BRIEF SUMMARY * ANNUAL (PEAK HOURS 7:00 AM TO 10:00 PM MON-SAT) MaxTemp NEL (MWH) Hr Ending Hr Ending LOAD ENERGY (MWH) INCREMENTAL COST DAY DATE Civic TOTAL MAXIMUM @Max MINIMUM @Min FACTOR ON
air traffic statistics
 December 213 air traffic statistics Prepared by the Office of Finance Department of Internal Controls, Compliance and Financial Strategy Commercial Total Dom Int'l Passengers % Change Air Traffic Summary
Office of Program Policy Analysis And Government Accountability
 THE FLORIDA LEGISLATURE Report No. 98-70 Office of Program Policy Analysis And Government Accountability John W. Turcotte, Director February 1999 Preliminary Review of the Suspension of the State Contract
Corporate presentation CIBC Whistler Institutional Investor Conference January 21, 2010
 Corporate presentation CIBC Whistler Institutional Investor Conference January 21, 2010 Forwardlooking statement Certain information in this presentation and statements made during this presentation, including
Q1 Fiscal 2019 Statistics
 Q1 Fiscal 2019 Statistics FedEx Corporation Financial and Operating Statistics First Quarter Fiscal 2019 September 17, 2018 This report is a statistical supplement to FedEx s interim financial reports
LONG-RANGE STATE AIRCRAFT FLEET REPLACEMENT PLAN
 LONG-RANGE STATE AIRCRAFT FLEET REPLACEMENT PLAN Texas Transportation Commission Workshop December 14, 2016 Background Texas Government Code, Section 2205.032 directs the Texas Department of Transportation
Implications of Construction Cost Escalation
 Implications of Construction Cost Escalation 2007 ACI-NA Economics and Finance Conference James Gill, CPA Deputy Airport Director Finance, Business & Administration Raleigh-Durham Airport Authority Presentation
Report for Jan-Nov-2006 pdf. General Statistics
 Report for Jan-Nov-006 pdf Time range: /8/006 07:3:37 - /3/006 3:50:6 Generated on Mon Jan 0, 007-9:3:5 General Statistics Summary Summary Hits Total Hits 97,06 Average Hits per Day 89 Average Hits per
November 2013 Passenger and Cargo Traffic Statistics Reno-Tahoe International Airport
 November 2013 Passenger and Cargo Traffic Statistics Reno-Tahoe International Airport December 26, 2013 U.S. DOMESTIC INDUSTRY OVERVIEW FOR NOVEMBER 2013 All RNO Carriers Domestic Systemwide year over
Sound Transit Operations March 2018 Service Performance Report. Ridership
 March 218 Service Performance Report Ridership Total Boardings by Mode Mar-17 Mar-18 % YTD-17 YTD-18 % ST Express 1,622,116 1,47,79-4.6% 4,499,798 4,428,14-1.6% Sounder 393,33 39,6.% 1,74,96 1,163,76 8.3%
RIDERSHIP TRENDS. August 2018
 RIDERSHIP TRENDS August Prepared by the Division of Strategic Capital Planning October Table of Contents Executive Summary...1 Ridership...3 Estimated Passenger Trips by Line...3 Estimated Passenger Trips
December 2013 Passenger and Cargo Traffic Statistics Reno-Tahoe International Airport
 December 2013 Passenger and Cargo Traffic Statistics Reno-Tahoe International Airport January 24, 2014 U.S. DOMESTIC INDUSTRY OVERVIEW FOR DECEMBER 2013 All RNO Carriers Domestic Systemwide year over year
Sound Transit Operations August 2015 Service Performance Report. Ridership
 Ridership Total Boardings by Mode Mode Aug-14 Aug-15 % YTD-14 YTD-15 % ST Express 1,534,241 1,553,492 1.3% 11,742,839 12,354,957 5.2% Sounder 275,403 326,015 18.4% 2,139,086 2,463,422 15.2% Tacoma Link
Administration and Projects Committee Meeting STAFF REPORT July 3, 2014 Page 2 of 2 Agreement Consultant Project General Scope CT 107 URS Corporation
 Administration and Projects Committee Meeting STAFF REPORT Meeting Date: July 3, 2014 Subject Summary of Issues Recommendations Authorize s to Various Agreements Over the years, the Authority has contracted
STRATEGY/ACTION PLAN FOR IMPLEMENTATION OF REDUCED VERTICAL SEPARATION MINIMA IN THE AFRICA-INDIAN OCEAN REGION 22 NOVEMBER 2003
 STRATEGY/ACTION PLAN FOR IMPLEMENTATION OF REDUCED VERTICAL SEPARATION MINIMA IN THE AFRICA-INDIAN OCEAN REGION 22 NOVEMBER 2003 Prepared by the APIRG RVSM Implementation Task Force AFI STRATEGY/ACTION
SAS Group Q Teleconference
 SAS Group Q4 2012 Teleconference December 12, 2012 1 Break-even result in 2012 despite 1.6 bn SEK higher fuel cost 23 MSEK EBT (before non-recurring items) despite 1.6 bn SEK higher fuel cost Positive
2009 Muskoka Airport Economic Impact Study
 2009 Muskoka Airport Economic Impact Study November 4, 2009 Prepared by The District of Muskoka Planning and Economic Development Department BACKGROUND The Muskoka Airport is situated at the north end
PORT OF SEATTLE MEMORANDUM. COMMISSION AGENDA Item No. 6a ACTION ITEM Date of Meeting August 23, 2016
 PORT OF SEATTLE MEMORANDUM COMMISSION AGENDA Item No. 6a ACTION ITEM Date of Meeting August 23, 2016 DATE: TO: FROM: Michael Ehl, Director, Airport Operations Wayne Grotheer, Director, Aviation Project
Educational Assistant Staff Base Wage Determination. Information & Input Session
 Educational Assistant Staff Base Wage Determination Information & Input Session Educational Assistant Staff Base Wage Determination Group Meeting - Purpose District Sharing Information Creating a Common
Tourism Trends. Humphrey Walwyn Head of VisitEngland Research October 2018
 Tourism Trends Humphrey Walwyn Head of VisitEngland Research October 2018 1 England Research & Evaluation GBTS - Overnights (statutory research & official statistic) GBDVS - Day (statutory/ official) Occupancy
Sound Transit Operations February 2018 Service Performance Report. Ridership
 February 218 Service Performance Report Ridership Total Boardings by Mode Feb-17 Feb-18 % YTD-17 YTD-18 % ST Express 1,373,96 1,372,88 -.1% 2,877,294 2,88,719.1% Sounder 314,96 32,187 11.9% 681,923 768,69
RIDERSHIP TRENDS. October 2017
 RIDERSHIP TRENDS October 2017 Prepared by the Division of Strategic Capital Planning December 2017 Table of Contents Executive Summary...1 Ridership...3 Estimated Passenger Trips by Line...3 Estimated
Q1 Fiscal 2018 Statistics
 Q1 Fiscal 2018 Statistics FedEx Corporation Financial and Operating Statistics First Quarter Fiscal 2018 September 19, 2017 This report is a statistical supplement to FedEx s interim financial reports
air traffic statistics
 July 23 air traffic statistics Prepared by the Office of Finance Department of Internal Controls, Compliance and Financial Strategy Air Traffic Summary July 23 Below is a summary of the July 23 Air Traffic
Reno-Tahoe Airport Authority U.S. DOMESTIC INDUSTRY OVERVIEW FOR FEBRUARY
 Inter-Office Memo Reno-Tahoe Airport Authority Date: March 30, 2009 To: Statistics Recipients From: Krys T. Bart, A.A.E., President/CEO Subject: RENO-TAHOE INTERNATIONAL AIRPORT PASSENGER STATISTICS U.S.
Presentation on Results for the 2nd Quarter FY Idemitsu Kosan Co.,Ltd. November 14, 2018
 Presentation on Results for the 2nd Quarter FY 2018 Idemitsu Kosan Co.,Ltd. November 14, 2018 Table of Contents 1. FY 2018 2nd Quarter Financials (1) Overview (2) Segment Information 2. Reference Materials
CWC LA - Cash Balance (January 2012)
") CWC LA - Cash Balance 2012-13 (January 2012) 1,200,000 Cash Balance 1,000,000 800,000 ($1,000s) 600,000 400,000 200,000 - CWC LA - Actuals/Projected CWC LA - ed (Nov) 1 1 CWC Hollywood - Financial Dashboard
CWC LA - Cash Balance 2012-13 (January 2012) 1,200,000 Cash Balance 1,000,000 800,000 ($1,000s) 600,000 400,000 200,000 - CWC LA - Actuals/Projected CWC LA - ed (Nov) 1 1 CWC Hollywood - Financial Dashboard
epods Airline Management Educational Game
 epods Airline Management Educational Game Dr. Peter P. Belobaba 16.75J/1.234J Airline Management March 1, 2006 1 Evolution of PODS Developed by Boeing in early 1990s Simulate passenger choice of airline/paths
Passenger and Cargo Statistics Report
 Passenger and Cargo Statistics Report RenoTahoe International Airport December 2015 U.S. DOMESTIC INDUSTRY OVERVIEW FOR DECEMBER 2015 All RNO Carriers Domestic Systemwide year over year comparison Average
Presentation on Results for the 3rd Quarter FY Idemitsu Kosan Co.,Ltd. February 2, 2016
 Presentation on Results for the 3rd Quarter FY 2015 Idemitsu Kosan Co.,Ltd. February 2, 2016 Table of Contents 1. 3 rd Quarter FY 2015 Financials (1) Overview (2) Segment Information 2. Forecast for FY
Sales increased and income will be on a recovery track in the second half of the fiscal year.
 Sales increased and income will be on a recovery track in the second half of the fiscal year. Contents I. Results for the First Half of Fiscal Year Ending March 2019 Profit decreased mainly due to temporary
Passenger and Cargo Statistics Report
 Passenger and Cargo Statistics Report Reno-Tahoe International Airport December 2014 U.S. DOMESTIC INDUSTRY OVERVIEW FOR DECEMBER 2014 All RNO Carriers Domestic Systemwide year over year comparison Average
Ryanair. Overweight. Overweight. High Growth, Low Cost Champion
 Overweight RYA.I,RYA ID Price: 12.76 Price Target: 16.25 Previous: 13.50 Ireland Airlines Christopher G Combe AC J.P. Morgan Securities PLC Price Performance 12 10 8 6 Jul-14 Oct-14 Jan-15 Apr-15 Jul-15
Air China Limited Annual Results. March Under IFRS
 Air China Limited 21 Annual Results Under IFRS March 211 Agenda Part 1 Highlights Part 2 Business Overview Part 3 Financial Overview Part 4 Outlook 2 Part 1 Highlights Steady Economic Growth; Asia Pacific
JANUARY 2018 BOARD INFORMATION PACKAGE
 JANUARY 2018 BOARD INFORMATION PACKAGE MEMORANDUM TO: Members of the Airport Authority FROM: Lew Bleiweis, Executive Director DATE: January 19, 2018 Financial Report (document) Informational Reports: A.
Historical Statistics
 Historical Statistics FedEx Corporation Financial and Operating Statistics FY 2005 FY 2014 This report is a statistical supplement to FedEx s interim financial reports and is prepared quarterly. Additional
Standardizes the handling of visa-regressed cases throughout USCIS field offices nationwide;
 INTERIM MEMO FOR COMMENT Posted: 01-11-2011 Comment period ends: 01-26-2011 This memo is in effect until further notice. U.S. Citizenship and Immigration Services Office of the Director (MS 2000) Washington,
RIDERSHIP TRENDS. January 2018
 RIDERSHIP TRENDS January 2018 Prepared by the Division of Strategic Capital Planning March 2018 Table of Contents Executive Summary...1 Ridership...3 Estimated Passenger Trips by Line...3 Estimated Passenger
Investor Relations Update January 25, 2018
 General Overview Investor Relations Update Accounting Changes On January 1, 2018, the company adopted two new Accounting Standard Updates: (ASUs): ASU 2014-9: Revenue from Contracts with Customers (the
2019 Vacation Bidding
 2019 Vacation Bidding Flight Attendant Guide Published September 24, 2018 Published September 24, 2018 1 2019 FLIGHT ATTENDANT VACATION TIMELINE Vacation Timeline Open Date & Time Close Date & Time Posting
TOWNSHIP OF LOWER MERION. PUBLIC WORKS COMMITTEE Wednesday, October 4, :10 PM ( Approximately)
") TOWNSHIP OF LOWER MERION PUBLIC WORKS COMMITTEE Wednesday, October 4, 2017 7:10 PM ( Approximately) Chairpersons: Vice Chairperson: Paul A. McElhaney Cheryl B. Gelber, C. Brian McGuire AGENDA 1. REALIGNMENT
TOWNSHIP OF LOWER MERION PUBLIC WORKS COMMITTEE Wednesday, October 4, 2017 7:10 PM ( Approximately) Chairpersons: Vice Chairperson: Paul A. McElhaney Cheryl B. Gelber, C. Brian McGuire AGENDA 1. REALIGNMENT
Operating Budget Data
 J00I00 Maryland Aviation Administration Maryland Department of Transportation Operating Budget Data ($ in Thousands) FY 15 FY 16 FY 17 FY 16-17 % Change Actual Working Allowance Change Prior Year Special
JANUARY 2017 BOARD INFORMATION PACKAGE
 JANUARY 2017 BOARD INFORMATION PACKAGE MEMORANDUM TO: Members of the Airport Authority FROM: Lew Bleiweis, Executive Director DATE: January 13, 2017 Financial Report (document) Informational Reports: A.
EXHIBIT HOURS. ACS Biennial Convention October 4-7, 2018 Hotel Captain Cook 939 W. 5th Ave., Anchorage, AK EXHIBIT PACKAGES.
 ACS Biennial Convention October 4-7, 2018 Hotel Captain Cook 939 W. 5th Ave., Anchorage, AK 99503 EXHIBIT PACKAGES EARLY BIRD PRICING: $50 DISCOUNT IF APPLICATION AND PAYMENT ARE RECEIVED BY JULY 31! Space
Sound Transit Operations March 2017 Service Performance Report. Ridership. Total Boardings by Mode
 March 217 Service Performance Report Ridership ST Express Sounder Tacoma Link Link Paratransit Mar-16 Mar-17 % 1,83,4 1,621,49 2.4% 37,496 82,631 1,264,47 3,821 Total Boardings by Mode 389,98 87,39 1,89,43,297
Nova Southeastern University Joint-Use Library Agreement: Review of Public Usage
 Exhibit 1 Nova Southeastern University Joint-Use Library Agreement: Robert Melton, CPA, CIA, CFE, CIG County Auditor Audit Conducted by: Gerard Boucaud, CISA, Audit Manager Dirk Hansen, CPA, Audit Supervisor
Cebu Air, Inc. 2Q2014 Results of Operation
 Cebu Air, Inc. 2Q2014 Results of Operation 1 Disclaimer This information provided in this presentation is provided only for your reference. Such information has not been independently verified and, as
Historical Statistics
 Historical Statistics FedEx Corporation Financial and Operating Statistics FY 2006 FY 2015 This report is a statistical supplement to FedEx s interim financial reports and is prepared annually. Additional
SAS Q3 2017/ August 2018
 SAS Q3 2017/2018 31 August 2018 Strong earnings in peak season POSITIVES Record number of passengers Total revenue up MSEK 936 vs. LY Currency adjusted yield up 1.1% vs. LY EB point sale up 27% vs. LY
January 2018 Air Traffic Activity Summary
 January 2018 Air Traffic Activity Summary Jan-2018 Jan-2017 CY-2018 CY-2017 Passengers 528,947 505,421 4.7% 528,947 505,421 4.7% Passengers 537,332 515,787 4.2% 537,332 515,787 4.2% Passengers 1,066,279
Local Grievance # Union Facts and Contentions (Block #17 on PS Form 8190):
:") Local Grievance # Issue Statement (Block #15 on PS Form 8190): Did management violate Sections 211.1 and 214 of the M-39 Handbook via Article 19 of the National Agreement by failing to conduct a proper
Local Grievance # Issue Statement (Block #15 on PS Form 8190): Did management violate Sections 211.1 and 214 of the M-39 Handbook via Article 19 of the National Agreement by failing to conduct a proper
January 2014 Passenger and Cargo Traffic Statistics Reno-Tahoe International Airport
 January 2014 Passenger and Cargo Traffic Statistics Reno-Tahoe International Airport March 12, 2014 U.S. DOMESTIC INDUSTRY OVERVIEW FOR DECEMBER 2013 All RNO Carriers Domestic Systemwide year over year
December 2012 Passenger and Cargo Traffic Statistics Reno-Tahoe International Airport
 December 2012 Passenger and Cargo Traffic Statistics Reno-Tahoe International Airport January 29, 2013 U.S. DOMESTIC INDUSTRY OVERVIEW FOR DECEMBER 2012 All RNO Carriers Systemwide year over year comparison
Produced by: Destination Research Sergi Jarques, Director
 Produced by: Destination Research Sergi Jarques, Director Economic Impact of Tourism Norfolk - 2017 Contents Page Summary Results 2 Contextual analysis 4 Volume of Tourism 7 Staying Visitors - Accommodation
RENO-TAHOE INTERNATIONAL AIRPORT APRIL 2008 PASSENGER STATISTICS
 Inter-Office Memo Reno-Tahoe Airport Authority Date: June 5, 2008 To: Statistics Recipients From: Tom Medland, Director Air Service Business Development Subject: RENO-TAHOE INTERNATIONAL AIRPORT PASSENGER
SAS Group Q2 2012/13. Q2 Restructuring programme moving KPIs in the right direction
 SAS Group Q2 2012/13 1 Q2 Restructuring programme moving KPIs in the right direction Operating revenues +1.6%* Yield improvement of +2.7%* Forceful implementation of 4XNG plan: Unit cost down by 10.7%
September 2013 Passenger and Cargo Traffic Statistics Reno-Tahoe International Airport
 September 2013 Passenger and Cargo Traffic Statistics Reno-Tahoe International Airport October 31, 2013 U.S. DOMESTIC INDUSTRY OVERVIEW FOR SEPTEMBER 2013 All RNO Carriers Systemwide year over year comparison
May 2011 Passenger and Cargo Traffic Statistics Reno-Tahoe International Airport
 May 2011 Passenger and Cargo Traffic Statistics Reno-Tahoe International Airport July 5, 2011 U.S. DOMESTIC INDUSTRY OVERVIEW FOR MAY 2011 All RNO Carriers Systemwide year over year comparison Average
EXHIBITORS WITH BOOTH SPACE OVER 1501 SQ. FT.
 AAOS 2019 Housing Rules and Regulations EXHIBITORS WITH BOOTH SPACE OVER 1501 SQ. FT. In an effort to ensure that sleeping rooms are properly allocated and available to both exhibitors and meeting attendees,
Q4 Fiscal 2018 Statistics
 Q4 Fiscal 2018 Statistics FedEx Corporation Financial and Operating Statistics Fourth Quarter Fiscal 2018 June 19, 2018 This report is a statistical supplement to FedEx s interim financial reports and
Air Berlin PLC AGM 06 June 2013 London
 Air Berlin PLC AGM 06 June 2013 London airberlin a strong European carrier Market position as of 31 December 2012 No. 2 in core market: Germany / Austria / Switzerland No. 7 in Europe with 33.3 m guests
Recommendations for Northbound Aircraft Departure Concerns over South Minneapolis
 Recommendations for Northbound Aircraft Departure Concerns over South Minneapolis March 21, 2012 Noise Oversight Committee Agenda Item #4 Minneapolis Council Member John Quincy Background Summer of 2011
LCCs: in it for the long-haul?
 October 217 ANALYSIS LCCs: in it for the long-haul? Exploring the current state of long-haul low-cost (LHLC) using schedules, fleet and flight status data Data is powerful on its own, but even more powerful
MONTHLY OPERATIONS REPORT DECEMBER 2015
 MONTHLY OPERATIONS REPORT DECEMBER 215 Table of Contents DECEMBER 215 Section Page December Highlights... 3 Strategic Goals Progress Update... 4 Ridership... 6 Revenue... 9 Expenses... 1 System Summary...
Regional Jets ,360 A319/ , , , ,780
 Excel Tab Name: Seats (18 MAP) PASSENGER AIRLINE FLIGHT SCHEDULE CALCULATION RECORD Summary 17.2 MAP flight schedule* (with Southwest Airlines B737-800s changed to B737-700s) Number of Total Seats Avg.
_VER1 CC_ PC_5000 FA_21500 C </CELL ><CELL> HO_ADJ 2015.P02 GL_6290 _VER1 GL_6010 PC_5000 FA_21500 C
 < EVDRE ID="Head count Roll Forward 001-00001"/>< EVDRE ID="BPC- CYB 004-00001"/>< EVDRE ID="BPC- CYB 001-00001"/>< EVDRE ID="BPC- CYF 004-00001"/>< EVDRE
Produced by: Destination Research Sergi Jarques, Director
 Produced by: Destination Research Sergi Jarques, Director Economic Impact of Tourism North Norfolk District - 2016 Contents Page Summary Results 2 Contextual analysis 4 Volume of Tourism 7 Staying Visitors
Produced by: Destination Research Sergi Jarques, Director
 Produced by: Destination Research Sergi Jarques, Director Economic Impact of Tourism Norfolk - 2016 Contents Page Summary Results 2 Contextual analysis 4 Volume of Tourism 7 Staying Visitors - Accommodation
PERFORMANCE REPORT JANUARY Keith A. Clinkscale Performance Manager
 PERFORMANCE REPORT JANUARY 2018 Keith A. Clinkscale Performance Manager INTRODUCTION/BACKGROUND Keith A. Clinkscale Performance Manager FIXED ROUTE DASHBOARD JANUARY 2018 Safety Max Target Goal Preventable
Managing And Understand The Impact Of Of The Air Air Traffic System: United Airline s Perspective
 Managing And Understand The Impact Of Of The Air Air Traffic System: United Airline s Perspective NEXTOR NEXTOR Moving Moving Metrics: Metrics: A Performance-Oriented View View of of the the Aviation Aviation
April 4, McKinney Airport Advisory Committee Airport Master Plan Update.
 McKinney Airport Advisory Committee Airport Master Plan Update http://mckinney.airportstudy.com/project-documents April 4, 2017 Paul Hendricks phendricks@fairviewtexas.org McKinney National Airport (TKI)
Sound Transit Operations June 2016 Service Performance Report. Ridership
 Ridership Total Boardings by Mode Mode Jun-15 Jun-16 % YTD-15 YTD-16 % ST Express 1,622,222 1,617,420-0.3% 9,159,934 9,228,211 0.7% Sounder 323,747 361,919 11.8% 1,843,914 2,099,824 13.9% Tacoma Link 75,396
air traffic statistics
 June 23 air traffic statistics Prepared by the Office of Finance Department of Internal Controls, Compliance and Financial Strategy Metropolitan Washington Airports Authority Air Traffic Statistics Table
The CLE Master Plan Includes:
 The CLE Master Plan Includes: An inventory of existing conditions Forecasting future demand and analyzing future needs Evaluating alternative development scenarios Preparing the Airport Layout Plan Preparing
Performance Metrics for Oceanic Air Traffic Management. Moving Metrics Conference Pacific Grove, California January 29, 2004 Oceanic Metrics Team
 Performance Metrics for Oceanic Air Traffic Management Moving Metrics Conference Pacific Grove, California January 29, 2004 Oceanic Metrics Team Agenda Metrics Team Michele Merkle, FAA AUA-600 Lynne Hamrick,
Runway Scheduling Limits Summer 2015
 Appendix 1 Runway Scheduling Limits Summer 2015 Arrivals Hour (UTC) 05 06 07 08 09 10 11 12 13 14 15 16 17 18 19 20 21 Average Total Summer 2014 38 39 37 40 40 41 40 43 43 41 41 44 44 43 38 44 20 39.8
EXHIBITORS FREQUENTLY ASKED QUESTIONS
 International Bridge, Tunnel and Turnpike Association Managed Lanes, AET & Technology Summit April 22-24, 2018 Sheraton Charlotte/Le Méridien Complex Dallas, Texas EXHIBITORS FREQUENTLY ASKED QUESTIONS
Preliminary Figures FY 2016
 February 14, 2017 Preliminary Figures FY 2016 Capital Markets Day 2017 Tom Blades (CEO) Disclaimer This presentation has been produced for support of oral information purposes only and contains forwardlooking
Sound Transit Operations January 2018 Service Performance Report. Ridership
 January 218 Service Performance Report Ridership Total Boardings by Mode Jan-17 Jan-18 % YTD-17 YTD-18 % ST Express 1,3,33 1,7,91.3% 1,3,33 1,7,91.3% Sounder 367,33 416,8 13.3% 367,33 416,8 13.3% Tacoma
Presentation on Results for the 2nd Quarter FY Idemitsu Kosan Co.,Ltd. November 1, 2016
 Presentation on Results for the 2nd Quarter FY 2016 Idemitsu Kosan Co.,Ltd. November 1, 2016 Table of Contents 1. 2nd Quarter FY 2016 Financials (1) Overview (2) Segment Information 2. Reference Materials
Q3 Fiscal 2018 Statistics
 Q3 Fiscal 2018 Statistics FedEx Corporation Financial and Operating Statistics Third Quarter Fiscal 2018 March 20, 2018 This report is a statistical supplement to FedEx s interim financial reports and
Management Presentation. November 2011
 Management Presentation November 2011 Forward looking statements This presentation as well as oral statements made by officers or directors of Allegiant Travel Company, its advisors and affiliates (collectively
Presentation on Results for the 3rd Quarter FY Idemitsu Kosan Co.,Ltd. February 14, 2019
 Presentation on Results for the 3rd Quarter FY 2018 Idemitsu Kosan Co.,Ltd. February 14, 2019 Table of Contents 1. FY 2018 3rd Quarter Results (1) Overview (2) Segment Information 2. Forecast for FY 2018
Preliminary Draft Budget FY Airline Rates and Charges. Sea-Tac International Airport
 Draft Budget FY 2015 Airline Rates and Charges Sea-Tac International Airport Aviation Finance & Budget 2015 Budget Airline Rates and Charges TABLE OF CONTENTS Exhibit Contents 1 Aeronautical Revenue Summary
Kentucky Lock Project Update Inland Waterways Users Board Meeting No. 84
 Kentucky Lock Project Update Inland Waterways Users Board Meeting No. 84 MR. DON GETTY PROJECT MANAGER Kentucky Lock Addition Nashville District 19 July 2017 The views, opinions and findings contained