Table of Contents. Overview 4. Acknowledgements 5. Summary 6. Belmont 15. Cardiff 20. Charlestown 25. Glendale 30. Morisset 35.
|
|
|
- Paula Gordon
- 5 years ago
- Views:
Transcription
1 Commercial Centre Study 2012

2 Disclaimer While every reasonable effort has been made to ensure that this document is correct at the time of publication, Lake Macquarie City Council, its agents and employees, disclaim any and all liability to any person in respect of anything or the consequences of anything done or omitted to be done in reliance upon the whole or any part of this document. 2
3 Table of Contents Overview 4 Acknowledgements 5 Summary Results Belmont 15 Cardiff 20 Charlestown 25 Glendale 30 Morisset 35 Mount Hutton 40 Swansea 45 Toronto 50 Warners Bay 55 Appendices Appendix A - Maps of commercial centres 60 3
4 Overview Lake Macquarie City has a strong economy, a diverse industry mix of over 12,000 businesses, and, with a population of nearly 200,000, provides a pool of highly skilled labour supporting innovative industry. A cosmopolitan and progressive city, Lake Macquarie retains a sense of community courtesy of nine thriving town centres, each with an individual character and focus. Lake Macquarie City is a unique regional city because it does not have a central business district. However, the Lower Hunter Regional Strategy has designated Charlestown as a regional centre, and Glendale/Cardiff and Morisset as emerging regional centres. Each year Lake Macquarie City Council s (LMCC) Economic Development Unit collaborates with the cities Town Centre Coordinators to collate raw data on each individual town centre. The data provides a snapshot of the major commercial retail areas in the city and an analysis of change between survey periods. The survey records employment classification, occupancy rates and business category for each centre and the city as a whole. LMCC first undertook a comprehensive survey of its town centres in 1997, collecting data on business mix, floor space and employment. This data was updated in 2002 and 2008, producing a report for each town centre, comparing data from the three surveys. Since 2009, Town Centre Coordinators have collected current business information, collating valuable annual data for each of the nine town centres. For this analysis, the 17 ANZSIC 1 industries are clustered into five major categories: those which grow, process, extract or manufacture goods. " Agriculture; Forestry and Fishing; Mining; Manufacturing; Construction. those providing services, such as moving or selling " goods, to industries that produce goods. " Transport; Storage; Wholesale Trade; Retail Trade. the highly skilled service industries. " Property and Business Services; Health and Community Services; Education, Finance and! Insurance; Communication Services. s those which cater directly to people s needs. " Personal and Other Services; Accommodation; Cafes and Restaurants; Cultural and! Recreation Services. " Government Administration and Defence; Electricity; Gas and Water Supply. Minor anomalies in the data sets are due primarily to changes in collection boundaries and methodology. However, the statistics remain a strong basis for analysis and planning. 1 Australia and New Zealand Standard Industry Classification 1993 (ABS) 4
5 Acknowledgements Lake Macquarie City Council appreciates the efforts of consultant, Michelle McGinty, assisting consultant, Holly Pascoe, and the Town Centre Coordinators in collating raw data for this project. Jenny Barrie, Belmont Town Centre Coordinator Jacinta Mackey, Cardiff Town Centre Coordinator Jenny Barrie, Charlestown Town Centre Coordinator Rosmairi Dawson, Southlake Town Centre Coordinator Larraine Russell, Swansea Town Centre Coordinator Keryl Fedrick, Toronto Town Centre Coordinator Rhonda Campbell, Warners Bay Town Centre Coordinator 5
6 Summary Lake Macquarie City town centres are predominantly an equal mix of Goods Related, Knowledge Based and. The town centres are largely retail focussed and, while affected by the tough trading conditions in 2012, they have remained competitive. After showing a lot of promise, 2012 was a disappointing year for retail. Retail sales growth was strong in the first half of the year but momentum tailed off in the second half, and many retailers continue to struggle in a highly competitive environment. (Deloitte Media Release February 2013) A three-year comparison of vacant business shows most town centres have maintained steady vacancy rates, with the exception of Mount Hutton and Cardiff, which have increases in vacancies. Likely causes for this increase are Mount Hutton s strong retail focus and new developments at Cardiff. Leasable floor space increased considerably in the city, largely due to the GPT expansion of Charlestown Square in In most centres, numbers of permanent employees increased slightly, while casual numbers decreased marginally. Anecdotal evidence points to owners working in their shops rather than employing casual staff as a cost saving measure. For Australian retailers, 2013 looks set to continue to be a challenging trading environment. (Deloitte Global Powers of Retailing 2013 Retail Beyond) Deloitte identify major drivers of the retail sector as: Weak consumer confidence Low interest rates that may be reduced further Increasing house prices A relatively weak labour market Increasing competition from overseas entrants into the Australian market Deloitte states that the retail industry is in the midst of a customer revolution. The collision of the virtual and physical world is fundamentally changing consumers purchasing behaviours. Consumers are seeking an integrated shopping experience across all channels, and expect retailers to deliver this experience. 6
7 Total Number of Businesses Comparison (10-Year Comparison) Number of Businesses Belmont Cardiff Charlestown Glendale Morisset Mount Hutton Swansea Toronto Warners Bay Over the past ten years, seven out of the nine town centres have an increase in numbers of businesses. The exceptions are Toronto, which has decreased from 245 businesses in 2002 to 225 businesses in 2012, and Swansea with a decrease from 116 businesses in 2012 to 112 businesses in Morisset has increased 64% from 86 businesses in 2002 to 141 business in Glendale has increased 56% from 62 businesses to 97 businesses in Charlestown has increased by 44% from 424 businesses in 2002 to 612 businesses in These figures include a major expansion of GPT s Charlestown Square in Belmont has increased 27% from 224 in 2002 to 285 in Mount Hutton has increased from 61 in 2002 to 77 in 2012, a growth of 26%. Warners Bay has increased 15% from 142 businesses to 163 businesses in Cardiff increased 5% from 128 in 2002 to 134 in
8 Number of Businesses Total Number of Businesses in 2012 per Category as a Percentage Belmont 32% 33% 32% 2% 1% Cardiff 33% 35% 29% 3% Charlestown 43% 33% 23% 1% Glendale 56% 17% 27% Morisset 36% 27% 32% 2% 3% Mount Hutton 58% 10% 32% Swansea 21% 29% 38% 9% 3% Toronto 26% 41% 27% 5% 1% Warners Bay 22% 41% 36% 1% 0% 25% 50% 75% 100% Government & Belmont, Cardiff and Morisset have a varied mix of business across the sectors. With the expansion of Charlestown Square, goods related and person based service industries dominate Charlestown. There is also a strong proportion of knowledge based service industries. Stockland Glendale and Mount Hutton as shopping centres, are primarily made up of goods related and person based service industries. Swansea and Toronto show a high proportion of government and essential services, reflecting their location within the city. Warners Bay has a high proportion of knowledge based and person based service industries. 8
9 Number of Vacant Businesses Total Percentage of Vacant Businesses in 2010, 2011 and 2012 (3-Year Comparison) 30% 25% 20% 15% 18% 22% 23% 17% 17% 15% 17% 12% 18% 10% 5% 0% 12% 18% 8% 10% 16% 17% 14% 5% 6% 10% 6% 10% 7% 8% 5% 4% 0% 0% Belmont Cardiff Charlestown Glendale Morisset Mount Hutton Swansea Toronto Warners Bay The number of vacant businesses across the town centres has remained fairly static over the three years. Significant increases can be seen in Cardiff, probably due to new developments, and Mount Hutton, which is predominantly retail. 9
10 Leasable Floor Space Leasable Floor Space (10-Year Comparison) Belmont Cardiff Charlestown Glendale Morisset Mount Hutton Swansea Toronto Warners Bay 52,828 73,684 38,068 36, , ,435 46,809 65,241 8,910 42,233 17,218 21,601 16,428 26,975 43,944 52,485 23,705 21, , , , , The majority of town centres have experienced positive growth in leasable floor space over the study period. With the expansion of GPT s Charlestown Square development in 2011, the leasable floor space in Charlestown has increased by 42%. 10
11 Employment Figures Total Number of Permanent Employees Comparison Belmont Cardiff Charlestown Glendale Morisset Mount Hutton Swansea Toronto Warners Bay There has been an increase in number of permanent employees in more than half of the town centres over the past year. The growth in numbers of permanent staff was particularly in the areas of goods related service industries and knowledge based service industries. 11
12 Employment Figures Total Number of Permanent Employees in 2012 per Category as a Percentage Belmont Cardiff Charlestown 30% 56% 27% 55% 34% 27% 25% 14% 14% 7% 3% 4% 4% Glendale 75% 14% 11% Morisset 45% 33% 19% 2% 1% Mount Hutton 71% 11% 18% Swansea 39% 23% 20% 17% 1% Toronto 28% 56% 12% 4% Warners Bay 15% 43% 41% 1% 0% 25% 50% 75% 100% Government & There is a varied mix between goods related service industries and knowledge based service industries when it comes to permanent employment within the town centres. Person based services industries follows closely behind. A relatively small number of permanent employees are employed in government and essential services and goods producing industries. 12
13 Employment Figures Total Number of Casual Employees Comparison Belmont Cardiff Charlestown Glendale Morisset Mount Hutton Swansea Toronto Warners Bay 1,049 1, ,326 2,878 1,145 1, ,500 2,250 3, The largest increase in casual staff was experienced by the town centre of Charlestown, predominately in the goods related service industries. The majority of other town centres remained fairly similar to the previous year s data. 13
14 Total Number of Casual Employees in 2012 per Category as a Percentage Employment Figures 8% Belmont 33% 7% 52% 2% Cardiff 52% 22% 24% 1% Charlestown 49% 20% 30% Glendale 64% 3% 33% 2% 2% Morisset 58% 12% 26% Mount Hutton Swansea Toronto 69% 34% 35% 15% 21% 2% 47% 41% 29% 3% 3% 1% Warners Bay 19% 14% 67% 0% 25% 50% 75% 100% Government & Goods related service industries dominate casual employment within the town centres, followed by person based service industries. A smaller number of people are employed casually in the knowledge based service industries. Very few casual employees are found in government and essential services and goods producing industries. 14

15 Commercial Centre: Belmont Belmont, the major service centre for more than 50,000 residents on the east side of the lake, offers a diverse range of retail, financial, government and professional services. Belmont has a strong sporting influence with golf, football, yachting and other water based activity playing a significant role in the economic wellbeing of the centre. Belmont provides three large clubs, including two based on the lake s edge, and is the base for the only public hospital within the city. KEY FACTS: Area population: 14,105 including Belmont, Belmont South and Belmont North (2011 Australian Bureau of Statistics). This is a growth of 883 from the 2006 Census. Central Business District: 251 operating businesses in Leasable Commercial Floor Space in 2012: 73,684m 2. LOCAL COMMUNITIES: Belmont, Belmont North, Belmont South, Marks Point, Valentine and Croudace Bay. MAJOR BUSINESSES: Coles Woolworths Foodworks Lowes Aldi 15
16 NUMBER OF BUSINESSES Business Mix: Belmont There has been little change in the number of businesses in Belmont from 2011 to Belmont: Number of Businesses Vacant
17 LEASABLE FLOOR AREA Business Mix: Belmont There has been minimal changes in leasable floor area in Belmont. Vacant leasable floor area has decreased from 7650m 2 to 5045m 2. The total leasable floor area for Belmont has decreased from 77,884m 2 to 73,684m 2. This slight variation can be attributed to reclassification of some businesses which are now considered to be outside the commercial centre study area. Belmont: Leasable Floor Area (m 2 ) Vacant 21,072 2, ,883 25,373 22,612 28,408 28,429 7,281 8,891 19,476 18,661 20,714 10,517 10,052 3,221 6,155 16,595 16,765 17,858 20,283 19,958 11,590 11,210 9,930 9,930 10,090 10,010 9, ,045 42,131 52,828 75,324 74,574 76,616 77,884 73,684 17
18 PERMANENT EMPLOYMENT Business Mix: Belmont There has been a considerable decrease (11%) in numbers of permanent employees over the past 12 months. This reduction is primarily in the goods related service industries and is offset by an increase in casual employment in this sector. Belmont: Permanent Employees
19 CASUAL EMPLOYMENT Business Mix: Belmont Despite the number of businesses remaining fairly consistent and the number of permanent employees dropping dramatically in Belmont, the number of casual employees has remained similar to The major change has been from the shift from casuals employed by person based industries to goods related casuals. Goods related service industries increased their number of casuals possibly offsetting their reduction in permanent employees. Belmont: Casual Employees

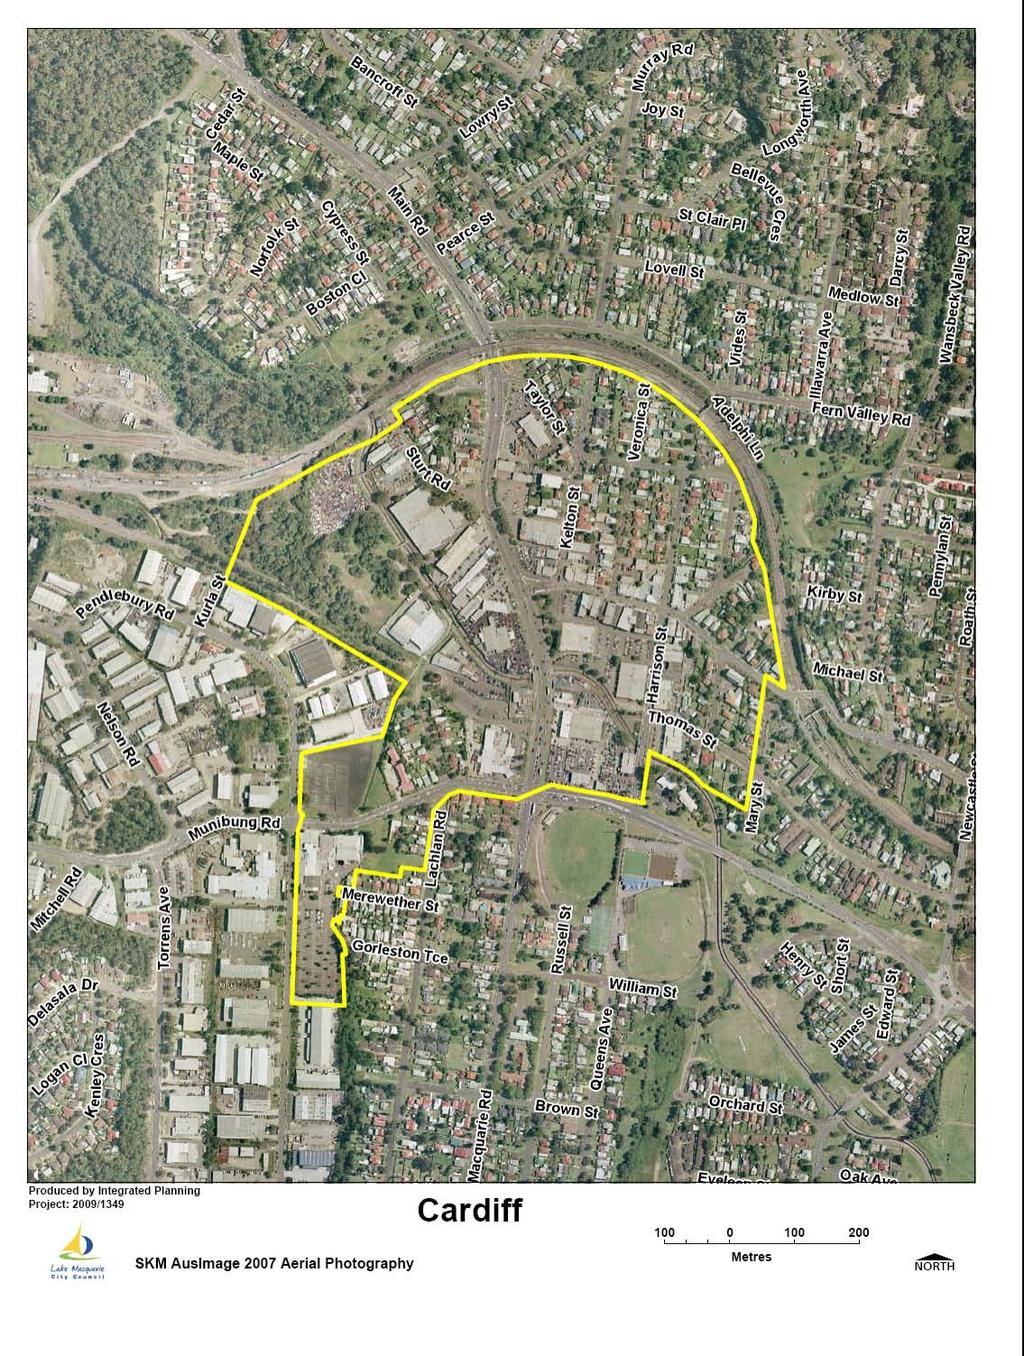
20 Commercial Centre: Cardiff Cardiff, a significant employment area that supports approximately 15,000 jobs, is home to many leading manufacturers based at the Cardiff Industrial Park. Retail development in Cardiff town centre complements the existing business support and specialist medical services. Cardiff is conveniently located on the main northern rail link and is well-serviced by public transport. KEY FACTS: Area population: 10,022 including Cardiff, Cardiff Heights and Cardiff South. (2011 Australian Bureau of Statistics). This is down by 1,342 from the 2006 Census. Central Business District: 103 operating businesses in Leasable Commercial Floor Space in 2012: 36,392m 2. LOCAL COMMUNITIES: Cardiff, Cardiff Heights, Cardiff South, Macquarie Hills, Rankin Park, Garden Suburb. MAJOR BUSINESSES: Hunter Imaging Pendlebury Day Hospital Woolworths Aldi Bi-Lo Adjacent to major industrial and employment zone. 20
21 NUMBER OF BUSINESSES Business Mix: Cardiff The total number of businesses in Cardiff has remained fairly consistent over the last 12 months. Vacant business premises have increased from 20 in 2011 to 31 in Cardiff: Number of Businesses Vacant
22 LEASABLE FLOOR AREA Business Mix: Cardiff Leasable floor area has increased slightly in 2012 from 35,524m 2 in 2011 to 36,392m 2 in Vacant leasable floor area has also increased over the year. Cardiff: Leasable Floor Area (m 2 ) Vacant 7,578 13,731 5,191 8,356 17,720 17,385 17,285 4,871 10,035 3,599 5,312 7,576 7,183 7,080 1,789 2,922 8,595 6,269 6,506 6,436 6, , , , ,240 3,865 1,039 2,311 3,600 4,614 15,810 38,068 22,310 21,277 35,038 35,524 36,392 22
23 PERMANENT EMPLOYMENT Business Mix: Cardiff Permanent employment in Cardiff commercial centre has increased slightly by 3% in the past year. Cardiff: Permanent Employees
24 CASUAL EMPLOYMENT Business Mix: Cardiff Casual employment in the Cardiff commercial centre has decreased by 18% between 2011 and The major reduction is in the goods related service industries. Cardiff: Casual Employees

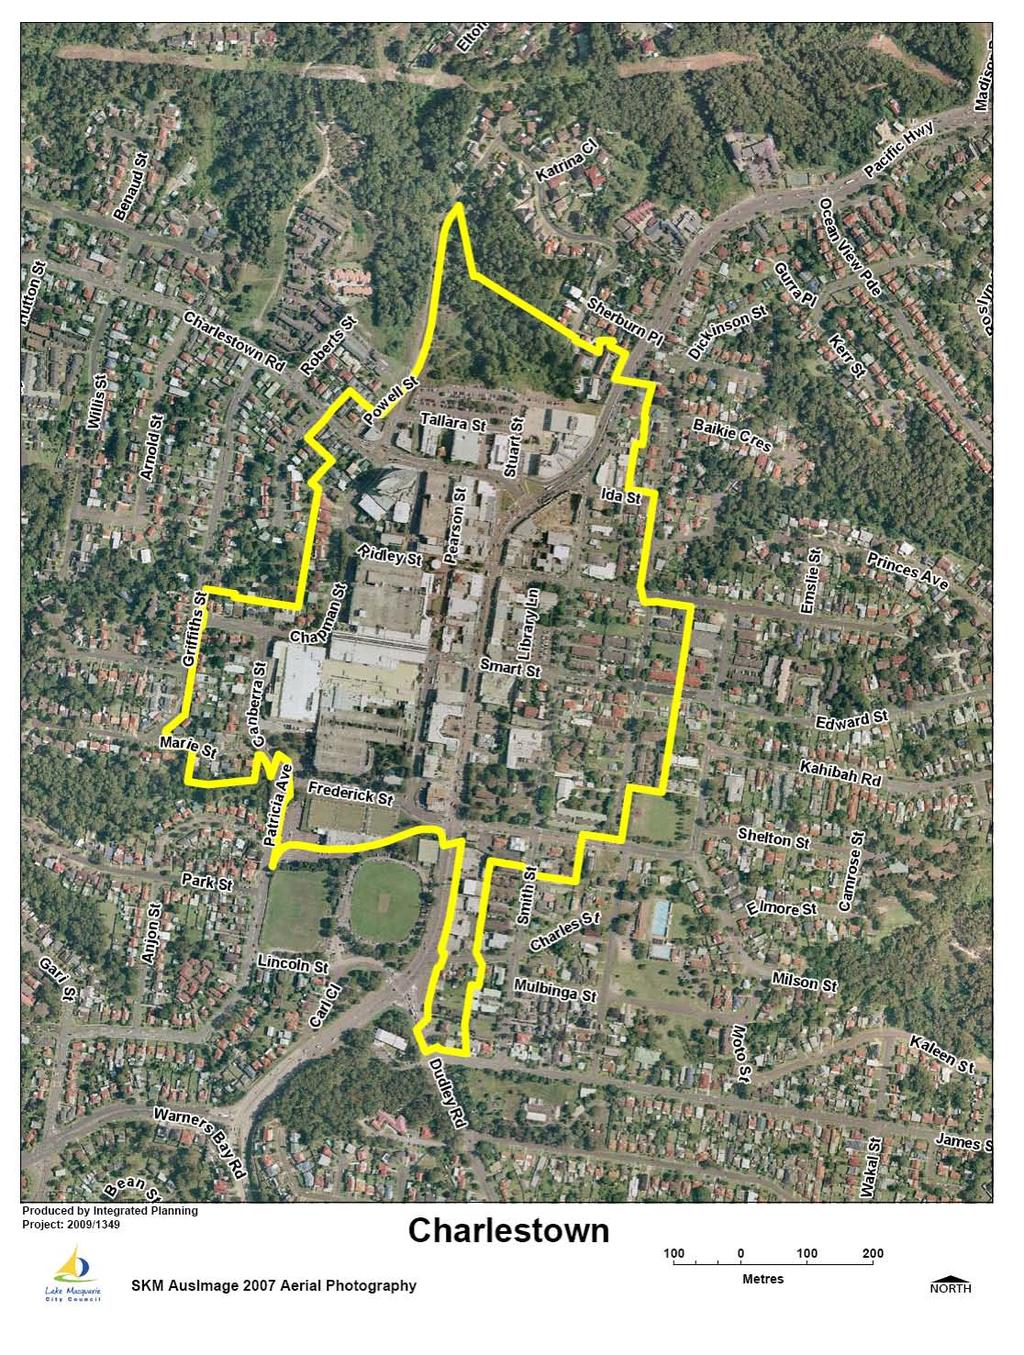
25 Commercial Centre: Charlestown Charlestown is a prominent major regional centre characterised by a significant concentration of commercial and retail business. Offering a diverse range of specialist health, community, government, financial and professional services, Charlestown is the base for GPT's Charlestown Square multi-level retail and entertainment complex, the largest within the Hunter. KEY FACTS: Area population: 12,411 (2011 Australian Bureau of Statistics). This is an increase of 686 from the 2006 Census. Central Business District: 510 operating businesses in Leasable Commercial Floor Space in 2012: 161,435m 2. LOCAL COMMUNITIES: Charlestown, Redhead, Dudley, Kahibah, Whitebridge, Kotara South, Hillsborough. FEATURES: Major bus interchange Home to GPT Charlestown Square Within 10 minutes of the John Hunter Hospital and other private hospitals Located close to Gateshead Industrial Park, which offers major businesses such as Hunter Recycling, Tip Top Bakeries, Harvey Norman, the Business Growth Centre and various home improvement outlets Rapidly expanding business services and medical facilities. MAJOR BUSINESSES: Myer, Target, Coles, Woolworths, Big W, Apple and Rebel Sport St John Ambulance Regional Headquaters AAMI Insurance Centrelink Regional Office Department of Housing Charlestown Bowling Club Major Banks and Building Societies KOFM and NXFM Radio Stations Reading and Hoyts Cinema Complexes 25
26 Business Mix: Charlestown NUMBER OF BUSINESSES The total number of businesses in Charlestown has increased over the last 12 months, with the biggest change in the knowledge based service industries which increased by 27%. Vacant business premises have decreased slightly over the year. Charlestown: Number of Businesses Vacant
27 LEASABLE FLOOR AREA Business Mix: Charlestown Leasable floor area has increased slightly in 2012 from 158,846m 2 in 2011 to 161,435m 2 in 2012 with the knowledge based service industries increasing significantly. Vacant leasable floor area decreased by 4,438m 2 over the 12 months. Charlestown: Leasable Floor Area (m 2 ) Vacant 45,288 59,997 58,124 56,949 55,601 85,703 83,039 10,561 19,769 18,245 21,536 25,462 24,152 35,004 5,127 13,479 9,208 15,628 22,760 23,847 22, ,053 2,235 5,396 1,524 1,453 1, ,206 8,330 8,050 13,521 25,175 23,133 18,695 62, ,704 95, , , , ,435 27
28 PERMANENT EMPLOYMENT Business Mix: Charlestown Permanent employment in Cardiff commercial centre has decreased by a total of 223 permanent employees over a 12 month period. Decreases are largest in the goods related service industries (12%) and person based service industries (28%), while knowledge based service industries have increased by 3%. The massive reduction in permanent employment within the goods producing industries may be due to completion of the Charlestown Square development in Charlestown: Permanent Employees , ,302 1,912 1,430 1, ,337 1,781 1,558 2,249 3,780 2,915 2,692 28
29 CASUAL EMPLOYMENT Business Mix: Charlestown Casual employees in the Charlestown commercial centre increased in 2012 by 24% or 552 casual employees. Biggest increases were in the goods related (25%) and person based (18%) service industries, possibly due to a decrease in permanent employees in these sectors. However knowledge based industries increased their casual and permanent employees, reflecting the large increase in numbers of businesses in this sector. Charlestown: Casual Employees 984 1,117 1,206 1,179 1,473 1,123 1, , ,148 1,648 1,644 1,776 3,688 2,326 2,878 29

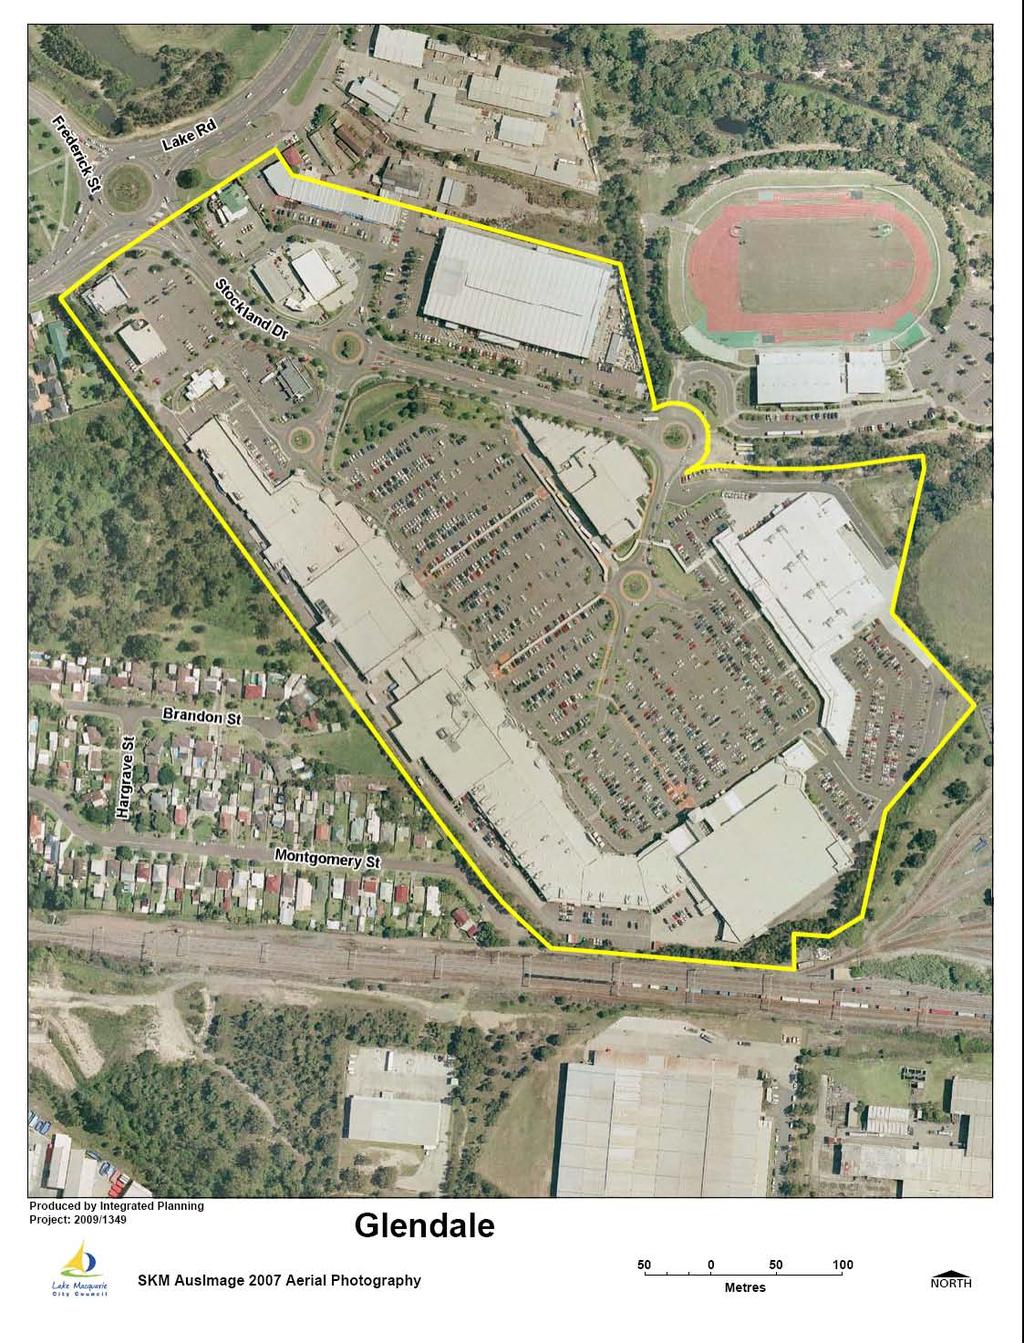
30 Commercial Centre: Glendale Glendale, the geographic heart of the Lower Hunter, combines industrial and commercial property with residential and recreational areas. It is home to Stockland Glendale, a cinema complex and the Hunter Sports Centre. Designated a future regional centre, stage one of the Lake Macquarie Transport Interchange has commenced at Glendale and Cardiff. KEY FACTS: Area population: 3,284 (2011 Australian Bureau of Statistics). This is a growth of 287 since the 2006 Census. Central Business District: 93 operating businesses in Leasable Commercial Floor Space in 2012: 65,241m 2. LOCAL COMMUNITIES: Glendale, Argenton, Edgeworth, Cameron Park. FEATURES: A sub-regional retail centre, Stockland Glendale Regional athletics and sports centre of international standard, the Hunter Sports Centre Close to the F3 Freeway The Hunter Institute of Technology (TAFE), Glendale Technology High School MAJOR BUSINESSES: Woolworths, Target, Coles, Kmart, JB Hi-Fi, Trade Secret and Aldi Multiple fast food outlets Bunnings Hardware Store Event Cinemas 30
31 NUMBER OF BUSINESSES Business Mix: Glendale The number of businesses in Glendale has remained relatively consistent over the past 12 months. At the time of study there were 4 vacant premises in Glendale. Glendale: Number of Businesses Vacant
32 LEASABLE FLOOR AREA Business Mix: Glendale Leasable floor area in Glendale has slightly increased in This can be attributed to additional kiosk space being made available in centre courts. Vacant leasable floor area has increased from 0 in 2011 to 250m 2 in This is the first time since 2009 that Glendale has had vacant premises at the time of report. Glendale: Leasable Floor Area (m 2 ) Vacant 23,911 42,849 56,443 56,443 56,188 51,008 51, ,497 1,947 1,322 2,055 2, ,110 3,340 3,340 3,890 10,801 11, ,354 46,809 61,400 61,400 61,400 63,864 65,241 32
33 PERMANENT EMPLOYMENT Business Mix: Glendale Glendale commercial centre has experience a growth in permanent staff numbers of 12%. The largest increase is in the goods related service industries (25%), although the person based service industries reduced permanent employment by 27%. Glendale: Permanent Employees
34 CASUAL EMPLOYMENT Business Mix: Glendale Casual employment in the Glendale commercial centre has decreased slightly by 3%. The major change is in numbers employed in the goods related service industries, a fall of 5%, which is probably offset by a slight increase in permanent employment in this sector. Glendale: Casual Employees ,162 1,060 1,082 1,068 1,145 1,110 34

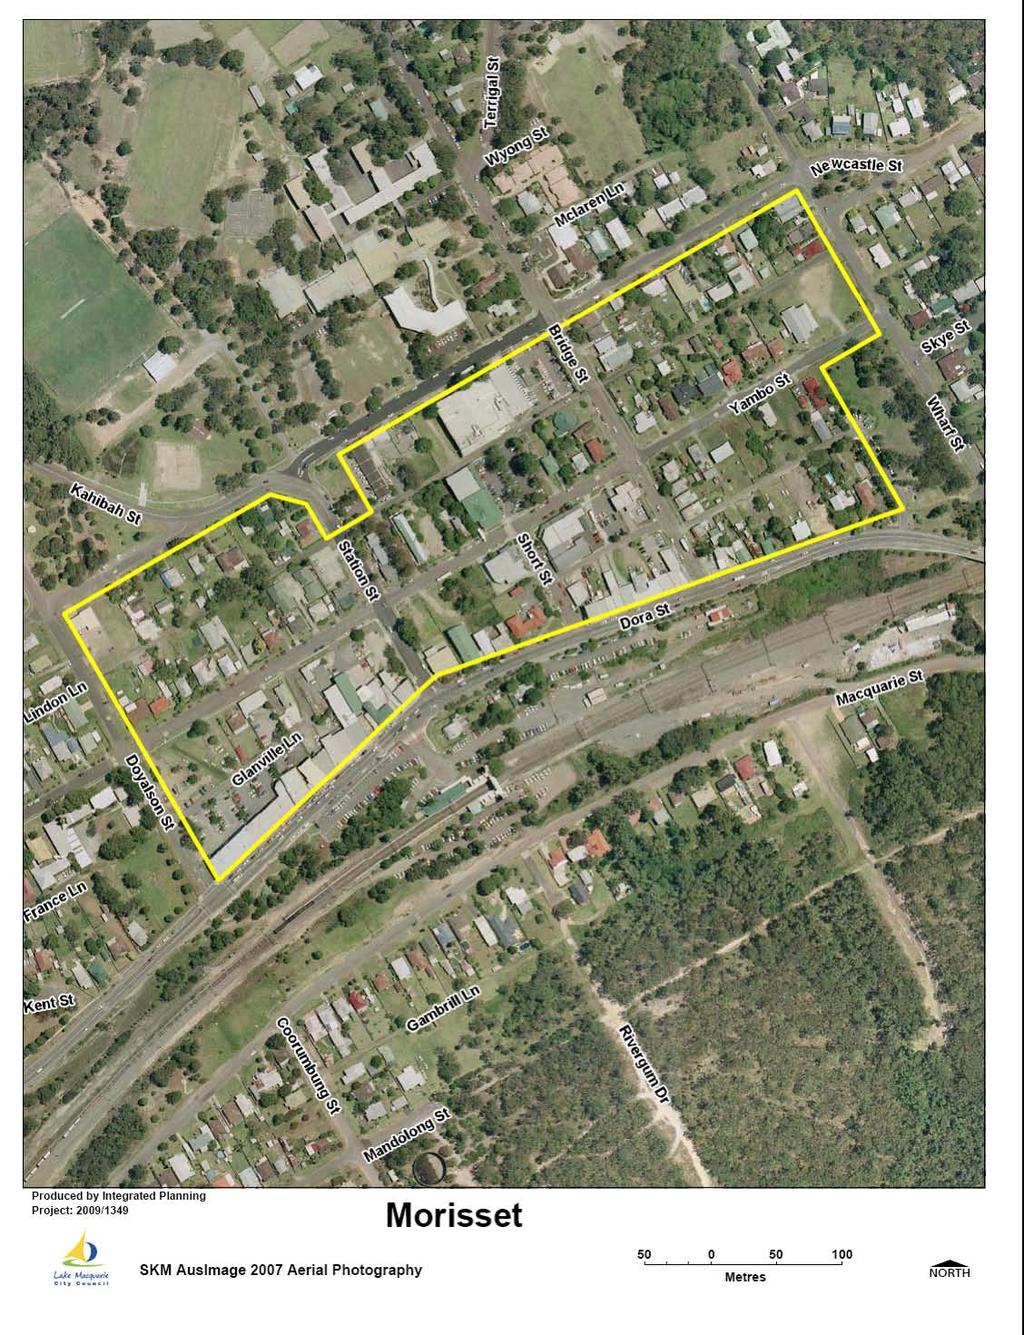
35 Commercial Centre: Morisset Morisset is the major commercial, industrial and retail centre of southern Lake Macquarie. Designated as an emerging regional centre, Morisset provides a diverse range of health, government and professional services to a growing population. Conveniently located on the main northern rail link, Morisset is only 60 minutes by freeway to Sydney s northern suburbs. Nestled between the Watagan Ranges and the lake, its natural setting fosters unique opportunities for business investment, employment and lifestyle pursuits. KEY FACTS: Area population: 3,470 (2011 Australian Bureau of Statistics). This is down from 3,890, as recorded in the 2006 Census. Central Business District: 117 operating businesses in Leasable Commercial Floor Space in 2012: 24,233m 2. LOCAL COMMUNITIES: Morisset, Morisset Park, Dora Creek, Cooranbong, Eraring, Martinsville, Morisset Peninsula, Madalong, Wyee Point, Watagans FEATURES: Several urban development projects being planned or underway Mixture of rural, lakeside and urban living Forty five minutes to Sydney s northern suburbs MAJOR BUSINESSES: Sanitarium Health Foods Coles, Woolworths, Country Target GP Super Clinic Bunnings Hardware 35
36 NUMBER OF BUSINESSES Business Mix: Morisset The total number of businesses in the Morisset commercial centre area has increased by 3% in a year. The greatest increase is in the person based service industries, an increase of 12%. The number of vacant premises has increased marginally in Morisset: Number of Businesses Vacant
37 LEASABLE FLOOR AREA Business Mix: Morisset Leasable floor area has increased very slightly across all sectors in 2012, with the exception of goods producing industries which showed a large 41% reduction in floor area. Morisset: Leasable Floor Area (m 2 ) Vacant 8,436 6,705 7,845 10,521 13,580 14,780 15,055 1,366 1,675 2,209 3,184 2,925 2,665 2, ,525 2,668 3,327 3, ,000 1,726 1,846 1,909 10,616 8,910 12,346 17,493 22,548 23,638 24,233 37
38 PERMANENT EMPLOYMENT Business Mix: Morisset Permanent employees have increased in the Morisset commercial centre by 4% in 2012, mostly in the goods related service industries. Morisset: Permanent Employees
39 CASUAL EMPLOYMENT Business Mix: Morisset Morisset has increased its number of casual employees by 6% in While all classifications have experienced growth, the most significant increase was in the person based service industries, with a 21% increase over the year. Morisset: Casual Employees

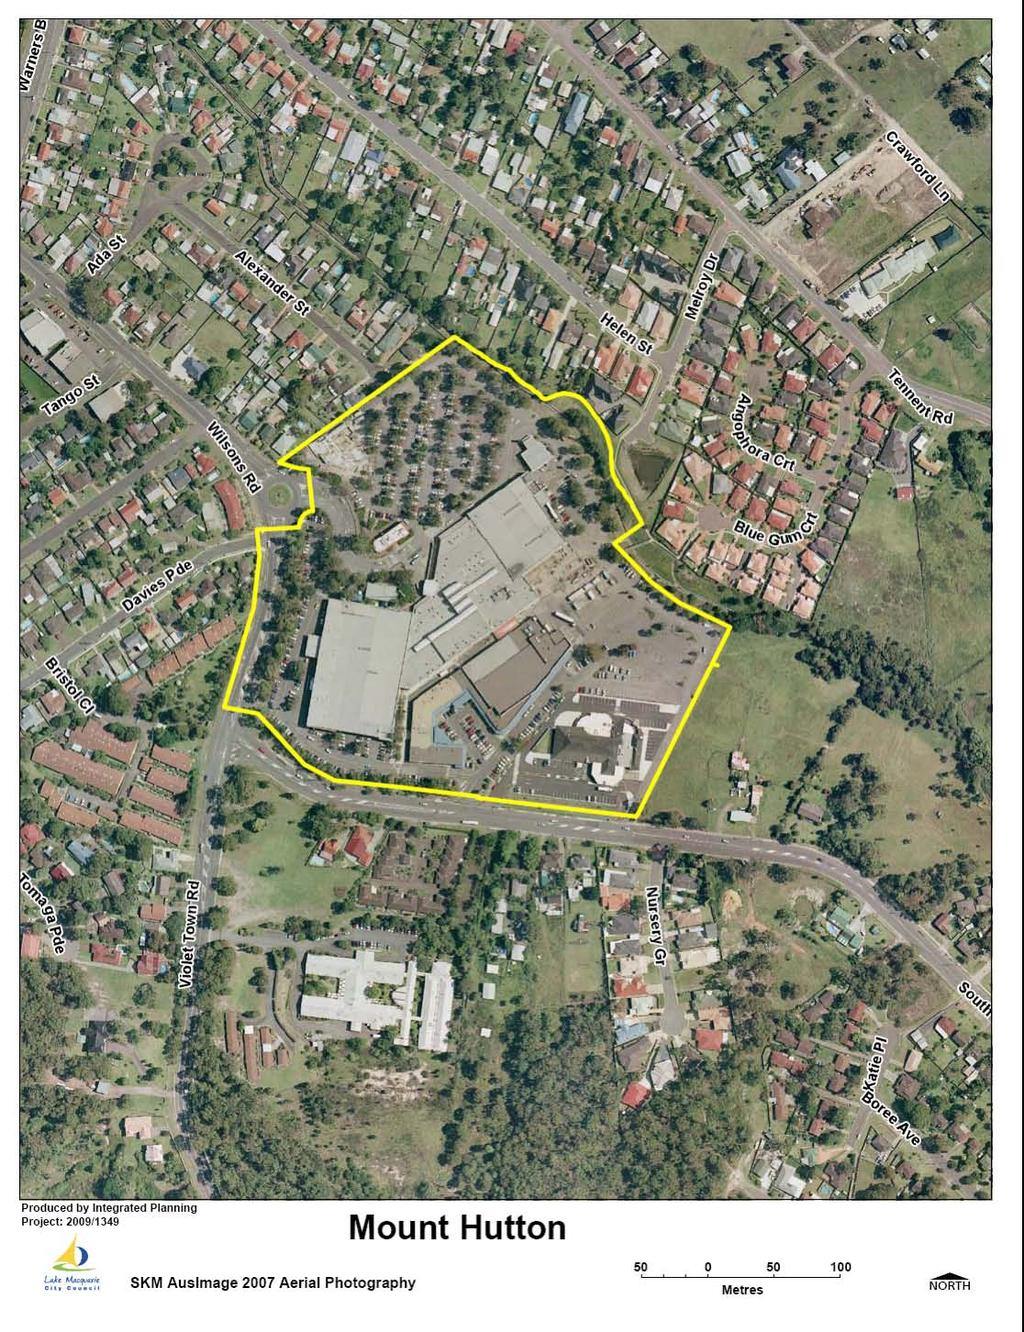
40 Commercial Centre: Mount Hutton Mount Hutton has several aged care facilities and a shopping centre that serves the retail needs of surrounding communities. Lake Macquarie Fair, Mount Hutton s retail centre, includes two supermarkets and over 55 specialty stores. Residential development is on the rise in response to a growing and diverse population. KEY FACTS: Area population: 3,181 (2011 Australian Bureau of Statistics). This is a rise of 74 since the 2006 Census. Central Business District: 63 operating businesses in Leasable Commercial Floor Space in 2012: 21,601m 2. LOCAL COMMUNITIES: Mount Hutton, Floraville, Jewells, Croudace Bay, Tingara Heights, Windale and Gateshead. FEATURES: Retail shopping centre Aldi development nearing completion Aged care facilities MAJOR BUSINESSES: Coles, Woolworths Woolworths Liquor Best and Less for Kids Lake Macquarie Private Hospital 40
41 Business Mix: Mount Hutton NUMBER OF BUSINESSES The total number of businesses in Mount Hutton has remained relatively consistent in There has however, been a significant increase (180%) of vacant businesses over the year. Mount Hutton: Number of Businesses Vacant
42 LEASABLE FLOOR AREA Business Mix: Mount Hutton Leasable floor area increased by 6% in 2012 with the largest increase being in vacant premises. Mount Hutton: Leasable Floor Area (m 2 ) Vacant 13,600 15,623 16,559 16,909 16,539 17,911 17, , ,626 15,129 17,219 18,273 18,273 18,354 20,435 21,601 42
43 PERMANENT EMPLOYMENT Business Mix: Mount Hutton Permanent employees have increased in the Mount Hutton commercial centre by 16%, with the greatest increase in the goods related service industries. Mount Hutton: Permanent Employees
44 CASUAL EMPLOYMENT Business Mix: Mount Hutton Casual employees in the Mount Hutton commercial centre have decreased by 16%, with the greatest reduction in the goods related service industries. Mount Hutton: Casual Employees

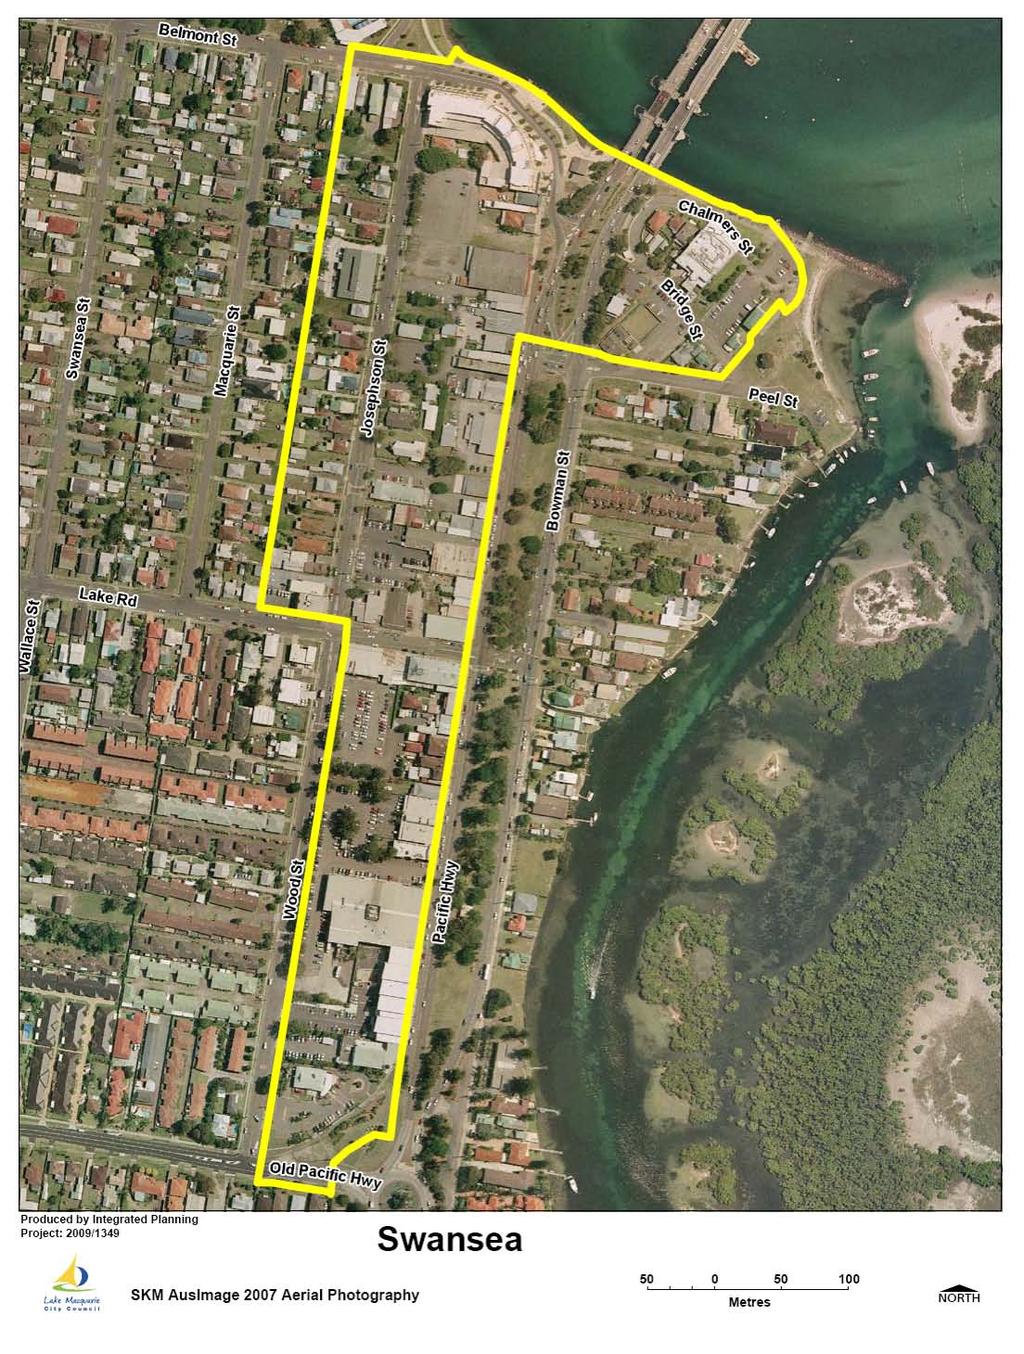
45 Commercial Centre: Swansea Swansea, the southern entrance to the city, boasts exceptional lakeside and beach living. With its unique coastal location, Swansea offers the opportunity for increased retail, commercial and tourism investment, to complement existing town centre services. The centre is predominately retail, but also provides a range of community, financial and health services to local residents. KEY FACTS: Area population: 5,541 including Swansea and Swansea Heads (2011 Australian Bureau of Statistics). The population has grown by 299 since the 2006 Census. Central Business District: 101 operating businesses in Leasable Commercial Floor Space in 2012: 26,975m 2. LOCAL COMMUNITIES: Swansea, Swansea Heads, Blacksmiths, Nords Wharf, Caves Beach, Cams Wharf, Murrays Beach, Pinny Beach, Catherine Hill Bay FEATURES: The Swansea Centre, including the Visitor Information Centre and Library premises Major tourism destinations including Swansea Caravan Park, Blacksmiths Caravan Park, Caves Beachside Resort, Pelican Point Marina and Raffertys Resort MAJOR BUSINESSES: Coles, Woolworths Swansea RSL Swansea Hotel 45
46 NUMBER OF BUSINESSES Business Mix: Swansea There has been minimal changes in the number of businesses operating in the Swansea commercial centre area over the past 12 months. Vacant premises remains the same in 2012 with a total of 11 premises vacant. Swansea: Number of Businesses Vacant
47 LEASABLE FLOOR AREA Business Mix: Swansea Leasable floor area in Swansea has increased by 1% in the last 12 months. Vacant leasable floor space has decreased by 18% in 12 months. Swansea: Leasable Floor Area (m 2 ) Vacant 9,020 7,803 8,205 9,075 12,200 11,045 11,045 2,821 3,416 3,210 6,515 5,437 5,563 5,860 1,888 2,114 2,042 2,851 6,292 6,626 6,696 2, ,685 2,286 2, ,095 3,260 3, ,727 16,428 16,917 21,983 26,482 26,747 26,975 47
48 PERMANENT EMPLOYMENT Business Mix: Swansea Permanent employment in Swansea remained the same between 2011 and Swansea: Permanent Employees
49 CASUAL EMPLOYMENT Business Mix: Swansea The total number of casual employees in Swansea has remained almost the same from 2011, with a very minimal decrease of 2 employees. Swansea: Casual Employees

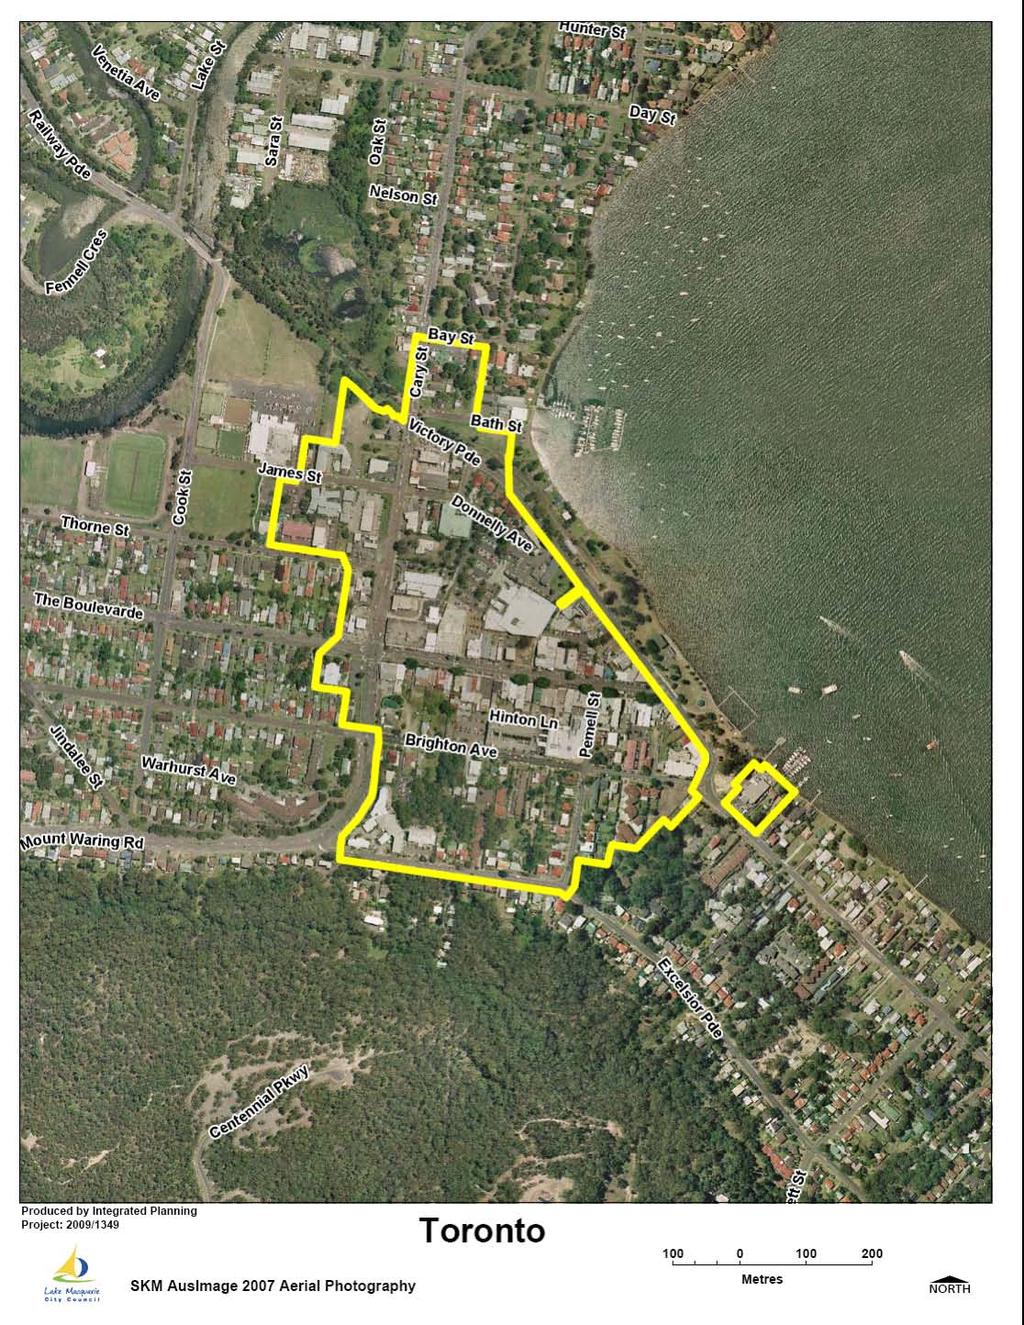
50 Commercial Centre: Toronto Toronto, with its enviable lakefront position, is the commercial, dining and retail hub of western Lake Macquarie. Just 10 minutes from the F3 Freeway, it is a perfect location for businesses servicing the Central Coast, Newcastle and wider Hunter region. Toronto has a large private hospital and associated specialist medical facilities, and a wide range of government, community, financial and professional services. KEY FACTS: Area population: 5,433 (2011 Australian Bureau of Statistics). The population has grown by 272 since the 2006 Census. Central Business District: 212 operating businesses in Leasable Commercial Floor Space in 2012: 52,485m 2. LOCAL COMMUNITIES: Toronto, Kilaben Bay, Coal Point, Fishing Point, Rathmines, Wangi Wangi, Teralba, Booragul, Woodrising, Fennell Bay, Bolton Point, Fassifern, Blackalls Park FEATURES: Direct link to F3 Freeway XPT and Express train stop Toronto Private Hospital Jetty for Lake Macquarie Cruises Private Marina Facilties Centre for goverment services including a Court House, sub-regional Police Operations, RTA, Centrelink and the Department of Housing MAJOR BUSINESSES: Toronto Private Hospital Woolworths, Coles, Aldi Macquarie Retirement Services Anglicare Retirement Villages 50
51 NUMBER OF BUSINESSES Business Mix: Toronto There has been minimal changes in the number of businesses operating in the Toronto commercial centre over the past 12 months. Vacant premises have decreased by a significant 28% over the year. Toronto: Number of Businesses Vacant
52 LEASABLE FLOOR AREA Business Mix: Toronto Leasable floor area has increased only slightly, by 1%, over the past 12 months, while vacant leasable floor space has fallen significantly by 42%. Toronto: Leasable Floor Area (m 2 ) Vacant 21,477 16,649 17,235 17,891 18,179 17,414 17,359 12,923 5,370 11,166 13,968 13,903 15,578 16,019 11,693 17,130 14,881 11,181 12,666 11,260 11,813 1,503 1,765 4,965 4,912 5,832 6,157 6, ,000 3,390 3,297 1,797 1, ,225 43,944 51,667 52,514 52,567 52,149 52,485 52
53 PERMANENT EMPLOYMENT Business Mix: Toronto Toronto commercial centre has managed to remain fairly consistent in its permanent employment numbers of the past 12 months across all sectors. Toronto: Permanent Employees ,331 53
54 CASUAL EMPLOYMENT Business Mix: Toronto The total number of casual employees in Toronto has increased by 3%, most notably in person based service industries. Toronto: Casual Employees

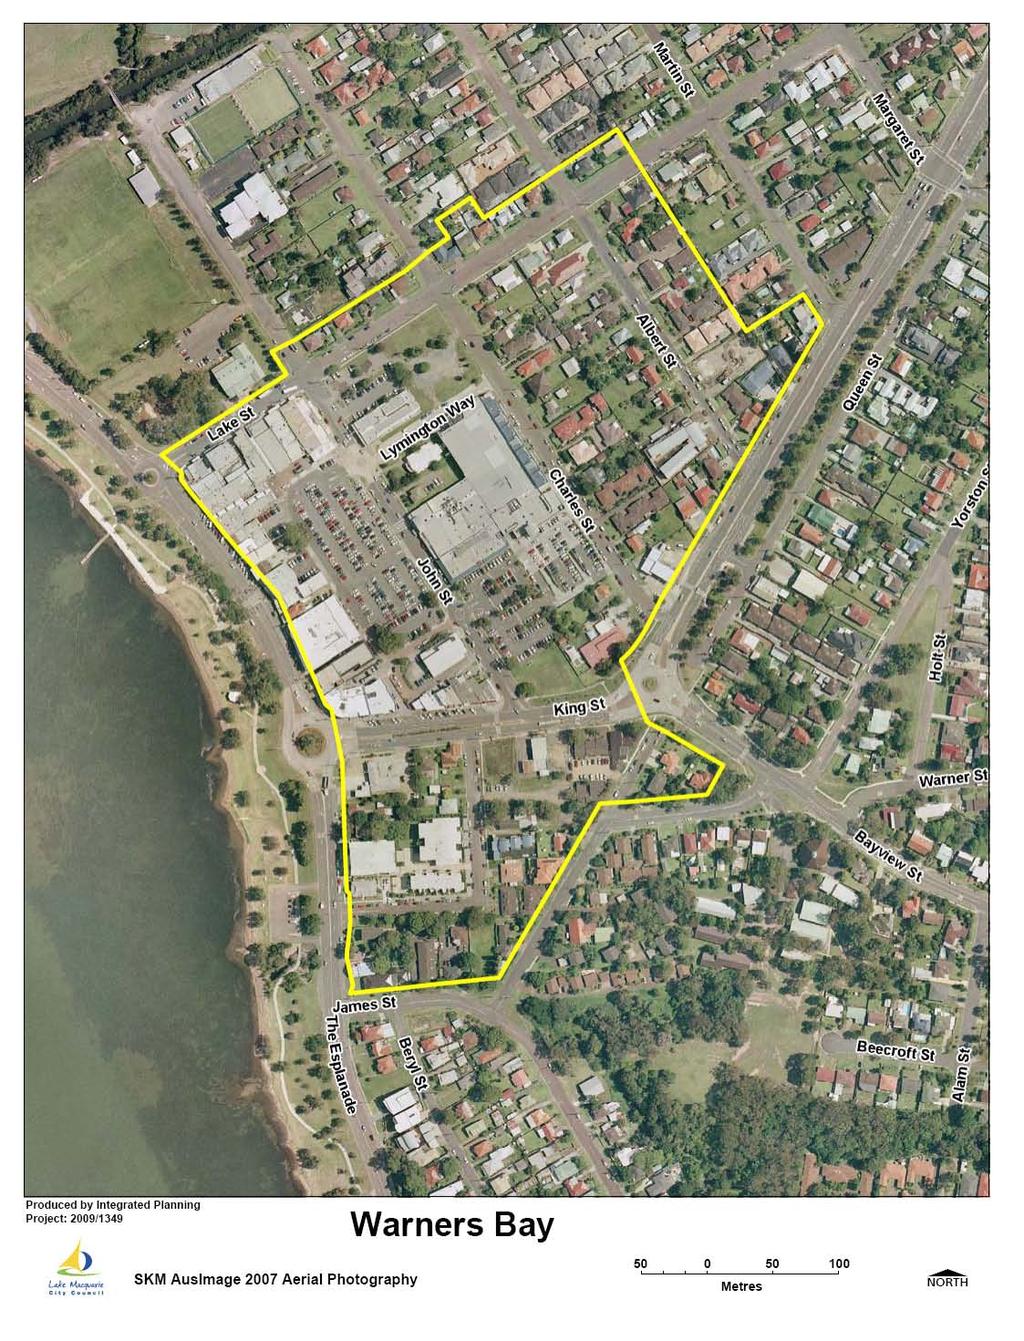
55 Commercial Centre: Warners Bay Warners Bay is a popular northern lakeside suburb boasting superior housing, a private hospital and a strong retail and café sector. Community events and alfresco dining on the foreshore are complemented by performances at the Lake Macquarie Performing Arts Centre. The nearby Hillsborough Road homemaker and leisure precinct also houses financial and professional services and specialist manufacturing businesses. KEY FACTS: Area population: 7,457 (2011 Australian Bureau of Statistics). This is a growth of 448 since the 2006 Census. Central Business District: 157 operating businesses in Leasable Commercial Floor Space in 2012: 21,564m 2 in LOCAL COMMUNITIES: Warners Bay, Speers Point, Boolaroo, Eleebana, Lakelands FEATURES: Many alfresco dining restaurants Boutique retail Large private hospital Foreshore events Ice skating, ten pin bowling, gymnasium, children's fun park Lake Macquarie Performing Arts Centre MAJOR BUSINESSES: Home Maker Centre including Officeworks Coles Warners Bay Private Hospital Coal Services 55
56 NUMBER OF BUSINESSES Business Mix: Warners Bay The total number of businesses in Warners Bay has increased by 6% in 2012 while vacant premises decreased by 50%. Warners Bay: Number of Businesses Vacant
57 LEASABLE FLOOR AREA Business Mix: Warners Bay Leasable floor area in Warners Bay has increased slightly, by 3%, over the past 12 months. Vacant leasable floor area has decreased by a substantial 57% in Warners Bay: Leasable Floor Area (m 2 ) Vacant 6,276 10,688 8,963 9,161 7,768 7,553 7,473 2,502 4,077 5,032 5,533 4,933 4,913 5,253 3,767 5,751 4,960 5,285 7,333 7,110 8, ,044 1, , ,665 23,705 20,384 20,616 20,668 20,848 21,564 57
58 PERMANENT EMPLOYMENT Business Mix: Warners Bay Warners Bay has seen significant 11% growth in permanent employment in The majority of this growth is in the knowledge based (17%) and goods related (24%) service industries. Warners Bay: Permanent Employees
59 CASUAL EMPLOYMENT Business Mix: Warners Bay Overall the total number of casual employees remained fairly static. Goods related service industries showed a marked fall in casual employment (down 24%) while person based service industries rose by 9%. Warners Bay: Casual Employees

60 60 Appendix A
61 61
62 62
63 63
64 64
65 65
66 66
67 67
68 68
Be in the heart of it all. Coffs Central - fashion, food and fun in the heart of the CBD
 Be in the heart of it all Coffs Central - fashion, food and fun in the heart of the CBD Coffs Harbour Jetty The mere presence of Coffs Central in our beautiful city has given a pulse to the heart of our
SUBURBPROFILE POPULATION TO DOUBLE OV E RVIE W CITY OF WY ND H AM FORECAST POPULATION WYNDHAM CITY COUNCIL
 TA R NI E T 1 SUBURBPROFILE The suburb is located within the boundaries of the City of Wyndham which is one of the fastest growing municipalities in Victoria and the third fastest in Australia. OV E RVIE
ASCOT SUBURB PROFILE
 ASCOT SUBURB PROFILE CONTENTS SUBURB HIGHLIGHTS 2 3 4 4 5 5 ASCOT & SURROUNDS LOCATION & LIFESTYLE DEMOGRAPHICS EMPLOYMENT FUTURE INFRASTRUCTURE WA MARKET TRENDS ACCESSIBILITY ENTERTAINMENT & RECREATION
Produced by: Destination Research Sergi Jarques, Director
 Produced by: Destination Research Sergi Jarques, Director Economic Impact of Tourism Oxfordshire - 2015 Economic Impact of Tourism Headline Figures Oxfordshire - 2015 Total number of trips (day & staying)
Produced by: Destination Research Sergi Jarques, Director
 Produced by: Destination Research Sergi Jarques, Director Economic Impact of Tourism Epping Forest - 2014 Economic Impact of Tourism Headline Figures Epping Forest - 2014 Total number of trips (day & staying)
Mango Hill/North Lakes
 Investment Pack QSA WEALTH & WELLBEING MANAGEMENT 2015 Mango Hill/North Lakes Investment Pack Location This location is 25 kilometres north of Brisbane and is dominated by a series of tranquil lakes. But
North Lanarkshire. Skills Assessment January SDS-1163-Jan16
 North Lanarkshire Skills Assessment January 2016 SDS-1163-Jan16 Acknowledgement The Regional Skills Assessment Steering Group (Skills Development Scotland, Scottish Enterprise, the Scottish Funding Council
Public Toilet Facilities Strategy Adopted by Council 27 June 2011
 Public Toilet Facilities Strategy Adopted by Council 27 June 2011 1 Table of Contents Introduction 4 Rationale of study 4 Project objectives 5 Methodology 5 Literature review 5 Planning requirements 6
OUTLOOK EAST LEPPINGTON
 OUTLOOK EAST LEPPINGTON A CONTEXT ON BUSINESS, CULTURE, LIFESTYLE AND RESIDENTIAL Located within the rapidly expanding South West Growth Centre of Sydney, the East Leppington Precinct is well positioned
Benefits and costs of tourism for remote communities
 Benefits and costs of tourism for remote communities Case study for the Carpentaria Shire in north-west Queensland Chapter 2 1 THE CARPENTARIA SHIRE COMMUNITY AND TOURISM... 2 Plate 5: Matilda Highway
Produced by: Destination Research Sergi Jarques, Director
 Produced by: Destination Research Sergi Jarques, Director Economic Impact of Tourism North Norfolk District - 2016 Contents Page Summary Results 2 Contextual analysis 4 Volume of Tourism 7 Staying Visitors
Produced by: Destination Research Sergi Jarques, Director
 Produced by: Destination Research Sergi Jarques, Director Economic Impact of Tourism Norfolk - 2016 Contents Page Summary Results 2 Contextual analysis 4 Volume of Tourism 7 Staying Visitors - Accommodation
Produced by: Destination Research Sergi Jarques, Director
 Produced by: Destination Research Sergi Jarques, Director Economic Impact of Tourism Oxfordshire - 2016 Economic Impact of Tourism Headline Figures Oxfordshire - 2016 number of trips (day & staying) 27,592,106
Business Register and Employment Survey 2016 Update Final March 2016
 Business Register and Employment Survey 2016 Update Final March 2016 Jamie.watson@coast2capital.org.uk EXECUTIVE SUMMARY The Business Register and Employment Survey (BRES) update has shown that the Coast
Location Report. Coffs Harbour U Retire ( ) Retire with Property
 Retire with Property") Location Report Coffs Harbour Retire with Property 1300 U Retire (873 847) www.superannuationproperty.com Coffs Harbour Location Coffs Harbour is a regional town on the North Coast of New South Wales
Location Report Coffs Harbour Retire with Property 1300 U Retire (873 847) www.superannuationproperty.com Coffs Harbour Location Coffs Harbour is a regional town on the North Coast of New South Wales
TOWN PLANNING SUBMISSION TO THE GREATER SYDNEY COMMISSION LANDS AT ARTARMON
 TOWN PLANNING SUBMISSION TO THE GREATER SYDNEY COMMISSION LANDS AT ARTARMON March 2017 TABLE OF CONTENTS 1.0 INTRODUCTION 3 2.0 THE SUBJECT SITE 4 3.0 STRATEGIC PLANNING CONTEXT 6 4.0 SUMMARY AND CONCLUSIONS
Employment Characteristics of Tourism Industries, 2011
 Employment Characteristics of Tourism Industries, 2011 Coverage: UK Date: 22 March 2013 Geographical Area: UK Theme: Labour Market Theme: People and Places Theme: Travel and Transport Theme: Economy Key
HEALTH SECTOR ECONOMIC INDICATORS REPORT
 HEALTH SECTOR ECONOMIC INDICATORS REPORT For: Mid North Coast Local Health District Report prepared by: April 2013 Table of Contents Introduction 3 Executive Summary 4 Output 5 Value-Added 7 Workforce
INFORMATION MEMORANDUM Fairfield Central Townsville NOW LEASING STAGE 2
 INFORMATION MEMORANDUM Fairfield Central Townsville NOW LEASING STAGE 2 Fairfield Central is a bustling suburban shopping centre located in Idalia, just 7km from Townsville CBD. Introduction Currently
Economic Impact Analysis. Tourism on Tasmania s King Island
 Economic Impact Analysis Tourism on Tasmania s King Island i Economic Impact Analysis Tourism on Tasmania s King Island This project has been conducted by REMPLAN Project Team Matthew Nichol Principal
Produced by: Destination Research Sergi Jarques, Director
 Produced by: Destination Research Sergi Jarques, Director Economic Impact of Tourism Norfolk - 2017 Contents Page Summary Results 2 Contextual analysis 4 Volume of Tourism 7 Staying Visitors - Accommodation
Contents Manningham at a Glance... 6 Location and Area... 6 Manningham Activity Centres... 6 Manningham Suburbs... 6 Population... 8 Forecast... 9 For
 Contents Manningham at a Glance... 6 Location and Area... 6 Manningham Activity Centres... 6 Manningham Suburbs... 6 Population... 8 Forecast... 9 Forecast 2011 2036... 9 Population Forecast... 9 Gross
Council Venue Hire Fees /2015
 Council enue Hire Fees - 2014/2015 rices are indicitive only. lease contact Screen Hunter for a detailed quote. C - general conditions - venue S - sports T - traffic control/management - park Administration
A subsidiary of Metro Property Development SUBURB PROFILE LARA 7TH JUNE 2017
 A subsidiary of Metro Property Development SUBURB PROFILE LARA 7TH JUNE 2017 OVERVIEW Lara is a suburb located in the Greater Geelong Area just 17kms from Geelong and 60kms to the Melbourne CBD. Lara is
The Yorke & Mid North (State Govt) Region. Workforce Wizard Region Report
 Region. Workforce Wizard Region Report") The Yorke & Mid North (State Govt) Region Workforce Wizard Region Report Table of Contents Executive Summary 3 Population and Social Characteristics 4 Current Population 4 Age Groups 4 Key Populations
The Yorke & Mid North (State Govt) Region Workforce Wizard Region Report Table of Contents Executive Summary 3 Population and Social Characteristics 4 Current Population 4 Age Groups 4 Key Populations
PORT DOUGLAS SUBURB REPORT
 PORT DOUGLAS SUBURB REPORT LOCALITY Port Douglas is an internationally acclaimed tropical coastal holiday destination 70 kilometres north of Cairns. Access from Cairns is via the scenic Captain Cook Highway
MARKET OUTLOOK. 01 Walkability & Accessibility 02 Infrastructure & Employment 03 Population & Demographics 04 Residential Market 05 Rental Market
 MARKET OUTLOOK BRAYBROOK Close to the city in Melbourne s growing west, access to jobs, services and relative affordability are attracting new residents to Braybrook and driving price growth. 01 Walkability
Hunter Water Corporation Media Release
 Hunter Water Corporation Media Release Wednesday 8 January 2014 HUNTER WATER INCREASES CUSTOMER REBATE A decision 2 years ago to adjust how Hunter Water compensates customers affected by lengthy emergency
Economic Contribution of Tourism to NSW
 Economic Contribution of Tourism to NSW 2013-14 Tourism is a significant part of the NSW economy. In 2013-14, tourism contributed $34.9 billion (Tourism Consumption) to the NSW economy and employed 272,000
Located on the banks of the Pine River, Griffin Pocket is part of a region that has been rated as one of Brisbane s greenest suburbs.
 Location Griffin Pocket is perfectly positioned for a family-friendly lifestyle at the doorstep of Moreton Bay. Located on the banks of the Pine River, Griffin Pocket is part of a region that has been
The Economic Impact of Tourism in Hillsborough County. July 2017
 The Economic Impact of Tourism in Hillsborough County July 2017 Table of contents 1) Key Findings for 2016 3 2) Local Tourism Trends 7 3) Trends in Visits and Spending 12 4) The Domestic Market 19 5) The
Your new bayside address
 Your new bayside address Create the home of your dreams at Promenade Rothwell, Stockland s exciting new residential community in the thriving Moreton Bay region. Conveniently located adjacent to the bay,
NEWCASTLE VISITOR PROFILE AND SATISFACTION REPORT. Summary of results OCTOBER Image: Newcastle Marina, courtesy of Newcastle Tourism
 NEWCASTLE VISITOR PROFILE AND SATISFACTION REPORT Summary of results OCTOBER 2013 Image: Newcastle Marina, courtesy of Newcastle Tourism 3 NEWCASTLE VISITOR PROFILE AND SATISFACTION REPORT: SUMMARY OF
Suburb Profile 200,000 53,000 MARSDEN POPULATION GROWTH LOCATION POPULATION AND DEMOGRAPHICS TRANSPORT AND ACCESSIBILITY MARSDEN
 A DIVISION OF Suburb Profile LOCATION The suburb of Marsden is located approximately 30 minutes from the CBD within the boundaries of the Logan City Council which is one of the largest and fastest growing
POP UP RETAIL LAUNCH A CONCEPT, TEST AN IDEA, GROW YOUR BRAND. Prime sites in high traffic locations now available
 POP UP RETAIL LAUNCH A CONCEPT, TEST AN IDEA, GROW YOUR BRAND Prime sites in high traffic locations now available POP! Pop Up Retail offers prime sites in high traffic locations across 14 shopping centres
Commissioned by: Economic Impact of Tourism. Stevenage Results. Produced by: Destination Research
 Commissioned by: Produced by: Destination Research www.destinationresearch.co.uk December 2016 Contents Page Introduction and Contextual Analysis 3 Headline Figures 5 Volume of Tourism 7 Staying Visitors
Gold Coast: Modelled Future PIA Queensland Awards for Planning Excellence 2014 Nomination under Cutting Edge Research category
 Gold Coast: Modelled Future PIA Queensland Awards for Planning Excellence 2014 Nomination under Cutting Edge Research category Jointly nominated by SGS Economics and Planning and City of Gold Coast August
Economic Impact of Tourism. Hertfordshire Results. Commissioned by: Visit Herts. Produced by:
 Commissioned by: Visit Herts Produced by: Destination Research www.destinationresearch.co.uk December 2016 Contents Page Introduction and Contextual Analysis 3 Headline Figures 5 Volume of Tourism 7 Staying
Axiom Properties Limited
 Axiom Properties Limited AGM UPDATE 23 November 2016 Axiom Overview 2 Axiom Properties Limited ( Axiom ) is an ASX listed property development and investment company (ASX code: AXI), which has developed
uburbs Inner Eastern LLEN Region 27,298 FTE students in Government schools*** 177,361 * 397,525 Total population* 61,631 businesses 202,078 Boroondara
 uburbs Inner Eastern LLEN Region There are 55,952 young people aged 5-19 years old in the IELLEN region That's 15% of the total population 120 Primary and Secondary schools (Government, Catholic, Independent)
STONES CORNER SUBURBPROFILE. Situated three kilometres from the Brisbane CBD, Stones Corner is located within one of Brisbane s key growth areas.
 1 SUBURBPROFILE Situated three kilometres from the Brisbane CBD, Stones Corner is located within one of Brisbane s key growth areas. OVERVIEW Situated three kilometres from the Brisbane CBD, Stones Corner
LEASING OPPORTUNITIES AUSTRALIAFAIR.COM.AU
 YOUR OPPORTUNITY IS NOW LEASING OPPORTUNITIES AUSTRALIAFAIR.COM.AU AUSTRALIA FAIR EVOLUTION With the evolution of the official Southport CBD and an associated boost in local economic indicators, Australia
IMPACT HOMES Introducing The Meadows Estate 3
 IMPACT HOMES Introducing The Meadows Estate 3 4 IMPACT HOMES Introducing The Meadows Estate INTRODUCTION The purpose of this guide is to introduce The Meadows, a residential community developed by Leda.
GOLD COAST HOUSING REPORT SNAPSHOT
 GOLD COAST HOUSING REPORT SNAPSHOT Few cities have expanded like the Gold Coast. The once iconic surfing Mecca and holiday destination has grown to become the 6th largest city in Australia with a population
Economic Impact of Tourism in Hillsborough County September 2016
 Economic Impact of Tourism in Hillsborough County - 2015 September 2016 Key findings for 2015 Almost 22 million people visited Hillsborough County in 2015. Visits to Hillsborough County increased 4.5%
Palmerston North Retailing
 Palmerston North Retailing Introduction and General Experience My name is Peter Crawford and I am the Economic Policy Advisor for Palmerston North City Council. My qualifications include a BA (geography
The Economic Impact of West Oxfordshire s Visitor Economy 2015
 The Economic Impact of West Oxfordshire s Visitor Economy 2015 Produced on behalf of the West Oxfordshire District Council By The South West Research Company Ltd October 201 1 Contents Page Introduction
The Economic Impact of West Oxfordshire s Visitor Economy 2016
 The Economic Impact of West Oxfordshire s Visitor Economy 201 Produced on behalf of the West Oxfordshire District Council By The South West Research Company Ltd January 2018 1 Contents Page Introduction
LORD HOWE ISLAND MARINE PARK PROFILE OF LOCAL BUSINESSES. Department of Environment Climate Change & Water. Prepared For: Prepared By:
 LORD HOWE ISLAND MARINE PARK PROFILE OF LOCAL BUSINESSES Prepared For: Department of Environment Climate Change & Water Prepared By: Arche Consulting Pty Ltd Version: June 2010 Arche Consulting T + 61
Tourism Industry Council Tasmania Community Survey 2018 Research Report. May 2018
 Tourism Industry Council Tasmania Community Survey 2018 Research Report May 2018 This report has been prepared by Enterprise Marketing and Research Services 60 Main Road, Moonah TAS 7009 All enquiries
Lake Mac Trails Your Councillors Save money on electricity Green Waste Service Our child care services Become an Eco Angel
 Lake Mac Trails Your Councillors Save money on electricity Green Waste Service Our child care services Become an Eco Angel Getting to know your Council Last year s local government election delivered significant
QUARTERLY UPDATE 31 MARCH 2017
 AUSTRALIAN PROPERTY OPPORTUNITIES FUND QUARTERLY UPDATE 31 MARCH 2017 The Australian Property Opportunities Fund (APOF I or the Fund) is pleased to provide this update for the March quarter 2017 (Q1 2017)
The Economic Contributions of Agritourism in New Jersey
 The Economic Contributions of Agritourism in New Jersey Bulletin E333 Cooperative Extension Brian J. Schilling, Extension Specialist in Agricultural Policy Kevin P. Sullivan, Institutional Research Analyst
East Lothian. Skills Assessment January SDS-1154-Jan16
 East Lothian Skills Assessment January 2016 SDS-1154-Jan16 Acknowledgement The Regional Skills Assessment Steering Group (Skills Development Scotland, Scottish Enterprise, the Scottish Funding Council
21.07 ECONOMIC DEVELOPMENT AND EMPLOYMENT 19/03/2015 C323 Proposed C Key issues and influences. Economic Role and Function
 21.07 ECONOMIC DEVELOPMENT AND EMPLOYMENT 19/03/2015 C323 Proposed C347 21.07-1 Key issues and influences 14/10/2010 C168 Economic Role and Function Geelong is the largest regional city in Victoria and
Committee Room, Lake Macquarie City Council Administration Building, Speers Point
 Lake Macquarie Sustainable Neighbourhood Alliance Ordinary Meeting MINUTES Tuesday 21 March 2017, 6.00-8.00pm Committee Room, Lake Macquarie City Council Administration Building, Speers Point Present:
The Economic Impact of Tourism in Hillsborough County, June 2018
 The Economic Impact of Tourism in Hillsborough County, 2017 June 2018 Table of contents 1) Key Findings for 2017 3 2) Local Tourism Trends 7 3) Trends in Visits and Spending 12 4) The Domestic Market 19
PCAL Case Study Retail Areas: Rouse Hill Town Centre
 PCAL Case Study Retail Areas: Rouse Hill Town Centre Introduction Rouse Hill Town Centre is a new mixed use development on a greenfield site in Sydney s North West. It has been planned to be a major hub
Economic Contribution of Tourism to NSW
 Economic Contribution of Tourism to NSW 2015-16 Tourism is a significant part of the NSW economy. In 2015-16, tourism contributed $38.1 billion (Tourism Consumption) to the NSW economy and employed 261,100
The Sunshine Coast is part of the global community and generates wealth through export, high-value industries and new investment.
 3.2 Strategic intent 3.2.1 Shaping growth an overview In 2031, the Sunshine Coast is renowned for its vibrant economy, ecological values, unique character and strong sense of community. It is Australia
Investor Report. Connecting the best of both worlds
 Investor Report Connecting the best of both worlds Executive summary Project & display address 1015 Pacific Highway, Roseville, NSW 2069 Project description Rose is a mixed-use development located within
The Hume Workforce Development Committee
 The Hume Workforce Development Committee Hume Regional Development Australia Accommodation and Food Labour Market Snapshot Workforce Planning Australia March 2012 Workforce Planning Australia - www.workforceplanning.com.au
Retail Vacancy Survey Abingdon, Faringdon and Wantage
 Retail Vacancy Survey 2015 Abingdon, Faringdon and Wantage Introduction The retail vacancy rate across the Vale of White Horse District Council s market towns of Abingdon, Faringdon and Wantage as of September
ISRAEL- COUNTRY FACTS
 ISRAEL- COUNTRY FACTS ISRAEL-NEIGHBOURING COUNTRIES AND POLITICAL MAP Area: 22,072 sq. km Land area: 21,643 sq. km. Fast Facts Area of lakes: 429 sq. km. (Sea of Galilee 164 sq. km., the Dead Sea - 265
13.1 REGIONAL TOURISM ISSUES AND SUMMARY OF FINDINGS
 13 REGIONAL TOURISM T he County of Mariposa s recreation needs and facilities fall within two categories: regional tourism and local recreation. This Element focuses on regional tourism issues related
The Economic Impact of Poole s Visitor Economy 2015
 The Economic Impact of Poole s Visitor Economy 2015 Produced By The South West Research Company Ltd October 2016 Contents Page Introduction 3 Poole data 4 Dorset data 17 Introduction This report examines
TRANSPORT AFFORDABILITY INDEX
 TRANSPORT AFFORDABILITY INDEX Report - December 2016 AAA 1 AAA 2 Table of contents Foreword 4 Section One Overview 6 Section Two Summary of Results 7 Section Three Detailed Results 9 Section Four City
NEW RETAIL OPPORTUNITIES
 NEW RETAIL OPPORTUNITIES STAGE 1 LEASING NOW Join Coles, Kmart and ALDI plus 50+ Specialty Stores and Dining Precinct THE PORT S NEWEST RETAIL DEVELOPMENT The redevelopment of the Port Canal Shopping Centre
Introduction 3. Accommodation 4. Ireland Market 5. Activity Providers, Attractions, Retail and Transport 6. Overseas Market Performance 7.
 Contents Page No: Introduction 3 Accommodation 4 Ireland Market 5 Activity Providers, Attractions, Retail and Transport 6 Overseas Market Performance 7 Prospects 8 Factors Impacting on Performance 9 Operational
The Economic Impact of Tourism New Forest Prepared by: Tourism South East Research Unit 40 Chamberlayne Road Eastleigh Hampshire SO50 5JH
 The Economic Impact of Tourism New Forest 2008 Prepared by: Tourism South East Research Unit 40 Chamberlayne Road Eastleigh Hampshire SO50 5JH CONTENTS Glossary of terms 1 1. Summary of Results 4 2. Table
*Artist Impression. *Artist Impression
 Your Urban Oasis Urban Ingenuity It s not hard to feel renewed and inspired at Forest Ridge Estate, where you can experience beautiful countryside, wide-open spaces, and retain all the advantages of City
TOWNSVILLE NORTH QUEENSLAND QUARTERLY ECONOMIC SNAPSHOT
 TOWNSVILLE NORTH QUEENSLAND QUARTERLY ECONOMIC SNAPSHOT SEPTEMBER 2017 TOWNSVILLE NORTH QUEENSLAND QUARTERLY ECONOMIC SNAPSHOT SEPTEMBER 2017 The Townsville North Queensland Economic Snapshot provides
The Economic Impact of Tourism in Buncombe County, North Carolina
 The Economic Impact of Tourism in Buncombe County, North Carolina 2017 Analysis September 2018 Introduction and definitions This study measures the economic impact of tourism in Buncombe County, North
Long-term Trends in Auckland s Business Demographics
 Long-term Trends in Auckland s Business Demographics Ting Huang October 2018 Technical Report 2018/024 Long-term trends in Auckland s business demographics October 2018 Technical Report 2018/024 Ting
Hamilton s Business Economy
 Hamilton s Business Economy Growth Indicator Report August 2017 hamilton.govt.nz/growth Contents 3. Introduction 4. New Commercial and Industrial Building Consents 6. Retail 8. Employment 9. Unemployment
Magnetic Heart of Queensland
 Shaping Townsville s Destiny to be the... Magnetic Heart of Queensland A design for future Townsville by Vee Design : 9point9 Architects : Milford Planning : Meter : Szczepan Urbanowicz shaping Townsville
BEACHSIDE ON THE PARK
 Built better. BEACHSIDE ON THE PARK Due Diligence Project Report (07) 5370 1800 info@builtbetter.com.au builtbetter.com.au 1 builtbetter.com.au WELCOME TO BEACHSIDE Beachside on the park has been Constructed
CORPORATE ACCOMMODATION SOLUTIONS
 CORPORATE ACCOMMODATION SOLUTIONS TABLE OF CONTENTS EXECUTIVE SUMMARY 3 THE LOCATION 4 KEY FEATURES 5 MASTERPLAN 8 TRANSPORT & PARKING 9 EAST VILLAGE 10 INDICATIVE SCHEME 11 ABOUT THE DEVELOPER 14 2 EXECUTIVE
Announcing the Box Hill Project (provisional name) First Large-Scale Residential Housing Joint Development Project in New South Wales, Australia
 First Large-Scale Residential Housing Joint Development Project in New South Wales, Australia") Press release July 2, 2018 Daiwa House Industry Co., Ltd. Odakyu Electric Railway Co., Ltd. Announcing the Box Hill Project (provisional name) First Large-Scale Residential Housing Joint Development Project
Press release July 2, 2018 Daiwa House Industry Co., Ltd. Odakyu Electric Railway Co., Ltd. Announcing the Box Hill Project (provisional name) First Large-Scale Residential Housing Joint Development Project
Smart Cities Plan. Lake Macquarie City Council Submission
 Smart Cities Plan Lake Macquarie City Council Submission 1. Summary Lake Macquarie City Council supports the intent of the Australian Government s Smart Cities Plan to create liveable cities through improved
Ingenia acquires premium coastal park in new Southern NSW cluster
 ASX / Media Release 13 August 2015 Ingenia acquires premium coastal park in new Southern NSW cluster Highlights Acquisition of the premier park on the NSW South Coast, underpinned by stable cash flows
South Australian Tourism Industry Council SA Tourism Barometer March Quarter 2015
 South Australian Tourism Industry Council SA Tourism Barometer March Quarter 2015 Headline: Events Season Provides a Lift In the March quarter 2015 survey the business activity index increased by 6% -
REGATTA MEWS DUE DILIGENCE PROJECT REPORT REGATTA MEWS
 REGATTA MEWS DUE DILIGENCE PROJECT REPORT R M REGATTA MEWS REGATTA MEWS PROJECT DETAILS PROJECT: Regatta Mews, Wurtulla LOCATION: Lot 1888, Nicklin Way (corner of Regatta Boulevard) Wurtulla, QLD 4575
Item 1 Ryhope Paper Subdivision
 Item 1 Ryhope Paper Subdivision Item 1 Ryhope Paper Subdivision Address (the site) 3, 5, 7,9 10-22, 24, 25, 28, 35-40, 42, 44, 46, 48 Charles Street, Ryhope 4, 6, 8, 10, 12, 14, 16, 18, 20, 22-28, 30,
BUSINESS PARK. 8 Parkview Drive, Sydney Olympic Park FOR LEASE
 1 2 4 3 BUSINESS PARK 8 Parkview Drive, Sydney Olympic Park OFFICE SPACE available FOR LEASE Imagine a workplace within a world class business park providing an ambiance which promotes greater productivity
The Outlook for the Residential Construction Industry Hunter and the Central Coast
 The Outlook for the Residential Construction Industry Hunter and the Central Coast Graham Wolfe HIA Chief Executive Industry Policy and Media HIA Industry Outlook Breakfast Newcastle February 2013 Backdrop:
The Economic Impact of Tourism in Jacksonville, FL. June 2016
 The Economic Impact of Tourism in Jacksonville, FL June 2016 Highlights Visitor spending surpassed $2.0 billion in 2015, growing 4.4%. As this money flowed through Duval County, the $2.0 billion in visitor
A place to flourish. Designed with community and connection at its core, Orchid Lane is the perfect environment to create your story.
 Leppington Where life blooms Orchid Lane by Rawson Communities invites you to become part of a vibrant new community at the heart of Sydney s South-West growth corridor. Positioned in the heart of East
CREATING A SENSE OF PLACE
 CREATING A SENSE OF PLACE Arts, Heritage and Cultural Mapping Project 2017 CONTENT Purpose of the Report 3 Methodology 3 2017 Lake Macquarie Cultural Snapshot 4 Aboriginal Culture and Heritage 4 Advocacy
NORTH WEST GROWTH CENTRE
 OUTLOOK NORTH WEST GROWTH CENTRE A CONTEXT ON BUSINESS, CULTURE, LIFESTYLE AND RESIDENTIAL The North West Growth Centre is an emerging residential market that is expected to benefit from strong infrastructure
Sunshine Coast: Kawana Health Campus. December 2013
 Sunshine Coast: Kawana Health Campus December 2013 Kawana Health Campus Residential development at Birtinya* Overview The Kawana Health Campus will comprise state-of-the-art public and private hospital
STAGE PLAN STAGE 4B REEF RELEASE LEGEND. Lot Height. Display Village Previous Release. Current Release. Retaining Wall Sold.
 STAGE PLAN STAGE 4B REEF RELEASE 6.54 7.28 7.43 7.30 7.40 7.80 7.50 7.97 PGOL0466.030216 TAMBREY AVENUE LEGEND Lot Height Current Release Display Village Previous Release Group Housing Retaining Wall Sold
The Economic Impact of Tourism on Galveston Island, Texas
 The Economic Impact of Tourism on Galveston Island, Texas 2017 Analysis Prepared for: Headline Results Headline results Tourism is an integral part of the Galveston Island economy and continues to be a
visitor insights 2016
 visitor insights 2016 table of contents Purpose of Report 3 Surf Coast Data Regions 3 Maps 3 Executive Summary 4 Summary of Total Visitation to Surf Coast 5 Total Visitation and Visitor Nights 5 Total
Everything in one place
 Live more. Now. Everything in one place North Lakes is simply a destination like no other. This multi-award winning Stockland community has all the services and features you need for an easy, modern lifestyle.
Otago Economic Overview 2013
 Final report May 2014 www.berl.co.nz Background Author(s): Mark Cox, Hugh Dixon and Masrur Alam Khan DISCLAIMER All work is done, and services rendered at the request of, and for the purposes of the client
Holmview, BRISBANE QLD
 Holmview, BRISBANE QLD HAVEN HILL - LOCATION Holmview PRIME LOCATION LOCATION Holmview is part of the Logan City Council region and is located nearly half way between the Gold Coast and Brisbane on the
investment ProSPeCTuS 2016 SuMMary
 investment ProSPeCTuS 2016 SuMMary 2 invest SuNShiNe CoaST - The future is here MeSSaGe from The Mayor MeSSaGe from The Mayor a CiTy region of opportunity The Sunshine Coast offers investors an unrivalled
Economic Impact of Tourism. Norfolk
 Economic Impact of Tourism Norfolk - 2009 Produced by: East of England Tourism Dettingen House Dettingen Way, Bury St Edmunds Suffolk IP33 3TU Tel. 01284 727480 Contextual analysis Regional Economic Trends
Introduction 3. Accommodation 4. Ireland Market 5. Activity Providers, Attractions, Retail, Restaurants and Transport 6. Overseas Market Performance 7
 Wave 2 September Contents Page No: Introduction Accommodation 4 Ireland Market 5 Activity Providers, Attractions, Retail, Restaurants and Transport 6 Overseas Market Performance 7 Prospects 8 Factors Impacting