Palmerston North Retailing
|
|
|
- Rosaline Lee
- 5 years ago
- Views:
Transcription
1 Palmerston North Retailing Introduction and General Experience My name is Peter Crawford and I am the Economic Policy Advisor for Palmerston North City Council. My qualifications include a BA (geography and economics), BA Hons (Geography) and Diploma in Development Studies. Previous work experience includes five years at the Department of Trade and Industry (trade policy, regional development and import licensing), and 17 years at the New Zealand Manufacturers Federation (Executive Officer for a range of industry groups and Trade and Economic Analyst for the Federation). Scope and Approach The data used in this report is obtained from Statistics New Zealand and the Ministry of Tourism. Data from the Statistics New Zealand Retail Trade Survey covers Australian and New Zealand Standard Industrial Classification (ANZSIC) 2006 Division G (Retail Trade), Division H (Accommodation and Food Services) and part of Division S (Other Services Automotive Repair and Maintenance). The annual employment earnings data from the Linked Employer-Employee Data series is only available at the ANZSIC 2006 Division level so the earnings data does not include earnings for employees in automotive repair and maintenance. The Statistics New Zealand Retail Trade Survey data for Palmerston North is released with a caveat noting limitations in the data. They are of a lower standard than published figures Statistics New Zealand releases. The Retail Trade Survey sample is selected and weighted at the retail industry group level nationally, and the release of this data for Palmerston North is below that design level. This data is subject to sample, non-sample and modelling errors and is indicative only. The retail sales data is exclusive of GST. Palmerston North Retail Industry Context Palmerston North city, with an estimated population of 80,300 people as at 30 June 2009, is the 12 th largest local authority in New Zealand and accounts for a 1.9% share of the New Zealand population. Statistics New Zealand has projected population growth of 15,100 between 2006 and 2031 (medium growth projection), with the city population reaching 93,600 by The Department s population projections show continuing urban drift, with large cities growing faster than smaller cities and rural towns. The medium 25-year growth projections of 0.7% average annual growth for Palmerston North are slightly lower than the national average of 0.8% but are much higher than other regional cities that are smaller than Palmerston North. The city s share of economic activity is significantly higher than its population share, which is reflected in the higher Palmerston North city share of national data for employee numbers, employee earnings, visitor numbers and retail sales. In February 2009 the employee count for the city was 46,550, 2.4% of national employment. The city is the 10 th largest local authority for employment. Census 2006 data suggests that over 20% of the city s workforce lives outside the city. Major commuter flows to the city come from Manawatu District, Horowhenua District, Rangitikei District and Tararua District (in declining order). Over the nine year period
2 2 from 2000 to 2009 the city s population growth was well below the national average but growth in employee numbers and employee earnings matched national growth levels. The difference between population and employment growth levels is due to a decline in tertiary student numbers in the city, reductions in the number of people receiving benefits, increased participation in employment by people aged 65 and over and increased levels of commuting to the city from surrounding local authorities. The Palmerston North retail sector accounted for 17% of total employment in the city in February 2009 and 11.3% of total employee earnings in the city in the year ended 2008 (the latest employee earnings data available). The retail employee count data for the city accounted for 2.4% of the national retail workforce while the retail employee earnings data for the city accounted for 2.5% of national retail earnings. The Statistics New Zealand Retail Trade survey also shows a similar pattern, with Palmerston North holding a 2.6% share of national retail sales in the year ended 2009 and a 2.4% share of core retail sales (which excludes motor vehicle and fuel sales and vehicle servicing expenditure). The city s share of total retail sales and core retail sales has increased over the period from 2005 to Total retail sales in the city have increased from 2.27% of national retails sales in the year ended 2005 to 2.59% in the year ended Core retail sales increased from 2.33% of national retails sales in the year ended 2005 to 2.40% in the year ended % Palmerston North Share of National Retail sales 2.5% 2.3% Annual % share 2.1% 1.9% 1.7% 1.5% Population share of national population Core retail share of national retail sales Total retail sale share of national retail sales December January February March April May June July December January February March April May June July December January February March April May June July December January February March April May June July Year ended Core retail sales excludes motor vehicle sales and servicing Source: Statistics NZ Palmerston North has also been increasing its share of national retail employee earnings and retail turnover, reflecting the growth of Palmerston North as a significant regional retail centre. The employee earnings data for Palmerston North also shows the increasing importance of retailing within the city economy. Retail employee earnings in the city have increased from 10.1% of total employee earnings in the city in 2000 to 11.3% by June 2008 (the latest sector earnings data available). The employee count data for the city does not show a similar increase, suggesting
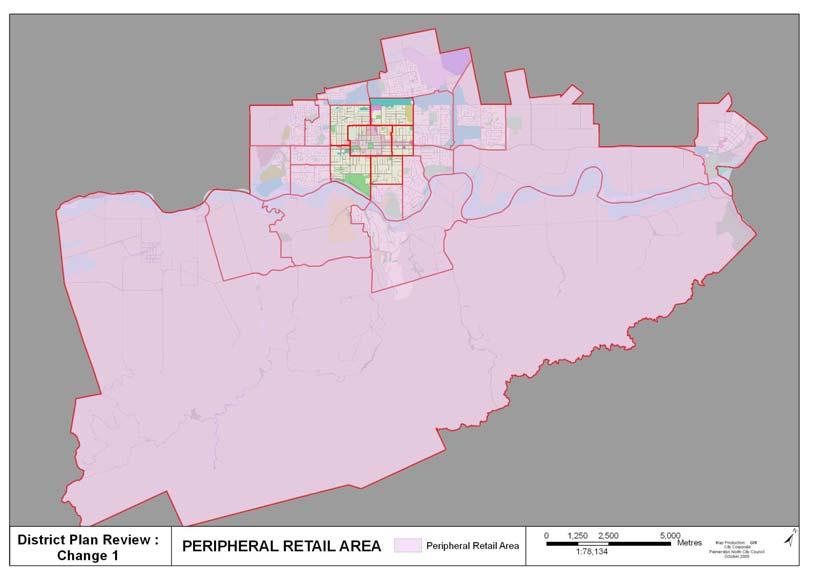
3 3 that full-time employment in the retail sector in Palmerston North has grown more strongly than part-time employment in the sector. 11.5% Retail employee earnings share of total employee earnings 11.0% Percentage share of total employment 10.5% 10.0% 9.5% New Zealand Palmerston North 9.0% Employment as at February Source: Statistics NZ Palmerston North is not recognised nationally as a major tourism destination yet experiences significant day visitor and overnight visitor flows. Ministry of Tourism data for day visitors to the Manawatu Regional Tourism Organisation (RTO) area (The Manawatu RTO comprises Manawatu District Council, Palmerston North City Council, Rangitikei District Council, Tararua District Council). The city attracted a 6% share of conference activity and conference delegates in the new Ministry of Tourism conference survey for the quarter. It also has an increasing role in hosting major national sports tournaments, particularly secondary school tournaments. Ministry of Tourism data from the International Visitor survey and the Domestic Travel survey shows that the Manawatu RTO is a major destination for day visitors and also a significant destination for overnight visitors. In 2008 the Manawatu RTO was the fifth largest for day visitors, with 4.7% of national day visitors, and a 2.2% share of national visitor nights (the Manawatu RTO has a 3.3% share of the national population. The definition for day trips covers a trip by a person of at least 40km (one way) within New Zealand but outside their usual environment. In million day trips to the Manawatu were recorded and 1.2 million overnight visits. Distribution of Retail Activity within Palmerston North Statistics New Zealand data on retail employment is available by area unit within Palmerston North. These area units do not correspond with the Council s District Plan business zones but are still useful for understanding trends in the distribution of retail employment in Palmerston North. There are also limits to the accuracy of the business employment and location data, which is collected primarily for tax purposes. Palmerston North is divided into the following 24 area units.
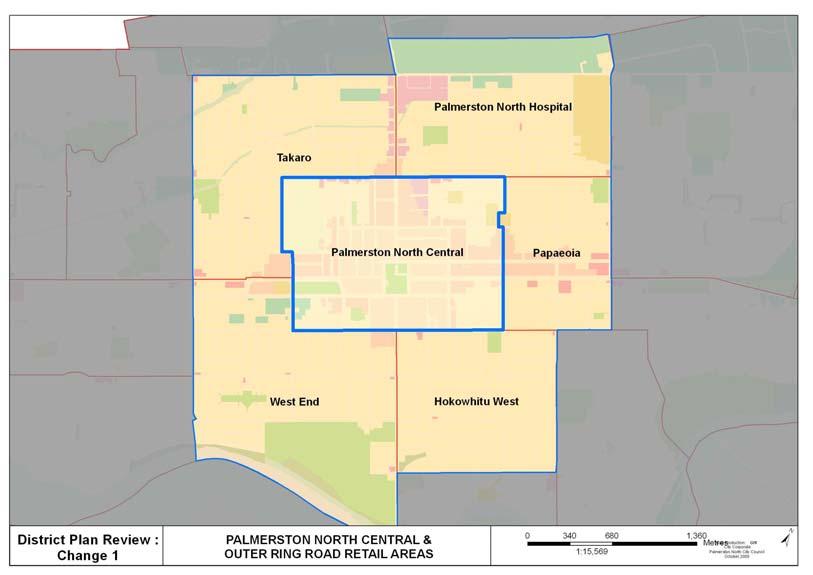
4 4 Aokautere Hokowhitu Lagoon Papaeoia Ashhurst Hokowhitu West Roslyn Awapuni North Kelvin Grove Takaro Awapuni South Linton Military Camp Terrace End Awapuni West Massey University Turitea Cloverlea Milson West End Highbury Palmerston North Central Westbrook Hokowhitu East Palmerston North Hospital Whakarongo The majority of the analysis of the distribution of retail employment focuses on: Palmerston North Central Outer Ring Road - the area units bounded by Botanical Road, Tremaine Ave, Ruahine Street, Park Road / Fitzherbert Ave / Te Awe Awe Street / Albert Street / Ferguson Street. (Palmerston North Central, Takaro, Palmerston North Hospital, Papaeoia, West End and Hokowhitu West) Peripheral Areas - the remaining city area units outside of the above zone (Aokautere, Ashhurst, Awapuni North, Awapuni South, Awapuni West, Cloverlea, Highbury, Hokowhitu East, Hokowhitu Lagoon, Kelvin Grove, Linton Military Camp, Massey University, Milson, Roslyn, Takaro, Terrace End, Turitea, West End, Westbrook and Whakarongo The Palmerston North Central area unit is bounded by Featherston, Fergusson, Cook and Victoria Streets and accounted for 15,000 jobs in February 2009, 33% of employment in the city. Retail employment is even more concentrated in Palmerston North Central, with 4,106 employees in February 2009, 49% of retail employment in the city. Employment rose by 6% between 2000 and February 2009 while citywide retail employment increased by 20%, resulting in increased dispersion of retail to outer area units of the city. Retail Trade Employment Palmerston North Central Outer Ring Road Peripheral areas Total Palmerston North Employee Count (February Employment Increase 2009 share of Retail Employment 4,106 2,120 2,159 8,385 6% 26% 52% 20% 49% 25% 26% 100% Major retail groupings and changes in the distribution of employment in the city are: 1. Motor vehicle and fuel sales and vehicle servicing In ,220 people were employed in the motor vehicle and fuel sales and vehicle servicing sector, with Palmerston North Central accounting for 29% of total city retail employment. Employment in this sector increased by 16% between 2000 and 2009, below the overall growth in retail employment of 20%. Employment in the sector in
5 5 Palmerston North Central declined by 20% between 2000 and 2009 and increased strongly on the fringes of the city. This shift in the distribution of employment was the greatest in motor vehicle retailing, with Palmerston North Central employment in motor vehicle sales declining from 230 employees in 2000 to 120 in 2009 as a result of closure of a number of car yards, particularly in Rangitikei Street. Employment at the fringe of the city increased from 0 in 2000 to 130 in Bulk format retailing This retail grouping includes supermarket and grocery stores, furniture, floor coverings, houseware and textile goods retailing, electrical and electronic goods retailing hardware, building and garden supplies retailing and department stores. Supermarkets account for over 50% of the employment in the bulk format retailing category. Department stores employment did not increase between 2000 and 2009 but strong employment growth was recorded in furniture, floor coverings, houseware and textile goods retailing, electrical and electronic goods retailing and hardware, building and garden supplies retailing. Supermarket and grocery employment increased at the same rate as overall retail employment. Total employment in the bulk format retail grouping increased by 28% between 2000 and 2009 but the increase in Palmerston North Central employment was only 5%. The strongest growth in employment was in the Peripheral area, with the transfer and expansion of hardware stores (Bunnings, Mitre 10 and Placemakers) from the Outer Ring Road and Palmerston North Central areas the main contributors to this growth. Palmerston North Central, however, still had a 62% share of total bulk format retailing employment in Accommodation Accommodation employment in Palmerston North Central accounted for just 9% of total city accommodation employment in February 2009 while the Outer Ring Road area accounted for two-thirds of employment in the sector. Employment in Palmerston North Central and the Outer Ring road area declined between 2000 and 2009 but increased in Peripheral areas. 4. Cafes, Restaurants, Takeaways, Pubs and Clubs Palmerston North Central accounted for 60% of employment in this sector in Employment increased by 325 jobs between 2000 and 2009, increasing from 956 to 1,290 jobs by 2009, while employment in the remainder of the city declined by 90 jobs. In 2000 the sector accounted for 25% of total retail employment in Palmerston North Central and by 2009 the share had increased to 31%. Total employment in the sector has not increased as quickly as other retails sectors. Weak growth in the commercial accommodation sector and a decline in tertiary student numbers of the city resulted in much weaker growth in employment in the sector compared with national data. Caveats to the location of employment data: There are limitations to the accuracy of employment data by area unit. The majority of the employment data is taken from monthly payroll tax data supplied to IRD. Large employers usually supply this data at a national level for a range of locations and the employment data is then reallocated by Statistics NZ to each area unit.
6 6 Summary of Trends 1. Palmerston North is capturing an increasing share of national retail turnover and retail employment. 2. Retail employment in the city is becoming more dispersed, with the strongest growth occurring in the fringes of the city. 3. An exception to the dispersal of retail employment is the cafes, restaurants, takeaways, pubs and clubs sector, which has experienced strong employment growth in the city centre. This is contributing to significant change in the composition of retailing in the city centre. 4. Bulk format retailing accounted for the strongest growth in retail employment in Palmerston North between 2000 and Very strong growth was recorded in: a. Furniture, Floor Coverings, Houseware and Textile Goods Retailing b. Electrical and Electronic Goods Retailing c. Hardware, Building and Garden Supplies Retailing
7 7 Industry by area unit Employee Count in February 2000 Vehicle and fuel sales and servicing Bulk Format Core retailing (included Retailing in core retailing) Cafes, Restaurants, Takeaways, Pubs, Clubs ANZSIC Accommodation Total Palmerston North City 1,055 3,450 2, ,900 6,970 Takaro Palmerston North Hospital Papaeoia West End Hokowhitu West Palmerston North Central 444 2,390 1, ,868 Botanical/Tremaine/Ruahine/Park/ Te Awe Awe Block 774 2,944 1, ,361 5,553 Outside Botanical/Tremaine /Ruahine/Park/Te Awe Awe Block ,417 Employee Count in February 2009 Palmerston North City 1,220 4,180 2, ,135 8,385 Takaro Palmerston North Hospital Papaeoia West End Hokowhitu West Palmerston North Central 357 2,620 1, ,290 4,106 Botanical/Tremaine/Ruahine/Park/ Te Awe Awe Block 753 3,375 2, ,750 6,226 Outside Botanical/Tremaine /Ruahine/Park/Te Awe Awe Block , Employee Count Increase Palmerston North City 16% 21% 28% 12% 12% 20% Takaro 24% 125% 242% 100% 0% 104% Palmerston North Hospital 17% -27% -22% -90% -12% -14% Papaeoia -13% 21% 16% -30% 83% 18% West End 29% 49% -37% 8% 300% 21% Hokowhitu West 300% 556% 150% 20% 127% Palmerston North Central -20% 10% 5% -17% 34% 6% Botanical/Tremaine/Ruahine/Park/ Te Awe Awe Block -3% 15% 8% -3% 29% 12% Outside Botanical/Tremaine /Ruahine/Park/Te Awe Awe Block 66% 59% 319% 110% -29% 52% Percentage share of sector employment in February 2009 Palmerston North City 100% 100% 100% 100% 100% 100% Takaro 14% 3% 4% 1% 2% 6% Palmerston North Hospital 11% 2% 2% 1% 10% 5% Papaeoia 3% 8% 9% 12% 8% 7% West End 4% 3% 1% 45% 1% 5% Hokowhitu West 1% 1% 0% 9% 1% 2% Palmerston North Central 29% 63% 62% 9% 60% 49% Botanical/Tremaine/Ruahine/Park/ Te Awe Awe Block 62% 81% 79% 76% 82% 74% Outside Botanical/Tremaine /Ruahine/Park/Te Awe Awe Block 38% 19% 21% 24% 18% 26% Bulk Format Retailing includes: Supermarket and Grocery Stores Furniture, Floor Coverings, Houseware and Textile Goods Retailing Electrical and Electronic Goods Retailing Hardware, Building and Garden Supplies Retailing Department Stores Note: Employment data includes the ANZSIC Retail Trade, Accommodation and Food Services and Motor Vehicle Servicing classifications
8 8
Annual Gross Domestic Product (Production Measure)
") June 2017 Executive Summary Page 2 Latest Quarter Economic Trends page 3 Economic Outlook page 4 Labour Force page 5 Retail Activity page 6 Building Activity page 7 Tourism Trends page 8 Local Authorities
June 2017 Executive Summary Page 2 Latest Quarter Economic Trends page 3 Economic Outlook page 4 Labour Force page 5 Retail Activity page 6 Building Activity page 7 Tourism Trends page 8 Local Authorities
Manawatu District Economic Profile
 Manawatu District Economic Profile Our community Population has grown by 1,000 residents since 2014 to reach 29,800. Population is 86.4% European, with Maori 14.3% of the population. This compares with
Otago Economic Overview 2013
 Final report May 2014 www.berl.co.nz Background Author(s): Mark Cox, Hugh Dixon and Masrur Alam Khan DISCLAIMER All work is done, and services rendered at the request of, and for the purposes of the client
Contents Manningham at a Glance... 6 Location and Area... 6 Manningham Activity Centres... 6 Manningham Suburbs... 6 Population... 8 Forecast... 9 For
 Contents Manningham at a Glance... 6 Location and Area... 6 Manningham Activity Centres... 6 Manningham Suburbs... 6 Population... 8 Forecast... 9 Forecast 2011 2036... 9 Population Forecast... 9 Gross
Economic Contribution of Tourism to NSW
 Economic Contribution of Tourism to NSW 2015-16 Tourism is a significant part of the NSW economy. In 2015-16, tourism contributed $38.1 billion (Tourism Consumption) to the NSW economy and employed 261,100
Hamilton s Business Economy
 Hamilton s Business Economy Growth Indicator Report August 2017 hamilton.govt.nz/growth Contents 3. Introduction 4. New Commercial and Industrial Building Consents 6. Retail 8. Employment 9. Unemployment
Produced by: Destination Research Sergi Jarques, Director
 Produced by: Destination Research Sergi Jarques, Director Economic Impact of Tourism Norfolk - 2017 Contents Page Summary Results 2 Contextual analysis 4 Volume of Tourism 7 Staying Visitors - Accommodation
NEW ZEALAND REGIONAL TOURISM FORECASTS
 NEW ZEALAND REGIONAL TOURISM FORECASTS 21-216 LAKE TAUPO RTO AUGUST 21 www.tourismresearch.govt.nz Tourism Strategy Group Ministry of Economic Development Contents Introduction 1 1. Summary for Lake Taupo
NEW ZEALAND REGIONAL TOURISM FORECASTS
 NEW ZEALAND REGIONAL TOURISM FORECASTS 21-216 NELSON RTO AUGUST 21 www.tourismresearch.govt.nz Tourism Strategy Group Ministry of Economic Development Contents Introduction 1 1. Summary for Nelson RTO
NEW ZEALAND REGIONAL TOURISM FORECASTS
 NEW ZEALAND REGIONAL TOURISM FORECASTS 21-216 ROTORUA RTO AUGUST 21 www.tourismresearch.govt.nz Tourism Strategy Group Ministry of Economic Development Contents Introduction 1 1. Summary for Rotorua RTO
NEW ZEALAND REGIONAL TOURISM FORECASTS
 NEW ZEALAND REGIONAL TOURISM FORECASTS 21-216 QUEENSTOWN RTO AUGUST 21 www.tourismresearch.govt.nz Tourism Strategy Group Ministry of Economic Development Contents Introduction 1 1. Summary for Queenstown
Produced by: Destination Research Sergi Jarques, Director
 Produced by: Destination Research Sergi Jarques, Director Economic Impact of Tourism North Norfolk District - 2016 Contents Page Summary Results 2 Contextual analysis 4 Volume of Tourism 7 Staying Visitors
Produced by: Destination Research Sergi Jarques, Director
 Produced by: Destination Research Sergi Jarques, Director Economic Impact of Tourism Norfolk - 2016 Contents Page Summary Results 2 Contextual analysis 4 Volume of Tourism 7 Staying Visitors - Accommodation
The Economic Impact of Tourism Brighton & Hove Prepared by: Tourism South East Research Unit 40 Chamberlayne Road Eastleigh Hampshire SO50 5JH
 The Economic Impact of Tourism Brighton & Hove 2013 Prepared by: Tourism South East Research Unit 40 Chamberlayne Road Eastleigh Hampshire SO50 5JH CONTENTS 1. Summary of Results 1 1.1 Introduction 1 1.2
Quick quarterly statistics
 Issue 21 tember 218 Quick quarterly statistics page 1 Economic activity quarterly page 2 Employment quarterly page 3 Household welfare quarterly page 4 Tourism activity annual page 5 Spotlight Cruise ship
Economic Contribution of Tourism to NSW
 Economic Contribution of Tourism to NSW 2013-14 Tourism is a significant part of the NSW economy. In 2013-14, tourism contributed $34.9 billion (Tourism Consumption) to the NSW economy and employed 272,000
Economic Impact Analysis. Tourism on Tasmania s King Island
 Economic Impact Analysis Tourism on Tasmania s King Island i Economic Impact Analysis Tourism on Tasmania s King Island This project has been conducted by REMPLAN Project Team Matthew Nichol Principal
Produced by: Destination Research Sergi Jarques, Director
 Produced by: Destination Research Sergi Jarques, Director Economic Impact of Tourism Oxfordshire - 2016 Economic Impact of Tourism Headline Figures Oxfordshire - 2016 number of trips (day & staying) 27,592,106
Employment Characteristics of Tourism Industries, 2011
 Employment Characteristics of Tourism Industries, 2011 Coverage: UK Date: 22 March 2013 Geographical Area: UK Theme: Labour Market Theme: People and Places Theme: Travel and Transport Theme: Economy Key
Economic Impact of Tourism in South Dakota, December 2018
 Economic Impact of Tourism in South Dakota, 2018 December 2018 1) Key Findings Growth rebounds in 2018 as a strong hunting season drives tourism growth Key facts about South Dakota s tourism sector Key
Produced by: Destination Research Sergi Jarques, Director
 Produced by: Destination Research Sergi Jarques, Director Economic Impact of Tourism Epping Forest - 2014 Economic Impact of Tourism Headline Figures Epping Forest - 2014 Total number of trips (day & staying)
Queensland Economic Update
 Queensland Economic Update Chamber of Commerce & Industry March 2018 cciq.com.au Queensland Economic Update: Summary National Accounts GDP expanded 2.3% during calendar year 2017. QLD state final demand
TRANSPORT AFFORDABILITY INDEX
 TRANSPORT AFFORDABILITY INDEX Report - December 2016 AAA 1 AAA 2 Table of contents Foreword 4 Section One Overview 6 Section Two Summary of Results 7 Section Three Detailed Results 9 Section Four City
MONTEREY COUNTY TRAVEL IMPACTS P
 MONTEREY COUNTY TRAVEL IMPACTS 1992-2015P April 2016 Prepared for the Monterey County Convention and Visitors Bureau MONTEREY COUNTY TRAVEL IMPACTS, 1992-2015P Prepared for the Monterey County Convention
Queenstown Lakes District Council. Review of District Plan Business Zones Capacity and Development of Zoning Hierarchy
 Queenstown Lakes District Council Review of District Plan Business Zones Capacity and Development of Zoning Hierarchy McDermott Miller Strategies Limited in association with Allan Planning & Research Limited
HEALTH SECTOR ECONOMIC INDICATORS REPORT
 HEALTH SECTOR ECONOMIC INDICATORS REPORT For: Mid North Coast Local Health District Report prepared by: April 2013 Table of Contents Introduction 3 Executive Summary 4 Output 5 Value-Added 7 Workforce
Queensland Economic Update
 Queensland Economic Update Chamber of Commerce & Industry January 218 cciq.com.au Queensland Economic Update: Summary Economy State Final Demand (SFD) expanded by.2% in the September 217 quarter Household
Produced by: Destination Research Sergi Jarques, Director
 Produced by: Destination Research Sergi Jarques, Director Economic Impact of Tourism Oxfordshire - 2015 Economic Impact of Tourism Headline Figures Oxfordshire - 2015 Total number of trips (day & staying)
East Lothian. Skills Assessment January SDS-1154-Jan16
 East Lothian Skills Assessment January 2016 SDS-1154-Jan16 Acknowledgement The Regional Skills Assessment Steering Group (Skills Development Scotland, Scottish Enterprise, the Scottish Funding Council
The Economic Impact of Tourism Brighton & Hove Prepared by: Tourism South East Research Unit 40 Chamberlayne Road Eastleigh Hampshire SO50 5JH
 The Economic Impact of Tourism Brighton & Hove 2014 Prepared by: Tourism South East Research Unit 40 Chamberlayne Road Eastleigh Hampshire SO50 5JH CONTENTS 1. Summary of Results 1 1.1 Introduction 1 1.2
The Economic Impact of Tourism New Forest Prepared by: Tourism South East Research Unit 40 Chamberlayne Road Eastleigh Hampshire SO50 5JH
 The Economic Impact of Tourism New Forest 2008 Prepared by: Tourism South East Research Unit 40 Chamberlayne Road Eastleigh Hampshire SO50 5JH CONTENTS Glossary of terms 1 1. Summary of Results 4 2. Table
Priority Sector Report: Experience Industries
 Priority Sector Report: Experience Industries Göran Lindqvist, Stockholm School of Economics Sergiy Protsiv, Stockholm School of Economics 17 October 2011 Deliverable D09-6 Executive summary Experience
Accommodation Survey: November 2009
 Embargoed until 10:45am 19 January 2010 Accommodation Survey: November 2009 Highlights Compared with November 2008: International guest nights were up 2 percent, while domestic guest nights were down 1
Domestic Tourism Statistics in India
 Domestic Tourism Statistics in India S V Ramana Murthy Deputy Director General Ministry of Statistics & Programme Implementation Email: svr.murthy@nic.in Presentation Sources of data Concerns Need for
Analysing the performance of New Zealand universities in the 2010 Academic Ranking of World Universities. Tertiary education occasional paper 2010/07
 Analysing the performance of New Zealand universities in the 2010 Academic Ranking of World Universities Tertiary education occasional paper 2010/07 The Tertiary Education Occasional Papers provide short
Economic Impact of Tourism. Norfolk
 Economic Impact of Tourism Norfolk - 2009 Produced by: East of England Tourism Dettingen House Dettingen Way, Bury St Edmunds Suffolk IP33 3TU Tel. 01284 727480 Contextual analysis Regional Economic Trends
Auckland City and Auckland Region s Emerging Retail Trends and Future Retail Needs Assessment
 Auckland City and Auckland Region s Emerging Retail Trends and Future Retail Needs Assessment Prepared for November 2008 Status: Final Project Name: Auckland City and Auckland Region s Emerging Retail
The Travel and Tourism Industry in Vermont. A Benchmark Study of the Economic Impact of Visitor Expenditures on the Vermont Economy 2005
 The Travel and Tourism Industry in Vermont A Benchmark Study of the Economic Impact of Visitor Expenditures on the Vermont Economy 2005 INTRODUCTION GENERAL November, 2006 This 2005 update of the original
Top & Bottom Image: Tourism Australia Cover Image: Tourism Australia Melbourne Food & Wine Festival
 Restaurant & Catering Australia (R&CA) is the national industry association representing the interests of 52,500 restaurants, cafes, catering and takeaway businesses across Australia. R&CA delivers tangible
The Economic Impact of Tourism on the District of Thanet 2011
 The Economic Impact of Tourism on the District of Thanet 2011 Prepared by: Tourism South East Research Unit 40 Chamberlayne Road Eastleigh Hampshire SO50 5JH CONTENTS 1. Summary of Results 1 2. Table of
Commissioned by: Economic Impact of Tourism. Stevenage Results. Produced by: Destination Research
 Commissioned by: Produced by: Destination Research www.destinationresearch.co.uk December 2016 Contents Page Introduction and Contextual Analysis 3 Headline Figures 5 Volume of Tourism 7 Staying Visitors
The Geography of Tourism Employment
 The Geography of Tourism Employment Coverage: UK Date: 23 November 2012 Geographical Area: European (NUTS) Theme: People and Places Theme: Labour Market Key Points There were 2.7 million persons with jobs
Business Register and Employment Survey 2016 Update Final March 2016
 Business Register and Employment Survey 2016 Update Final March 2016 Jamie.watson@coast2capital.org.uk EXECUTIVE SUMMARY The Business Register and Employment Survey (BRES) update has shown that the Coast
Economic Impact of Tourism. Hertfordshire Results. Commissioned by: Visit Herts. Produced by:
 Commissioned by: Visit Herts Produced by: Destination Research www.destinationresearch.co.uk December 2016 Contents Page Introduction and Contextual Analysis 3 Headline Figures 5 Volume of Tourism 7 Staying
Economic Impact of Tourism. Cambridgeshire 2010 Results
 Economic Impact of Tourism Cambridgeshire 2010 Results Produced by: Tourism South East Research Department 40 Chamberlayne Road, Eastleigh, Hampshire, SO50 5JH sjarques@tourismse.com http://www.tourismsoutheast.com
The Economic Impact of Tourism on Calderdale Prepared by: Tourism South East Research Unit 40 Chamberlayne Road Eastleigh Hampshire SO50 5JH
 The Economic Impact of Tourism on Calderdale 2015 Prepared by: Tourism South East Research Unit 40 Chamberlayne Road Eastleigh Hampshire SO50 5JH CONTENTS 1. Summary of Results 1 2. Table of Results Table
Regional Universities Network. Introduction. Regional Universities Network. Economic Impact of the Universities in the Regional Universities Network
 Regional Universities Network Economic Impact of the Universities in the Regional Universities Network Introduction The Regional Universities Network (RUN) is a network of six universities with headquarters
VISITOR ECONOMY STRATEGY
 ECONOMY STRATEGY WESTERN 6 6% GDP 3.5M NIGHTS 3.5m The Western Bay of Plenty subregion incorporates the Western Bay of Plenty District and Tauranga City. The Western Bay of Plenty District covers 212,000
The Economic Impact of Tourism in Hillsborough County. July 2017
 The Economic Impact of Tourism in Hillsborough County July 2017 Table of contents 1) Key Findings for 2016 3 2) Local Tourism Trends 7 3) Trends in Visits and Spending 12 4) The Domestic Market 19 5) The
Long-term Trends in Auckland s Business Demographics
 Long-term Trends in Auckland s Business Demographics Ting Huang October 2018 Technical Report 2018/024 Long-term trends in Auckland s business demographics October 2018 Technical Report 2018/024 Ting
Wyoming Travel Impacts
 Wyoming Travel Impacts 2000-2014 Wyoming Office of Tourism April 2015 Prepared for the Wyoming Office of Tourism Cheyenne, Wyoming The Economic Impact of Travel on Wyoming 2000-2014 Detailed State and
Inverness, Culloden and Suburbs Settlement Economic Overview
 Strategic planning and research Economic information December 2007 Inverness, Culloden and Suburbs Settlement Economic Overview Summary Between 2001 and 2006, the population of Inverness, Culloden and
Norfolk Island tourism industry
 Norfolk Island tourism industry Significance of tourism The tourism industry is Norfolk Island s main export and is a major driver of the Island s economy. Using expected distribution and value of tourist
Australian Casino Association ECONOMIC REPORT. Prepared for. Australian Casino Association. June Finance and Economics
 Australian Casino Association ECONOMIC REPORT Prepared for Australian Casino Association June 2004 Finance and Economics Contents Executive Summary--------------------------------------------------------------------------------------------
Accommodation Survey: February 2013
 Accommodation Survey: February 2013 Embargoed until 10:45am 11 April 2013 Key facts In February 2013, after removing seasonal variation: New Zealand guest nights rose 2.3 percent, following a fall of 4.1
Provincial Review 2016: KwaZulu-Natal KwaZulu-Natal
 Provincial Review 2016: KwaZulu-Natal KwaZulu-Natal KwaZulu-Natal has a strong role in South Africa s manufacturing and agriculture, and has its largest port and main North-South freight corridor. Its
Tourism Export Council New Zealand &
 Tourism Export Council New Zealand & Tourism Distribution Channels February 2015 Tourism Export Council who are we, what do we do? Founded 1971 Private sector 50 Inbound tour operator members (ITOs) 200
LOCAL AREA TOURISM IMPACT MODEL. Wandsworth borough report
 LOCAL AREA TOURISM IMPACT MODEL Wandsworth borough report London Development Agency May 2008 CONTENTS 1. Introduction... 3 2. Tourism in London and the UK: recent trends... 4 3. The LATI model: a brief
Tourism Satellite Account Calendar Year 2010
 The Economic Impact of Tourism in Georgia Tourism Satellite Account Calendar Year 2010 Highlights The Georgia visitor economy rebounded in 2010, recovering 98% of the losses experienced during the recession
Executive Summary. Contributions of Wyoming State Parks and Historic Sites to State and Local Economies, 2009
 Executive Summary Contributions of Wyoming State Parks and Historic Sites to State and Local Economies, 2009 Wyoming State Parks and Historic Sites hosted 2.685 million visitors in 2009. These visitors
Temecula Valley Travel Impacts
 Temecula Valley Travel Impacts 2000-2013p photo courtesy of Temecula Valley Convention and Visitors Bureau June 2014 Prepared for the Temecula Valley Convention and Visitors Bureau Temecula, California
Self Catering Holidays in England Economic Impact 2015
 Self Catering Holidays in England Economic Impact 2015 An overview of the economic impact of self catering holidays in England Published by The South West Research Company Ltd March 2017 Contents Page
ACCrlo tampendi, ngadlu Kaurna yertangga banbabanbalyarnendi (inbarendi). Kaurna meyunna yaitya mattanya Womma Tarndanyako.
. Kaurna meyunna yaitya mattanya Womma Tarndanyako.") CITY OF ADELAIDE CENSUS OF LAND USE AND EMPLOYMENT 2017 ACCrlo tampendi, ngadlu Kaurna yertangga banbabanbalyarnendi (inbarendi). Kaurna meyunna yaitya mattanya Womma Tarndanyako. Parnako yailtya, parnuko
CITY OF ADELAIDE CENSUS OF LAND USE AND EMPLOYMENT 2017 ACCrlo tampendi, ngadlu Kaurna yertangga banbabanbalyarnendi (inbarendi). Kaurna meyunna yaitya mattanya Womma Tarndanyako. Parnako yailtya, parnuko
The Economic Impact of Tourism Eastbourne Prepared by: Tourism South East Research Unit 40 Chamberlayne Road Eastleigh Hampshire SO50 5JH
 The Economic Impact of Tourism Eastbourne 2016 Prepared by: Tourism South East Research Unit 40 Chamberlayne Road Eastleigh Hampshire SO50 5JH CONTENTS Page 1. Summary of Results 1 1.1 Introduction 1 1.2
Economic Impact Assessment of the Cruise Shipping Industry in Australia, Executive Summary Cruise Down Under
 Economic Impact Assessment of the Cruise Shipping Industry in Australia, 2013-14 Executive Summary Cruise Down Under September, 2014 Disclaimer: Whilst all care and diligence have been exercised in the
Commercial Accommodation Monitor: April 2017
 Commercial Accommodation Monitor: April 2017 Hawke s Bay i Reproduction of material Material in this report may be reproduced and published, provided that it does not purport to be published under government
PREMIUM TRAFFIC MONITOR JULY 2014 KEY POINTS
 PREMIUM TRAFFIC MONITOR JULY 2014 KEY POINTS Growth in international air passengers was weak for a second consecutive month with a 2.6% increase in July compared to a year ago premium seat numbers rose
St. Austell travel to work profile
 St. Austell travel to work profile Cornwall Settlement Travel to Work Profiles 2015 1 CONTENTS Contents Introduction 1 Key findings 2 Key flows from St Austell Map 1 Main flows out - locations Chart 1
Wyoming Travel Impacts
 Wyoming Travel Impacts 2000-2013 Wyoming Office of Tourism April 2014 Prepared for the Wyoming Office of Tourism Cheyenne, Wyoming The Economic Impact of Travel on Wyoming 2000-2013 Detailed State and
Tourism Satellite Account STATISTICS NEW ZEALAND DECEMBER 2002
 Tourism Satellite Account 1997 1999 STATISTICS NEW ZEALAND DECEMBER 2002 Published in December 2002 by: Statistics New Zealand Te Tari Tatau Wellington, New Zealand Catalogue Number 16.001 ISSN 1175-530X
The Economic Impact of Tourism on Oxfordshire Estimates for 2013
 The Economic Impact of Tourism on Oxfordshire Estimates for 2013 County and District Results September 2014 Prepared by: Tourism South East Research Unit 40 Chamberlayne Road Eastleigh Hampshire SO50 5JH
The Economic Impact of Tourism on Scarborough District 2014
 The Economic Impact of Tourism on Scarborough District 2014 Prepared by: Tourism South East Research Unit 40 Chamberlayne Road Eastleigh Hampshire SO50 5JH CONTENTS 1. Summary of Results 1 2. Table of
The Economic Impact of Travel in Kansas. Tourism Satellite Account Calendar Year 2013
 The Economic Impact of Travel in Kansas Tourism Satellite Account Calendar Year 2013 Who we are Tourism Economics Union of industry expertise and economic disciplines Real world insights based on quantitative
BUSINESS BAROMETER December 2018
 Credit: Chris Orange BUSINESS BAROMETER December Credit: Nigel Moore 1 Contents Summary of findings 3 Annual monthly performance: visitor attractions..4 Visit Herts Team update 5 National context.8 Visitor
North Lanarkshire. Skills Assessment January SDS-1163-Jan16
 North Lanarkshire Skills Assessment January 2016 SDS-1163-Jan16 Acknowledgement The Regional Skills Assessment Steering Group (Skills Development Scotland, Scottish Enterprise, the Scottish Funding Council
Estimates of the Economic Importance of Tourism
 Estimates of the Economic Importance of Tourism 2008-2013 Coverage: UK Date: 03 December 2014 Geographical Area: UK Theme: People and Places Theme: Economy Theme: Travel and Transport Key Points This article
Future Economy. Future Econo. Conditions for Growth. Conditions for Growth. Growth for Business. Growth for Business. Isles of Scilly.
 Isles of Scilly Evidence Base Future Economy Future Economy Conditions for Growth Conditions for Growth Growth for Business Growth for Business Future Econo CONTENTS Introduction... 3 Economic Overview...
Quarterly Bulletin of Statistics
 Q2 QUARTERLY BULLETIN OF STATISTICS 2nd Quarter GOVERNMENT OF BERMUDA Cabinet Office Department of Statistics Quarterly Bulletin of Statistics Q2 Highlights Air Arrivals: Bermuda hosted 75,013 tourists.
The Economic Impact of West Oxfordshire s Visitor Economy 2015
 The Economic Impact of West Oxfordshire s Visitor Economy 2015 Produced on behalf of the West Oxfordshire District Council By The South West Research Company Ltd October 201 1 Contents Page Introduction
The Economic Impact of West Oxfordshire s Visitor Economy 2016
 The Economic Impact of West Oxfordshire s Visitor Economy 201 Produced on behalf of the West Oxfordshire District Council By The South West Research Company Ltd January 2018 1 Contents Page Introduction
Insight Department: Scotland The key facts on tourism in 2016
 Insight Department: Scotland The key facts on tourism in 2016 September 2017 Executive Summary & Background Information In 2016 just under 14.5 million overnight tourism trips were undertaken in Scotland.
Draft Palmerston North City Council Tourism and Visitors Strategy (TVS)
") Draft Palmerston North City Council Tourism and Visitors Strategy (TVS) Introduction and Purpose of the Strategy This strategy document has been developed to provide leadership to the agencies involved
Draft Palmerston North City Council Tourism and Visitors Strategy (TVS) Introduction and Purpose of the Strategy This strategy document has been developed to provide leadership to the agencies involved
Temecula Valley Travel Impacts p
 Temecula Valley Travel Impacts 2000-2017p photo courtesy of Temecula Valley Convention and Visitors Bureau May 2018 Prepared for the Temecula Valley Convention and Visitors Bureau Temecula, California
CHRISTCHURCH, NEW ZEALAND CITY OF OPPORTUNITY
 CHRISTCHURCH, NEW ZEALAND CITY OF OPPORTUNITY 2ND LARGEST CITY IN NZ The largest city in the south island with a population of 375,000 COMPACT & ACCESSIBLE PARKS, SHOPPING PRECINCTS, WALKING AND BIKING
CITY OF COTATI: LOCAL ECONOMIC REPORT
 EDB Sonoma County Economic Development Board Cotati Chamber of Commerce economy 2010-11 CITY OF COTATI: LOCAL ECONOMIC REPORT E c o n o m i c D e v e l o p m e n t B o a r d 4 0 1 C o l l e g e Av e n
State of the Economy St. John's Metro
 State of the Economy St. John's Metro September 2017 Published by: Economic Development, Culture & Partnerships Division Department of Community Services City of St. John's Email: business@stjohns.ca Economic
Measuring travel services and tourism in New Zealand. October 2013
 Measuring travel services and tourism in New Zealand October 2013 Outline Travel in the New Zealand economy Different measures for travel and tourism How are travel and tourism statistics compiled? Publications
Commercial Accommodation Monitor: December 2017
 Commercial Accommodation Monitor: December 2017 Queenstown i Reproduction of material Material in this report may be reproduced and published, provided that it does not purport to be published under government
International Tourism Snapshot
 International visitors to Australia Total holiday 4,447,000 5.0% 18.9-0.7% NZ 490,000-1.4% 7.5-9.4% Asia 2,292,000 8.6% 15.5-5.3% North America 496,000 4.6% 15.2-7.1% Europe 554,000 0.2% 38.5 8.3% UK 400,000
State Tourism Satellite Accounts
 State Tourism Satellite Accounts 2012 13 Acknowledgments The State Tourism Satellite Accounts series has been produced as part of a modelling program established and funded in partnership with the Australian
ANALYSIS OF THE KĀPITI COAST ECONOMY
 ANALYSIS OF THE KĀPITI COAST ECONOMY Final Report Evidence Base November 2017 CONTENTS Introduction 1 Kāpiti Coast region 2 Kāpiti Coast Economy 11 Kāpiti Coast sectors 28 kāpiti Coast Infrastructure
Activity Concept Note:
 Activity Concept Note: Summary Provide a short summary of the proposed Activity including indicative New Zealand funding level and note whether this is a New Zealandled or partner-led process. Why: Rationale
TOURISM SATELLITE ACCOUNTS : Northern Territory
 8.4% 14.2% 12.7% 10.8% TOURISM SATELLITE ACCOUNTS 2006 07: Northern Territory Thiep Van Ho, Ray Spurr, Daniel Pambudi, Peter Forsyth, Larry Dwyer and Serajul Hoque Sustainable Tourism Cooperative Research
visitor insights 2016
 visitor insights 2016 table of contents Purpose of Report 3 Surf Coast Data Regions 3 Maps 3 Executive Summary 4 Summary of Total Visitation to Surf Coast 5 Total Visitation and Visitor Nights 5 Total
Domestic VFR travel to NSW
 Domestic VFR travel to NSW Year ended December 2015 INTRODUCTION The and (VFR) market is of considerable importance to Australia and NSW. It is the second largest purpose of visit segment, after the Holiday
Commissioned by: Visit Kent. Economic Impact of Tourism. Canterbury Results. Produced by: Destination Research
 Commissioned by: Visit Kent Produced by: Destination Research www.destinationresearch.co.uk November 2016 Contents Page Introduction and Contextual Analysis 3 Headline Figures 6 Volume of Tourism 8 Staying
Presented by: Ms. Kanageswary Ramasamy Department of Statistics, Malaysia February 2017
 Presented by: Ms. Kanageswary Ramasamy Department of Statistics, Malaysia 14-16 February 2017 1 INTRODUCTION 2 HISTORICAL DEVELOPMENT OF TOURISM SATELLITE ACCOUNT 3 THE IMPORTANCE OF TOURISM SATELLITE
The Economic Impact of Gloucestershire s Visitor Economy Forest of Dean district
 The Economic Impact of Gloucestershire s Visitor Economy 201 Forest of Dean district Produced on behalf of the Wye Valley and Forest of Dean Tourism Association By The South West Research Company Ltd January
Impacts of Visitor Spending on the Local Economy: George Washington Birthplace National Monument, 2004
 Impacts of Visitor Spending on the Local Economy: George Washington Birthplace National Monument, 2004 Daniel J. Stynes Department of Community, Agriculture, Recreation and Resource Studies Michigan State
The Economic Impact of Gloucestershire s Visitor Economy Forest of Dean district
 The Economic Impact of Gloucestershire s Visitor Economy 2014 Forest of Dean district Produced on behalf of the Wye Valley and Forest of Dean Tourism Association By The South West Research Company Ltd