The Impact of Global Value Chain on APEC Major Economies Competitiveness and Industrial Structure upgrading
|
|
|
- Jocelin May
- 6 years ago
- Views:
Transcription
1 The Impact of Global Value Chain on APEC Major Economies Competitiveness and Industrial Structure upgrading Zhang Yaxiong, Yuan Jianqin Department of Economic Forecasting State Information Center (SIC) No. 58 Sanlihe Road, Beijing P.R.China
2 1 Introduction Industrial restructuring and upgrading is one of the keys to achieve sustained economic development for China and APEC main economies. China is still in a lower level in the international division, the rapid development of international trade and increased specialization degree did not bring more benefits to China Under the perspective of global value chain, the industrial upgrading based on the added value of trade in China is still in blank Current related research based on the basic of customs statistics caliber trade data, is difficult to reflect a country s position in the global value chain and the real trade benefit. Lacking of authority of quantitative models and methods to analysis current level of international division of labor and position in the global value chain for China and other APEC major economies.
3 2 Contents data and method Based on WIOD ( and 2011 ), We adopt KWW( Zhi Wang, Shang-Jin Wei,2013) method to measure industrial linkage industrial division vertical specialization and international industrial competitiveness between China and other APEC major economics,and results compared to the method based on the traditional customs diameter data Our contents and structure were referred to EU Industrial Structure Report 2013-Competing in Global Value Chains,which is under the global value chain framework to analysis the structure change industrial linkage and comparative advantage of EU industry and service. Since 2005, EU Industrial Structure Report is published by the enterprise and the industry of the European commission once every two years.
4 2 Contents data and method KWW(Koopman,Wang Zhi and Wei. 2013) (1)Domestic Value Added(DVA)-Value added in export and absorbed abroad. (2)Returned Domestic Value Added(RDV)- Value added first exported but returned home (3)Foreign Value Added(FVA)-Foreign value added in export (4)Pure Double Counted (PDC)-Pure double counted terms
5 2 Contents data and method
6 2 Contents data and method

7 3 The economic growth and industrial structure of major APEC economics Major APEC economics gained a economic stable growth from 1995 to 2011.In 1995,GDP of APEC was nearly billion dollar, accounting for 55.8% of global GDP, in 2011 increased to billion, the proportion fall to 53.8%. The United States and China is the largest two in APEC economies, accounting for 37.6% and 32.3% of APEC GDP respectively. The annual growth rate from 1.4% during up to 6.8% during China and Russia were the mainspring of APEC s economic growth. The average annual growth rate of China and Russia were 15.5% and 10.7%.
8 3 The economic growth and industrial structure of major APEC economics From the industrial prospective, service is the major impetus of APEC s economic growth, average annual growth was above 5.6%. The Manufacturing industry had showed the slowing growth, less than 3.9%. Based on OECD (1997) classification, manufacturing industries are often classified according to technological intensities: High technology, Medium-high technology, Medium-low technology, Low technology APEC S major economies manufacturing is still greatly depend on the low technology products High technology ( billion dollar, 13.7% %) Medium-high technology ( billion dollar, 28.7% %) Medium-low technology ( billion dollar, 25.8% %) Low technology products ( billion dollar, 31.8% %)
 The United States and China is the largest two in APEC economies, accounting for 32.3%and 23.9% of APEC total import and export respectively. Exports (2195.86----7666.")
9 3 The trade scale and industrial structure of major APEC economics Total import and export ( billion dollar ) The United States and China is the largest two in APEC economies, accounting for 32.3%and 23.9% of APEC total import and export respectively. Exports ( billion dollar ) Imports ( billion dollar ) Growth rate Total import and export 8.4% China 17.1%, Russia 11.6% Exports 8.1% Imports 8.6%
10 4 The production linkages of APEC major economies (1) Backward linkages America, China and Japan become the APEC major economies of the top three economies of strongest backward and forward linkages with other APEC major economies, and China ranks the first among them
11 4 The production linkages of APEC major economies (2) Forward linkage

12 5 Export of value added of APEC major economics 1 Export of value added of APEC major economics is higher than EU and Row economics, and the growth rate is higher than global Growth rate for APEC 7.6%, global 7.3%, China 16.3%,USA 5.4%, Japan 3.1% 2 China became the biggest economy of export of value added in APEC, overtaking USA and Japan, the growth is higher than other APEC economics. 3 The export rate of value added for APEC declined year by year, and for the newly industrializing economies,the rate was lower than developed and resource-based economics.


13 5 Export of value added of APEC major economics


14 5 Export of value added of APEC major economics
15 6 The participation in global value chain of APEC major economics For the participation in global value chain,we divided into forward vertical specialization (VS1) and backward vertical specialization(vs). Forward vertical specialization ratio(vs1):the proportion of a country's exports as intermediates were imported by other countries, reflecting the contribution degree of one country to other countries supply chain, Backward vertical specialization ratio (VS):the proportion of intermediate imports in a country's exports, reflecting its reliance on imported exports.

16 6 The participation in global value chain of APEC major economics During 1995 and 2011, participation degree in global value chain of APEC major economies was constantly improving both for backward and forward vertical specialization. Newly industrializing economies participated global value chain main by backward way,the backward vertical specialization ratio is higher than that of developed and resource-based economics. Taiwan Korea and Mexico are the top three economics with largest backward vertical specialization ratio in newly industrializing economies. For China also mainly by backward way to participate global value chain, both of the ratio was constantly improving. Developed and resource-based economics participated global value chain main by forward way

17 6 The participation in global value chain of APEC major economics For high technology manufacturing industry, developed and resource-based economies participate in global value chain mainly by the forward way, however the newly industrializing economies participate mainly by backward way. Japan and USA owned highest VS1 Mexico s VS ratio was much higher than that of other newly industrializing economies,up to 61.1% in 2011, and followed by South Korea and Taiwan. For above economies, VS of low technology manufacturing industry was much higher than that of high technology products. Compared with other emerging industrialized economies, China's VS was relatively low, only 28.9% in 2011, but higher than that of developed and resource-based economies.


18 6 The participation in global value chain of APEC major economics (1) The higher of export rate of value added and lower of foreign value added rate of developed and resource-based economies reflecting the upstream position in global value chain. (2) Return value added rate for developed economies was higher than that of other economies, the United States has the highest proportion, but gradually narrowing the gap with other economies.

19 6 The participation in global value chain of APEC major economics (3) From the value added prospective, emerging industrialized economies mainly export finished products, but the intermediate product export proportion is rising The proportion of foreign value added embodied in final product export of China was highest in APEC economies and higher than the proportion of foreign value added embodied in intermediate product export. However, the proportion in intermediate product export rose year by year, which reflecting China manufacturing industry is gradually upgrade, constantly climbing upstream of the value chain.

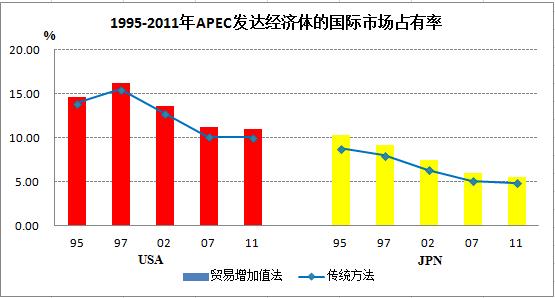
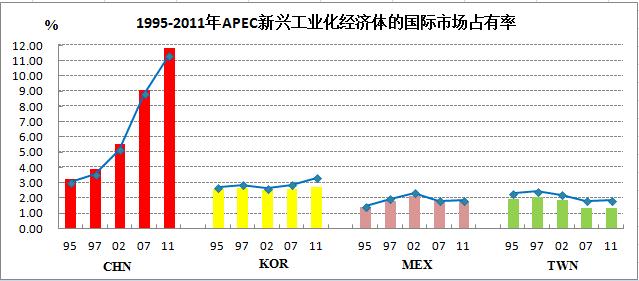
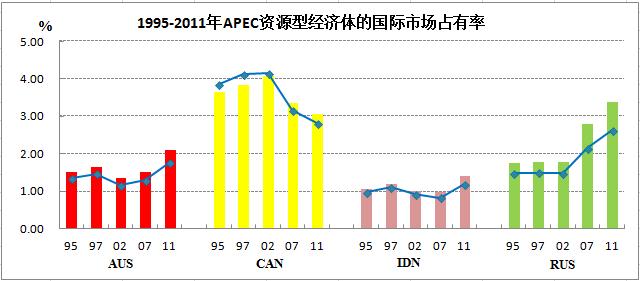
20 7 The international competitiveness comparative of APEC economics (1) APEC's international market share edged up slightly from1995 to 2011(42% %) (2) The international market share of emerging industrialized economies rose rapidly, especially for China, international market share significantly improved, and for developed and resource-based economies,the share felt. In 2011, surpassing the United States, China became the economy with the highest international market share.
21 7 The international competitiveness comparative of APEC economics

22 7 The international competitiveness comparative of APEC economics For developed economies, Japan's trade competitiveness is higher than the United States, especially in medium-high technology manufacturing industry, reflecting Japan's stronger production capacity. With weakest trade competitiveness in the APEC economics, America trade competitiveness in service was a little higher.

23 7 The international competitiveness comparative of APEC economics For emerging industrialized economies, in general, China's trade competitiveness is much higher than that of South Korea, Mexico and Taiwan, which mainly concentrated in low and middle technology manufacturing Competition of Korea, Mexico and Taiwan generally was lower than China, but the trade competitiveness of high technology manufacturing industry was higher than that of China. In resource-based economics, Russia s trade competitiveness rank first in the whole APEC.
24 8 Conclusion There are many differences between APEC's major economies in the added value trade. Newly industrializing economies participated global value chain main by backward way, developed and resource-based economics participated global value chain main by forward way The developed economics such as United States and Japan were at upstream of global value chain, China was at the downstream of the global value chain, but constantly upgrading for manufacturing. The international competitiveness had been enhanced for APEC in

25
Benchmarking Travel & Tourism in United Arab Emirates
 Benchmarking Travel & Tourism in United Arab Emirates How does Travel & Tourism compare to other sectors? Summary of Findings, November 2013 Sponsored by: Outline Introduction... 3 UAE summary...... 8
Benchmarking Travel & Tourism in Russia
 Benchmarking Travel & Tourism in Russia How does Travel & Tourism compare to other sectors? Sponsored by: Summary of Findings, November 2013 Outline Introduction... 3 Russia summary..... 8 Data sources
Benchmarking Travel & Tourism in Colombia
 Benchmarking Travel & Tourism in Colombia How does Travel & Tourism compare to other sectors? Summary of Findings, November 2013 Sponsored by: Outline Introduction... 3 Colombia summary..... 8 Data sources
Mexico. How does Travel & Tourism compare to other sectors? GDP. Size. Share. Mexico GDP Impact by Industry. Mexico GDP Impact by Industry
 Mexico Chapultepec Castle in Mexico City Agriculture Automotive Manufacturing Banking Chemicals Manufacturing Communications Education Financial Services Mining Other Service Exports Retail (without wholesale)
Textile Per Capita Consumption
 January 2018 Textile Per Capita Consumption 2005-2022 Part 2: Upper middle income countries - - CHF500.- Table of Contents Preface... 4 Sources... 5 Definitions... 6 Charts... 7 Executive Summary... 10
United Kingdom. How does Travel & Tourism compare to other sectors? GDP. Size. Share. UK GDP Impact by Industry. UK GDP Impact by Industry
 United Kingdom Stonehenge in Wiltshire Agriculture Automotive Banking Chemicals Communications Education Financial Mining Other Service Manufacturing Manufacturing Services Exports Retail (without wholesale)
Inbound Tourism Prague, 2014 Overall Assessment
 Inbound Tourism Prague, 2014 Overall Assessment Facts and Figures: Total visitors: 6,096,015 foreign: 5,315,054 (87.2%) domestic: 780,961 (12.8%) Total visitor growth in Prague: 3.3% foreign growth: 5.3%
Benchmarking Travel & Tourism in Australia
 Benchmarking Travel & Tourism in Australia How does Travel & Tourism compare to other sectors? Sponsored by: Summary of Findings, November 2013 Outline Introduction... 3 Australia summary..... 8 Data sources
23rd SEOUL BUILD. Organized by Co-Organized by Supported by. Overseas Cooperation. Exhibit Profile. Highlight Sector. Constek Remodeling Greenbuilding
 23rd SEOUL BUILD Organized by Co-Organized by Supported by Overseas Cooperation Exhibit Profile Highlight Sector Constek Remodeling Greenbuilding / / / / / / / / 2015 Your Next Destination, KOREA! South
JUNE 2017 AUCKLAND ECONOMIC INSIGHTS SERIES ENGAGING GLOBALLY AUCKLAND S TRADING LINKAGES. aucklandnz.com/business nzier.org.nz
 AUCKLAND ECONOMIC INSIGHTS SERIES ENGAGING GLOBALLY AUCKLAND S TRADING LINKAGES aucklandnz.com/business nzier.org.nz JUNE 2017 4 AUCKLAND ECONOMIC INSIGHTS SERIES 1 2 3 4 Advanced Industries Auckland s
NBAA 2014 Business Aviation Market Update. October 2014
 NBAA 2014 Business Aviation Market Update October 2014 1 Jefferies Global Industrials Conference - August 14, 2014 Forward Looking Statements This report contains forward-looking statements within the
III. TRADE IN COMMERCIAL SERVICES BY CATEGORY
 .. TRADE IN COMMERCIAL SERVICES BY CATEGORY Transportation services China records impressive growth Exports of world transportation services reached $750 billion in 2007, an increase of 19 per cent, following
Alianza del Pacífico. October, Germán Ríos May 2012
 Alianza del Pacífico October, 2011 Germán Ríos May 2012 Table of Contents The integration process in Latin America The future is Asia Latin America and Alianza del Pacífico The integration process in Latin
APEC. in Charts 2016 POLICY SUPPORT UNIT
 APEC in Charts 2016 POLICY SUPPORT UNIT Asia-Pacific Economic Cooperation (APEC) was established in 1989. The 21 Member Economies are Australia; Brunei Darussalam; Canada; Chile; China; Hong Kong, China;
IATA ECONOMIC BRIEFING DECEMBER 2008
 ECONOMIC BRIEFING DECEMBER 28 THE IMPACT OF RECESSION ON AIR TRAFFIC VOLUMES Recession is now forecast for North America, Europe and Japan late this year and into 29. The last major downturn in air traffic,
A blue economy for the sustainable development of the Mediterranean region: tourism and recreational activities
 A blue economy for the sustainable development of the Mediterranean region: tourism and recreational activities Alain Dupeyras Head of Tourism, OECD Alain.Dupeyras@oecd.org OECD s integrated approach to
China s Western Development Drive: from the Perspective of Inclusive Growth
 China s Western Development Drive: from the Perspective of Inclusive Growth WEI Houkai Prof. and Deputy Director Institute for Urban and Environmental Studies Chinese Academy of Social Sciences 2010-12-10
Tourism Satellite Account Calendar Year 2010
 The Economic Impact of Tourism in Georgia Tourism Satellite Account Calendar Year 2010 Highlights The Georgia visitor economy rebounded in 2010, recovering 98% of the losses experienced during the recession
AOC 2017AOC 2017AOC. Robert Johansson Chief Economist US Department of Agriculture Beijing, China (April 2017)
") http://wcfcourier.com/article_db152199-d2de-5455-ac-b643ba6a1c8f.html U.S. AGRICULTURAL OUTLOOK 17 AND LONGER-TERM PROJECTIONS AOC 17AOC 17AOC AOC 17AOC 17AOC Robert Johansson AOC 17AOC 17AOC Chief Economist
http://wcfcourier.com/article_db152199-d2de-5455-ac-b643ba6a1c8f.html U.S. AGRICULTURAL OUTLOOK 17 AND LONGER-TERM PROJECTIONS AOC 17AOC 17AOC AOC 17AOC 17AOC Robert Johansson AOC 17AOC 17AOC Chief Economist
Economic Impact of Tourism in Hillsborough County September 2016
 Economic Impact of Tourism in Hillsborough County - 2015 September 2016 Key findings for 2015 Almost 22 million people visited Hillsborough County in 2015. Visits to Hillsborough County increased 4.5%
Global and China Chitin And Chitosan Industry 2014 Market Research Report
 2014 QY Research Reports Global and China Chitin And Chitosan Industry 2014 Market Research Report QY Research Reports included market size, share & analysis trends on Global and China Chitin And Chitosan
Fostering Sustainable, Innovative and Inclusive Growth
 216/ISOM/SYM/9 Session II Fostering Sustainable, Innovative and Inclusive Growth Submitted by: Policy Support Unit, APEC Secretariat Symposium on Priorities for APEC 217 Ha Noi, Viet Nam 8 December 216
ECOFORUM [Volume 7, Issue 3(16), 2018] INTRODUCTION OF BEIJING CULTURAL TOURISM DEVELOPMENT
![ECOFORUM [Volume 7, Issue 3(16), 2018] INTRODUCTION OF BEIJING CULTURAL TOURISM DEVELOPMENT](/thumbs/87/96615192.jpg "ECOFORUM [Volume 7, Issue 3(16), 2018] INTRODUCTION OF BEIJING CULTURAL TOURISM DEVELOPMENT") INTRODUCTION OF BEIJING CULTURAL TOURISM DEVELOPMENT Yuyan PAN Stefan cel Mare University of Suceava, Romania panyuyan423@163.com Alexandru-Mircea NEDELEA Stefan cel Mare University of Suceava, Romania
INTRODUCTION OF BEIJING CULTURAL TOURISM DEVELOPMENT Yuyan PAN Stefan cel Mare University of Suceava, Romania panyuyan423@163.com Alexandru-Mircea NEDELEA Stefan cel Mare University of Suceava, Romania
A rising ELICOS tide lifts all international education ships. So how do we navigate for future success?
 A rising ELICOS tide lifts all international education ships. So how do we navigate for future success? Brett Blacker English Australia AIEC 2015 1 The rising tide. Global context Data and trends Policy
More information at
 Report Information More information at https://www.htfmarketreport.com/reports/1266534 Global Flight Control Computer Market Research Report 2018 Report Code: HTF1266534 Pages: 91 Price: 1-User PDF : $
IATA ECONOMIC BRIEFING FEBRUARY 2007
 IATA ECONOMIC BRIEFING FEBRUARY 27 NEW AIRCRAFT ORDERS KEY POINTS New aircraft orders remained very high in 26. The total of 1,834 new orders for Boeing and Airbus commercial planes was down slightly from
Economic Impact of Tourism in South Dakota, December 2018
 Economic Impact of Tourism in South Dakota, 2018 December 2018 1) Key Findings Growth rebounds in 2018 as a strong hunting season drives tourism growth Key facts about South Dakota s tourism sector Key
The Economic Impact of Tourism in North Carolina. Tourism Satellite Account Calendar Year 2015
 The Economic Impact of Tourism in North Carolina Tourism Satellite Account Calendar Year 2015 Key results 2 Total tourism demand tallied $28.3 billion in 2015, expanding 3.6%. This marks another new high
SHIP MANAGEMENT SURVEY. July December 2017
 SHIP MANAGEMENT SURVEY July December 2017 INTRODUCTION The Ship Management Survey is conducted by the Statistics Department of the Central Bank of Cyprus and concentrates primarily on transactions between
Outlook for air travel markets
 Outlook for air travel markets June 2016 Brian Pearce Chief Economist International Air Transport Association Extended period of strong air travel market growth 30% 25% 20% 15% 10% 5% 0% -5% -10% -15%
Fiji s Tourism Satellite Accounts
 Asia-Pacific Economic Statistics Week Bangkok 2 4 May 2016 Fiji s Tourism Satellite Accounts Mr. Bimlesh Krishna Divisional Manager Economic Statistics Fiji s Tourism Satellite Introduction The Tourism
Finding Rationality in an Irrational World: The Economics of Successful Hotel Negotiations
 Finding Rationality in an Irrational World: The Economics of Successful Hotel Negotiations Isaac Collazo, Vice President, Performance Strategy & Planning, InterContinental Hotels Group (IHG) Maria Lowry,
Dubai Airshow 2013 Business Aviation Market Update
 Dubai Airshow 2013 Business Aviation Market Update Rob Wilson, President, Business & General Aviation MEBAA General Assembly November, 2013 2013 Business Aviation Outlook 27th year of survey, 22nd public
AIR TRANSPORT MARKET ANALYSIS JULY 2011
 AIR TRANSPORT MARKET ANALYSIS JULY 2011 KEY POINTS Despite an increasingly gloomy economic outlook, air travel continued to expand at a pace close to trend in July, to a level 5.9% higher than a year earlier.
Aviation Performance in NSW
 Aviation Performance in NSW 2017-18 This report by Tourism Futures International for Destination New South Wales reviews the operating environment and aviation performance of Sydney and NSW over 2017 and
THAILAND HOW DOES TRAVEL & TOURISM COMPARE TO OTHER SECTORS? BENCHMARK REPORT THAILAND 1 SPONSORS OF BENCHMARKING REPORT 2017
 THAILAND AGRICULTURE AUTOMOTIVE MANUFACTURING BANKING CHEMICALS MANUFACTURING COMMUNICATIONS CONSTRUCTION FINANCIAL SERVICES MINING OTHER SERVICE EXPORTS RETAIL (WITHOUT WHOLESALE) TOTAL ECONOMY TRAVEL
Travel & Tourism Sector Ranking South Korea
 Travel & Tourism Sector Ranking South Korea Summary of Findings, November 2013 Introduction Sector Ranking Analysis In order to better understand the importance of the Travel & Tourism industry in a global
Economic Benefits of Air Transport in El Salvador
 Economic Benefits of Air Transport in El Salvador Economic Benefits of Air Transport in El Salvador Acknowledgements Oxford Economics acknowledges the assistance from the International Air Transport Association
Houston Economic Update. Presented by Patrick Jankowski Vice President, Research Greater Houston Partnership
 Houston Economic Update Presented by Patrick Jankowski Vice President, Research Greater Houston Partnership Houston Astros - Percent Regular Season Games Won Help from the bullpen this year Help from the
U.S. Travel and Tourism Report
 2014/TWG44/010 Agenda Item: 18 U.S. Travel and Tourism Report Purpose: Information Submitted by: United States 44 th Tourism Working Group Meeting Cusco, Peru 9-10 April 2014 U.S. Travel and Tourism Report
China Fact Sheet Targets (Rev. Aug 2013)
") China Overview Hawai i Tourism China will be represented by Travel Link Marketing (TLM) beginning January. TLM was established in 2005 with its offices in Beijing, Shanghai, Guangzhou and Chengdu. We look
China Overview Hawai i Tourism China will be represented by Travel Link Marketing (TLM) beginning January. TLM was established in 2005 with its offices in Beijing, Shanghai, Guangzhou and Chengdu. We look
1.0 Introduction Zambia s Major Trading Partners Zambia s Major Export Markets... 4
 Bank of Zambia CONTENTS 1.0 Introduction... 3 2.0 Zambia s Major Trading Partners... 3 3.0 Zambia s Major Export Markets... 4 4.0 Major Source Countries Of Zambia s Imports... 5 5.0 Direction Of Trade
The Development of International Trade: The Future Aim of Macedonia
 The Development of International Trade: The Future Aim of Macedonia PhD Nasir SELIMI Business and Economics Faculty, South East European University, lindenska nn, 1200 Tetovo, Republic of Macedonia E-mail:
Land area 1.73 million km 2 Queensland population (as at 31 December 2017) Brisbane population* (preliminary estimate as at 30 June 2017)
 Brisbane population* (preliminary estimate as at 30 June 2017)") Queensland - 11 Queensland OVERVIEW Queensland is nearly five times the size of Japan, seven times the size of Great Britain, and two and a half times the size of Texas. Queensland is Australia s second
Queensland - 11 Queensland OVERVIEW Queensland is nearly five times the size of Japan, seven times the size of Great Britain, and two and a half times the size of Texas. Queensland is Australia s second
SHIP MANAGEMENT SURVEY* July December 2015
 SHIP MANAGEMENT SURVEY* July December 2015 1. SHIP MANAGEMENT REVENUES FROM NON- RESIDENTS Ship management revenues dropped marginally to 462 million, following a decline in global shipping markets. Germany
Development & Opportunity of China s Tourism Market. Macao Dec Yao Yuecan/CITS HO
 Development & Opportunity of China s Tourism Market Macao Dec.1. 2008 Yao Yuecan/CITS HO 1 Topics 1 Status Quo of Development of China s Tourism 2 Olympics Improves Image of China s Tourism 3 The World
Land area 1.73 million km 2 Queensland population (as at December 2016) Brisbane population* (preliminary estimate as at 30 June 2016)
 Brisbane population* (preliminary estimate as at 30 June 2016)") Queensland - 11 Queensland OVERVIEW Queensland is nearly five times the size of Japan, seven times the size of Great Britain, and two and a half times the size of Texas. Queensland is Australia s second
Queensland - 11 Queensland OVERVIEW Queensland is nearly five times the size of Japan, seven times the size of Great Britain, and two and a half times the size of Texas. Queensland is Australia s second
Concrete Visions for a Multi-Level Governance, 7-8 December Paper for the Workshop Local Governance in a Global Era In Search of
 Paper for the Workshop Local Governance in a Global Era In Search of Concrete Visions for a Multi-Level Governance, 7-8 December 2001 None of these papers should be cited without the author s permission.
WORLD TRADE ORGANIZATION
 WORLD TRADE ORGANIZATION Trade Policy Review Body RESTRICTED 1 October 2007 (07-3988) Original: English TRADE POLICY REVIEW Report by SAINT KITTS AND NEVIS Pursuant to the Agreement Establishing the Trade
Economic Benefits of Air Transport in Nicaragua
 Economic Benefits of Air Transport in Nicaragua Economic Benefits of Air Transport in Nicaragua Acknowledgements Oxford Economics acknowledges the assistance from the International Air Transport Association
III. TRADE IN COMMERCIAL SERVICES BY CATEGORY
 .. TRADE IN COMMERCIAL SERVICES BY CATEGORY Transportation services China records impressive growth of world transportation services reached $750 billion in 2007, an increase of 19 per cent, following
The Economic Impact of Tourism on Guam. Tourism Satellite Account Calendar Year 2016
 The Economic Impact of Tourism on Guam Tourism Satellite Account Calendar Year 2016 Highlights! 2016 was a banner year for tourism on Guam, with visitation to Guam surpassing 1.5 million and visitor spending
Airlines across the world connected a record number of cities this year, with more than 20,000 city pair connections*
 1 Airlines across the world connected a record number of cities this year, with more than 20,000 city pair connections*. This is a 1,351 increase over 2016 and a doubling of service since 1996, when there
Travel & Tourism Sector Ranking United Kingdom. Summary of Findings, November 2013
 Travel & Tourism Sector Ranking United Kingdom Summary of Findings, November 2013 Introduction Sector Ranking Analysis In order to better understand the importance of the Travel & Tourism industry in a
NBAA 2015 MARKET UPDATE
 NBAA 2015 MARKET UPDATE November 2015 Forward-Looking Statements 2 This report contains forward-looking statements within the meaning of Section 21E of the Securities Exchange Act of 1934. All statements,
Economic Impact of Tourism in South Dakota, December 2017
 Economic Impact of Tourism in South Dakota, 2017 December 2017 1) Key findings 1) Growth continues in 2017 but pales against the event driven years of 2015 and 2016 in South Dakota Key facts about South
Foreign Overnights in Finland 2016
 Foreign Overnights in Finland 2016 June 14, 2017 First name Last name 2 Positive outlook for Finland growing flows of visitors from several markets FOREIGN OVERNIGHTS 2016 5.8 million +4.7% growth 2016
Tourism Snapshot. June 2015 Volume 11, Issue 6. A focus on the markets in which Destination Canada (DC) and its partners are active.
 and its partners are active.") Tourism Snapshot Tourism PEI / Paul Baglole A focus on the markets in which Destination Canada (DC) and its partners are active. www.destinationcanada.com June Volume 11, Issue 6 Key highlights Over the
Tourism Snapshot Tourism PEI / Paul Baglole A focus on the markets in which Destination Canada (DC) and its partners are active. www.destinationcanada.com June Volume 11, Issue 6 Key highlights Over the
Example report: numbers are for illustration purposes only
 www.iata.org/pax-forecast Example report: numbers are for illustration purposes only Country Report - United States Page Table of Contents 1 Market Overview 2 Top Country Pairs 3 Annual Market Regional
Presentation Supplemental Charts: Relative Comparison of APEC Economies
 Presentation Supplemental Charts: 1 BORDER MARKET Enabling Trade Index Framework The World Economic Forum has published The Global Enabling Trade Report, containing the Enabling Trade Index (ETI), on an
Asia-Pacific Trade Briefs: New Zealand
 i Asia-Pacific Trade Briefs: New Zealand Merchandise Trade New Zealand has a trade-to-gdp ratio of 51.96%. Merchandise trade accounted for 73.1% of New Zealand's total trade in 2017. New Zealand's merchandise
Land area 1.73 million km 2 Queensland population (December 2015) Brisbane population* (June 2015)
 Brisbane population* (June 2015)") Queensland - 18 Queensland OVERVIEW Queensland is nearly five times the size of Japan, seven times the size of Great Britain, and two and a half times the size of Texas. Queensland is Australia s second
Queensland - 18 Queensland OVERVIEW Queensland is nearly five times the size of Japan, seven times the size of Great Britain, and two and a half times the size of Texas. Queensland is Australia s second
Beijing North China Overview
 Beijing North China Overview Capital city of China with a population of 22 million. Amongst the most developed cities and economic centers in China. GDP of 405 billion USD in 2016; per capita GDP is 2.2
The Nordic Countries in an International Comparison. Helga Kristjánsdóttir 20. apríl 2012
 The Nordic Countries in an International Comparison Helga Kristjánsdóttir 20. apríl 2012 15 Figure 1. World Bank, GDP growth (annual %) 10 5 0 1961 1963 1965 1967 1969 1971 1973 1975 1977 1979 1981 1983
Global economy and aviation do we have room to grow?
 Global economy and aviation do we have room to grow? 18 January 2017 Brian Pearce Chief Economist, IATA Airline Industry Economics Advisory Workshop 2016 1 Room to grow? Looking through the cycle Potential
Economic Benefits of Air Transport in Panama
 Economic Benefits of Air Transport in Panama Economic Benefits of Air Transport in Panama Acknowledgements Oxford Economics acknowledges the assistance from the International Air Transport Association
Economic Benefits of Air Transport in Belize
 Economic Benefits of Air Transport in Belize Economic Benefits of Air Transport in Belize Acknowledgements Oxford Economics acknowledges the assistance from the International Air Transport Association
China Tourism Industry Report, Aug. 2011
 China Tourism Industry Report, 2011 Aug. 2011 This report Analyzes the operation of China tourism industry and market segments. Focuses on the travel agencies and hotels in China. Highlights the key enterprises
Tourism Snapshot A Monthly Monitor of the Performance of Canada s Tourism Industry
 Tourism Snapshot A Monthly Monitor of the Performance of Canada s Tourism Industry December 2015 Volume 11, Issue 12 www.destinationcanada.com Tourism Snapshot December 2015 1 2 Tourism Snapshot December
MARKET REPORT. CHINA: Hotels Deals Signing (International Midscale & Above Brands 2017)
") MARKET REPORT CHINA: Hotels Deals Signing (International Midscale & Above Brands 2017) APRIL 2018 Midscale brands continued to boost the hotel pipeline in China Historical Change of Hotel Deals Signed,
MARKET REPORT CHINA: Hotels Deals Signing (International Midscale & Above Brands 2017) APRIL 2018 Midscale brands continued to boost the hotel pipeline in China Historical Change of Hotel Deals Signed,
% change vs. Dec ALL VISITS (000) 2,410 12% 7,550 5% 31,148 1% Spend ( million) 1,490 15% 4,370-1% 18,710 4%
 2,410 12% 7,550 5% 31,148 1% Spend ( million) 1,490 15% 4,370-1% 18,710 4%") HEADLINES FULL YEAR 2012 (PROVISIONAL) 1 Overall visits 31.148 million visits making 2012 the best year for inbound tourism since 2008 but not a record. 1% increase in visits on 2011 (30.798 visits) slightly
HEADLINES FULL YEAR 2012 (PROVISIONAL) 1 Overall visits 31.148 million visits making 2012 the best year for inbound tourism since 2008 but not a record. 1% increase in visits on 2011 (30.798 visits) slightly
AIR PASSENGER MARKET ANALYSIS
 Monthly RPK (Billions) Monthly FTK (Billions) Index of business confidence % change over year AIR PASSENGER MARKET ANALYSIS NOVEMBER 2013 KEY POINTS Air travel markets increased at a solid rate in November,
The Economic Impact of Tourism in Hillsborough County, June 2018
 The Economic Impact of Tourism in Hillsborough County, 2017 June 2018 Table of contents 1) Key Findings for 2017 3 2) Local Tourism Trends 7 3) Trends in Visits and Spending 12 4) The Domestic Market 19
Analysis of the impact of tourism e-commerce on the development of China's tourism industry
 9th International Economics, Management and Education Technology Conference (IEMETC 2017) Analysis of the impact of tourism e-commerce on the development of China's tourism industry Meng Ying Marketing
1.0 Introduction Zambia s Major Trading Partners Zambia s Major Export Markets... 4
 Bank of Zambia CONTENTS 1.0 Introduction... 3 2.0 Zambia s Major Trading Partners... 3 3.0 Zambia s Major Export Markets... 4 4.0 Major Source Countries Of Zambia s Imports... 5 5.0 Direction Of Trade
The Economic Impact of Tourism in North Carolina. Tourism Satellite Account Calendar Year 2013
 The Economic Impact of Tourism in North Carolina Tourism Satellite Account Calendar Year 2013 Key results 2 Total tourism demand tallied $26 billion in 2013, expanding 3.9%. This marks another new high
EU Report. Europe JANUARY 2017
 H EU Report Europe JANUARY 2017 ANALYSIS OF HOTEL RESULTS JANUARY 2017 Overall improvement in the European hospitality industry The European industry starts the year on a positive note, with indicators
BRAZIL INTERNATIONAL INBOUND TRAVEL MARKET PROFILE (2011) Copyright 2012 by the U.S. Travel Association. All Rights Reserved.
 Copyright 2012 by the U.S. Travel Association. All Rights Reserved.") BRAZIL INTERNATIONAL INBOUND TRAVEL MARKET PROFILE (211) Copyright 212 by the U.S. Travel Association. All Rights Reserved. EXECUTIVE SUMMARY With a population of nearly 2 million and a GDP exceeding $2
BRAZIL INTERNATIONAL INBOUND TRAVEL MARKET PROFILE (211) Copyright 212 by the U.S. Travel Association. All Rights Reserved. EXECUTIVE SUMMARY With a population of nearly 2 million and a GDP exceeding $2
APEC CHILE 2019: CONNECTING PEOPLE, BUILDING THE FUTURE
 APEC CHILE 2019: CONNECTING PEOPLE, BUILDING THE FUTURE RODRIGO YÁÑEZ Vice MinisterofTradeofChile SOM ChairAPEC Chile 2019 Santiago, August 2018 CHILE S TRADE POLICY: OBJECTIVES To achieve international
1.0 Introduction Zambia s Major Trading Partners Zambia s Major Export Markets... 4
 Bank of Zambia CONTENTS 1.0 Introduction... 3 2.0 Zambia s Major Trading Partners... 3 3.0 Zambia s Major Export Markets... 4 4.0 Major Source Countries Of Zambia s Imports... 5 5.0 Direction Of Trade
Contribution from UNCTAD dated: 29 June 2010
 Report of the UN Secretary-General: Necessity of ending the economic, commercial and financial embargo imposed by the United States of America against Cuba (A/65/83) Contribution from UNCTAD dated: 29
Buffalo and New York City Since the Great Recession
 Buffalo and New York City Since the Great Recession for the Workshop on Economic Restructuring in the Rust Belt, Buffalo New York Cornell University Worker Institute James A. Parrott, Dir., Economic &
III. TRADE IN COMMERCIAL SERVICES BY CATEGORY
 . TRADE IN COMMERCIAL SERVICES BY CATEGORY The Highlights Transportation services Rising seaborne trade and air traffic contribute to the increase of transportation services trade In a context of rising
Song Rui Tourism Research Center, Chinese Academy of Social Sciences March 7, 2018, Berlin
 Report on World Tourism Economy Trends (2018) Song Rui Tourism Research Center, Chinese Academy of Social Sciences March 7, 2018, Berlin TREND I Fast and comprehensive growth of the global tourism economy
Index of business confidence. Monthly FTK (Billions) Sep 2013 vs. Sep 2012 YTD 2013 vs. YTD 2012 Sep 2013 vs. Aug 2013
 Sep 2013 vs. Sep 2012 YTD 2013 vs. YTD 2012 Sep 2013 vs. Aug 2013") AIR PASSENGER MARKET ANALYSIS SEPTEMBER 2013 KEY POINTS Air travel markets expanded at a solid rate in September. Global revenue passenger kilometers were up 5.5% compared to a year ago. This is a slight
AIR PASSENGER MARKET ANALYSIS SEPTEMBER 2013 KEY POINTS Air travel markets expanded at a solid rate in September. Global revenue passenger kilometers were up 5.5% compared to a year ago. This is a slight
Investing in the Region s Airline
 Investing in the Region s Airline A Jet Airways Perspective Wolfgang Prock-Schauer Jet Airways BOM, 20 th Jun 05 Table of Contents Geopolitical and Macroeconomics Trends in India Aviation Vision vs Ground
The Economic Impact of Tourism in Walworth County, Wisconsin. July 2013
 The Economic Impact of Tourism in Walworth County, Wisconsin July 2013 Key themes for 2012 The Walworth County, Wisconsin visitor economy continued its brisk growth in 2012. Visitor spending rose 11% after
Study on the Consumption of Agritourism in China
 2016 Joint International Conference on Service Science, Management and Engineering (SSME 2016) and International Conference on Information Science and Technology (IST 2016) ISBN: 978-1-60595-379-3 Study
AIR TRANSPORT MARKET ANALYSIS MAY 2011
 AIR TRANSPORT MARKET ANALYSIS MAY 2011 KEY POINTS May saw a renewed expansion in both air travel and freight, after a soft patch during the previous three months. Air travel volumes were 6.8% higher than
Liberation of tourism and travel-related (T&T) services in Thailand and Its impact
 services in Thailand and Its impact") Liberation of tourism and travel-related (T&T) services in Thailand and Its impact BY WA L A I L A K N OY PAYA K, P H D E X E C U T I V E D I R E C TO R, A S E A N, S O U T H A S I A, A N D O C E A N I
Liberation of tourism and travel-related (T&T) services in Thailand and Its impact BY WA L A I L A K N OY PAYA K, P H D E X E C U T I V E D I R E C TO R, A S E A N, S O U T H A S I A, A N D O C E A N I
The Economic Impact of Tourism in Jacksonville, FL. June 2016
 The Economic Impact of Tourism in Jacksonville, FL June 2016 Highlights Visitor spending surpassed $2.0 billion in 2015, growing 4.4%. As this money flowed through Duval County, the $2.0 billion in visitor
COFFS HARBOUR MARKETSNAPSHOT
 MARKETSNAPSHOT NEW SOUTH WALES The Mid North Coast region is ranked fourth in Australia for business confidence with its regional economy growing at a healthy 4.1% p.a. and produces an annual Gross Regional
Is NYC coming back sooner than we think?
 Research Is NYC coming back sooner than we think? 23 AUGUST 2016 7:26 AM New York City and its Manhattan submarket could rebound sooner than expected with the amount of foreign capital coming in and a
AIR PASSENGER MARKET ANALYSIS JULY 2015 KEY POINTS
 AIR PASSENGER MARKET ANALYSIS JULY 2015 KEY POINTS Global air travel rose 8.2% in July compared to a year ago, partly reflecting an upward bias due to the timing of Ramadan. But even after controlling
AIR PASSENGER MARKET ANALYSIS
 AIR PASSENGER MARKET ANALYSIS OCTOBER 2014 KEY POINTS Air travel volumes were up 5.7% in October year-on-year, slightly stronger than the September rise of 5.2%, and a continuation of the positive growth
INDIA OUTBOUND TRAVEL TRENDS DEEPIKA SACHDEV Embassy of Iceland, New Delhi, India November, 2018
 INDIA OUTBOUND TRAVEL TRENDS 2018 DEEPIKA SACHDEV Embassy of Iceland, New Delhi, India November, 2018 India India An Emerging Power Population 1.33 Billion ( 2 out of every 10 people in the World are Indian)
From: OECD Tourism Trends and Policies Access the complete publication at: Japan
 From: OECD Tourism Trends and Policies 2014 Access the complete publication at: http://dx.doi.org/10.1787/tour-2014-en Japan Please cite this chapter as: OECD (2014), Japan, in OECD Tourism Trends and
1. FORECAST VISITATION FOR GREAT OCEAN ROAD
 1. FORECAST VISITATION FOR GREAT OCEAN ROAD 1.1. INTRODUCTION This section provides a 20-year forecast of visitation to the Great Ocean Road Region, modelled from Australian Tourism Forecast Committee
ERA Monthly Market Analysis
 ERA Monthly Market Analysis May 2016 Introduction For the production of these statistics in the following report, ERA has teamed up with partners Seabury and Innovata to provide a comprehensive analysis
The Global Competitiveness of the U.S. Aviation Industry: Addressing Competition Issues to Maintain U.S. leadership in the Aerospace Market
 121 North Henry Street Alexandria, VA 22314-2903 T: 703 739 9543 F: 703 739 9488 arsa@arsa.org www.arsa.org The Global Competitiveness of the U.S. Aviation Industry: Addressing Competition Issues to Maintain