Asia-Pacific Trade Briefs: New Zealand
|
|
|
- Howard Lester
- 5 years ago
- Views:
Transcription

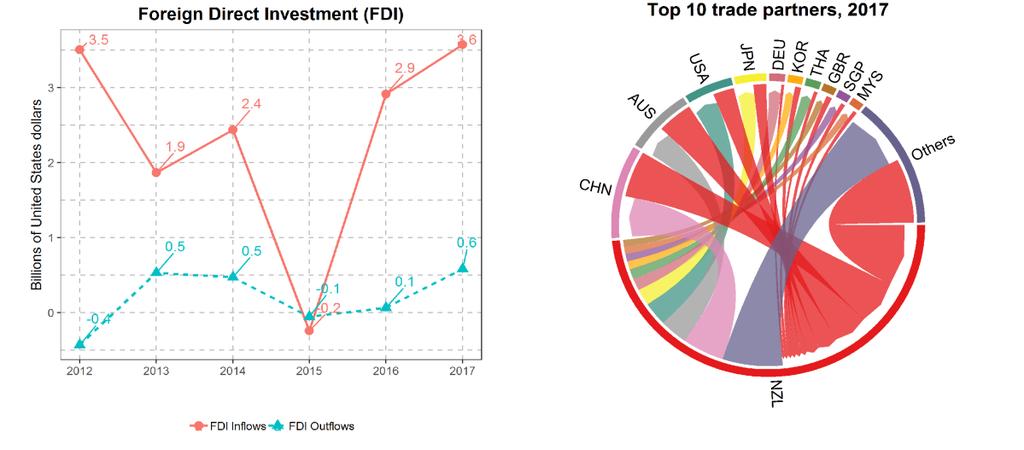
1 i Asia-Pacific Trade Briefs: New Zealand Merchandise Trade New Zealand has a trade-to-gdp ratio of 51.96%. Merchandise trade accounted for 73.1% of New Zealand's total trade in New Zealand's merchandise exports grew by 0.4% on average during , higher than the Asia-Pacific average of 0% during the same time period. In 2017, New Zealand's merchandise exports grew by 12.8%, while in the Asia-Pacific region they increased by 11.5% in the same year. Meanwhile, New Zealand's merchandise imports increased by 1% on average during , and recorded an increase of 11.2% between 2016 and Services Trade In 2017, New Zealand's commercial services' shares of total exports and imports were 29.6% and 24.2%, respectively. Commercial services exports grew by 4.7% on average during , higher than the Asia- Pacific average of 3.2% during the same time period. In 2017, New Zealand' commercial services exports grew by 8.2%, while in Asia-Pacific region they increased by 7.9%. Meanwhile, New Zealand's commercial services imports increased by 0.8% on average during the period, recording a growth rate of 8.4% from 2016 to Foreign Direct Investment (FDI) New Zealand recorded an average annual FDI inflows growth of 0.4% from 2012 to 2017, smaller than the Asia and the Pacific's 2.9% average annual FDI inflow growth. At the same time, New Zealand experienced an increase in FDI inflows by 22.7% in In terms of FDI outflows, New Zealand had an average annual FDI
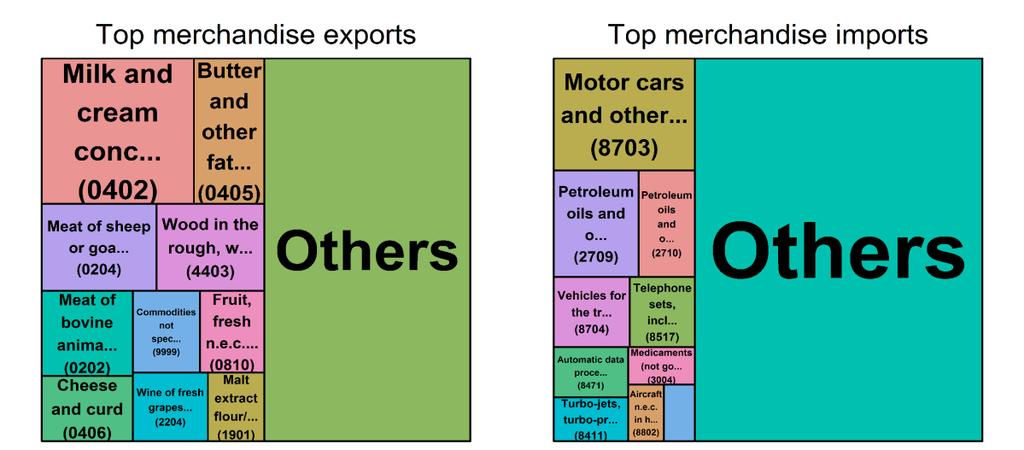
2 outflows decline of 46.8% in the last five years, smaller than the Asia and the Pacific's 3.5% average annual FDI outflow growth. In 2017, New Zealand experienced an increase in FDI outflows by 835.1%. Top Trade Partners In 2017, the largest trade partner of New Zealand was China, representing 22.7% of its exports and 18.8% of its imports. 16.9% of New Zealand's exports and 12.3% of New Zealand's imports by value were traded with Australia, its second largest trade partner. Other significant trade partners were United States, Japan, Germany, Republic of Korea, Thailand, United Kingdom, Singapore, and Malaysia. Top Traded Products The largest product category exported by New Zealand in 2017 was "Milk and cream; concentrated or containing added sugar or other sweetening matter" (0402), with an export share of 13.5% of total exports, followed by the second most exported product category, "Butter and other fats and oils derived from milk; dairy spreads" (0405), which accounted for 6.2% of New Zealand's total exports. In terms of imports, "Motor cars and other motor vehicles; principally designed for the transport of persons (other than those of heading no. 8702), including station wagons and racing cars" (8703) represented 9.6% of total imports, standing out the top imported product category. Meanwhile, "Petroleum oils and oils obtained from bituminous minerals; crude" (2709) had a share of 6.2%, the second largest imported product category in New Zealand in Tariffs In 2017, average MFN applied and effectively applied tariffs in New Zealand were 2% and 2.95%, respectively - lower than the averages for the Asia-Pacific economies of 7.46% and 6.91%, respectively. Average MFN bound tariff rate of 8.94% was lower than the Asia-Pacific average of 26.35%. New Zealand is a founding member of the WTO. Currently, 100% of New Zealand's tariff lines are bound. Trade Costs New Zealand's average trade costs with major trading economies in the region, are presented in the graph below. Trade costs in New Zealand remained higher compared with the most efficient traders in Asia and the Pacific.
3
4 Trade Agreements New Zealand has 11 trade agreements in force, 3 signed agreements pending ratification, and 4 trade agreements under negotiation. Of the economy's total exports, 58.6% are directed to its trade agreement partners, while 51.8% of its total imports come from trade agreement partners. Title Status Year in force South Pacific Regional Trade and Economic Cooperation Agreement (SPARTECA) Share of total exports Share of total imports in force Australia-New Zealand in force New Zealand-Singapore in force New Zealand-Thailand in force Trans-Pacific Strategic Economic Partnership Agreement (Trans-Pacific SEPA) in force China-New Zealand in force ASEAN-Australia-New Zealand in force Malaysia-New Zealand in force Hong Kong,China-New Zealand in force New Zealand-Taiwan Province of China in force Republic of Korea-New Zealand in force New Zealand-Gulf Cooperation Council (GCC) signed NA Pacific Agreement on Closer Economic Relations (PACER) Plus Comprehensive and Progressive Agreement for Trans-Pacific Partnership (CPTPP) signed NA signed NA India-New Zealand under neg. NA
5 Title Status Year in force Share of total exports Share of total imports New Zealand-European Union (EU) under neg. NA Regional Comprehensive Economic Partnership (RCEP) under neg. NA Russia-New Zealand under neg. NA Sources: Total commercial services and merchandise trade data were accessed from the WTO statistics website. Bilateral trade data accessed through IMF Direction of Trade Statistics. Product-level data accessed through UN Comtrade database. Tariff data were accessed through the World Bank s WITS and WTO tariff databases. FDI data were accessed through UNCTAD statists portal. Trade-to-GDP ratio was calculated by summing commercial and merchandise exports and imports and dividing the sum by the latest GDP (current United States dollars), retrieved from the World Bank World Development indicators database. Trade costs data were based on the ESCAP-World Bank trade cost database. Note: Data are based on economies for which data available only. For regional aggregates, latest data was used in lieu of latest missing values. Merchandise trade data follow the latest HS classification. Products are defined at the 4-digit level. Tariffs are simple average. Trade costs shown are tariff equivalents, calculated as trade-weighted average trade costs of economies with found developing economies in the region (China, India, Indonesia and Russian Federation), where data was available. Trade costs for East Asia-3 comprises China, Japan and the Republic of Korea; trade costs for European Union- 3 comprises Germany, France and the United Kingdom. Definitions: MFN bound tariff is the maximum most-favoured nation (MFN) tariff permitted under WTO obligations. MFN applied tariff is the tariff applied to imports among WTO members. The effectively applied rate is the ratio of collected import tariff revenue and value of imports. Binding coverage refers to the share of bound tariff lines in the total number of tariff lines. For more details contact escap-tiid@un.org.
Asia-Pacific Economic Integration & Cooperation: Is Russia Ready to Join? Masahiro Kawai Dean and CEO Asian Development Bank Institute
 Asia-Pacific Economic Integration & Cooperation: Is Russia Ready to Join? Masahiro Kawai Dean and CEO Asian Development Bank Institute Symposium on Japanese and Russian Perspectives on World Economy, Politics
Australia. A: Definitions and sources of data
 Australia A: Definitions and sources of data Data on foreign direct investment (FDI) in Australia are reported by the Australian Bureau of Statistics (ABS). The definition of FDI is essentially in line
APEC. in Charts 2016 POLICY SUPPORT UNIT
 APEC in Charts 2016 POLICY SUPPORT UNIT Asia-Pacific Economic Cooperation (APEC) was established in 1989. The 21 Member Economies are Australia; Brunei Darussalam; Canada; Chile; China; Hong Kong, China;
APEC. in Charts Policy Support Unit
 APEC in Charts 2017 Policy Support Unit Asia-Pacific Economic Cooperation (APEC) was established in 1989. The 21 Member Economies are Australia; Brunei Darussalam; Canada; Chile; China; Hong Kong, China;
APEC. in Charts Policy Support Unit
 APEC in Charts 2018 Policy Support Unit Asia-Pacific Economic Cooperation (APEC) was established in 1989. The 21 Member Economies are Australia; Brunei Darussalam; Canada; Chile; China; Hong Kong, China;
Import Summery Report United Arab Emirates
 Import Summery Report United Arab Emirates Contents 1. 2. 3. 3.1 3.2 3.3 3. 3.5. 5. 5.1 5.2 Disclaimer Overview of UAE Imports Non-Oil Imports Overview of UAE Import Sectors Food Products Building Materials
1.0 Introduction Zambia s Major Trading Partners Zambia s Major Export Markets... 4
 Bank of Zambia CONTENTS 1.0 Introduction... 3 2.0 Zambia s Major Trading Partners... 3 3.0 Zambia s Major Export Markets... 4 4.0 Major Source Countries Of Zambia s Imports... 5 5.0 Direction Of Trade
1.0 Introduction Zambia s Major Trading Partners Zambia s Major Export Markets... 4
 Bank of Zambia CONTENTS 1.0 Introduction... 3 2.0 Zambia s Major Trading Partners... 3 3.0 Zambia s Major Export Markets... 4 4.0 Major Source Countries Of Zambia s Imports... 5 5.0 Direction Of Trade
FINLAND. Table 1. FDI flows in the host economy, by geographical origin. (Millions of US dollars)
") Table 1. FDI flows in the host economy, by geographical origin World 3 732 8 046 3 319 2 823 4 750 7 652 12 451-1 144 718 7 359 2 550 4 158 Developed economies 3 638 8 003 2 382 2 863 4 934 7 258 12 450-855
Table 1. FDI flows in the host economy, by geographical origin World 3 732 8 046 3 319 2 823 4 750 7 652 12 451-1 144 718 7 359 2 550 4 158 Developed economies 3 638 8 003 2 382 2 863 4 934 7 258 12 450-855
Benchmarking Travel & Tourism in Russia
 Benchmarking Travel & Tourism in Russia How does Travel & Tourism compare to other sectors? Sponsored by: Summary of Findings, November 2013 Outline Introduction... 3 Russia summary..... 8 Data sources
III. TRADE IN COMMERCIAL SERVICES BY CATEGORY
 .. TRADE IN COMMERCIAL SERVICES BY CATEGORY Transportation services China records impressive growth Exports of world transportation services reached $750 billion in 2007, an increase of 19 per cent, following
III. TRADE IN COMMERCIAL SERVICES BY CATEGORY
 .. TRADE IN COMMERCIAL SERVICES BY CATEGORY Transportation services China records impressive growth of world transportation services reached $750 billion in 2007, an increase of 19 per cent, following
Benchmarking Travel & Tourism in United Arab Emirates
 Benchmarking Travel & Tourism in United Arab Emirates How does Travel & Tourism compare to other sectors? Summary of Findings, November 2013 Sponsored by: Outline Introduction... 3 UAE summary...... 8
1.0 Introduction Zambia s Major Trading Partners Zambia s Major Export Markets... 4
 Bank of Zambia CONTENTS 1.0 Introduction... 3 2.0 Zambia s Major Trading Partners... 3 3.0 Zambia s Major Export Markets... 4 4.0 Major Source Countries Of Zambia s Imports... 5 5.0 Direction Of Trade
Outlook for air travel markets
 Outlook for air travel markets June 2016 Brian Pearce Chief Economist International Air Transport Association Extended period of strong air travel market growth 30% 25% 20% 15% 10% 5% 0% -5% -10% -15%
Benchmarking Travel & Tourism in Colombia
 Benchmarking Travel & Tourism in Colombia How does Travel & Tourism compare to other sectors? Summary of Findings, November 2013 Sponsored by: Outline Introduction... 3 Colombia summary..... 8 Data sources
United Kingdom. How does Travel & Tourism compare to other sectors? GDP. Size. Share. UK GDP Impact by Industry. UK GDP Impact by Industry
 United Kingdom Stonehenge in Wiltshire Agriculture Automotive Banking Chemicals Communications Education Financial Mining Other Service Manufacturing Manufacturing Services Exports Retail (without wholesale)
Mexico. How does Travel & Tourism compare to other sectors? GDP. Size. Share. Mexico GDP Impact by Industry. Mexico GDP Impact by Industry
 Mexico Chapultepec Castle in Mexico City Agriculture Automotive Manufacturing Banking Chemicals Manufacturing Communications Education Financial Services Mining Other Service Exports Retail (without wholesale)
THE CHALLENGES AND OPPORTUNITIES OF ASIA-PACIFIC TRADE
 THE CHALLENGES AND OPPORTUNITIES OF ASIA-PACIFIC TRADE 1 14 22 PERCENT INCREASE VALUE OF AUSTRALIAN EXPORTS TO KEY MARKETS 2017 WAS A BANNER YEAR FOR TRADE GROWTH IN THE ASIA-PACIFIC (APAC) REGION In fact,
Textile Per Capita Consumption
 January 2018 Textile Per Capita Consumption 2005-2022 Part 2: Upper middle income countries - - CHF500.- Table of Contents Preface... 4 Sources... 5 Definitions... 6 Charts... 7 Executive Summary... 10
Global economy and aviation do we have room to grow?
 Global economy and aviation do we have room to grow? 18 January 2017 Brian Pearce Chief Economist, IATA Airline Industry Economics Advisory Workshop 2016 1 Room to grow? Looking through the cycle Potential
SLOVAKIA. Table 1. FDI flows in the host economy, by geographical origin. (Millions of US dollars)
") Table 1. FDI flows in the host economy, by geographical origin World 1 271 4 095 1 060 1 058 714 4 693 3 267 4 692-6 1 769 3 491 2 825 Developed economies 1 204 4 050 1 036 1 113 485 4 265 1 001 5 084-881
Table 1. FDI flows in the host economy, by geographical origin World 1 271 4 095 1 060 1 058 714 4 693 3 267 4 692-6 1 769 3 491 2 825 Developed economies 1 204 4 050 1 036 1 113 485 4 265 1 001 5 084-881
Benchmarking Travel & Tourism in Australia
 Benchmarking Travel & Tourism in Australia How does Travel & Tourism compare to other sectors? Sponsored by: Summary of Findings, November 2013 Outline Introduction... 3 Australia summary..... 8 Data sources
about Australia fast facts about trade Australia s trade in 2007 Exports in 2007 Imports in 2007 Creative Australian exporters some examples
 about Australia fast facts about trade Australia s trade in 2007 Australia s trade in goods and services totalled $454.3 billion. Australia s trade accounted for about 1 per cent of world trade. Our largest
AFTA Travel Trends. April 2018
 AFTA Travel Trends April 2018 AFTA Travel Trends Report 2018 Inbound and Outbound overview Introduction This snapshot provides an overview of the balance of trade between Inbound and Outbound Travel for
Contribution from UNCTAD dated: 4 June 2012
 Report of the UN Secretary-General: Necessity of ending the economic, commercial and financial embargo imposed by the United States of America against Cuba (A/67/118) Contribution from UNCTAD dated: 4
Pacific High-level Policy Dialogue on The Role of Macroeconomic Policy and Energy Security in supporting Sustainable Development in the Pacific
 Pacific High-level Policy Dialogue on The Role of Macroeconomic Policy and Energy Security in supporting Sustainable Development in the Pacific 8-9 October 2012, Nadi, Fiji Jointly organized by UN ESCAP
MARKET REPORT. Wuhan, China Upper-Tier Hotel Market
 MARKET REPORT Wuhan, China Upper-Tier Hotel Market APRIL 2018 WUHAN Upper -Tier Hotel Market Market Report - April 2018 Wuhan Introduction Wuhan Overview Wuhan is the provincial capital of Hubei province,
Airline financial performance and longterm developments in air travel markets
 Airline financial performance and longterm developments in air travel markets March 2018 Brian Pearce, Chief Economist, IATA www.iata.org/economics % of invested capital Investor returns falling but above
SOUTHERN AFRICA TRAVEL AND TOURISM BAROMETER REPORT 2015
 SOUTHERN AFRICA TRAVEL AND TOURISM BAROMETER REPORT 2015 1 Contents 1. TOURISM TRENDS: GLOBAL AND SOUTHERN AFRICA S MARKET SHARE IN AFRICA... 4 1.1. TOURIST ARRIVALS... 4 1.1.1. Global Tourist Arrivals
Evaluating the Importance of. Australia Indonesia Economic Relations
 Evaluating the Importance of Australia Indonesia Economic Relations BUDY P. RESOSUDARMO (IP ANU) KIKI VERICO (LPEM FEB UI) DONNY PASARIBU (LPEM FEB UI) Preview of the paper and its substance Contents
THE GROWTH OF THE HOSPITALITY INDUSTRY IN DUBAI
 THE GROWTH OF THE HOSPITALITY INDUSTRY IN DUBAI THE DEFINITION OF TOURISM Tourism is travel for recreational, leisure or business purposes. The World Tourism Organization defines tourists as people "traveling
International Tourism Snapshot
 International visitors to Australia Total holiday 4,447,000 5.0% 18.9-0.7% NZ 490,000-1.4% 7.5-9.4% Asia 2,292,000 8.6% 15.5-5.3% North America 496,000 4.6% 15.2-7.1% Europe 554,000 0.2% 38.5 8.3% UK 400,000
International Tourism Snapshot
 International visitors to Australia International visits continue to grow Australia hosted a record number of international visitors in the year ending International visitor expenditure in Australia September
CHILE: A RELIABLE PARTNER FOR ASIA
 CHILE: A RELIABLE PARTNER FOR ASIA I ASIA COPPER WEEK CONFERENCE November 2012 Shanghai, China HERNÁN DE SOLMINIHAC Minister of Mining Santiago de Chile Source:SERNATUR CHILE A reliable partner for Asia
Sprint Real Solutions VPN SDS International Rates from the U.S. Mainland, Hawaii, Puerto Rico, and the U.S. Virgin Islands 1*
 1* The international rates below apply to calls from the U.S. Mainland, Hawaii, Puerto Rico, and the U.S. Virgin Islands where available. The rates, which are shown below in full minute increments, are
The Potential of the Pacific Alliance in Asia-Pacific Integration
 The Potential of the Pacific Alliance in Asia-Pacific Integration Conference on The Pacific Alliance and the Multilatinas: Strategies to Approach the Asia-Pacific EAFIT Medellin Eduardo Pedrosa Secretary
Presentation Supplemental Charts: Relative Comparison of APEC Economies
 Presentation Supplemental Charts: 1 BORDER MARKET Enabling Trade Index Framework The World Economic Forum has published The Global Enabling Trade Report, containing the Enabling Trade Index (ETI), on an
ENHANCEMENT OF INTEGRATION OF REGIONAL VALUE CHAINS IN ASIA AND LATIN AMERICA AND THE CARIBBEAN (LAC)
") ENHANCEMENT OF INTEGRATION OF REGIONAL VALUE CHAINS IN ASIA AND LATIN AMERICA AND THE CARIBBEAN (LAC) José Durán Lima, Economic Affairs Officer Division of International Trade and Integration/ ECLAC, United
ENHANCEMENT OF INTEGRATION OF REGIONAL VALUE CHAINS IN ASIA AND LATIN AMERICA AND THE CARIBBEAN (LAC) José Durán Lima, Economic Affairs Officer Division of International Trade and Integration/ ECLAC, United
Aviation Performance in NSW
 Aviation Performance in NSW 2017-18 This report by Tourism Futures International for Destination New South Wales reviews the operating environment and aviation performance of Sydney and NSW over 2017 and
Intra-African Air Services Liberalization
 Intra-African Air Services Liberalization James Wiltshire Senior Economist, www.iata.org/economics To represent, lead and serve the airline industry Aviation connects African businesses to world markets
APEC CHILE 2019: CONNECTING PEOPLE, BUILDING THE FUTURE
 APEC CHILE 2019: CONNECTING PEOPLE, BUILDING THE FUTURE RODRIGO YÁÑEZ Vice MinisterofTradeofChile SOM ChairAPEC Chile 2019 Santiago, August 2018 CHILE S TRADE POLICY: OBJECTIVES To achieve international
Sprint Real Solutions Switched Data Service International Rates from the U.S. Mainland, Hawaii, Puerto Rico, and the U.S.
 1* The international rates below apply to calls from the U.S. Mainland, Hawaii, Puerto Rico, and the U.S. Virgin Islands. The usage rates below reflex the discount found in Section 6.4 of Schedule No.
Who we spoke to. Long haul travellers across 15 of Australia s key tourism markets
 Who we spoke to Long haul travellers across 15 of Australia s key tourism markets Importance factors for destination choice Read as: 16% of respondents rate exciting events, local festivals and celebrations
GBTA BTI Outlook and Economic Forecast for Business Travel in Asia Pacific, Thailand and around the World
 GBTA BTI Outlook and Economic Forecast for Business Travel in Asia Pacific, Thailand and around the World Research Sponsored by: Welf J Ebeling Vice President, Operations - Asia Pacific Global Business
Fostering Sustainable, Innovative and Inclusive Growth
 216/ISOM/SYM/9 Session II Fostering Sustainable, Innovative and Inclusive Growth Submitted by: Policy Support Unit, APEC Secretariat Symposium on Priorities for APEC 217 Ha Noi, Viet Nam 8 December 216
Cost of Food at Home for a week in Alaska - March 2000
 Cost of Food at Home for a week in Alaska - March 2000 Kenai Soldotna Mat-Su Bor. Portland Oregon Family of 2 (20-50 years) 58.53 95.24 87.67 103.2 57.74 62.12 65.53 60.73 78.78 65.76 92.92 70.29 85.24
AFTA Travel Trends. May 2018
 AFTA Travel Trends May AFTA Travel Trends Report Inbound and Outbound overview Introduction This snapshot provides an overview of the balance of trade between Inbound and Outbound Travel for Year end of
Millions of BZ Dollars M
 External Trade Bulletin ETB MARCH 2017 IMPORTS DOWN 2.2%, DOMESTIC EXPORTS UP 35.5% IN MARCH IMPORTS MARCH 2017: In March 2017, Belize imported goods valuing $155 million; this represented a 2.2 percent
Example report: numbers are for illustration purposes only
 www.iata.org/pax-forecast Example report: numbers are for illustration purposes only Country Report - United States Page Table of Contents 1 Market Overview 2 Top Country Pairs 3 Annual Market Regional
The Nordic Countries in an International Comparison. Helga Kristjánsdóttir 20. apríl 2012
 The Nordic Countries in an International Comparison Helga Kristjánsdóttir 20. apríl 2012 15 Figure 1. World Bank, GDP growth (annual %) 10 5 0 1961 1963 1965 1967 1969 1971 1973 1975 1977 1979 1981 1983
Market & Country brief on Australia
 SRI LANKA EXPORT DEVELOPMENT BOARD Market & Country brief on Australia 1. Background Contents PREPARED BY MARKET DEVELOPMENT DIVISION-EDB May 2018 Contents 1. Trade between Sri Lanka & Australia 2. Bilateral
Trade Creation in the APEC Region: Measurement of the Magnitude of and Changes in Intra-regional Trade since APEC s Inception
 Trade Creation in the APEC Region: Measurement of the Magnitude of and Changes in Intra-regional Trade since APEC s Inception APEC Policy Support Unit Hyun-Hoon Lee, Senior Analyst, PSU Jung Hur, Department
23rd SEOUL BUILD. Organized by Co-Organized by Supported by. Overseas Cooperation. Exhibit Profile. Highlight Sector. Constek Remodeling Greenbuilding
 23rd SEOUL BUILD Organized by Co-Organized by Supported by Overseas Cooperation Exhibit Profile Highlight Sector Constek Remodeling Greenbuilding / / / / / / / / 2015 Your Next Destination, KOREA! South
Colombia: An Upcoming Emerging Market for International Investors April 2012
 Colombia: An Upcoming Emerging Market for International Investors April 2012 Proexport is the organization within the Colombian Government responsible for the promotion of International Tourism, Foreign
Peru Economic and Trade Relations with the European Union. Jose Luis Silva Martinot Minister of Foreign Trade and Tourism June, 2012
 Peru Economic and Trade Relations with the European Union Jose Luis Silva Martinot Minister of Foreign Trade and Tourism June, 2012 Peruvian Integration to the global economy through Free Trade Agreements
U.S. Travel and Tourism Report
 2014/TWG44/010 Agenda Item: 18 U.S. Travel and Tourism Report Purpose: Information Submitted by: United States 44 th Tourism Working Group Meeting Cusco, Peru 9-10 April 2014 U.S. Travel and Tourism Report
Africa at a glance. Annual real GDP growth ( average): 4.97% Official development assistance (2010): $48 billion
: 4.97% Official development assistance (2010): $48 billion") Africa at a glance Population (212): 1,38 million Annual real GDP growth (25-212 average): 4.97% Official development assistance (21): $48 billion Net foreign direct investment (211): $43 billion Sources:
Africa at a glance Population (212): 1,38 million Annual real GDP growth (25-212 average): 4.97% Official development assistance (21): $48 billion Net foreign direct investment (211): $43 billion Sources:
EUROMONITOR INTERNATIONAL
 1 EUROMONITOR INTERNATIONAL YOUR GATEWAY TO GLOBAL STRATEGIC INTELLIGENCE JULY 2013 2 Euromonitor International Making sense of global markets Product and Services General introduction Passport Capabilities
MONTHLY NATURAL GAS SURVEY. November 2009
 MONTHLY NATURAL GAS SURVEY November 2009 INTERNATIONAL ENERGY AGENCY INTERNATIONAL ENERGY AGENCY Next Release: 12 March 2010 MONTHLY NATURAL GAS SURVEY - 1 CONTENTS TABLE 1 Natural Gas Balances in OECD
TPP ADVANTAGES INDUSTRIAL ESTATE SOLUTION. By Nguyen Chi TOAN Marketing Manager of VSIP JV 27 November 2015
 TPP ADVANTAGES INDUSTRIAL ESTATE SOLUTION By Nguyen Chi TOAN Marketing Manager of VSIP JV 27 November 2015 VIETNAM ECONOMY VIETNAM ECONOMIC STRUCTURE MOVEMENT 1995 2015 Service 44% Agriculture, Fisheries,
BTMU Focus Latin America Argentina: Export Profile
 BTMU Focus Latin America Argentina: Export Profile MUFG UNION BANK Economic Research (New York) Hongrui Zhang Latin America Economist hozhang@us.mufg.jp +1(212)782-5708 Updated November 25, 2015 Argentine
Gross Domestic Product Growth
 Gross Domestic Product Growth GDP Growth Rate 2 5 Latin America Developing Asia China Developed Aisa Western Europe 5-5 Data Source: WB, ADB, IMF, and Bloomberg 8 85 9 95 3 GDP Growth in Latin America
Top 10 Outbound Tourism Markets, Trips and Spending per Country To 2018
 Top 10 Outbound Tourism Markets, Trips and Spending per Country To 2018 Report Code: TT0251MR Publication Date: February 2015 www.tourism-ic.com John Carpenter House 7 Carmelite Street London EC4Y 0BS
IATA ECONOMIC BRIEFING MARCH 2011
 IATA ECONOMIC BRIEFING MARCH 2011 WHAT DRIVES THE SIZE OF PREMIUM AIR TRAVEL MARKETS? WHY PREMIUM AIR TRAVEL IS AN IMPORTANT TRAVEL MARKET SEGMENT The premium (first and business class) travel segment
Contribution from UNCTAD dated: 21 May 2013
 Report of the UN Secretary-General: Necessity of ending the economic, commercial and financial embargo imposed by the United States of America against Cuba (A/68/116) Contribution from UNCTAD dated: 21
JUNE 2017 AUCKLAND ECONOMIC INSIGHTS SERIES ENGAGING GLOBALLY AUCKLAND S TRADING LINKAGES. aucklandnz.com/business nzier.org.nz
 AUCKLAND ECONOMIC INSIGHTS SERIES ENGAGING GLOBALLY AUCKLAND S TRADING LINKAGES aucklandnz.com/business nzier.org.nz JUNE 2017 4 AUCKLAND ECONOMIC INSIGHTS SERIES 1 2 3 4 Advanced Industries Auckland s
IMD World Talent Report Factor 1 : Investment and Development
 THAILAND 2012 2013 2014 2015 2016 Overall Investment & Development Appeal Rank 2016 37 42 24 Readiness 49 of 61 Factor 1 : Investment and Development Total Public Expenditure on Education Percentage of
International Tourism Snapshot
 Australia on a high International visitors to Australia Australia welcomed 7.8m international visitors in the year ending June International visitor expenditure in Australia 2017, more than any previous
CONTENTS Executive Summary... iii 1. Introduction Major Destinations for Zambia s Exports Major Source Countries for Zambia s
 Bank of Zambia CONTENTS Executive Summary... iii 1. Introduction... 1 2. Major Destinations for Zambia s Exports... 1 3. Major Source Countries for Zambia s Imports... 4 4. Conclusion... 6 ii Executive
Expenditure Share of Visitors Visitor Expenditure expenditure nights per visitor
 Table 23 Modelled domestic overnight visitor expenditure (a) in the top 20 regions ranked by expenditure, including airfares and long distance transport costs Year ended 31 March 2010 (a) (b) Expenditure
Sprint Real Solutions Switched Data Service International Rates from the U.S. Mainland, Hawaii, Puerto Rico, and the U.S.
 1* The international rates below apply to calls from the U.S. Mainland, Hawaii, Puerto Rico, and the U.S. Virgin Islands. The usage rates below reflex the discount found in Section 6.4 of Schedule No.
Singapore: Hotel Market. Market Report - March 2019 MARKET REPORT. Melbourne, Australia
 Singapore: Hotel Market Market Report March 2019 MARKET REPORT Melbourne, Australia APRIL 2019 Melbourne, Australia Market Report April 2019 Flinders Street Station, Melbourne Melbourne Hotel Outlook Melbourne
Market Brief on Hong Kong February 2017
 Market Brief on Hong February 2017 Total Population 7,346,248 Area 1,100 km² Time Zone HKT UTC +8 Capital City Victoria City As one of the world's leading international financial centers, Hong 's service-oriented
The role of Hungary in international tourism
 The role of Hungary in international tourism CHANGES IN WORLD TOURISM BETWEEN 1990 AND 2002 International tourist arrivals According to the World Tourism Organisation (WTO), between 1990 and 2002 the number
KINGDOM OF CAMBODIA NATION RELIGION KING 3
 KINGDOM OF CAMBODIA NATION RELIGION KING 3 TOURISM STATISTICS REPORT March 2014 MINISTRY OF TOURISM Statistics and Tourism Information Department No. A3, Street 169, Sangkat Veal Vong, Khan 7 Makara, Phnom
HONG KONG (Special Administrative Region)
") HONG KONG (Special Administrative Region) Attachments: A short note on External Trade Year 2010 Imports of Hong Kong from the World Imports of Hong Kong from Italy by product groups Exports (re-exports
HONG KONG (Special Administrative Region) Attachments: A short note on External Trade Year 2010 Imports of Hong Kong from the World Imports of Hong Kong from Italy by product groups Exports (re-exports
KINGDOM OF CAMBODIA NATION RELIGION KING 3
 KINGDOM OF CAMBODIA NATION RELIGION KING 3 TOURISM STATISTICS REPORT June 2014 MINISTRY OF TOURISM Statistics and Tourism Information Department No. A3, Street 169, Sangkat Veal Vong, Khan 7 Makara, Phnom
AFTA Travel Trends. February 2018
 AFTA Travel Trends February 2018 AFTA Travel Trends Report 2018 Inbound and Outbound overview Introduction This snapshot provides an overview of the balance of trade between Inbound and Outbound Travel
Introduction to IATA
 Introduction to IATA Founded in 1945 Travel Agency Community of 90,000 offices Plays a vital and central in airline product distribution IATA Mission: to represent, lead and serve the airline industry
Global robot installations: high double digit growth rates
 ' of units Global robot installations: high double digit growth rates 5 45 4 35 3 25 2 15 1 5 113 6 Estimated annual worldwide supply of industrial robots 28-216 and 217-22* +15% on average per year 121
AOC 2017AOC 2017AOC. Robert Johansson Chief Economist US Department of Agriculture Beijing, China (April 2017)
") http://wcfcourier.com/article_db152199-d2de-5455-ac-b643ba6a1c8f.html U.S. AGRICULTURAL OUTLOOK 17 AND LONGER-TERM PROJECTIONS AOC 17AOC 17AOC AOC 17AOC 17AOC Robert Johansson AOC 17AOC 17AOC Chief Economist
http://wcfcourier.com/article_db152199-d2de-5455-ac-b643ba6a1c8f.html U.S. AGRICULTURAL OUTLOOK 17 AND LONGER-TERM PROJECTIONS AOC 17AOC 17AOC AOC 17AOC 17AOC Robert Johansson AOC 17AOC 17AOC Chief Economist
Obtaining and Applying Tourism Research to Your Business. March 2012 Presented by Amanda Coghlan Strategic Insights Analyst Destination NSW
 Obtaining and Applying Tourism Research to Your Business March 2012 Presented by Amanda Coghlan Strategic Insights Analyst Destination NSW Today s Presentation Destination NSW introduction Explaining data
Western Cape Destination Performance Report: April-June 2016
 Number of arrivals (millions) Western Cape Destination Performance Report: April-June 2016 Global Tourism Performance According to the United Nations World Tourism Organisation, international tourist arrivals
ROMANIA. Table 1. FDI flows in the host economy, by geographical origin. (Millions of US dollars)
") Table 1. FDI flows in the host economy, by geographical origin World.... 2 196 6 435 6 485 11 333 9 928 13 910 4 843 2 939 2 522 2 746 Developed economies.... 1 521 5 361 6 309 11 445 9 136 13 422 4 812
Table 1. FDI flows in the host economy, by geographical origin World.... 2 196 6 435 6 485 11 333 9 928 13 910 4 843 2 939 2 522 2 746 Developed economies.... 1 521 5 361 6 309 11 445 9 136 13 422 4 812
United Nations Conference on Trade And Development INVESTMENT COUNTRY PROFILES. FRANCE February 2012
 United Nations Conference on Trade And Development INVESTMENT COUNTRY PROFILES FRANCE February 2012 i NOTE The Division on Investment and Enterprise of UNCTAD is a global centre of excellence, dealing
Extra-Regional Relations. (Complementary Note)
") Economic and cooperation relations between Latin America and the Caribbean and the countries of the European Union: Status and prospects ahead of the II CELAC-EU Summit 2015 (Complementary Note) Extra-Regional
Economic and cooperation relations between Latin America and the Caribbean and the countries of the European Union: Status and prospects ahead of the II CELAC-EU Summit 2015 (Complementary Note) Extra-Regional
INTERNATIONAL TRAVEL AND TOURISM
 INTERNATIONAL TRAVEL AND TOURISM YEAR 2014 1. INTRODUCTION This issue of the Economic and Social Indicators presents data on International Travel and Tourism for the year 2014. A brief on the compilation
Chris Schmidt - istockphoto. Germany s Major Investment Partners USA
 Chris Schmidt - istockphoto Germany s Major Investment Partners USA I. The Big Picture II. Individual Analysis of Selected Countries North America (USA) III. Contacts www.gtai.com 2 I. The Big Picture
Tourism Snapshot A focus on the markets that the CTC and its partners are active in Ontario June 2011 Volume 7, Issue 6
 Tourism Snapshot Ontario A focus on the markets that the CTC and its partners are active in www.canada.travel/corporate June 2011 Volume 7, Issue 6 Key highlights In June 2011, overnight travel to Canada
Airline financial performance
 Airline financial performance 30 March 2017 Brian Pearce Chief Economist, IATA www.iata.org/economics Airline Industry Economics Advisory Workshop 2016 1 The air transport paradox Source: McKinsey presentation
Australian International Education Conference
 Down Under to Down Wonder Australia and the Global Economy in a post GFC world. www.aiec.idp.com 1 I travel so much around the world, I feel like an Airport Economist Sent airborne by Australia s first
Economic and Tourism Industry Outlook February 2018
 Economic and Tourism Industry Outlook 2018 7 February 2018 1 Key Issues in Thai Economy Growth Projections for Thai Economy in 2017 and 2018 %YoY 3.9 4.0 4.0 3.2 3.0 2.0 1.0 0.0 2016 2017F 2018F Source:
Obtaining and Applying Tourism Research to Your Business. March 2012 Presented by Amanda Coghlan Strategic Insights Analyst Destination NSW
 Obtaining and Applying Tourism Research to Your Business March 2012 Presented by Amanda Coghlan Strategic Insights Analyst Destination NSW Today s Presentation Destination NSW introduction Explaining data
THAILAND HOW DOES TRAVEL & TOURISM COMPARE TO OTHER SECTORS? BENCHMARK REPORT THAILAND 1 SPONSORS OF BENCHMARKING REPORT 2017
 THAILAND AGRICULTURE AUTOMOTIVE MANUFACTURING BANKING CHEMICALS MANUFACTURING COMMUNICATIONS CONSTRUCTION FINANCIAL SERVICES MINING OTHER SERVICE EXPORTS RETAIL (WITHOUT WHOLESALE) TOTAL ECONOMY TRAVEL
Congressional Briefing Southern California Air Cargo Traffic and its Impact on the Region s Economy
 Congressional Briefing Southern California Air Cargo Traffic and its Impact on the Region s Economy World Trade Week Briefing Series Los Angeles Chamber of Commerce Thursday, March 17, 2011 The Role of
KINGDOM OF CAMBODIA NATION RELIGION KING 3
 KINGDOM OF CAMBODIA NATION RELIGION KING 3 TOURISM STATISTICS REPORT September 2014 MINISTRY OF TOURISM Statistics and Tourism Information Department No. A3, Street 169, Sangkat Veal Vong, Khan 7 Makara,
EXPORT PERFORMANCE MONITOR
 India s Exports Recorded High Growth Provisional figures available for April, 2007 show that India s merchandise exports during April 2007 are valued at US $ 10575.11 million ($ 10.57 billion) which is
Sprint Real Solutions Switched Data Service International Rates from the U.S. Mainland, Hawaii, Puerto Rico, and the U.S.
 1* The international rates below apply to calls from the U.S. Mainland, Hawaii, Puerto Rico, and the U.S. Virgin Islands. The usage rates below reflex the discount found in Section 6.4 of Schedule No.
Maximizing Economic Benefits of Aviation in the Region
 Maximizing Economic Benefits of Aviation in the Region Boubacar Djibo Director, Air Transport Bureau, ICAO Georgetown, Guyana 21 November 2018 Preamble. THEREFORE, the undersigned governments having agreed